Abstract
A new model of adsorption isotherms Type IV and V is proposed as a basis for theoretical calculations and modelling of adsorption systems such as adsorption heat storage and heat pumps. As the current models have decent yet limited applicability, in this work, we present a new combined model with universal use for micro-mesoporous silica/water adsorption systems. Experimental measurement of adsorption isotherm of water onto seven different samples of micro and mesoporous silica and aluminium-silica were used to fit new adsorption models based on a combination of classical theories and a distribution function related to the pore-size distribution of the selected materials. The fitting was conducted through a repeated non-linear regression using Trust Region Reflective algorithm with weighting factors to compensate for the scalability of the adsorption amount at low relative pressure with optimization of the absolute average deviation fitting parameter. The results display a significant improvement for most of the samples and fitting indicators compared to more common models from the literature with average absolute deviation as low as AAD = −1 for material with maximum uptake of q = −1. The newly suggested model, which is based on a combination of BET theory and adjusted normal distribution function, proved to bring a higher degree of precision and universality for mesoporous silica materials with different levels of hydrophilicity.
1. Introduction
Heat driven thermodynamic cycle is as an alternative to the common mechanical vapour compression cycle, where an abundance of waste heat or low potential heat (low-temperature difference) is available. Adsorption cycles can work with minimum consumption of electricity provided sufficient heat source such as solar thermal [1] or co-generation [2,3,4] providing heat or cold from renewable sources or waste, based on the application. The adsorption phenomena works as a driving force for these systems, and adsorption isotherm models are an essential tool to describe and predict their behaviour. The adsorption models are readily used in simulations of adsorption heat storage (AHS) [5,6] and adsorption heat pump (AHP) [7,8,9,10,11] systems. The advantage of such an approach is a low necessary amount of the actual sample and faster evaluation of the key properties of the adsorption system.
Majority of the research of the adsorption heat-based technologies involves AHP thanks to their more efficient performance and significantly less mass of the deployed system as well as the lower amount for the expensive adsorption materials. However, both the AHP and the AHS systems can be modelled based on the isothermal data with good accuracy and analysis results of the key performance points. The most common models are then deployed based on the adsorption material characteristics and their practicality. Dubinin-Astakhov [8,9] and Tóth [5,11] adsorption models are usually used to describe materials with high adsorption potential such as silica gel, which generally shows high water affinity as Type I isotherm. Helaly et al. [5] used Tóth adsorption model for performance analysis of water adsorption on silica gel and zeolite 13X-based adsorption storage systems and achieved a good agreement with the actual experimental data. Likewise, Schmidt et al. [6] showed on the example of zeolite 13x/water adsorption pair that a proper system analysis of its performance can be obtained just from the adsorption model considering its physical validity. [11] used in their work uncommon Mahle’s isotherm model [12] to fit the data of a Type V isotherm. However, because the Mahle’s model does not properly consider the surface adsorption and focuses mainly on the capillary condensation part, it can be technically successfully deployable only on Type V isotherms. Hence, to jointly describe also the adsorption characteristics of silica gel, ferroaluminophosphates FAM Z01 and FAM Z02, and metal-organic frameworks MIL 101(Cr) and NH-MIL 125(Ti) they used Tóth isotherm [13] next to the Mahle’s model. For more complex isotherm showing Type IV isotherm some unorthodox high polynomial functions have been documented as well [10]. The problematic of current isotherm models used to describe the adsorption uptake in the adsorption cooling applications were also identified by Mohammed et al. [14] with the introduction of some corrections to the most common adsorption material, silica gel. That is, however, mostly for microporous materials or materials with high water affinity showing uncomplicated isotherms curves of Type I.
Accordingly, the mathematical models describing the water adsorption isotherms on mesoporous materials are a subject of many research publications [15,16,17,18,19]. However, on the contrary to the classical models which exhibit simple parabolic or hyperbolic curvature of the adsorption isotherms based on the pure surface adsorption, porous materials display frequently complex adsorption behaviour which can be described by those models only partially. That means that these can provide us only with a limited precision or can be applied only to a specific region of the isotherm [20]. The sigmoidal (or S-shaped) adsorption isotherm, typical for the mesoporous materials, is usually identified by the International Union of Pure and Applied Chemistry (UIPAC) as Type IV or Type V, plus subtypes (a) and (b), depending on the immediate surface characteristics [21]. The sigmoidal shape shown in Figure 1 is typically caused by secondary adsorbate–adsorbate interactions such as capillary condensation in mesopores. Different shapes of the individual types are then given by their specific adsorbent–adsorbate relation characteristics. Type IV corresponds to materials with a surface more susceptible or accessible to adsorption of a given adsorbate, while Type V describes adsorption processes burdened by certain constraints. Those constraints can be of chemical characteristics, such as lower affinity towards the selected adsorbate (e.g., silica without hydroxyl groups with water), or of physical characteristics in case of a small opening window to the pores of some zeolite materials [22,23,24,25] resulting in higher activation energy. The Type IV isotherm is further divided to Type IV(a) with an adsorption/desorption hysteresis, and Type IV(b) without hysteresis [21]. A particular case represents the stepwise Type VI isotherm typical for some layer-by-layer adsorption on highly uniform nonporous surfaces [16]. However, we can also observe similar behaviour at significantly higher relative pressures for water adsorption on some mesoporous materials with a particular pore size distribution like the TMPS-2.7A reported in our previous findings [26].
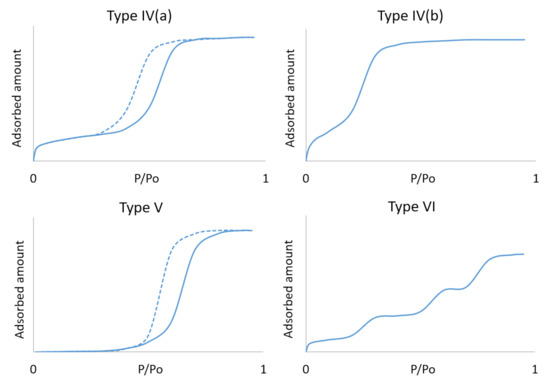
Figure 1.
UIPAC type adsorption isotherms, Types IV to VI.
While the simplest of this selection is possibly the Type V isotherm with only one rising edge in the small range of the relative pressure, the most complicated adsorption systems are described by Type VI. Although the adsorption systems of Type IV and Type V isotherms are well known and abundant, thanks to the nature of the adsorption process on mesoporous material, the theoretical models are still difficult to universally apply and new models are continuously developed. The modelling attempts of the isotherm adsorption curves on mesoporous materials based only on the simple empirical expressions and fundamental adsorption models such as Henry’s [27], Langmuir’s [28], Freundlich’s [29], Temkin’s [30], BET [31] and their algebraic combinations [15] usually fail due to the complicated shape of the actual isotherm or insufficient accuracy; or can be used only on selected examples of adsorbent–adsorbate pairs.
2. Sigmoidal Adsorption Isotherm Models
2.1. Classical Models: Development of Multilayer Adsorption Models
The BET isotherm (Brunauer, Emmett, Teller) was one of the first theories widely recognized for dealing with considerations of adsorbent–adsorbate and adsorbate-adsorbate interactions. Built on Langmuir’s model, the BET model adds a theory of the layered structure and interaction between the layers [31]. As a result that it follows in the low relative pressure of the Langmuir model, it also sets the maximum amount of the sorbate to cover the bare surface of the adsorbent completely. The BET isotherm is written in its simple form as:
where is the relative adsorption amount, is the adsorption amount at the equilibrium, is the adsorption capacity of the surface layer (maximum adsorption in case of Langmuir’s model) and C is the BET constant describing the adsorbent–adsorbate interaction intensity. Thanks to a good fit with the experimental data of nitrogen adsorption at cryogenic temperatures for the majority of the materials, it is often used as a primary method to assess the surface area in its linear region [21,32], providing the validity , . If the adsorption follows the BET model, the resulting isotherm takes a linear form of Equation (2), and the BET constant C and the volume of adsorbate necessary for covering the surface can be obtained. Consequently, knowing the coverage factor (volume per area) of the nitrogen for the given material, the surface area can be calculated.
Although the BET provides well-fit parameters in the lower relative pressure, the higher relative pressures are burdened by a significant error [33]. The cause for this may vary; however, one of the explanation can be the underestimating of the adsorption enthalpy for second and higher layers in correlation to the change of the relative pressure in the model. For this reasons the original BET model was modified originally by Anderson [34], and later derived again through different approach by Brunauer et al. [33], by adding another constant to the relative pressure; . This modification was also introduced and derived independently by de Boer [35] and Guggenheim [36], and therefore it became broadly known as the Gugenheim, Anderson, de Boer (GAB) isotherm [37,38]. By practically limiting the relative pressure factor reaching unity, , the model is prevented from reaching infinite adsorption at full saturation and an apparent equilibrium can be obtained, nevertheless, leaving the final adsorption infinite. However, even with this extension, the BET model can be used only to define Type II and Type III isotherms when the system is reaching full saturation. For more complex systems the modified BET adsorption model fitting follows only the first phases of the adsorption process.
The adsorption of multiple adsorbate molecules or atoms can also be simply described extending the previous formula for monolayer adsorption as introduced by Klotz et al. [39]:
Equation (3) implies that one adsorption site S can be a host for several adsorbate particles A until a saturation point or a maximum number of bonds is reached. The following equilibrium constants k are then naturally given as the ratio between the occupied and unoccupied sites together with free adsorbate particles:
where n is the number of bounds (layers) that can be associated with one specific adsorption site as . The adsorption fraction at any point is then given as:
Even though that Klotz et al. [39] used this model for ligands adsorption on proteins, this common approach was and is readily used by others for vapour adsorption as well. Hence, the adsorbate concentration in Equation (5) can be expressed as the relative pressure . In a system with multiple layers, Equation (5) can become unnecessarily complicated and an approximation is usually considered. In the case of multilayer/multi-bond adsorption, we can simplify Equation (5) by assuming that the higher layers’ sorbate–sorbate interaction is constant; e.g., water adsorption on non-polar materials such as microporous activated carbon; and reduce the model to:
where, following Equation (5), is the constant describing the adsorption on the surface and k is the contribution from subsequent adsorptions connected to the original primary adsorption site S. Finally, the n factor is the association number corresponding again to the multilayer/multi-bond structure. The theory behind the original BET model [31] is very similar; however, it considers the properties of the second and above layers the same as the liquid state of the adsorbate, which practically leaves . The derivation then naturally takes the path for the classical BET model which gives two results depending on considering the infinite number of layers (Equation (2)) or some limitations of the adsorption system; e.g., porous structure. In the latter case, the association number n is finite, or relatively small, and the BET equation will take a different form from the classical interpretation to accommodate for the space limitations:
where C is again the standard BET constant. The factor x in Equation (7) in the original derivation is the typical relative pressure . Many other isotherm models used a similar approach as well to the problematic of adsorption according to Equation (5) and reach the same or very similar conclusion after deriving the final formula. Similarly to GAB isotherm, an introduction of an additional constant was performed by several investigators to compensate for the surface-independent interactions giving:
This interpretation was also achieved by Buttersack [19] by deriving Klotz’s [39] (Equation (6)), assuming a reduced influence of the nucleation points of the adsorption allowing:
The from substituting Equation (8) into Equation (9) also has similar meaning with the previous expressions and in the case of vapour adsorption in a porous matrix corresponds to capillary condensation. That is, incidentally, also the case of identical expression of the -isotherm derived by Ward and Wu [40] in their attempt to develop a method for determining surface tension based on clustered adsorption. Buttersack [19] follows this approach as well; however, he suggests a semi-empirical linear extension to the Klotz model to better accommodate the condensation/sorption occurring at higher relative pressures.
where the C, n has the same meaning as in Equation (7) and x is substituted according to Equation (8), hence employing the apparent relative pressure, rather than the relative pressure itself. The newly introduced constant is obtained by non-linear regression of the experimental data. Naturally, this expression inevitably changes the original meaning of the constants from Equation (7), with the Equation (8) substitution, to a certain degree. Hence, even though, the results of the fitting show some enhancement of the statical criteria compared to the “plain” Klotz’s equation [19], the author himself encourages careful interpretation of the data together with high accuracy of the underlying data.
2.2. Cooperative Multi-Molecular Sorption and Rutherford’s Model
As a result that the standard models are somehow insufficient in the description of the S-shaped isotherms, attempts with the compliance of the general models are typically pursued on a case basis with appropriate adjustments to the adsorption theories. Based on the classical Langmuir concept, Malakhov and Volkov developed the Cooperative Multi-molecular Sorption (CMMS) model [41] mostly to describe the progress of the adsorption close to the Type V isotherm. In their work, they focus on adsorption of simple alcohols (MeOH, EtOH, iso-PrOH) on a microporous polymeric structure, which can be described as a network of diffusion channels or nano-voids with a diameter of roughly 1.4 nm [41]. According to the CMMS theory, the adsorption progress alongside adsorption channels, the polymer chains and the adsorbed molecules promote additional adsorption mainly in the adjacent empty and open sites, thus, cooperation. The following equation of the adsorption fraction then describes the process based on rate (filling) constants (), each corresponding to the effective adsorption on the unoccupied sites in the proximity of the primary sorption sites:
The Equation (11) is given for vapour adsorption and the adsorption is expressed as a fraction of the maximum adsorption and adsorption q at the given pressure P through the relative pressure at the equilibrium point. An important factor is the interaction parameter W employing the Ising model, which explains the cooperative effect of the occupied sites. The parameter W is given as:
where and are the filling constants for adjacent and adjacent-adjacent primary sites, respectively, in the direction of the adsorption chain. The adsorption rate from Equation (11) is then intended for the adsorption rate in the lateral direction (increasing number of layers). Furthermore, if we consider that the cooperative effect is zero or negligible (), the value of the interaction parameter becomes and Equation (11) is transformed into the extended BET isotherm as described by Anderson [34] and Brunauer et al. [33]. Then withal, if the lateral adsorption rate is , Equation (11) becomes the standard BET [31].
Rutherford [42] realized that the CMMS could be used on some other porous materials as well provided the similarity of the systems based on the strong sorbate–sorbate interactions and weak sorbent–sorbate affinity, also observed for Type V isotherms. Rutherford [42] used the CMMS on an example of adsorption pair of microporous carbon/water. In the following work, Rutherford [43] reasons that the adsorption of water onto microporous carbonous surfaces consists of two modes; one which considers water bonding to the functional groups, and the second when water adsorbs within the micropores. As a result that the original CMMS cannot comprehend such duality, Rutherford [43] proposed an extended form using two CMMS equations besides. The extended Rutherford’s adsorption model was then also successfully applied in other works using microporous carbon [44]. The combined form can be formally written as:
where q is the total adsorbed amount from both modes, and are the respective forms/contributions of the adsorption equations in the individual modes, and and are the adsorption capacities for respective modes. Upon considering the adequate values of the rate factors , the final form can be written:
The first part of Equation (14) represents the first mode; the interaction of the adsorbate with the functional groups on the surface, and the second part describes the adsorbate molecules adsorption in micropores; i.e., the second mode. The considerable simplification of the first mode is allowed by the fact that the adsorption to the functional groups is direct and occurs only in one layer. Therefore, the lateral adsorption is not considered and the adsorption rate . Furthermore, considering that the adsorption is dependent on the positions of the functional group and adsorption on the adjacent positions has the same probability, the and, thus, the and the CMMS takes formally the shape of the Langmuir isotherm (L index). The constant from Equation (14) is, therefore, the standard Langmuir affinity constant. For the second mode, the adsorbate–adsorbate interactions have to be considered again as well, giving , while the lateral adsorption is again not accounted for because the molecular simulations show that only one layer can be formed [45] in such confined space. That will leave the Ising contribution W intact and creates a composite adsorption model. Despite the fact that Rutherford’s modification includes both sorbent–sorbate and sorbate–sorbate bonds, the one-layer limitations are obvious.
2.3. Compound Model
Looking at the CMMS model evolution and its solution at specific cases of its rate constants, it is apparent that the sigmoidal shape is difficult to achieve with a single model approach with just the classical approach of equivalent adsorption sites in the Langmuir model. The multisite adsorption concept is also used in the work of Do and Do [46,47] as a part of their combined adsorption model. Do and Do [46] assumed a more complex system and attempted to address the adsorption process from its individual parts; direct surface adsorption, adsorption in micropore space and capillary condensation in mesopore space. The original formula provided in the work of Do and Do [46] takes a form:
where is the saturation concentration of the micropore, is the micropore equilibrium constant, is the functional group concentration and is the sorption equilibrium constant (chemisorption in the work of [46]). The first part of the equation describes microporous adsorption and the layer/cluster parameter was set to in the original work [46]. The meaning was to accommodate for forming of H2O pentamers inside the microporous space as the minimum stable amount of molecules inside the hydrophobic environment as previously investigated by Kaneko et al. [48]. In their later work [47], the parameter n becomes adjustable and can be changed according to the fitting requirements. The second part of Equation (15) is then the well-known BET type equation describing the surface adsorption. Do and Do have realized that the problematic of capillary condensation in the mesoporous space cannot be easily described by the standard adsorption models and they suggested an alternative approach based on Kelvin equation for evaporation and Cohan equation for condensation. The capillary condensation section in the isotherm model is typically indicated by invariable energy on water uptake given the adsorption energy being proportional to the effective pore radius. This proportionality is given due to the change in surface energy caused by the curvature of the free liquid surface influencing the vapour pressure over the liquid surface as described by the Kelvin equation.
where is the relative pressure, H is the curvature of the meniscus in the capillary, is the surface tension of the liquid nitrogen, the is the molar volume of liquid nitrogen. Therefore, the Kelvin equation can describe the dependency of critical pore radius (Kelvin radius) on the surface tension and contact angle based on its reciprocal relation to the meniscus curvature . As a result that at the time of the condensation occurring a certain amount of the vapour is already adsorbed on the adsorbent’s walls, the final pore/capillary radius is calculated as a sum of the layer thickness and the critical radius .
The layer thickness of already adsorbed vapour can be obtained by a statistical approach for adsorbates other than nitrogen. In the Do and Do work, the thickness is given for the activated carbon based on the standard adsorption model:
where is the molar volume of the adsorbate in liquid form (condensed), and is the surface area of the mesopore space, while is again the concentration of the functional group.
2.4. Henry–Sips Combination Model
Another obvious, yet not often used, approach to the modelling of complex adsorption systems is a combination of the fundamental models to create hybrid models. This way, the differentiated parts of the adsorption process on a given adsorption pair can be described reasonably and more clearly. A combined model of Henry and Sips isotherms was proposed by Kim et al. [24]. The empirical combination of the original equations of Henry and Sips with a proportionality factor is written in the following way:
The right part of Equation (19) describes formally Langmuir–Freundlich isotherm model used by Sips [49], and it can be found in literature in several modifications [50]. In the above equation, the is the adsorption amount at the equilibrium, is the maximum adsorption amount (saturation uptake) and the and are Henry’s and Sips’ constants, respectively. The exponential factor r is then from the Langmuir–Freundlich model a measure of heterogeneity of the surface. The parameter is dependent on the partial pressure through an exponential giving a final constant :
In this form, the beginning of the adsorption is governed by a site-controlled mechanism with limited adsorption at lower relative pressure. This combination was selected to describe two different processes of water adsorption on the example of ferroaluminophosphate zeolite AQSOA™ FAM-Z02. However, the fitting of this hybrid model is rather complicated and the absence of a strict boundary between the individual models makes the resulting model constants inconvenienced by superfluous errors.
2.5. Associated Energy Distribution Functions Model
An attempt to develop a universal isotherm model was further made by Ng et al. [18], building on a multi-site adsorption theory and site-dependent energy distribution functions. In this model, the heterogeneous surface is approximated according to the homotattic patch approximation (HPA). The HPA considers the heterogeneous surface as a formation of many homogenous patches, each patch described by its localised constants and connected by energy distribution function (EDF). The total adsorption uptake is then a sum of localised adsorptions as a function of energy written as
where and are then adsorbed molecules count and available adsorption sites number, respectively. Following the mathematical expansion of the sum of the local adsorption coverage based on their fractional availability, the sum of the energy distribution functions is proportional and equal to unity at the saturation point (endpoint of the adsorption):
where is the surface fractional availability (part of the surface) and is the overall adsorption area. In Equation (22) the total energy distribution function is formally a sum of respective energy functions corresponding to and defined by each localised adsorption site. Finally, the total adsorption uptake can be written as an integral of the total energy distribution over the whole system:
The adsorption model itself is then based on the Absolute Rate Theory [51], provided the localised adsorption uptake at any given time is equal to the difference in adsorption and desorption rate and , respectively:
Therefore, according to the Absolute Rate Constant, the rate constants can be written based on the Arrhenius law as [52]:
where P is the pressure, and are respective pre-exponential constants and and are the activation energies of adsorption and desorption, respectively. Naturally, at the equilibrium the uptake remains constant () and provided and we will get practically the Langmuir-type isotherm:
That means that only pairs site-particles are considered and the adsorption is finite. Furthermore, the model assumes that for accurate prediction of adsorption uptake is important the adsorption sites distribution over the surface of several heterogeneous patches. This approach is used frequently and the energy distribution approximations are used across the adsorption models [53]. Ng et al. [18] in their work suggest using symmetrical Gaussian function including fractional probability factor . Furthermore, because the probability factor denotes the share of the individual energy nodes on the whole system, the sum of all the factors has to be equal to unity . Finally, the total energy distribution as the sum of the adsorption sites is defined by the individual Gaussian energy distributions as follows:
where is the adsorption energy with highest occurrence frequency which is in a practical sense the mean value shown as the peak of the energy distribution, and represents the energy variations depending on the heterogeneity of the adsorption site patch. Based on Equation (23), the final integrated model is then given as:
Ng et al. [18] state that for isotherm Types I through V, the number of nominal peaks is two, n = 2, and for more complex systems, e.g., Type VI, it can be higher. This approach is, therefore, similar to the model based on statistical physics approach introduced by Khalfaoui et al. [54] and further modified by Yahia et al. [16]. The Ng’s model capabilities are also demonstrated on all isotherm types.
2.6. Specifics of Adsorption Process of Mesoporous Silica
Based on the general approach for approximation of the adsorption process described above, it seems that a statistical approach based on various modifications of adsorption distribution, or energy distribution, works very well for many systems with well-defined properties. However, many models of experimental data are often limited by only a partial fit due to many concurrent processes during adsorption. From the previous explanation, we can consider the adsorption process to consist of three main, energetically distinguishable, processes; monolayer adsorption, multilayer adsorption and capillary condensation.
In this work, only adsorption isotherms Type IV and Type V are considered based on the data of selected mesoporous silica samples TMPSs (Taiyo Kagaku Mesoporous Silica), SBA-15 and MCM-41 with water as the adsorbate. The shape and the complication of this particular adsorption pair is given by the fact that the adsorption process of the mesoporous materials is exactly the combination of two to three distinguishable processes depending on the surface characteristics as stated above. Freshly calcined mesoporous silica lacks silanol groups [55,56], because of the high preparation temperatures. The lack of nucleation sites and apolar surface consisting only from pure silica explains the Type V shape. However, after decent interaction and often elevated temperature with the water molecules, the silica surface is gradually hydrated, and silanol groups are formed on the surface [55,57]. This change creates a partially polar surface environment and enhances the multilayered adsorption of water vapour. The situation is different when a foreign atom with different electronegativity potential is introduced into the structure. Here, materials with the aluminium doped structure are used in comparison to aluminium-free materials to obtain both Type IV and Type V isotherm curves. The additional not atypical problem of isotherm modelling of these systems arises from the pore size, which can be occasionally on the boundary of the microporous and mesoporous region around 2 nm, especially when considering adsorption materials for energy conversion and conservation. That gives curves with a problematic region of influence between capillary condensation and multilayer adsorption in confined space as described by the CMMS or Do and Do models.
From the regular analysis and common approach to modelling, we can simulate any isotherm shape given enough independent constant in the model function. Comparable approach can be observed in models of Yahia et al. [16], Ng et al. [18] or Do and Do [46]. Although the approach is not flawed, the simulation and fitting of the experimental data can lead to an overly complex solution and without a necessary robust modelling method the simulations can give results which would be difficult to repeat or with limited physical meaning. Therefore, this work focuses on developing a reasonably simple approach that can provide highly accurate yet reproducible and repeatable results of adsorption model fitting for mesoporous materials especially those with developed capillary condensation region.
3. Materials and Methods
The experimental data in this work were obtained from industrially manufactured mesoporous silica materials from Taiyo Kagaku Co., Ltd. (Yokkaichi, Mie, Japan) and laboratory prepared samples of MCM-41 and SBA-15 mesoporous silica. The manufactured materials belong to the TMPS group and the selected five samples are specified by different pore size ranging from 1.8 to 4.2 and with or without aluminium doping. The aluminium doped samples are signed with a capital latter A at the end of the sample name. For a comparison, laboratory prepared MCM-41 and SBA-15 mesoporous silica were examined for the water adsorption as well. The MCM-41 was prepared by cationic surfactant CTMABr in ammonia solution as described by Grün et al. [58] and by adjusting the method to create a smaller pore size comparable to the studied TMPS specimens by decreasing the ammonia volume to 3 . The results are spherical cells with diameter spanning from 100 up to 2 on average with pore diameter approximately . The SBA-15 was synthesised according to Sayari et al. [59] with the Pluronic P123 template. To adjust the pore size, we chose the first micelle stabilisation phase to 20 h at 35 and the subsequent growing phase to 100 for 24 h. The result was standard rod-like cells with a diameter of 200–300 and length around 1 . The pore size was found out as . Similarly to the TMPS materials, both the SBA-15 and the MCM-41 were used without any modifications. The properties of all used materials are summarised in Table 1. The detailed investigation on the physical properties of the used mesoporous silica materials is provided elsewhere Mikšík et al. [60].

Table 1.
Materials properties; total surface area (BET), total pore volume , mesopores pore volume , pore diameter and pore pitch .
The adsorption isotherms were measured on high accuracy surface characterisation analyser 3Flex (Micromeritics, Norcross, GA, USA). The schematic of the measurement device is provided in Figure 2. The 3Flex analyser is a constant volume analyser and uses volumetric method to establish the adsorption amount. The standard measurement process follows a set routine based on sampling certain amount of the adsorbate vapour into the closed manifold space (closed by V1-6 valves) with known volume. In the second step the valve to the desired sample tube is opened (one of V1-3 valves) and the adsorbate is introduced to the sample. The sampling time is typically couple of seconds after which the valves is closed and the sampled vapour amount is calculated on the bases of the pressure difference before and after the introduction. The final adsorbed amount is then calculated based on introduced amount of adsorbed vapour and the residual pressure inside the sample tube after equilibrium is reached. The equilibrium time was set to 10 s with less than 0.01% change of the adsorption amount. The relative error of the measurement based on the reference material provided by the manufacturer was less than u < . However, repeated measurements showed relative error of up to u = on the adsopriton amount and u = on the relative pressure as a joint error of weighting and vapour source preparation. However, with careful weight measurement the repeatability was typically 98. The relative deviation of the adsorption amount was also confirmed by an absolute thermogravimetric (TG) instrument MSB-TG (MicrotracBEL, Osaka, Japan) equipped with a magnetic suspension balance (MSB) (Rubotherm GmbH, Bochum, Germany). The high precision pressure transducer’s relative error was of the reading accuracy allowing a negligible increase of the error through the measurement. The free volume of the experimental vessel and the sample was established through introducing a known amount of helium from the manifold to the fully evacuated sample tube. The volume of the sample tube containing the sample was then automatically calculated based on the pressure difference of the manifold and compared to the pressure increase inside of the sample tube before and after introducing the gas. Considering the size of the water molecules and the helium molecules, the deviation caused by the inaccessible space (very small crevices) is further on assumed as negligible.
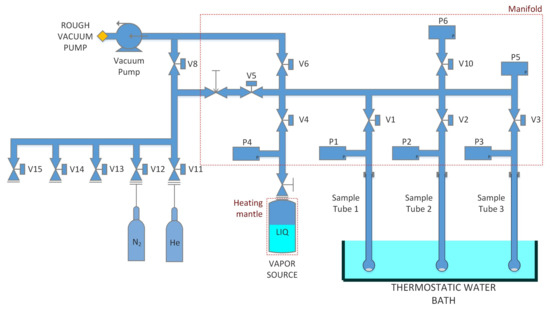
Figure 2.
Schematic picture of the experimental device.
Prior to the measurement, the samples were thoroughly degassed at 200 and high vacuum ( ) for 5 h before weighting. Nitrogen gas was used to fill the manifold and sample tube to avoid unnecessary contamination during the manipulation between the measurements and weighting. After weighting, the samples were degassed once more at 200 for another 5 h. The residual pressure over the samples in the sample cell was confirmed to be in all cases at the room temperature of 25 at the end of the degassing process. The drying temperature of 200 was selected with regards to the water adsorption properties of the possible presence of silanol (-Si-OH) groups [56]. Furthermore, to sustain high reproducibility, each measurement was conducted with a fresh sample every time. The TMPS samples were measured at five different temperatures 5, 15, 25, 35 and 40. The MCM-41 and SBA-15 were measured at four different temperatures 10, 20, 30 and 40. The vapour source was prepared from ultra-pure deionised water with standard resistivity of . The vapour source was degassed by regular procedure employing liquid nitrogen and high vacuum source. The degassing cycle was repeated until the pressure of vapour source at the room temperature (25 ) was equal to the referenced values (REFPROP).
3.1. New Type IV and Type V Adsorption Isotherm Model
Through the theoretical approaches to accommodate different adsorption processes described in the introduction in one model is deemed practically impossible. Especially challenging is the adsorption on mesoporous materials and those materials on the microporous and mesoporous boundary, as mentioned above as well. This problematic stands on the perspective of two synergic effects with different physical explanation and therefore governed by different properties. While the direct adsorption on the surface can be properly described by the standard adsorption theories such as Langmuir, BET or GAB, the limits of the capillary condensation in the mesoporous space lies in the mesopore volume distribution which roughly corresponds to the pore size distribution. As the condensation cannot be described simply by the empty adsorption sites nor through multilayer adsorption, as the limits are more of a geometrical constitution rather than chemical, a different approach should be considered for the mesoporous materials. In this work, an approach for the modelling was, therefore, taken from the perspective of the dependency of capillary condensation relative pressure directly on the pore size distribution. Such system was also briefly mentioned in the work of Do and Do [46] without further explanation per se. This approach, however, should require the identification of the pore size distribution beforehand or at least the adequate distribution model. Previously [60], the TMPS materials were analysed on their volumetric-based pore size distribution according to the Density Functional Theory (DFT) method, and a surprisingly good fit was observed with a modified standard distribution function:
where x is the pore size, is a dimensional coefficient and and are regular coefficients for the standard distribution function, where correlates to the range and is the position factor. Considering that the adsorption process for mesoporous materials is a combination of adsorption and capillary condensation, we can write:
where the adsorption amount at equilibrium is a sum of the regular adsorption and capillary condensation . By further developing this dependency it is possible to deduce a combination of standard adsorption model and condensation process based on the pore distribution. Firstly, it is necessary to rewrite the Equation (29) into an integral form while :
The boundary conditions of the Equation (31) are logically stated for the states in which the isotherm is defined from = 0 to = , while the upper limit is unity at full system saturation where . The integration of this modified standard distribution then leads naturally to error function and after some algebraic manipulation, we will get the cumulative condensation amount:
As the adsorption on hydrophilic materials is multilayer in principle, the selection of the surface adsorption part was obvious with respect to the BET theory. We selected two well-known models based on the assumption of the practicality of the new model; the multilayer BET (Equation (7)) and the modified BET model known as the GAB model. The main difference between these models would be, therefore, the expectation of the finite number of adsorbed layers (i.e., confined space) in opposition to the reduced relative pressure to compensate for the saturation pressure deviation in case of the GAB model. The multilayer BET model extended by the mesopore condensation distribution function defined by Equation (32) and the final equation takes the following form (further on only as mBET+G):
where the variable x is the standard relative pressure . Above that, we can describe the individual constants from Equation (33) by the temperature dimension T, which will be demonstrated in the following parts.
The combination of the condensation distribution function of Equation (32) part with the GAB model will take a similar route giving the final form:
In Equation (34) (further on referred as GAB+G) x is the standard relative pressure substituted by the reduced relative pressure from Equation (8). As mentioned before, the two new models have two parts describing individual processes during the adsorption. The GAB modification has been proven as a valid model for many systems surpassing the original BET model especially at higher relative pressures; however, it is derived from the assumption of infinite adsorption layers, which can lead to significant overestimation in adsorption. On the other hand, it is simpler than the second model based on the finite-layer derivation of the BET theory. Similarly to BET model the constant represents the affinity of the adsorbate to the adsorbent.
The and (first layer adsorbed volume), are properties of the system and should be independent on the temperature. However, in the case of , it is more appropriate to talk about apparent first layer capacity, as it is not necessarily an exact value, but rather an approximation of the model itself.
3.2. Modelling, Error Analysis and Goodness of Fit
To assess the quality of the model and the goodness of fit, several methods have been employed. As the standard method for the goodness of fit was used the non-linear Chi-Square Test () in the following form:
where is the calculated value and is the experimentally measured value. () method also has its shortcomings as it is supposed to be fit to data with a certain distribution. In case that the model fits well and the distribution of the points is too small, the results are small as well and a direct comparison can prove to be impractical. Hence, for standard comparison of dependencies, the usual coefficient of determination is used as well to assess the correlation between the models and experimental data. The equation is used in the form:
where the parameters are the same as in Equation (35), while is the average value of the adsorbed amount. As a result that the coefficient of determination does not provide adequate information when the data range spans through several orders of magnitude, to assess the absolute fit of the calculated model on the experimental data an average absolute deviation (AAD) and average relative deviation (ARD%) were used as a direct measure for the data fitting. The ARD% was used in its natural form:
The average absolute deviation was then calculated similarly without the scaling normalization by the effective experimental data :
The parameters of the function are again identical to Equation (35) of the test.
The model simulation was conducted through a repeated non-linear regression fitting using Trust Region Reflective (TRR) algorithm. An important criterion was an introduction of a weighting factor to compensate for the scalability of the adsorption amount at low relative pressure with optimization of the absolute average deviation fitting parameter. The fundamental fitting (preliminary fitting) of the models was executed with a different constant weighting factor according to distribution, where N is the number of the data points. This method was selected to better compensate for the imbalance in the input data, giving the beginning of the adsorption higher priority on a more local level. This way, a good fit for the basic model could be ascertained, providing us with meaningful results in terms of the BET adsorption theory and very good fit with experimental data. The same approach was applied to the other models as well. All the calculations and modelling of the isotherm curves were executed by original Python scripts.
4. Results
From the explanation above, it is evident that simple models would be difficult to apply to mesoporous materials as materials with strong duality (or triality) in their adsorption mechanisms. For the comparison of the new isotherm model, we have chosen the Rutherford model [42], Henry–Sips model [24] and Ng’s model [18] with two nominal peaks () (Ng-2f) as suggested in their work for the isotherm types IV and V. The selection of the comparison models was done based on the best fit out of the regular models described previously in this work. Although the goodness of fit of these models somehow lacks certain aspects, the results of the selected models prove to provide sufficient fit with the present mesoporous silica materials and the results are comparable to the new models. A full summary of the final form, at which all the models were used, is provided in Table 2.
Table 2.
Summary of the models in their final form for the comparative simulations.
The graphical representation of the new mBET+G and GAB+G models compared to the experimental data and literature models is provided in Figure 3 on the example of TMPS-2A and SBA-15. It is visible that all the selected models perform well except for the Henry–Sips model which cannot properly describe and follow the two modes of the adsorption process which is even more apparent given the respective examples in Figure 3 which are representatives of both Type V (SBA-15) and Type IV (TMPS-2A) isotherms. To objectively compare the fitting of the models, a numerical comparison is provided by the means of and ARD% for all tested samples. The statistical parameters are summarized in Table 3.
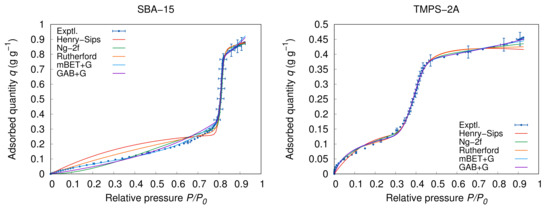
Figure 3.
Examples of model fitting on Type IV (TMPS-2A: 25 ) and Type V (SBA-15: 20 ) isotherms.
Table 3.
Statistical coefficients overview (ARD% and ) of Henry–Sips, Ng-2f, Rutherford, mBET+G and GAB+G models for all samples at 25 (20 for SBA-15 and MCM-41).
The best fit from the regular models based on the and ARD% values shows Rutherford’s model following the CMMS approach; moreover, this model works with only five constants making it more statistically significant. The visible improvement of the fitting is apparent from the ARD% values, which had been decreased in almost all cases. The better fitting can also be observed directly from the graphical output of the residual analysis in Figure 4. However, when comparing the individual models, we have to evaluate all of the statistical factors.
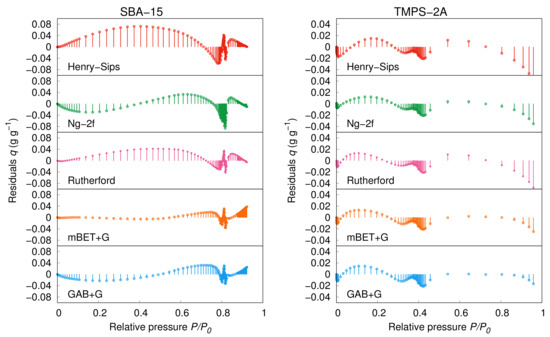
Figure 4.
Residual analysis of the models fitting (SBA-15: 20 , TMPS-2A: 25 ).
Even if the relative deviations are rather high (mostly > 10%) the average absolute deviations listed in the Table 4, together with the full summary of the models’ constants parameters, are relatively small for all the models. The implications are clear when we directly confront these two values. If the AAD is small, the overall fit is acceptable, however, if the ARD% value is also small, even the fitting at lower relative pressures fits the experimental data. Then again, with ARD% values too high, the fit at the lower relative pressures is typically poor as it is apparent in Figure 5 showing detail fitting in the relative pressure region of 0 to 0.2. This comparison is indeed crucial if fitting the whole adsorption pressure range by physically meaningful parameters of the used models.
Table 4.
Adsorption models’ fitting parameters and constants for all samples at 25 (20 for SBA-15 and MCM-41) with average absolute deviation (AAD) of the fit of the experimental data.
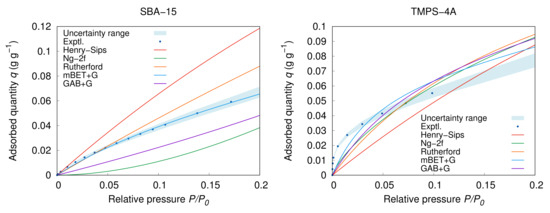
Figure 5.
Detailed view on the models fitting at low (TMPS-4A: 25 , SBA-15: 20 ).
The new models are easily comparable to the recent models and in several aspects, they outperform them. The direct comparison based on ARD% reveals that far best results are reached by the mBET+G, which reaches the best ARD% values and parameters on average. That is, some of the materials show better fitting parameters for different individual models, however, the overall universal applicability is in favour of the mBET+G model. As an example can serve the material TMPS-4R which fits the mBET+G model with ARD% = %, however, Rutherford’s model shows ARD% = %, which is clearly better value. Similar results are also in case of the absolute deviation AAD of the TMPS-4R where Rutherford’s model performs the best among all the models with AAD = −1 while the mBET+G is the second best with AAD = −1. Afterwards, the mBET+G model shows better results and fitting parameters in all other materials compared to Rutherford’s model. The same situation is in case of TMPS-1.5A where the best performing model is Ng’s two-part model (Ng-2f) reaching very low AAD = −1. The mBET+G and GAB+G then show slightly higher values of AAD = −1 and AAD = −1, respectively. The fitting example of the TMPS-4R and TMPS-1.5A is available in Figure 6. The results are therefore strongly in favour of mBET+G and the GAB+G model is used mainly for demonstration and comparison.
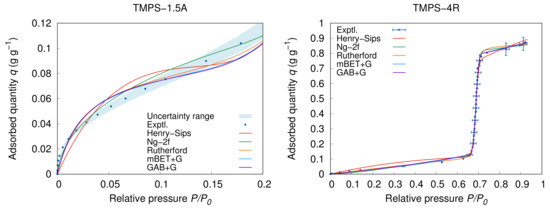
Figure 6.
Detailed view on the models fitting at low for TMPS-1.5A and full view for TMPS-4R at 25 .
A strong point of the proposed combination is the complementarity of the two models; multilayer BET model and capillary condensation distribution function model. Comparing the fitting parameters of the individual models, the newly proposed model systems, especially the mBET+G, provide the most regular parameters in relation to the properties of the adsorbents. Looking at the Henry–Sips model, the proportionality factor almost completely separates the individual parts of Henry contribution and Sips contribution at a certain point. That is not necessarily wrong for many of the materials which exhibit a strong Henry region, however, the applicability is strongly limited and, as shown in this work, the fitting is mostly insufficient. Different situation is in case of the Ng-2f’s model where the energy distribution functions are designed to overlap each other to create the resulting isotherm. Even though that the fitting is improved, the fitting parameters are not following the individual adsorption phases. That is apparent from irregular values of the parameters (very high or very small values of ) for different adsorbents regardless the properties. The best fit in comparison to the proposed mBET+G, therefore, provides the Rutherford’s model. Rutherford’s model is technically a combination of Langmuir isotherm and modified (simplified) CMMS model. However, it is important to note that Rutherford’s model is not primarily intended to cover the capillary condensation as was explained in the Section 2.2. Thus, the parameters of the model have limited meaning for materials with capillary condensation. As a result of this, the Rutherford’s model tends to overestimate the adsorption quantity at lower relative pressure for materials with low affinity to the adsorbate (SBA-15) or underestimate it for materials with high affinity (TMPS-4A) as clearly visible in Figure 5. From this perspective is clear that the proposed model has superior properties when considering materials with certain amount of capillary condensation. It would be possible to argue that a very good fit can be reached by expanding the Ng’s multipart model [18] or Yahia’s multipart model [16], however, this fitting would be achieved on the expenses of increased amount of necessary parameters and complexity.
From the Figure 5 and Figure 6 on the examples TMPS-4A and TMPS-1.5A, it is notable that most of the models underestimate the adsorbed quantity at low , and therefore, underestimates the adsorption potential. This situation is most apparent in the case of material with high affinity to water and strong adsorbent–adsorbate interaction of the adsorption isotherm Type IV. Furthermore, at the end of the adsorption at high relative pressure, all of the samples show a continuous increase in the adsorption amount associated with progressing multilayer adsorption and at the further end with inter-particle condensation. This part is also very well described by the extended BET combined models as the multilayer formation is usually considered to continue through the whole pressure span. However, because the BET theory does not account for the inter-particle condensation, it may lead to inevitable compensation error, as shown in detail in Figure 4. The same problems, naturally, concerns other models as well as they do not explicitly deal with the physical properties of the system such as the shape and size of the adsorbent particles. Nevertheless, this region is seldom a concern during modelling or simulation of the adsorption systems and it is primarily used for the material analysis only.
Temperature Dependent Fitting and Analysis
For the purpose of a combination with a simulated environment, the model parameters should be fitted into a temperature function series. Hence, the creation of a universal model applicable for the whole temperature region was attempted in this work as well. Considering the best fit of the experimental data and the purpose of this study, we have selected only the mBET+G model for this procedure as it gives better overall performance over the GAB+G model. The approximation of the model’s parameters dependence on the temperature can be expressed as a linear function of temperature:
where T is the variable temperature, and and are the individual parameter’s temperature change rate and temperature-independent constant component, respectively. The linear approximation was selected for its simplicity and with the focus on sustainable accuracy which was validated in comparison for the individual isothermal data fitting. However, we need to emphasise that the linear approximation used specifically in this temperature range will not be necessarily also applicable beyond the scope of the presented experimental data. Hence, extrapolation of the data outside of the experimentally acquired temperature range should be validated.
The full approximation can be simply made based on the results of the individual isotherm analyses and their linear estimation. That gives, however, rather crude results with fitting errors far surpassing the original fitting parameters and a further optimization has to be applied. With the fundamental estimation taken from the simple linear regression of the individual parameters, the whole model was optimized on the whole data set at once through a continuous non-linear regression using the ARD% results as the weighting factors. This approach allowed us to have good agreement with the original fitting focusing on the sustainable fit at lower relative pressure and at the same time, we could partially compensate for the differences of the separate isotherm measurements. The final and optimized fitting is presented in Figure 7 on the example of TMPS-1.5 and TMPS-2A, which have different surface characteristics and mean pore size. The average relative deviation is typically higher than in case of the individual isotherm modelling and reaches AAD% for TMPS-2A compared to AAD% of the one isotherm fitting at 25 . Somewhat atypical is the fitting of TMPS-1.5 which shows overall deviation decrease in the temperature approximation over the one isotherm fitting dropping from the original AAD% at 25 to the overall AAD%. This is caused by the slightly deficient fit at 25 while the average of all isotherms of TMPS-1.5 was in fact %. The fitting parameters of the temperature approximation for the whole sample set are summarized in Table 5.
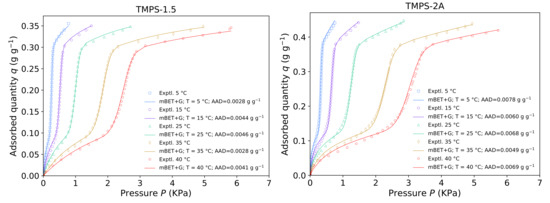
Figure 7.
Fit of the mBET+G model as a function of Temperature from 5 to 40 for TMPS-1.5 and TMPS-2A.
Table 5.
mBET+G model’s temperature dependent parameters approximation. Valid temperature region 5 to 40 .
Based on the linear expression, we can distinguish two separate patterns within the parameters. The first group describing the adsorbent–adsorbate interactions consists of highly and partially temperature-dependent parameters C and n. These parameters decrease with temperature in all cases, which follows the general adsorption theory that higher adsorption temperature negatively influences the adsorbent–adsorbate adsorption energy resulting in weaker bonding. The second group consists of parameters which are directly dependent on the physical properties of the adsorbent and mostly influences by the adsorbate–adsorbate interactions, such as capillary condensation. Into this group also belongs the maximum surface uptake as it does describe the unchanging surface area of the adsorbent even though it is affected by the adsorbate-adsorbent to a certain degree. The values of for most of the tested materials are well below −1 −1 of the slope making it practically constant in the selected temperature range. Similar observations were noted for the parameters describing the capillary condensation region in the form of the distribution function consisting of , and parameters, here with respective linear coefficients denoted as sub and intercept constant denoted as sub . If we look closely to the effective values of those parameters, we can see that the linear coefficients are typically two to three orders smaller than the intercept constants. This mean that within the selected temperature range 5 to 40 the temperature dependence is limited to less than 10% on the final values. Furthermore, individual changes can be explained by the governing processes during the adsorption giving them physical meaning, although the explanation is not that straightforward as we would expect. For example, the change with temperature of the parameter, which describes the mean value of the capillary condensation relative pressure, is connected to the change of the surface tension from the Kelvin Equation (16). The increase in the surface tension caused by the temperature rise also causes the increase of the Kelvin radius leading to shifting of the condensation in the pores to higher relative pressure values. However, at the same, the density of the adsorbed layers decreases, causing an opposing force to this process as the adsorbed layer thickness increases on the surface of the adsorbent. Although this effect may be small in comparison, many of these processes affect the final value requiring further insight.
5. Discussion
Despite the similar origins, the materials presented in this work have different properties and behaviour arising from their chemical and geometrical structure. The typical and pure mesoporous silica usually exhibit limited adsorption at lower relative pressures as shown in Figure 3 on the typical representative SBA-15. A similar situation is in case of TMPS-4R and MCM-41, which have unaltered simple silica structure. These low hydrophilic properties of their surface are adequately described by the low C constants values from the mBET+G and GAB+G models. The C constant in the BET theory describes the intensity of the adsorbent–adsorbate interaction, and it is typically given by the following formula:
where and are the average adsorption heat of the first layer and heat of liquefaction, respectively. The gas constant R is then used together with the thermodynamic temperature T. However, even though that the C and constants of GAB and BET models share the same origins, the values significantly vary as shown in Table 4 when the GAB+G model is showing considerably higher values, even several times higher than the mBET+G model. If we look further into the meaning of the C constant and its relation to other constants in the GAB and BET models as was explained before, we come to the realisation that in case of the GAB model the constant is practically co-dependent on the constant while in the BET model the relation is clearer from the original expression of Equation (7) where . That means while in the GAB+G model the constant requires a more careful approach, in case of the mBET+G model Equation (40) can be applied directly provided the capillary condensation expression part does not interfere with the BET contribution to the model. Truly, in Figure 8 is clearly visible that the distribution function applies only in a very narrow window corresponding neatly to the capillary condensation region. At the same time, the multilayer adsorption following the BET model is undisturbed and continues to add to the adsorbed quantity. A certain flaw in this model can be perceived the sudden change in the surface area after the full pore filling making the inner surface of the pores completely inaccessible which is not accounted for in either part of the equation. However, despite that, the model continues without significant deviation from the experimental data until high relative pressure where the inter-particle condensation takes place. The inter-particle condensation is characterised by a sudden rise in the adsorption quantity beyond the mark and it depends on the particle size and shape. As a result that the inter-particle condensation is of low importance in the practical meaning, we tried to avoid this region in the experimental setup actively and only trace evidence of this process can be observed in Figure 6 on the example of TMPS-4R.
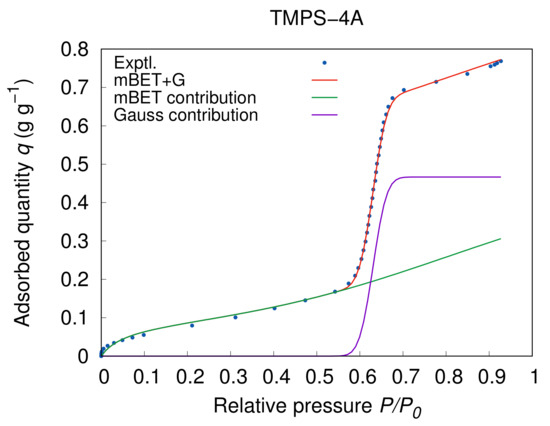
Figure 8.
mBET+G model contribution analysis of individual model parts for TMPS-4A at 25 .
In the case of the aluminium doped samples TMPS-1.5A, TMPS-2A and TMPS-4A, the C values are significantly higher, showing strong hydrophilic properties. As a result that the aluminium content is similar to all of the augmented samples, the C should be as well similar. Yet, in fact only the TMPS-2A and TMPS-4A show similar values of and , respectively, and the TMPS-1.5A shows C value as high as . This significant increase is caused by the boundary conditions of the microporous region to which the TMPS-1.5A belongs with the average pore diameter of . The closeness of the microporous region also affects the slightly higher value of the TMPS-2A compared to the TMPS-4A. The microporous conditions then also explain the higher values of the TMPS-1.5 compared to the other aluminium-free samples. The seemingly higher value of SBA-15 at is similarly caused by a certain content of microporous space created by the inter-pore channels as the remnants of the templating [61] and as found out as well during the detailed analysis of the sample characteristics [60].
If we attempt to compare the calculated values of the adsorption heat from Equation (40) of the first layer with the calculated values from experimental data by Clausius–Clapeyron (CC) relation from our previous work [26] the average values appear to be in agreement with those calculations. The highest value of the adsorption heat for the first layer based on the mBET+G is reached by the TMPS-1.5A with −1, while the lowest one is TMPS-4R with −1. The equivalent values from the Clausius-Clapeyron relation [26] for the first layer (calculated as an average value from −1 to ) are at −1 and −1 for TMPS-1.5A and TMPS-4R, respectively. Considering that the calculated values of the adsorption heat by the CC relation are typically lower than the actual experimental results [62], the difference between these two samples is similar and equivalent to their respective surface characteristics.
From the fitting parameters of the mBET+G model is evident that the normal distribution works very well for all of the studied material samples. However, the normal distribution function used to describe the capillary condensation is still somehow lacking in terms of the physical meaning of the individual constants. Therefore, in here, we attempt to explain the individual constant using the physicochemical parameters, whereas the comparison in this work was possible thanks to the variety of the samples, varying by the pore size and surface characteristics. While the physical meaning of the C and n constants from the original BET model is clear and was explained above, parameters describing the capillary condensation may have a broader meaning.
The function describing the capillary condensation is built around the physical pore size distribution, which proved to the adjusted normal distribution based on the DFT analysis data. From the mathematical point of view, the normal distribution function is a form of probability function, hence, its cumulative expression takes the values from zero to unity. With this consideration, the parameter is then the value of directly condensed adsorbate due to the surface curvature as explained by the Kelvin Equation (16). Therefore, if we compare the values to the mesopore volume of the individual samples, a simple linear dependence is achieved in Figure 9, where the linear regression equals to . This result can also be considered as a secondary proof of the model applicability. The only sample which does not fit to the equation is the SBA-15 sample, which was also excluded from the linear regression. The explanation could be that the different character of the SBA-15 adsorption makes the parameter more dependent on the chemical properties of the material such as inverse influence on the number of layers described by the n constant. The SBA-15 has the highest layer number of , while the other surface characteristics are comparable to the other samples. The SBA-15 also has significantly bigger pore size allowing for more surface coverage before the capillary condensation is in effect. However, to further study this dependence, more samples with larger pore size should be examined in a separate work.
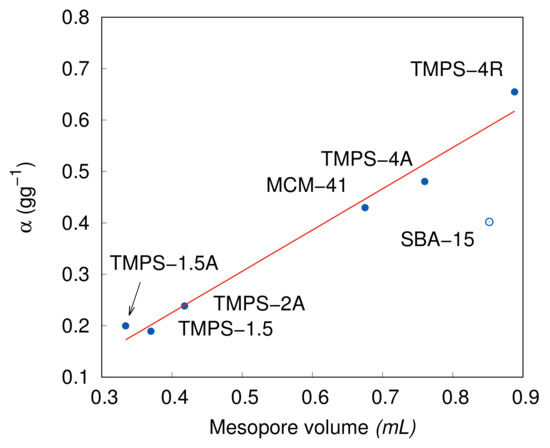
Figure 9.
Dependence of on the measured mesoporous volume. Solid line represents the linear regression.
The position of the capillary condensation on the x axis of the relative pressure is decided in Equation (33) by the constant. Furthermore, it is clear that the capillary condensation is distinguishably decided by the pore diameter. Therefore, considering the fact that from the definition of the Kelvin equation the critical radius, or curvature, is practically dependent on the natural logarithm of the relative pressure, reciprocally, the , as a function of the relative pressure, will become dependent on the pore radius or diameter in this case. The linearisation through the logarithm function () shows a good fit with the data in Figure 10 for different pore diameters almost regardless the surface characteristics. This is, in fact, surprising as we have expected stronger dependence on the layer thickness, which directly affects the effective critical radius during the capillary condensation. Looking at the adsorption data presented in Figure 3, Figure 4, Figure 5, Figure 6, Figure 7 and Figure 8 it is apparent that the samples with aluminium have significantly higher adsorption uptake prior to the capillary condensation. A reasonable explanation can be provided by the mechanism of the adsorption on the silica surfaces enhanced for higher hydrophilicity by Brönsted acid sites such as the aluminium atoms incorporated in the silica structure. Even though that these atoms increase the adsorption potential of the silica materials, the effect is strongly localised and typical by cluster formations [63]. Based on this mechanism, the clusters despite significantly increasing the initial adsorption quantity have limited effect on the entire layer thickness, which consequently allows for a mostly undisturbed dependency of the on the real pore diameter. However, this clustering effect has also other implications which are moreover connected to the constant.
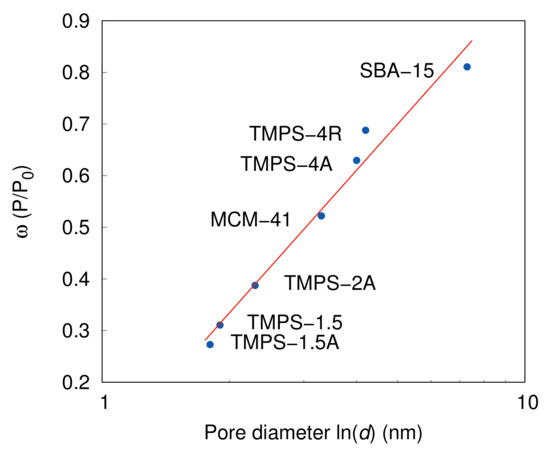
Figure 10.
as a function of a natural logarithm of the mean pore size. Solid line represents the linear regression.
The parameter describes the span of pore capillary condensation, in other words, the range of the effective pore diameters associated with the capillary condensation. From the mathematical meaning, the smaller the is, the narrower the effective pore diameter range will be. Accordingly, considering the clustering effect, which in terms of position is mostly random, the creation of localised water molecular bridges can be expected, broadening the capillary condensation part and increasing the value. A similar effect of clustering can be observed in the case of microporous space (<) which moves the equilibrium of adsorption dynamics further from desorption. This is clearly apparent from Figure 11, where the value is shown as a function a natural logarithm of the ratio of C over n (). Although, the selection is somehow limited, the materials with aluminium content or in the range of microporous region show notably higher values. Furthermore considering the cluster formation as a basic process during the early stages of the adsorption, the final layer number n is not necessarily actual layer count, but rather an approximation of the clustering effect. Then, because the surface characteristics are simultaneously described by the C and n constants the function for the parameter has to take in account both of these constants. From the definition it is clear that the higher is the basic surface affinity expressed by the constant C, as in the case if TMPS-1.5A, the higher the results are going to be, considering low n value. It is therefore apparent that the parameter is dependent on two main factors. One is inherently connected to the porous structure, which is defined as the pore size distribution. The second factor is then the surface characteristics and the adsorption process defined independently by the BET constants and the apparent effect of cluster-like adsorption.
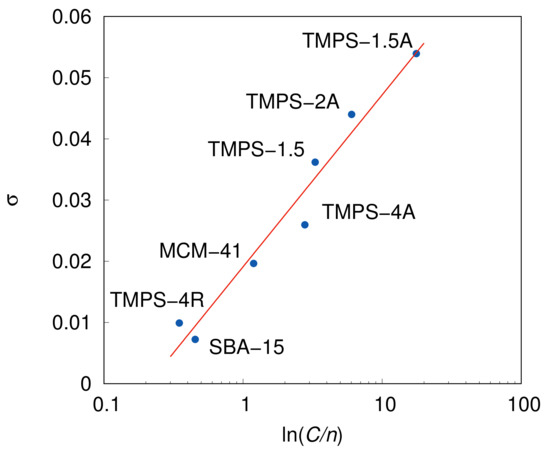
Figure 11.
as function of a natural logarithm of the ratio of C over n. Solid line represents the linear regression.
6. Conclusions
The problematic of mesopore filling is very complex and depends on many variables in general, and it is, therefore, impossible to describe it by a single or simple formula. It is apparent that the fitting of the mBET+G model is not entirely ideal and the thermodynamic properties of the system for the capillary condensation part cannot be described by this method yet. However, the actual fitting shows outstanding results and accuracy, and it can be surely considered for use in simulations of adsorption systems. The new model provides sufficient accuracy together with reasonable simplicity through the combination of all three main adsorption process types and points to an exciting direction for further development.
The advantage of the proposed mBET model in comparison to the recent models can be seen in adding a physically meaningful part describing capillary condensation region which has been so far difficult to address directly. The proposed model follows fully all the main modes of adsorption in a simple and clear way following the basic principles of both adsorbate–adsorbent and adsorbate–adsorbate interactions. Furthermore, the significance of the separate capillary condensation mode in the new model brings the possibility to apply standard models at high relative pressures, where they were usually failing, and obtain additional meaningful information about the modelled adsorption system in a simple and clear way compared to the other models.
We have explained that the new mBET+G model does not necessarily perform the best with all the samples; however, the overall performance is clearly superior and more universal to the other models. Hence, it should serve as a better tool to compare broader variety of materials. Even though the performance has been tested only on the materials with high level of structural organization, we believe that many other porous materials can be fitted with this model with good results and precision. Moreover, due to the parallel complementarity of the individual parts of the mBET+G (as well as GAB+G), the models can sustain the physical meaning of the constants from the original theories and create a unique system that can hopefully find its use in many areas of adsorption and porous material analysis.
Author Contributions
Writing—Original draft preparation, Data analysis, Methodology, F.M.; Review and editing, T.M. and K.T. All authors have read and agreed to the published version of the manuscript.
Funding
This research received no external funding.
Acknowledgments
The authors thank Taiyo Kagaku Co., Ltd., Japan for their kind provision of the samples of the TMPS materials for this work. Furthermore, the authors thank Shiori Kubo and Ryohei Kono from AIST, Tsukuba, Japan for their great help with the preparation of the SBA-15 and MCM-41 samples.
Conflicts of Interest
The authors declare no conflict of interest.
Abbreviations
The following abbreviations and nomenclature are used in this manuscript:
| AAD | Average Absolute Deviation |
| AHP | Adsorption Heat Pump |
| AHS | Adsorption Heat Storage |
| ARD | Average Relative Deviation |
| BDDT | Brunauer, Deming, Deming, Teller |
| BET | Brunauer, Emmett, Teller |
| mBET+G | new model based on multilayer BET model and modified Gauss standard distribution function |
| CMMS | Cooperative Multi-Molecular Sorption |
| CTMABr | CetylTriMethylAmmonium Bromide |
| DFT | Density Functional Theory |
| EtOH | Ethanol |
| Error Function | |
| FAM | FerroAluinophosphate Mitsubishi |
| GAB | Gugenheim, Anderson, de Boer |
| GAB+G | new model based on GAB model and modified Gauss standard distribution function |
| iso-PrOH | iso-propanol |
| MeOH | Methanol |
| MIL | Materials Institute Lavoisier |
| Ng-2f | Ng’s model with two parts |
| UIPAC | International Union of Pure and Applied Chemistry |
| TMPS | Taiyo Kagaku Mesoporous Silica |
| XRD | X-ray Powder Diffraction |
| A | adsorbate molecule |
| pore pitch according to XRD measurement | |
| Langmuir’s mode constant in the Rutherford’s model | |
| C | BET constant |
| GAB constant (similar to the BET constant) | |
| total saturation concentration | |
| saturation concentration of micropores | |
| pore diameter according to DFT | |
| g | additional BDDT thermodynamic constant |
| H | curvature of the meniscus |
| i | index number |
| K | rate constant |
| filling constant for adjacent sites | |
| filling constant for adjacent-adjacent sites | |
| Anderson constant for relative pressure modification | |
| adsorption constant rate of the lateral direction (growth of layer count) | |
| Buttersack additional constant (non-linear approximation) | |
| sorption equilibrium constant | |
| Henry’s constant | |
| Sips’ constant | |
| micropore adsorption equilibrium constant | |
| k | equilibrium constant of adsorption site occupancy |
| N | particle amount/number |
| occupation state | |
| n | index number or layer count number |
| energy variation of the adsorption site patch | |
| P | absolute pressure |
| saturation pressure | |
| relative pressure | |
| R | gas constant ( −1 −1) |
| Q | net heat of adsorption |
| additional adsorption heat of higher layers | |
| q | adsorption uptake/amount |
| adsorption at saturation point - maximum adsorption | |
| calculated values of adsorption amount | |
| adsorption amount at equilibrium | |
| adsorption amount of regular adsorption stage (surface and multilayer) | |
| adsorption amount of capillary condensation stage | |
| experimental values of adsorption amount | |
| adsorption amount of monolayer | |
| adsorption amount of the Langmuir’s mode in the Rutherford’s model | |
| adsorption amount of CMMS’ mode in the Rutherford’s model | |
| coefficient of determination | |
| adsorption rate | |
| desorption rate | |
| r | heterogeneity factor |
| Kelvin radius | |
| pore radius | |
| S | adsorption site |
| functional group concentration | |
| surface area of the mesopore space | |
| total surface area | |
| available adsorption site number/adsorption area | |
| T | thermodynamic temperature |
| t | time |
| layer thickness | |
| u | relative error/deviation |
| molar volume | |
| mesopore volume | |
| total pore volume | |
| molar volume of condensed adsorbate | |
| W | interaction parameter |
| energy distribution function | |
| x | modification of relative pressure ( or ) |
| dimensional coefficient | |
| proportionality factor | |
| exponential factor of the parameter | |
| fractional probability factor (i = 1, 2, 3,...) | |
| energy | |
| activation energy of adsorption | |
| activation energy of desorption | |
| mean value of the adsorption energy (highest occurrence frequency) | |
| surface tension | |
| relative adsorption | |
| distribution function coefficient—range correlation | |
| Chi-Square Test function | |
| distribution function coefficient—position factor |
References
- Hassan, H.Z.; Mohamad, A.; Bennacer, R. Simulation of an adsorption solar cooling system. Energy 2011, 36, 530–537. [Google Scholar] [CrossRef]
- Sawant, P.A.; Pfafferott, J. Experimental Investigation of a Real-Life Microscale Trigeneration System Using Adsorption Cooling, Reversible Heat-Pump and a Cogeneration Unit. In Proceedings of the 7th IC-EPSMSO, Athens, Greece, 4–8 July 2017; pp. 155–165. [Google Scholar]
- Zhou, C.; Liang, R.; Zhang, J.; Riaz, A. Experimental study on the cogeneration performance of roll-bond-PVT heat pump system with single stage compression during summer. Appl. Therm. Eng. 2019, 149, 249–261. [Google Scholar] [CrossRef]
- Zhao, Y.; Luo, Z.; Long, R.; Liu, Z.; Liu, W. Performance evaluations of an adsorption-based power and cooling cogeneration system under different operative conditions and working fluids. Energy 2020, 204, 117993. [Google Scholar] [CrossRef]
- Helaly, H.O.; Awad, M.M.; El-Sharkawy, I.I.; Hamed, A.M. Theoretical and experimental investigation of the performance of adsorption heat storage system. Appl. Therm. Eng. 2019, 147, 10–28. [Google Scholar] [CrossRef]
- Schmidt, F.P.; Luther, J.; Glandt, E.D. Influence of Adsorbent Characteristics on the Performance of an Adsorption Heat Storage Cycle. Ind. Eng. Chem. Res. 2003, 42, 4910–4918. [Google Scholar] [CrossRef]
- Pesaran, A.; Lee, H.; Hwang, Y.; Radermacher, R.; Chun, H.H. Review article: Numerical simulation of adsorption heat pumps. Energy 2016, 100, 310–320. [Google Scholar] [CrossRef]
- Graf, S.; Lanzerath, F.; Sapienza, A.; Frazzica, A.; Freni, A.; Bardow, A. Prediction of SCP and COP for adsorption heat pumps and chillers by combining the large-temperature-jump method and dynamic modeling. Appl. Therm. Eng. 2016, 98, 900–909. [Google Scholar] [CrossRef]
- Kayal, S.; Baichuan, S.; Saha, B.B. Adsorption characteristics of AQSOA zeolites and water for adsorption chillers. Int. J. Heat Mass Transf. 2016, 92, 1120–1127. [Google Scholar] [CrossRef]
- Elsayed, E.; AL-Dadah, R.; Mahmoud, S.; Anderson, P.; Hassan, A.; Youssef, P. Numerical investigation of MIL-101(Cr)/GrO composite performance in adsorption cooling systems. Energy Procedia 2017, 142, 4131–4137. [Google Scholar] [CrossRef]
- Gediz Ilis, G. Influence of new adsorbents with isotherm Type V on performance of an adsorption heat pump. Energy 2017, 119, 86–93. [Google Scholar] [CrossRef]
- Mahle, J.J. An adsorption equilibrium model for Type 5 isotherms. Carbon 2002, 40, 2753–2759. [Google Scholar] [CrossRef]
- Toth, J. State equations of the solid-gas interface layers. Acta Chim. Hung. 1971, 69, 311–328. [Google Scholar]
- Mohammed, R.H.; Mesalhy, O.; Elsayed, M.L.; Su, M.; Chow, L.C. Revisiting the adsorption equilibrium equations of silica-gel/water for adsorption cooling applications. Int. J. Refrig. 2018, 86, 40–47. [Google Scholar] [CrossRef]
- Foo, K.; Hameed, B. Insights into the modeling of adsorption isotherm systems. Chem. Eng. J. 2010, 156, 2–10. [Google Scholar] [CrossRef]
- Yahia, M.B.; Torkia, Y.B.; Knani, S.; Hachicha, M.A.; Khalfaoui, M.; Lamine, A.B. Models for Type VI Adsorption Isotherms from a Statistical Mechanical Formulation. Adsorpt. Sci. Technol. 2013, 31, 341–357. [Google Scholar] [CrossRef]
- Tzabar, N.; ter Brake, H.J.M. Adsorption isotherms and Sips models of nitrogen, methane, ethane, and propane on commercial activated carbons and polyvinylidene chloride. Adsorption 2016, 22, 901–914. [Google Scholar] [CrossRef]
- Ng, K.C.; Burhan, M.; Shahzad, M.W.; Ismail, A.B. A Universal Isotherm Model to Capture Adsorption Uptake and Energy Distribution of Porous Heterogeneous Surface. Sci. Rep. 2017, 7, 10634. [Google Scholar] [CrossRef]
- Buttersack, C. Modeling of type IV and V sigmoidal adsorption isotherms. Phys. Chem. Chem. Phys. 2019, 21, 5614–5626. [Google Scholar] [CrossRef]
- Wang, Y.; LeVan, M.D. Adsorption Equilibrium of Carbon Dioxide and Water Vapor on Zeolites 5A and 13X and Silica Gel: Pure Components. J. Chem. Eng. Data 2009, 54, 2839–2844. [Google Scholar] [CrossRef]
- Thommes, M.; Kaneko, K.; Neimark, A.V.; Olivier, J.P.; Rodriguez-Reinoso, F.; Rouquerol, J.; Sing, K.S. Physisorption of gases, with special reference to the evaluation of surface area and pore size distribution (IUPAC Technical Report). Pure Appl. Chem. 2015, 87, 1051–1069. [Google Scholar] [CrossRef]
- Izmailova, S.; Vasiljeva, E.; Karetina, I.; Feoktistova, N.; Khvoshchev, S. Adsorption of Methanol, Ammonia and Water on the Zeolite-Like Aluminophosphates AlPO4-5, AlPO4-17, and AlPO4-18. J. Colloid Interface Sci. 1996, 179, 374–379. [Google Scholar] [CrossRef]
- Goldsworthy, M. Measurements of water vapour sorption isotherms for RD silica gel, AQSOA-Z01, AQSOA-Z02, AQSOA-Z05 and CECA zeolite 3A. Microporous Mesoporous Mater. 2014, 196, 59–67. [Google Scholar] [CrossRef]
- Kim, Y.D.; Thu, K.; Ng, K.C. Adsorption characteristics of water vapor on ferroaluminophosphate for desalination cycle. Desalination 2014, 344, 350–356. [Google Scholar] [CrossRef]
- Mikšík, F.; Miyazaki, T. Material Selection for Adsorption Heat Storage Systems. Proc. Int. Exch. Innov. Conf. Eng. Sci. 2018, 4, 32–35. [Google Scholar] [CrossRef]
- Miksik, F.; Miyazaki, T. Material selection and properties for adsorption heat storage: Perspectivity of TMPS series mesoporous silica nano-materials. Adsorption 2019, 25, 1137–1145. [Google Scholar] [CrossRef]
- Ruthven, D.M. Principles of Adsorption and Adsorption Processes; Willey: New York, NY, USA, 1984; p. 484. [Google Scholar]
- Langmuir, I. The adsorption of gases on plane surfaces of glass, mica and platinum. J. Am. Chem. Soc. 1918, 40, 1361–1403. [Google Scholar] [CrossRef]
- Freundlich, H. Über die Adsorption in Lösungen. Z. für Phys. Chem. 1907, 57. [Google Scholar] [CrossRef]
- Temkin, M.; Levich, V. Adsorption equilibrium on heterogenous surfaces. J. Phys. Chem. 1946, 20, 1441. [Google Scholar]
- Brunauer, S.; Emmett, P.H.; Teller, E. Adsorption of Gases in Multimolecular Layers. J. Am. Chem. Soc. 1938, 60, 309–319. [Google Scholar] [CrossRef]
- Rouquerol, J.; Avnir, D.; Everett, D.; Fairbridge, C.; Haynes, M.; Pernicone, N.; Ramsay, J.; Sing, K.; Unger, K. Guidelines for the Characterization of Porous Solids. In Studies in Surface Science and Catalysis; Elsevier: Amsterdam, The Netherlands, 1994; pp. 1–9. [Google Scholar] [CrossRef]
- Brunauer, S.; Skalny, J.; Bodor, E. Adsorption on nonporous solids. J. Colloid Interface Sci. 1969, 30, 546–552. [Google Scholar] [CrossRef]
- Anderson, R.B. Modifications of the Brunauer, Emmett and Teller Equation (1). J. Am. Chem. Soc. 1946, 68, 686–691. [Google Scholar] [CrossRef]
- De Boer, J. The Dynamical Character of Adsorption; Clarendon Press: Oxford, UK, 1953; p. 239. [Google Scholar]
- Guggenheim, E.A. Applications of Statistical Mechanics; Clarendon Press: Oxford, UK, 1966; p. 211. [Google Scholar]
- Singh, P.C.; Singh, R.K. Application of gab model for water sorption isotherms of food products. J. Food Process. Preserv. 1996, 20, 203–220. [Google Scholar] [CrossRef]
- Caurie, M. The derivation of the GAB adsorption equation from the BDDT adsorption theory. Int. J. Food Sci. Technol. 2006, 41, 173–179. [Google Scholar] [CrossRef]
- Klotz, I.M.; Walker, F.M.; Pivan, R.B. The Binding of Organic Ions by Proteins 1. J. Am. Chem. Soc. 1946, 68, 1486–1490. [Google Scholar] [CrossRef]
- Ward, C.A.; Wu, J. Effect of Adsorption on the Surface Tension Solid-Fluid Interfaces. J. Phys. Chem. B 2007, 111, 3685–3694. [Google Scholar] [CrossRef]
- Malakhov, A.O.; Volkov, V.V. Cooperative multimolecular sorption equation: Application to an alcohol-poly(1-trimethylsilyl-1-propyne) system. Polym. Sci. Ser. A 2000, 42, 1721–1729. [Google Scholar]
- Rutherford, S. Application of cooperative multimolecular sorption theory for characterization of water adsorption equilibrium in carbon. Carbon 2003, 41, 622–625. [Google Scholar] [CrossRef]
- Rutherford, S.W. Modeling Water Adsorption in Carbon Micropores: Study of Water in Carbon Molecular Sieves. Langmuir 2006, 22, 702–708. [Google Scholar] [CrossRef]
- Plaza, M.G.; Durán, I.; Querejeta, N.; Rubiera, F.; Pevida, C. Experimental and Simulation Study of Adsorption in Postcombustion Conditions Using a Microporous Biochar. 2. H2O, CO2, and N2 Adsorption. Ind. Eng. Chem. Res. 2016, 55, 6854–6865. [Google Scholar] [CrossRef]
- Striolo, A.; Chialvo, A.A.; Cummings, P.T.; Gubbins, K.E. Water Adsorption in Carbon-Slit Nanopores. Langmuir 2003, 19, 8583–8591. [Google Scholar] [CrossRef]
- Do, D.; Do, H. A model for water adsorption in activated carbon. Carbon 2000, 38, 767–773. [Google Scholar] [CrossRef]
- Do, D.; Junpirom, S.; Do, H. A new adsorption–desorption model for water adsorption in activated carbon. Carbon 2009, 47, 1466–1473. [Google Scholar] [CrossRef]
- Kaneko, K.; Hanzawa, Y.; Iiyama, T.; Kanda, T.; Suzuki, T. Cluster-mediated water adsorption on carbon nanopores. Adsorption 1999, 5, 7–13. [Google Scholar] [CrossRef]
- Sips, R. On the Structure of a Catalyst Surface. J. Chem. Phys. 1948, 16, 490–495. [Google Scholar] [CrossRef]
- Jeppu, G.P.; Clement, T.P. A modified Langmuir-Freundlich isotherm model for simulating pH-dependent adsorption effects. J. Contam. Hydrol. 2012, 129–130, 46–53. [Google Scholar] [CrossRef]
- Hettema, H. The unity of chemistry and physics: Absolute reaction rate theory. Int. J. Philos. Chem. 2012, 18, 145–173. [Google Scholar]
- Rudziński, W.; Borowiecki, T.; Dominko, A.; Pańczyk, T. A New Quantitative Interpretation of Temperature-Programmed Desorption Spectra from Heterogeneous Solid Surfaces, Based on Statistical Rate Theory of Interfacial Transport: The Effects of Simultaneous Readsorption. Langmuir 1999, 15, 6386–6394. [Google Scholar] [CrossRef]
- Jaroniec, M.; Bräuer, P. Recent progress in determination of energetic heterogeneity of solids from adsorption data. Surf. Sci. Rep. 1986, 6, 65–117. [Google Scholar] [CrossRef]
- Khalfaoui, M.; Knani, S.; Hachicha, M.; Lamine, A. New theoretical expressions for the five adsorption type isotherms classified by BET based on statistical physics treatment. J. Colloid Interface Sci. 2003, 263, 350–356. [Google Scholar] [CrossRef]
- Burneau, A.; Lepage, J.; Maurice, G. Porous silica-water interactions. I. Structural and dimensional changes induced by water adsorption. J. Non-Cryst. Solids 1997, 217, 1–10. [Google Scholar] [CrossRef]
- Ojeda-López, R.; Pérez-Hermosillo, I.J.; Marcos Esparza-Schulz, J.; Cervantes-Uribe, A.; Domínguez-Ortiz, A. SBA-15 materials: Calcination temperature influence on textural properties and total silanol ratio. Adsorption 2015, 21, 659–669. [Google Scholar] [CrossRef]
- Le Grange, J.D.; Markham, J.L.; Kurkjian, C.R. Effects of surface hydration on the deposition of silane monolayers on silica. Langmuir 1993, 9, 1749–1753. [Google Scholar] [CrossRef]
- Grün, M.; Unger, K.K.; Matsumoto, A.; Tsutsumi, K. Novel pathways for the preparation of mesoporous MCM-41 materials: Control of porosity and morphology. Microporous Mesoporous Mater. 1999, 27, 207–216. [Google Scholar] [CrossRef]
- Sayari, A.; Han, B.H.; Yang, Y. Simple Synthesis Route to Monodispersed SBA-15 Silica Rods. J. Am. Chem. Soc. 2004, 126, 14348–14349. [Google Scholar] [CrossRef]
- Mikšík, F.; Miyazaki, T.; Inada, M. Detailed investigation on properties of novel commercial mesoporous silica materials. Microporous Mesoporous Mater. 2019, 289, 109644. [Google Scholar] [CrossRef]
- Galarneau, A.; Cambon, H.; Di Renzo, F.; Fajula, F. True Microporosity and Surface Area of Mesoporous SBA-15 Silicas as a Function of Synthesis Temperature. Langmuir 2001, 17, 8328–8335. [Google Scholar] [CrossRef]
- Giraldo, L.; Rodriguez-Estupiñán, P.; Moreno-Piraján, J.C. Isosteric Heat: Comparative Study between Clausius–Clapeyron, CSK and Adsorption Calorimetry Methods. Processes 2019, 7, 203. [Google Scholar] [CrossRef]
- Ng, E.P.; Mintova, S. Nanoporous materials with enhanced hydrophilicity and high water sorption capacity. Microporous Mesoporous Mater. 2008, 114, 1–26. [Google Scholar] [CrossRef]


© 2020 by the authors. Licensee MDPI, Basel, Switzerland. This article is an open access article distributed under the terms and conditions of the Creative Commons Attribution (CC BY) license (http://creativecommons.org/licenses/by/4.0/).