Article

How Much Electricity Sharing Will Electric Vehicle Owners Allow from Their Battery? Incorporating Vehicle-to-Grid Technology and Electricity Generation Mix

1
Department of Industrial Engineering, College of Engineering, Yonsei University, 50 Yensei-Ro, Seodaemun-gu, Seoul 03722, Korea
2
Department of Industrial and Management Systems Engineering, Kyung Hee University, 1732 Deogyeong-daero, Giheung-gu, Yongin, Gyeonggi 17104, Korea
*
Author to whom correspondence should be addressed.
Energies 2020, 13(16), 4248; https://doi.org/10.3390/en13164248
Submission received: 11 July 2020 / Revised: 9 August 2020 / Accepted: 11 August 2020 / Published: 17 August 2020
(This article belongs to the Special Issue Smart Electric Vehicles: Optimization, Security and Privacy Issues)

Abstract

:
Global trends and prospects of environmentally friendly transportation have helped to popularize electric vehicles (EVs). With the spread of EVs, vehicle-to-grid (V2G) technology is gaining importance for its role in connecting the electricity stored in the battery of EVs to a grid-like energy storage system (ESS). Electricity generation mix and battery for V2G energy storage have a decisive effect on the stabilization of a V2G system, but no attempt has been made. Therefore, this study analyzes consumer preference considering the electricity generation mix and battery for the V2G. We conduct a conjoint survey of a 1000 South Koreans and employ the multiple discrete-continuous extreme value model. The results show that drivers prefer plug-in hybrid- and battery EVs to other vehicles. Additionally, findings show that driver’s utility changes at 27.9% of the battery allowance for V2G system and it becomes positive after 55.7%. Furthermore, we conduct a scenario analysis considering the electricity generation mix (more traditional vs. renewable) and battery allowance. Based on this analysis, we suggest some policies and corporate strategies to support the success of the V2G market depending on energy policies and battery allowance level.

1. Introduction

Generally, electricity is more difficult to store than to generate. Thus, many electric power companies around the world generate excessive power to prepare for power outages and blackouts. To reduce this inefficiency, pumped-storage power plants have been used to store electricity in the past, but their growth has been limited by geographical restrictions, environmental issues, and low efficiency [1,2,3]. Among the various definitions of energy efficiency, the round-trip efficiency, which is the ratio of energy put in (in MWh) to energy retrieved from storage (in MWh), is the most commonly used definition. According to this definition, pumped-storage power plants usually range from 65% to 80% and ESS from 75% to 90% [4]. In recent years, energy storage systems (ESSs) based on lithium-ion batteries have come into the global spotlight because of their efficiency comparable to that of pumped-storage power plants; additionally, ESSs can be built in multiple locations. Furthermore, the emergence of electric vehicles (EVs), which are vehicles that use electric energy from a grid-connected electricity source [5], has contributed to the growth of the ESS market.
Currently, EVs are recognized as eco-friendly forms of transportation because they emit less greenhouse gas and air pollutants than conventional internal combustion engine vehicles (ICEVs). Generally, EVs are classified into battery electric vehicles (BEVs), fuel cell electric vehicles (FCEVs), and plug-in hybrid electric vehicles (PHEVs), depending on the energy source for driving. While the BEV connects to the power grid and stores electricity in the battery, the FCEV uses hydrogen-powered fuel cells to produce electricity. PHEV uses both electricity and petroleum-based fuels to run the machine [6]. In this study, we classify BEVs and PHEVs as EVs because they are affected by the power grid system. Additionally, some studies suggest that EVs have long-term economic feasibility because of their low maintenance costs, despite their high initial purchase costs [7,8,9,10,11]. Thus, major countries, such as the United States of America, European Union (EU), Japan, and China, have implemented various support policies for purchasing EVs. With this trend, EVs are likely to replace existing ICEVs and increase the demand for electricity. The International Energy Agency (IEA) [12] reported that the total number of EVs in the world exceeded 3 million units; additionally, in 2017, the electricity demand from EVs was 54 TWh, registering an increase of 20% over the previous year. When electricity demand is high or charging requests are frequent, there may be an imbalance between electricity supply and demand. To remedy these possible drawbacks to adoption, the synchronization of EV with grid technology is presented as a promising advantage, with vehicle-to-grid (V2G) technology being the representative example.
V2G technology is defined as a system capable of controllable bidirectional energy flow between a vehicle and the electrical grid [13]. This smart technology can transfer electrical load from areas of high demand to areas of low demand and can help adjust the power generation- and investment demands for the power grid. For example, the daily mean time of passenger car use in South Korea is only about 2 h, which means that EVs are parked more than 90% of the day. If these parked EVs function as an ESS, then the beneficial effects cannot be ignored. Conversely, through V2G technology, the administrator of the grid can partially detach the recharging EVs from the grid when the grid capacity is saturated. Individual consumers can also receive real-time power transaction data via advanced metering equipment and optimize their plans for using and charging EVs. Additionally, EVs with V2G technology can function as movable distributed power sources and may reduce the construction cost of long-distance transmission lines.
Many of the benefits of V2G technology will appear with the widespread use of EVs and electric vehicle supply equipment (EVSE). Specifically, an EV is a small-sized ESS that holds broad range of kilowatts hour (kWh) of electricity per unit (see Appendix A). Despite the small capacity, if the number of EVs reaches a certain threshold, it will be possible to transmit hundreds of thousands of units of power to the grid at one time. Thus, the diffusion of EVs is essential for the V2G system. An EVSE can be categorized based on the various types of technology and use. To enhance people’s understanding, this study defines the EVSE as a system that allows bidirectional transmission of power between the power grid and the PHEV or EV. For a more precise definition and classification of EVSE, refer to the paper by Noel et al. [14]. Therefore, the Korean government is trying to increase EV adoption and disseminate V2G technology through various policies. For example, the Ministry of Trade, Industry, and Energy [15] aims to distribute 1.14 million EVs by 2022; it also offers incentives to individual consumers, such as subsidies, tax exemptions, and a reduction in highway toll fees and parking fees. Additionally, the Korean government plans to supply 1500–1800 quick chargers and 12,000 destination chargers annually from 2019 to 2022. Simultaneously, the government will enhance the convenience of EV charging by increasing the maximum capacity of quick chargers, build a system that will accommodate the use of all chargers with one membership card, and mandate the installation of chargers in new apartments. In terms of V2G policies, the government aims to proceed with the demonstration of bi-directional charging technology and an integrated V2G operation system. To this end, the government plans to develop on-board chargers for cost reduction; it also aims to establish test beds for the smart grid service to observe EV usage patterns [15]. Regardless of these policy efforts, there is a lack of research on the impact of EVs and V2G technology on power demand and on the amount of electricity that consumers will allow for V2G energy storage. To address this issue, we analyze the choice and usage behavior of potential EV consumers to grasp the potential magnitude of new distributed energy sources in order to get a proper response to changes in the grid system. Hence, we conduct a conjoint survey and use a multiple discrete-continuous extreme value (MDCEV) model to estimate the consumer utility function of potential consumers. Furthermore, we also conduct a scenario analysis, assuming a variation in the electricity generation mix and battery allowance for V2G energy storage. Figure 1 describes the comprehensive research framework of this study.
The remainder of the study is organized as follows. Section 2 contains a literature review related to V2G technologies and systems. Section 3 discusses the model used in this study and the survey data from our choice experiment. Section 4 provides the estimation and simulation results policy implications and limitations of this study. Section 5 presents the conclusions of this study.

2. Literature Review

The state-of-the-art V2G technologies and their prospects are summarized by Sovacool et al. [16]. Through a socio-technical perspective review, they classify the V2G literature into technical, financial, socio-environmental, and behavioral categories. They also summarize the promises and challenges for each research category and suggest future research. According to Sovacool et al. [16], studies on V2G technology focus largely on its technical aspects, such as facilitating the load balancing of a V2G system or improving the electricity efficiency. Studies investigating consumer acceptance and driver behavior within V2G systems cover both economical and environmental benefits as acceptance factors, however only a limited number of them cover the institutional and policy aspects, for instance, the electricity generation mix. Additionally, studies on consumer acceptance mainly analyze the attributes of EV and V2G technology, not including battery allowance between the EV and power grid. Table 1 displays a summary of previous studies.
Most of the studies on consumer aspects of V2G technology overlap with those conducted on EVs because an EV is a key component of V2G systems. These studies analyze adoption factors of EVs in different ways. Egbue and Long [18], Hoen and Koetse [20], Koetse and Hoen [22], and Hidrue and Parsons [27] noted that a preference for alternative fuel vehicles (AFVs) is affected by battery performance. Limited driving range due to the current state of technology may lead to high consumer uncertainty, so Ziegler [19], Li et al. [35], Moon et al. [41], and Noel and Sovacool [43] regarded accessibility and the number of charging stations as important factors for EV adoption. Hoen and Koetse [20], Koetse and Hoen [22], Moon et al. [41], and Sachan and Adnan [42] indicated that EVSE can also significantly affect EV diffusion. The characteristics of EVSE, such as recharge time and cost, are considered important because they are directly connected to consumer convenience. A V2G system’s characteristics, including the available time for power sales, residual power, and mandatory connection time, also affect consumer acceptance of EVs.
From the economical perspective, some studies examined the feasibility of the V2G system in various ways. De Gennaro et al. [26] identified the market profitability of a parking location in terms of EVs’ energy demand, and Landi et al. [40] optimized charging locations and schedule considering energy purchase costs and operation costs. These two studies analyzed market profitability based on geographical factors within the framework of EVs’ energy demand. Suman et al. [32] simulated an optimal EV charging schedule by considering its revenue gains and cost savings based on real electricity prices and load data. Honarmand et al. [21] proposed a smart management and scheduling model for a large number of EVs parked in urban parking lots. The proposed model covers financial benefits for EV owners. Freeman et al. [33] estimated the annual arbitrage savings through V2G participation using the Tesla Model S. Gough et al. [34] evaluated the potential of each EV to earn income from energy supplied to a commercial building.
To investigate consumer acceptance of V2G technology, studies discuss other key factors are institutional and policy aspects, such as incentives to EV consumers. These incentives include subsidies provided to EV consumers, emissions-based vehicle taxes, and benefits, including construction of charging infrastructure, free parking, and permission to use bus lanes. Shin et al. [44] investigated how the introduction of EVs influences the usage of existing cars by using a conjoint survey and mixed MDCEV model—a methodology similar to this study. They analyzed the impact of government policies to promote the usage of EVs. Promotional policies related to the introduction of EVs improve social welfare and increase the EV purchase rate. The electricity generation mix is another energy policy affecting consumer behavior. Most studies related to the energy mix analyze the environmental impact of the electric generation mix and cost-optimization. Woo et al. [36] noted that the introduction of EVs will increase the total amount of electricity used; hence, the environmental impact of EVs depends on the electricity generation mix. Certain studies analyze greenhouse gas emissions while considering the vehicle type, carbon intensity of the grid, charging infrastructure and patterns, and electricity generation resources [31,36]. Ahn et al. [25] analyzed an optimal energy mix that allocates energy sources, by considering the cost and risk for sustainable development. Huh et al. [28] analyzed customers’ perceptions of electricity generation and showed that customers are willing to pay more to increase the renewable energy ratio. Additionally, Choi et al. [38] showed that the electric generation mix affected consumer preferences for vehicles. However, these studies did not focus on the consumer preference for both battery allowance and electricity generation mix, which is one of the important factors when analyzing a V2G system.

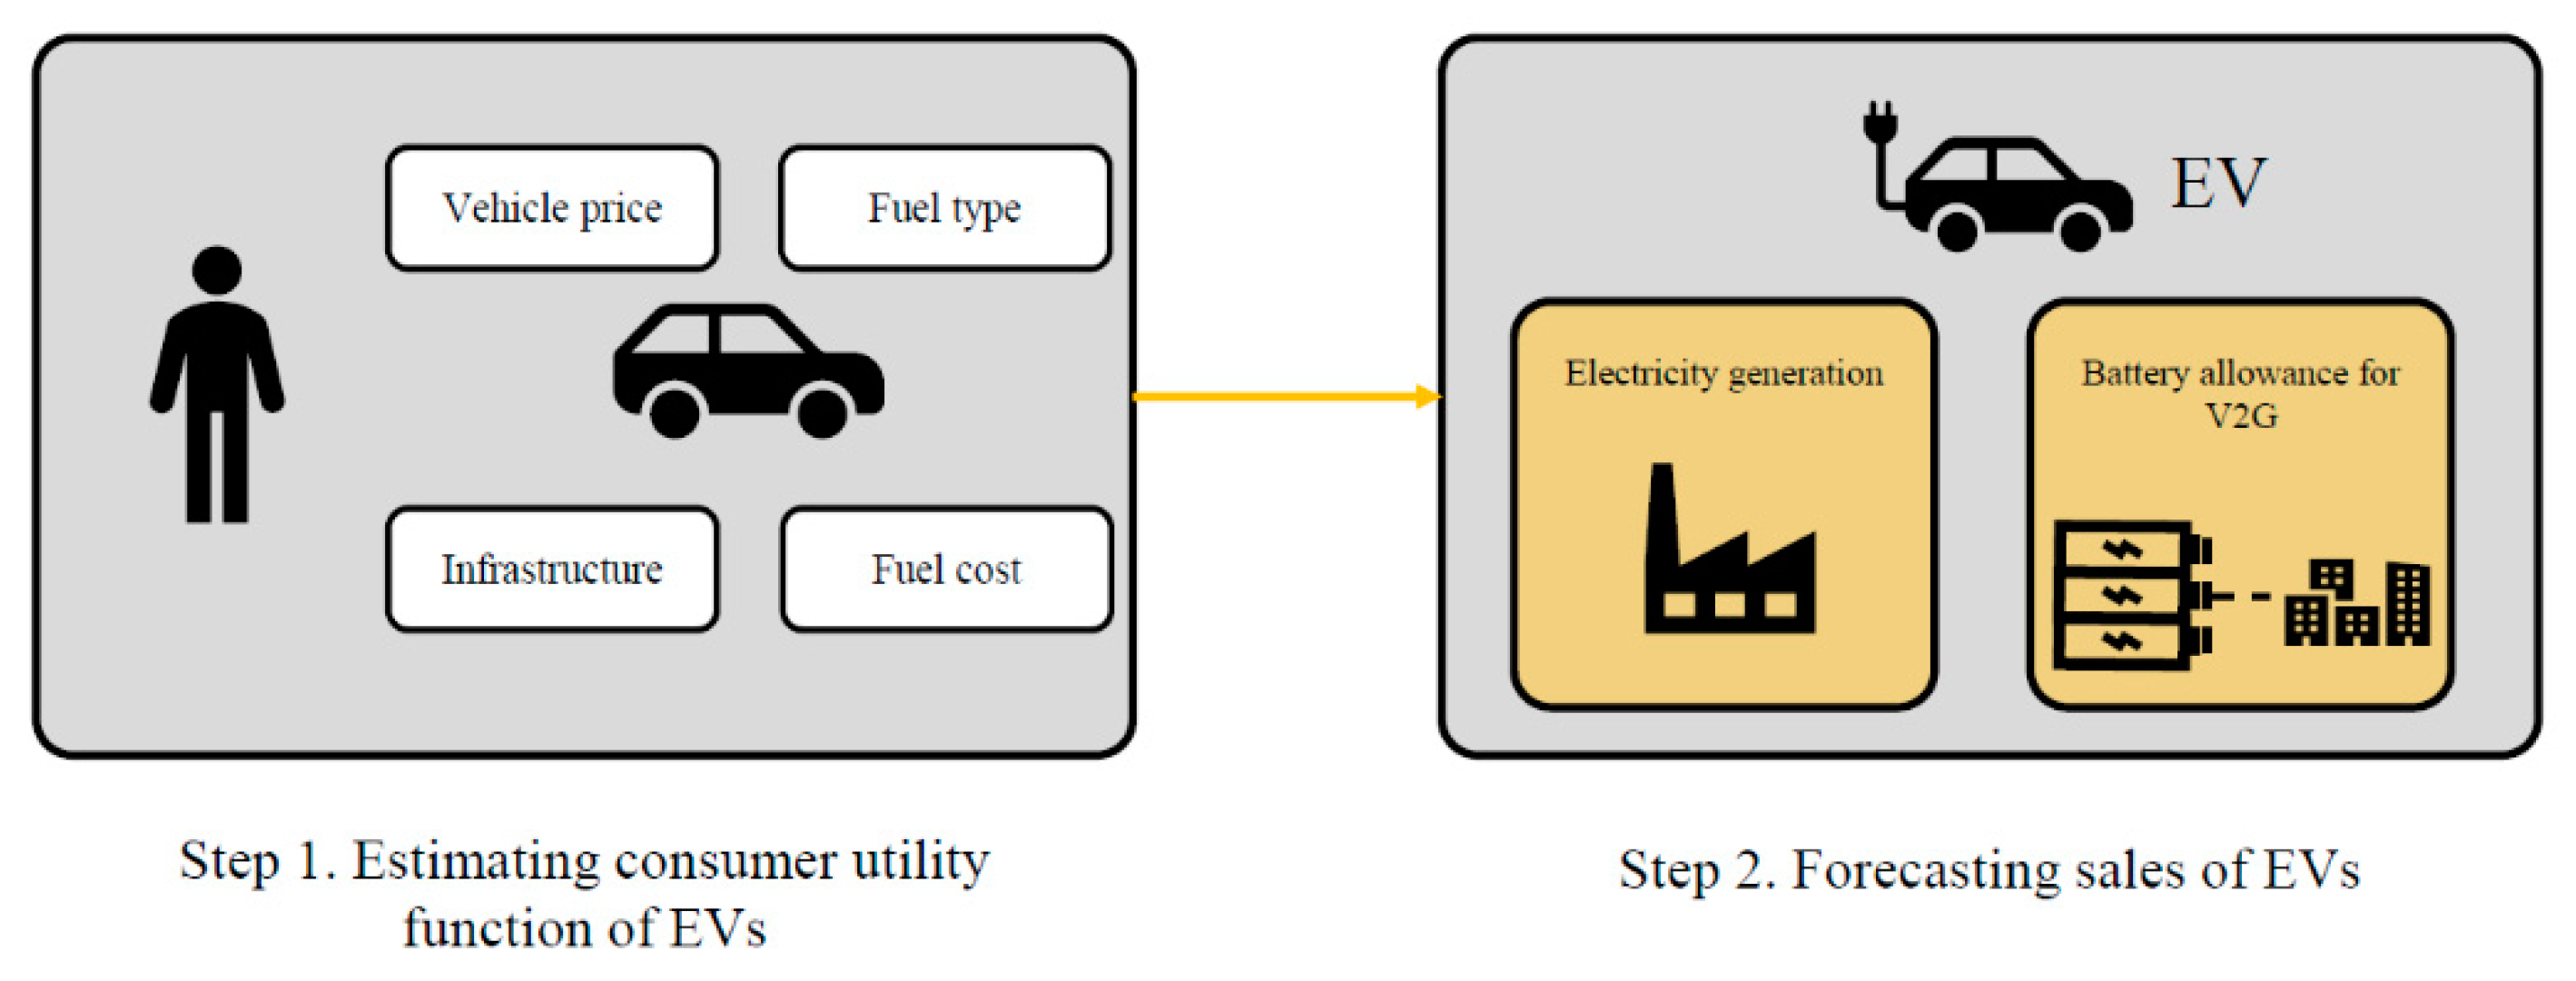
3. Methodology and Data

3.1. Mixed MDCEV Model

The MDCEV model based on the random utility theory (RUM) can be used to analyze consumers’ multiple discrete choices and continuous choices simultaneously; traditional discrete choice models, such as multinomial logit or probit, deal only with discrete choice situations. Bhat [45] assumed that the direct elastic utility of substitution devised by Kim et al. [46] has an extreme value type 1 error; the author also devised an intuitive and simple computational econometric model, termed as MDCEV. In this study, we employ a mixed MDCEV model to identify the heterogeneity of consumer preferences by assuming the distribution of each parameter [44,45,47,48].
The MDCEV model defines the utility function when the n th consumer chooses j of K alternatives and uses m j for each j alternative as follows:
U n ( m 1 , , m J , 0 , , 0 ) = j = 1 K Ψ ( x j ) ( m j + γ ) α j ,
where K denotes the number of alternatives in an alternative set and Ψ ( x j ) represents the baseline utility from choosing the j th alternative that has attribute x j . The variable γ is a translation parameter used to determine whether an interior or corner solution exists, and α j is a satiation parameter reflecting the degree of diminishing marginal utility. To satisfy the law of diminishing marginal utility, where 0 < α j < 1 , we define 0.
The baseline utility, Ψ ( x j ) , is defined as an exponential function with a stochastic term, as shown in Equation (2). By combining Equations (1) and (2), we can obtain Equation (3):
Ψ ( x j , ε j ) = Ψ ( x j ) e ε j = exp ( β x j + ε j ) ,
U = j = 1 K [ exp ( β x j + ε j ) ] ( m j + γ ) α j .
In Equation (3), α j and γ are bounded in exponential form. Due to the interdependence of these two parameters, one must be fixed for statistical estimation [45]. Regarding the vehicle usage pattern, a situation in which a particular vehicle is not used at all is possible. Therefore, we allowed for the corner solution by assuming that all alternatives have the same γ .
Consumers maximize their utility by allocating the optimal usage within the total amount of usage under budget constraints, as in Equation (4):
j = 1 K m j = M ,
here, m j represents the usage of the j th alternative and M is the total amount of usage. Thus, we can find the optimal choice and usage patterns by solving the utility maximization problem from Equations (3) and (4) via the Lagrangian method and Kuhn-Tucker condition [45,47]. The Lagrangian function for the maximization is as follows:
L = j [ exp ( β x j + ε j ) ] ( m j + γ ) α j λ [ j = 1 K m j M ] ,
where λ is the Lagrangian multiplier associated with the usage constraint. The Khun–Tucker first-order conditions for the optimal usage allocation (the m j * values) are given by:
[ exp ( β x j + ε j ) ] α j ( m j * + γ ) α j 1 λ = 0 ,   if   m j * > 0 ,   j = 1 , 2 , , K [ exp ( β x j + ε j ) ] α j ( m j * + γ ) α j 1 λ < 0 ,   if   m j * = 0 ,   j = 1 , 2 , , K
A consumer’s optimal choice and usage pattern are calculated as follows:
P ( m 2 * , m 3 * , , m J * , 0 , 0 , 0 ) = [ i = 1 J c i ] [ i = 1 J 1 c i ] [ i = 1 J e V i ( j = 1 K e V j ) J ] ( J 1 ) ! ,
where c i = 1 α i m i * + γ and V j = β x j + ln α j + ( α j 1 ) ln ( m j * + γ ) . If we assume M = 1 , α j = 1 , and m i = 0 for i j —that is, the situation of choosing only one alternative—then the choice probability of the MDCEV model will be equal to that of the multinomial logit model. We thus confirm that the MDCEV model is an extended logit model incorporating continuous variables.
In this study, we use the mixed MDCEV model, taking into account the distribution of each parameter. Based on the mixed MDCEV model, the choice probability of the n th consumer is given as follows:
P n ˜ = { [ i = 1 I c i ] [ i = 1 I 1 c i ] [ i = 1 I e V i ( i = 1 I e V j ) J ] ( I 1 ) ! } f ( ν n | θ ) d ν n .
To calculate the choice probability of consumers, we use the Bayesian estimation method instead of the classical maximum likelihood estimation. The Bayesian estimation method avoids the initial problem and assures consistent and efficient results under a less restrictive condition than the classical approach [49,50,51]. Additionally, we can interpret the result from both Bayesian and classical perspectives [52].

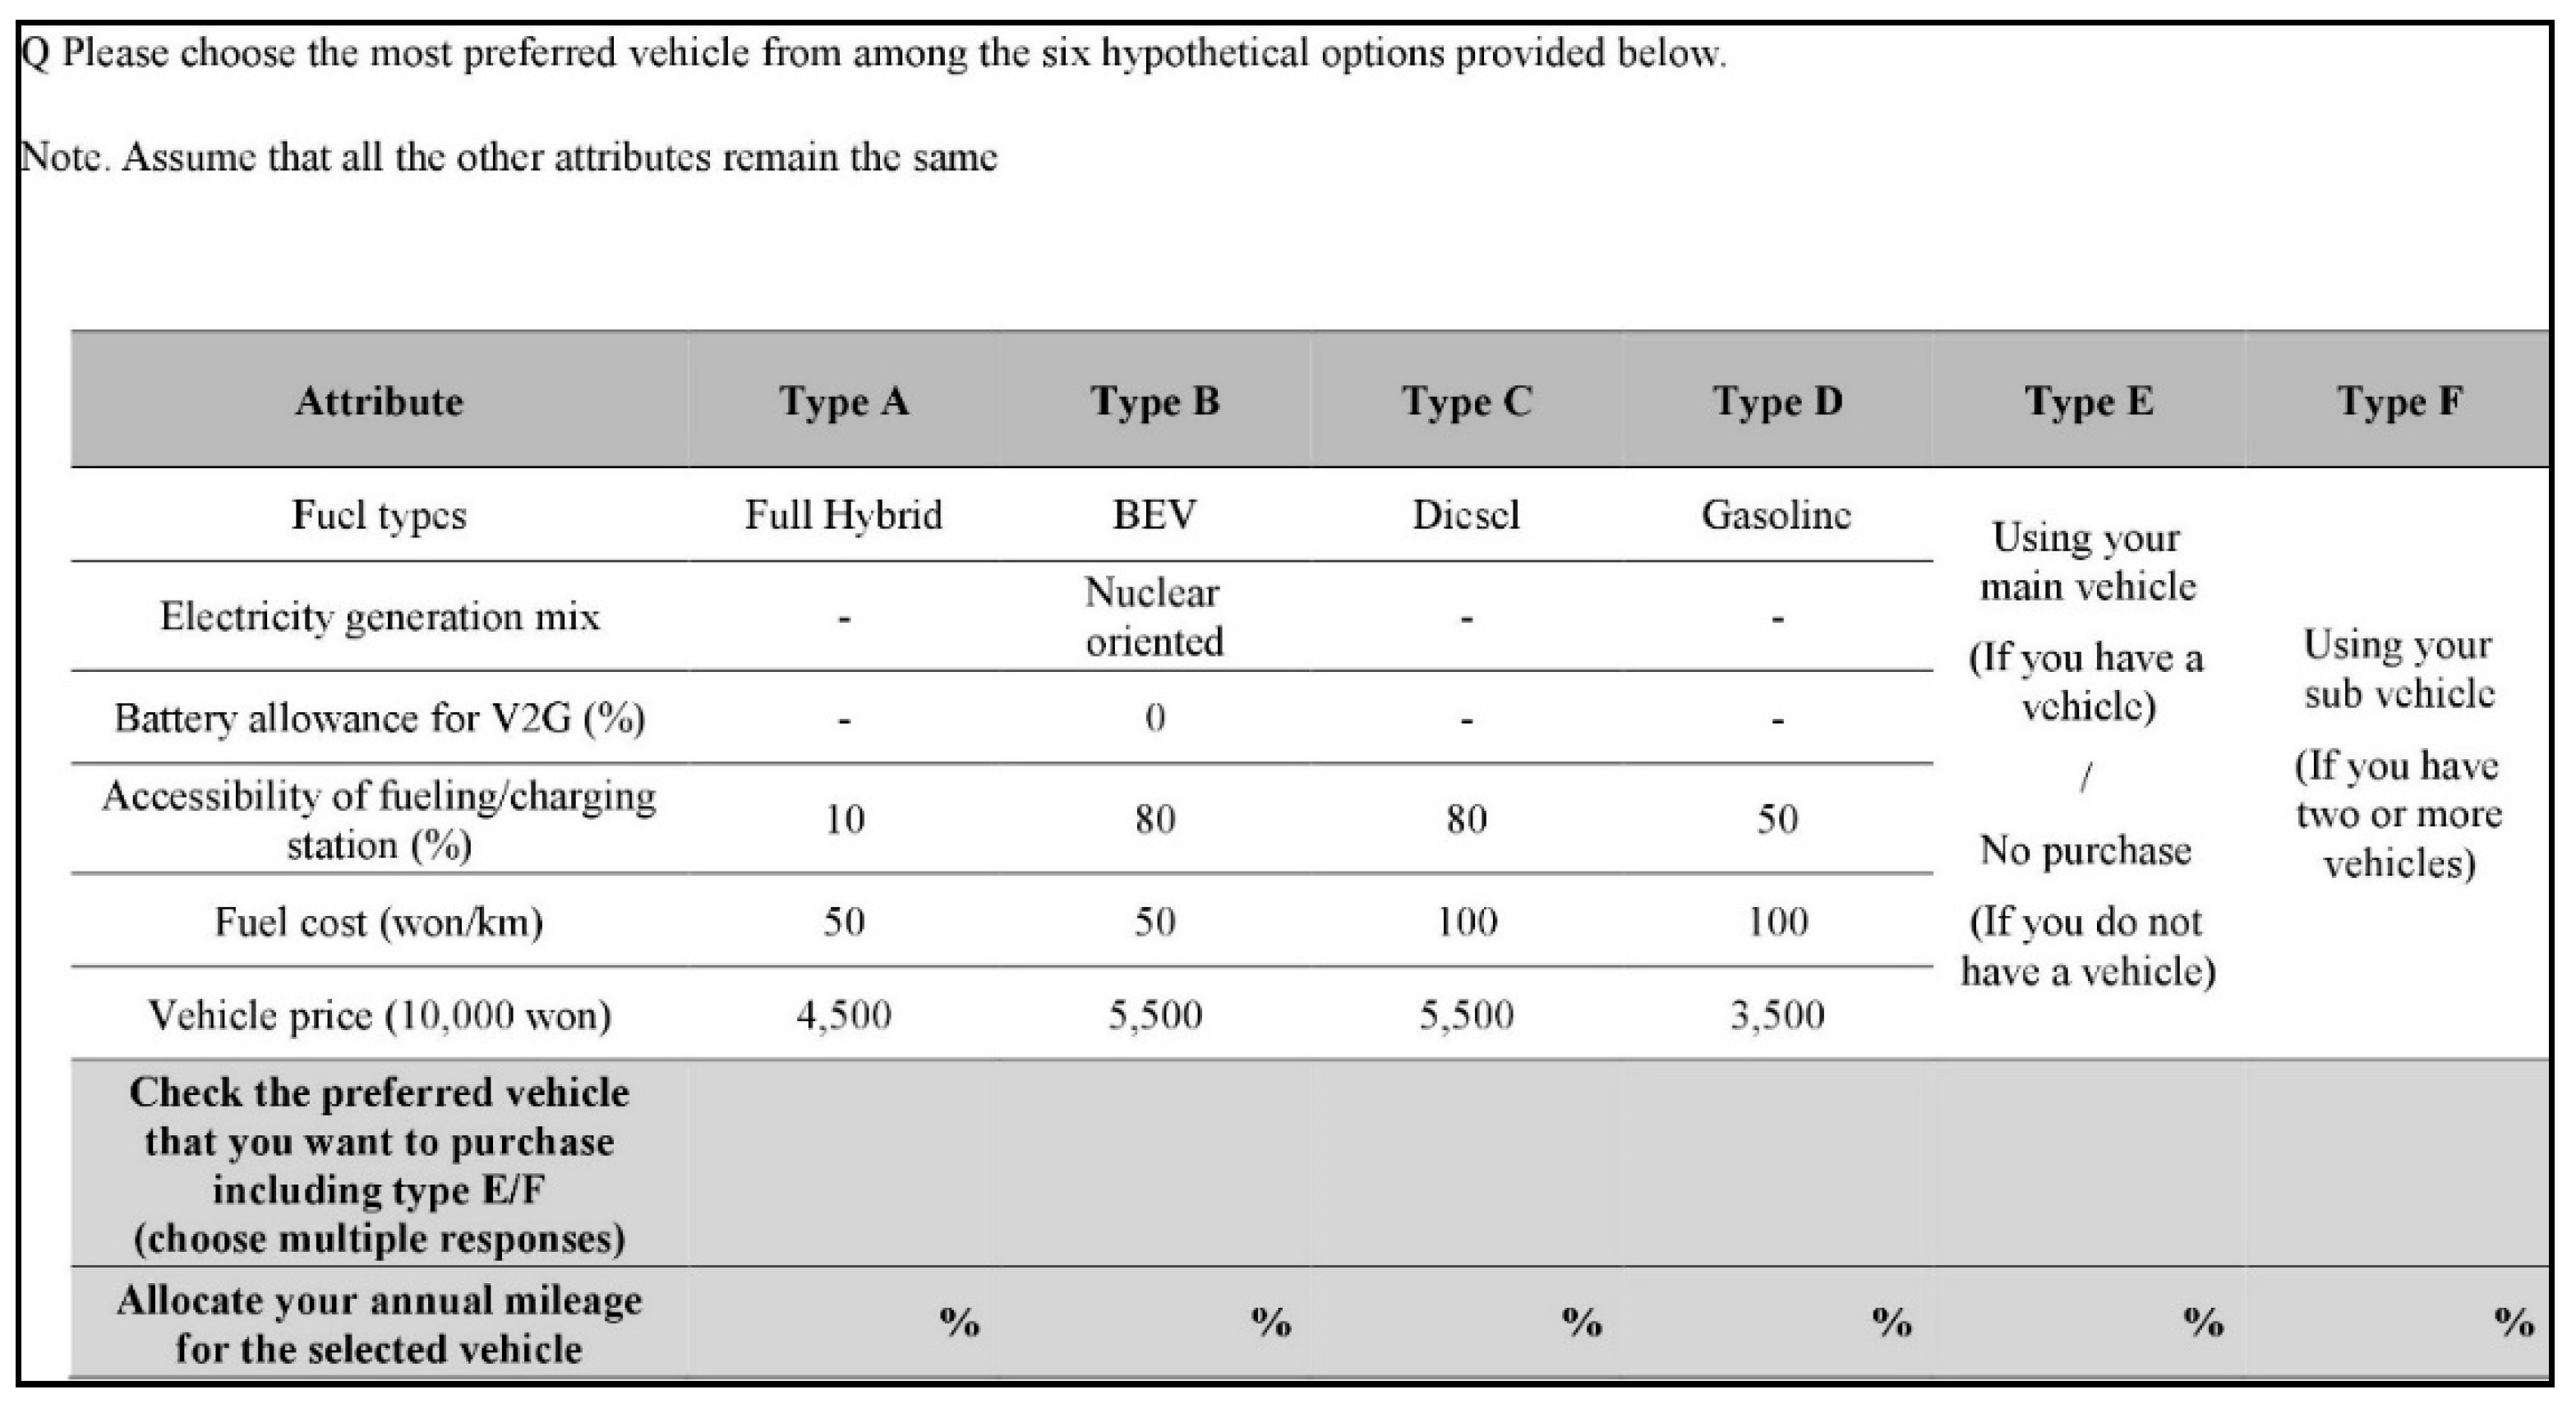
3.2. Choice Experiment and Data

Since the market share of EVs remained near 0% in South Korea [53], there is limited revealed preference data with regards to EVs, battery allowance, and energy mix. Therefore, we conduct a choice experiment to collect and analyze the stated preference data about the choice and usage patterns, attitudes toward battery allowance, and energy mix. In the choice experiment, individual respondents select an alternative from a choice set, that is, a set of hypothetical alternatives as a combination of the core attributes [54,55]. Through this real-world-like process, respondents state their preference for the alternatives, and their utility function can be estimated.
Several studies suggest that consumer preference for vehicles is affected by the vehicle class [38,56]. Particularly, the vehicle class is closely related to factors that have a significant impact on vehicle purchases, such as fuel costs and vehicle prices. Furthermore, dealing with all vehicle classes in one choice experiment may not guarantee satisfactory results. Therefore, we chose the mid-sized vehicle class that is representative of the Korean automobile market. Moreover, most PHEVs and BEVs are introduced as mid-sized vehicles in the Korean automobile market and, thus, we believe that the mid-sized vehicle is appropriate for predicting the V2G energy sharing effect. We set the vehicle class to medium-sized sedan, the mainstay of the Korean automobile market. By reviewing previous studies, we also defined the levels of the following four attributes that may affect the adoption of EVs: the fuel type, accessibility of fueling/charging facilities, fuel cost, and vehicle price. The attributes and their levels used in the conjoint survey are shown in Table 2.
Among the key attributes of our analysis, we first consider the fuel type, such as gasoline, diesel, full hybrid, PHEV, and BEV. Full hybrid cars have electric elements to their powertrains but cannot be considered EVs due to the absence of an electric battery. However, PHEVs and BEVs can be driven with electric power from a battery. Here, we determine the feasibility of a vehicle as an ESS, and hence we separate PHEVs and BEVs from full hybrids. Additionally, we consider a mix of four types of electricity generation to generate power for the grid and vehicle, but only for PHEV and BEVs (“electricity generation mix” and “battery allowance for V2G” are limited only to PHEVs and BEVs with built-in batteries).
For the electricity generation mix, it is necessary to analyze the effect of energy mix on the usage patterns of AFVs because the emission factors of EVs are different depending on the electricity generation mix. South Korea has been in an economically vulnerable position to produce natural gas and renewable energy due to lack of natural resources and geographical and environmental factors. Hence, coal and nuclear power have always accounted for a higher percentage of the electricity generation mix in South Korea. As of 2017, South Korea’s electricity generation mix is still weighted toward coal and nuclear power (coal: 46%, nuclear: 31%, LNG: 17%, and renewables: 6%). Nevertheless, with the growing concerns over climate change and the safety of nuclear power, the government plans to increase renewable energy [57]. Since the high density of fine dust and particulate matter pose a serious social problem, the government has implemented air pollution reduction policies to promote energy conversion from coal to LNG [58]. The diffusion of EVs is a prerequisite for V2G commercialization, and social acceptability considering generation mix could play an important role in consumer purchases of EV. Considering these facts, we defined the possible electricity generation mix for PHEVs and BEVs using four types of electricity generation, according to the energy sources; these sources account for more than 95% of the total domestic electricity generation. Table 2 states the detailed percentages of the electricity generation mix by focusing on each electricity source.
Additionally, the battery allowance for V2G adoption is also considered an exclusive attribute for PHEVs and BEVs. While the energy stored in the battery of an EV is connected to the grid, it has a positive industrial effect; however, consumers might not be willing to connect their batteries to the grid. Consumers want to be able to charge their EVs within a short time and do not want battery life to be shortened by repeated charging and discharging. Therefore, we opted to study battery allowance for V2G to determine the appropriate capacity that consumers desire; we explained the meaning of battery allowance for V2G to the survey respondents as Table 2, thus consumer intention to lend electricity to the V2G system was analyzed without any monetary compensation offered to them. We consider the following four battery allowance levels: 0%, 30%, 70%, and 100%.
Next, we consider the accessibility of fueling/charging facilities as the third attribute affecting consumer choice and the usage pattern of automobiles. Generally, EVSEs installed in charging stations and parking lots have a different charging rate. In South Korea, EVSEs at parking lots have a slow charging rate of 3–7 kW, while EVSEs at charging stations have a fast charging rate of 50 kW. This difference in the charging rate can affect the availability of the energy storage of EVs, but here we conducted the survey focusing on the physical view of “accessibility” itself. In the Energy Census 2017 [6], 68% of respondents (including duplicated responses) reported charging-related inconvenience as one of the major drawbacks of EVs, and 46.7% of EV owners regarded the shortage of charging stations as the biggest uncomfortable factor when using charging stations. In fact, many previous studies concluded that accessibility of the charging infrastructure affects the diffusion of EVs [17,41,59,60,61]. The accessibility of charging stations is more important than the maximum mileage especially when the battery is replaceable. Therefore, we consider the following four levels regarding the accessibility of fueling/charging facilities: 10%, 50%, 80%, and 100%.
Many studies found that fuel economy is an important factor in the diffusion of AFVs [44,62,63,64]. Generally, EVs are charged through a direct charging method, and the price depends on the charging speed. Domestically, the price of quick charge is KRW 2759 per 100 km and that of a slow charge is KRW 1132 per 100 km [15] (based on IONIQ, a mid-sized sedan, quick charge takes 30 min from a full discharge to 80% charge, and a slow charge takes 4–5 h from a full discharge to full charge). The green card that consumers can use to buy eco-friendly products offers a 50% discount. Reflecting reality, we assumed that fuel cost has the following three levels: KRW 50, KRW 100, and KRW 150 per kilometer.
The vehicle price is the cost of a mid-sized sedan, excluding premiums and taxes. For mid-sized sedans sold in South Korea in 2017, prices varied based on the brand and fuel type. ICEV prices ranged from KRW 15 million to 25 million, while the price of PHEVs and EVs ranged from KRW 30 million to KRW 50 million. As a result, we assume the following four levels of vehicle prices: KRW 25 million, KRW 35 million, KRW 45 million, and KRW 55 million.
By combining all the attributes and levels listed in Table 2, we get 1680 possible alternatives, which would be very burdensome to respondents. Thus, we employ a fractional factorial design to reduce the number of alternatives, using the assumed orthogonality of each attribute. We obtain 32 alternatives and divide them into eight choice sets of four alternatives and the “no choice” alternatives. The “no choice” alternative means that respondents who do not have a vehicle will not purchase one, and respondents who have ownership of a vehicle will keep that vehicle. If a respondent has more than two vehicles, then the respondent can select the “no choice” alternative; it implies that the respondent will keep both the main and secondary vehicles or only one of them. In the survey, respondents were asked to choose the preferred alternatives allowing multiple choices, among the six alternatives (four vehicles and two no-choice) given in each choice set. Subsequently, respondents were asked how to distribute the percentage of the annual mileage for the selected alternatives. To reduce the respondent burden and survey time, we divided respondents into two groups and provided half of the eight choice sets to each group. Figure 2 presents an example of a choice set used in the questionnaire.
We conducted a pilot test on 602 online respondents to confirm that respondents understand our questionnaire. Subsequently, we conducted the main conjoint survey between 5 March 2018 and 30 March 2018. The main survey was conducted by Gallup Korea, which is a specialized market research company. We used stratified sampling based on gender and age to construct a sample that most closely resembles the actual demographic. A total of 1000 people (in the empirical analysis, we exclude 46 respondents who use other alternative fuel vehicles that are not shown in our study, such as liquefied petroleum gas (LPG) and FCEVs. As a result, a total of 954 respondents were used for the estimation; we also analyzed the responses of 618 drivers), aged 19 to 69 years, in major South Korean metropolises participated in the main survey, and the survey was conducted by face-to-face interviews.
The survey consisted of three stages. In the first stage, we asked preliminary questions about respondents’ vehicle usage patterns, including whether they were the driver or a passenger, the purpose for using vehicles, the average cost of fuel per month, and information on the currently owned vehicle. In the next stage, a brief description of the EV and the attributes and levels of the EV were explained by the interviewer, and the conjoint survey was conducted. In the final stage, we asked some questions about the demographic characteristics of the respondents, such as gender, age, education level, and household income. Table 3 summarizes the demographic characteristics of the 1000 respondents.

4. Results and Analysis

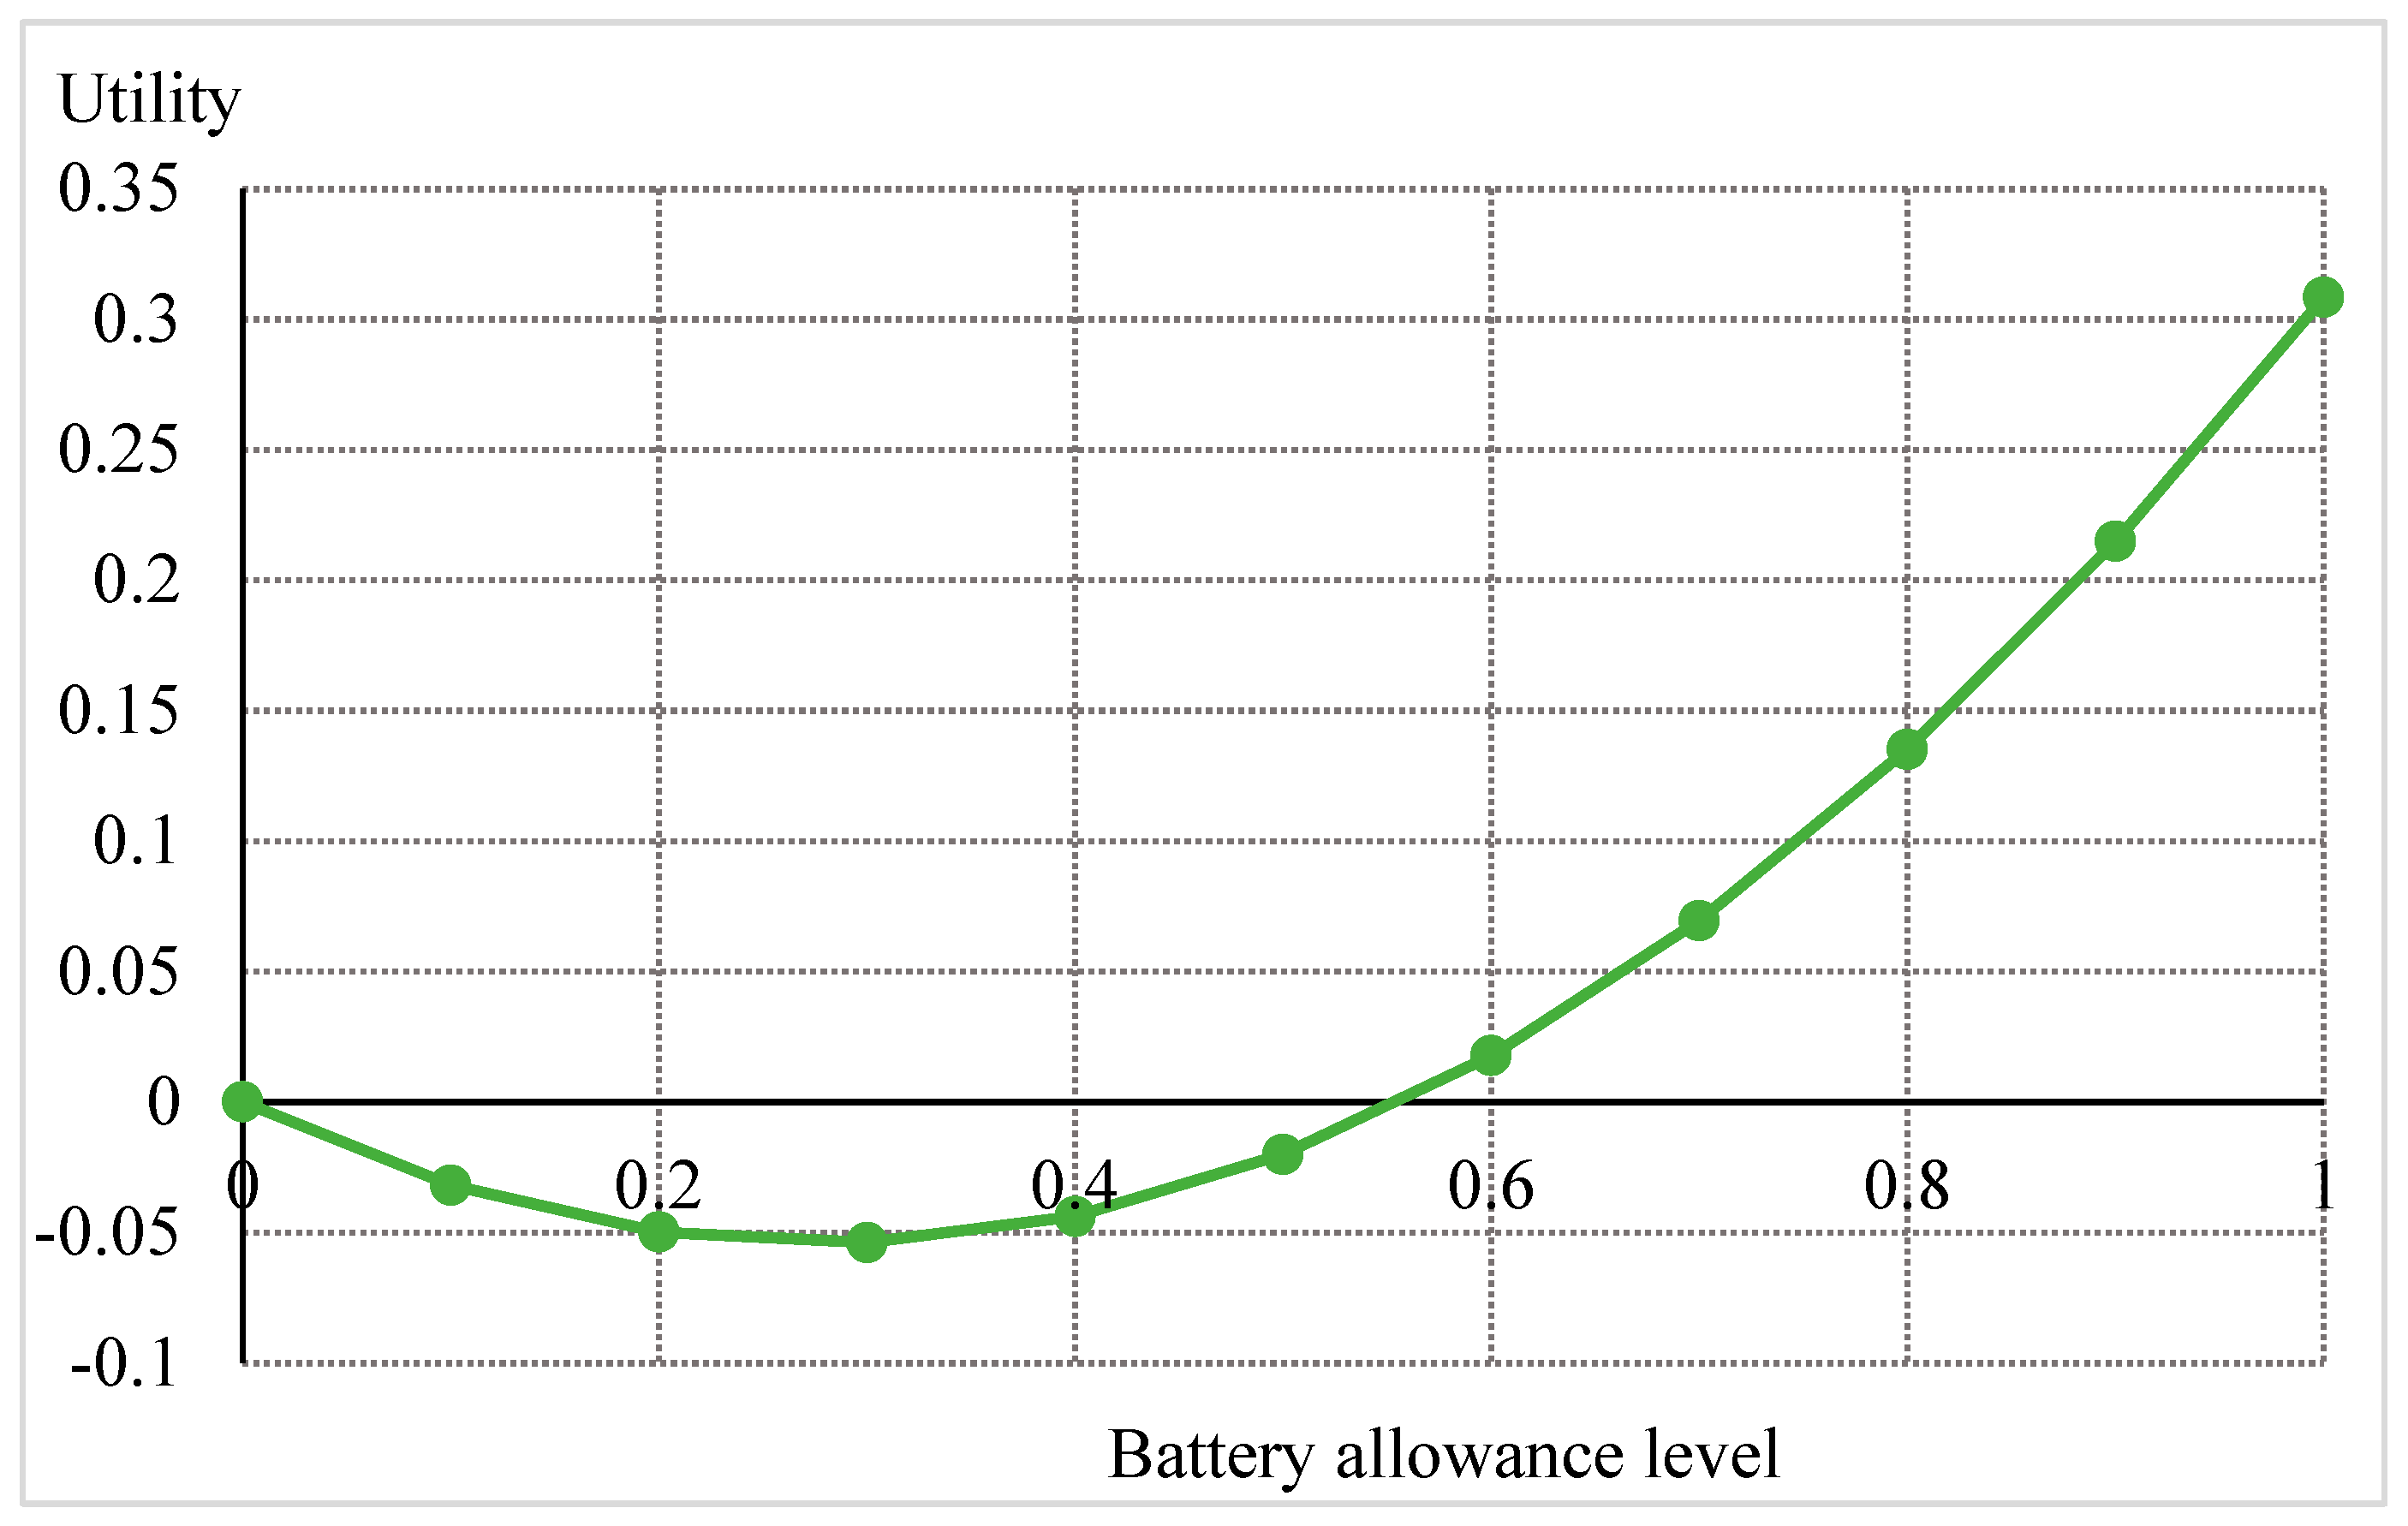
4.1. MDCEV Estimation Results

To estimate the coefficients of the dummy variables in the baseline utility, the fuel type “gasoline” is set as the reference; hence, coefficients for non-gasoline fuel types represent the preference for that fuel relative to gasoline. Additionally, the electricity generation mix and battery allowance for V2G energy storage are included in the utility function as interaction terms with the dummy variable “PHEV or BEV.” Here, the coal-oriented electricity generation mix type is set as the reference; hence, the coefficients for other electricity generation mix types represent a preference for that electricity generation mix type relative to that for coal. Additionally, we set three continuous variables for nuclear, LNG, and renewable energy sources and estimate parameters for the percentage change in each energy source. The coefficient of battery allowance for V2G energy sharing, its squared term (in this study, we did not have any prior consumer information about the battery allowance level for V2G. We thus assumed a consumer utility function with a quadratic form of the battery allowance variable), accessibility of fueling/charging stations, fuel cost, and vehicle price are set as continuous variables, and the reference measurement units for these variables are 100%, (100%)2, 100%, KRW 100 per kilometer, and KRW 10,000,000, respectively. The coefficients of fuel cost and vehicle price are assumed to have log-normal distributions because the effects of these attributes are expected to have negative utility. The remaining variables are assumed to have normal distributions. The variables under satiation parameters are assumed to have normal distributions, except for the fuel cost, which is assumed to have a log-normal distribution.
We use the Bayesian estimation method to estimate the baseline utility and satiation parameters of the MDCEV model. Among the 20,000 draws generated by Gibbs sampling, we exclude the first 10,000 draws and use every 10th draw of the remaining 10,000 draws to estimate parameters so as to remove the initial value effect [50,52]. Table 4 presents the mean and variance of each baseline utility and satiation parameter obtained through 2000 draws from the estimated parameter distributions for all respondents and the driver group.
The results for all respondents for the baseline utility estimations of fuel type indicate that consumers prefer gasoline the most and diesel the least. There is no significant difference in consumer preference among gasoline, PHEV, and BEV because the mean values for PHEV and BEV are not significant. However, the estimation results for the driver group show that drivers prefer BEV, PHEV, full hybrid, gasoline, and diesel engines, in a descending order. However, the mean value for diesel is not significant, and hence the drivers had no distinguishable preference between gasoline and diesel.
Meanwhile, the estimation results for the electricity generation mix indicate that consumers prefer the LNG-oriented mix only because the other types of electricity generation mix are not significant. Drivers prefer the renewable-oriented mix the most, followed by the LNG-oriented mix. The nuclear-oriented mix is not preferred by driver groups. This result can be interpreted to mean that people who drive prefer a more environmentally friendly means of power generation than general consumers.
The mean values for battery allowance and its squared term enable us to capture a rough form of consumer preference for battery allowance for V2G energy sharing. The utility of all respondents increases with an increase in the battery allowance for V2G, as only the quadratic term is significant. On the other hand, the estimated utility of drivers is different from that of all respondents. For a more detailed explanation, we plotted a utility associated with the corresponding battery allowance level. Figure 3 presents the utility of drivers by the level of battery allowance for V2G.
From Figure 3, we can find that the utility of drivers for battery allowance for V2G seems to be convex, with the minimum value at 27.9% of the supply capacity. In other words, we can determine the change in the consumer utility structure for battery allowance. Additionally, when the battery allowance is less than 55.7%, the utility is always smaller than the utility when drivers do not provide electricity for V2G at all. Therefore, we suggest that at least 55.7% of the battery allowance can guarantee potential EV consumer’s benefits. Interestingly, this result suggests that consumers are reluctant to lend electricity below a certain level, and prefer to lend above a certain level; it can serve as a good indicator for government policy to determine an appropriate V2G capacity and incentives for V2G.
The estimation results of the accessibility of fueling/charging stations show that consumer utility increases with an increase in the accessibility of fueling/charging facilities. Similarly, the positive preference of the driver group for charging and fueling implies that driving experience has a huge effect on the apprehensions regarding a complete exhaustion of gas or energy. The mean values for fuel cost and price are both negative, suggesting that the utility decreases when the fuel cost and vehicle price increase, which coincides with the general economic theory.
The estimation results of the satiation parameters are all significant and vary by fuel type. Therefore, the MDCEV model used in this study is more appropriate than the standard discrete choice model with a linear utility structure. Based on the estimation results of δ j , we identify that the values of the satiation parameters are transformed by the equation as α j = [ 1 / ( 1 + exp ( δ j ) ] in Table 4. In the case of all respondents, the satiation parameter with BEVs is the largest, meaning that consumers have the largest preference for the additional use of BEVs. The descending order of the satiation parameter is BEV, full hybrid, PHEV, gasoline, and diesel, for all respondents, and gasoline, full hybrid, diesel, PHEV, and BEV for drivers. However, the results of each vehicle type’s satiation do not contain the effect of accessibility of fueling and fuel cost; thus, we consider them to derive consumers’ satiation level for each alternative fuel type accurately. In descending order, the satiation level for alternative fuel types are BEV, full hybrid, gasoline, diesel, and PHEV, for all respondents, and BEV, gasoline, full hybrid, diesel, and PHEV for drivers. In summary, consumers, including drivers, rate the potential of BEVs as superior to other vehicle types.

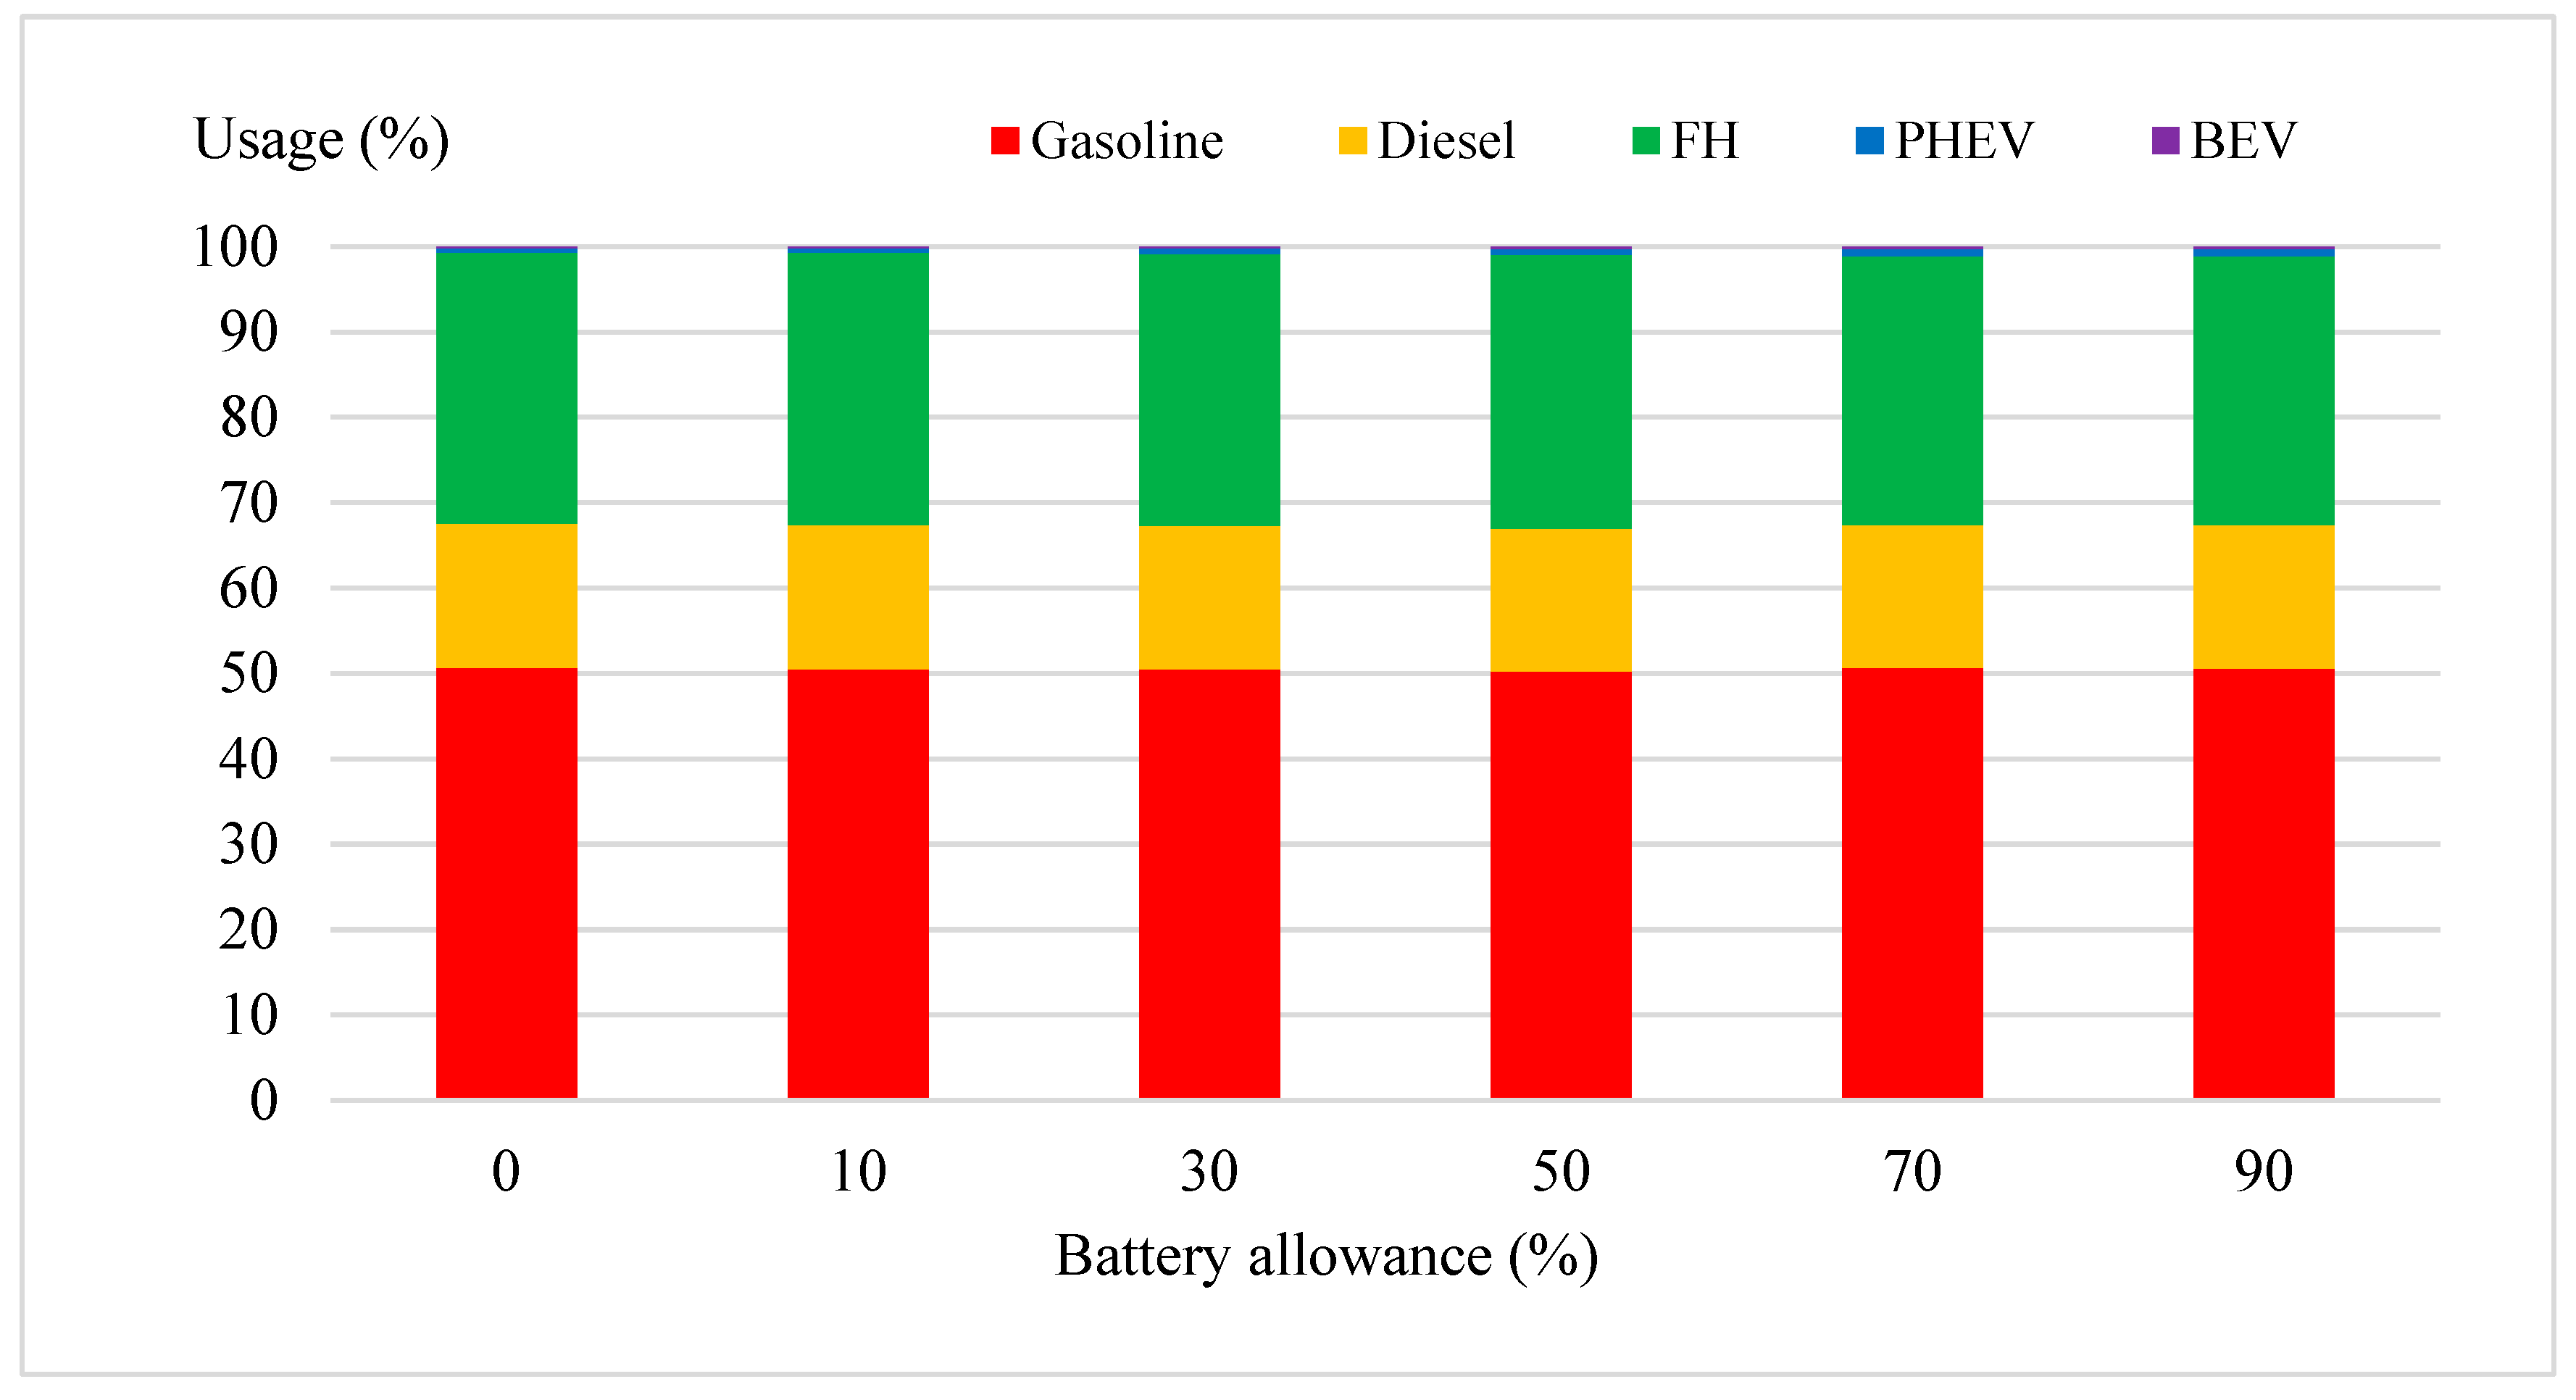
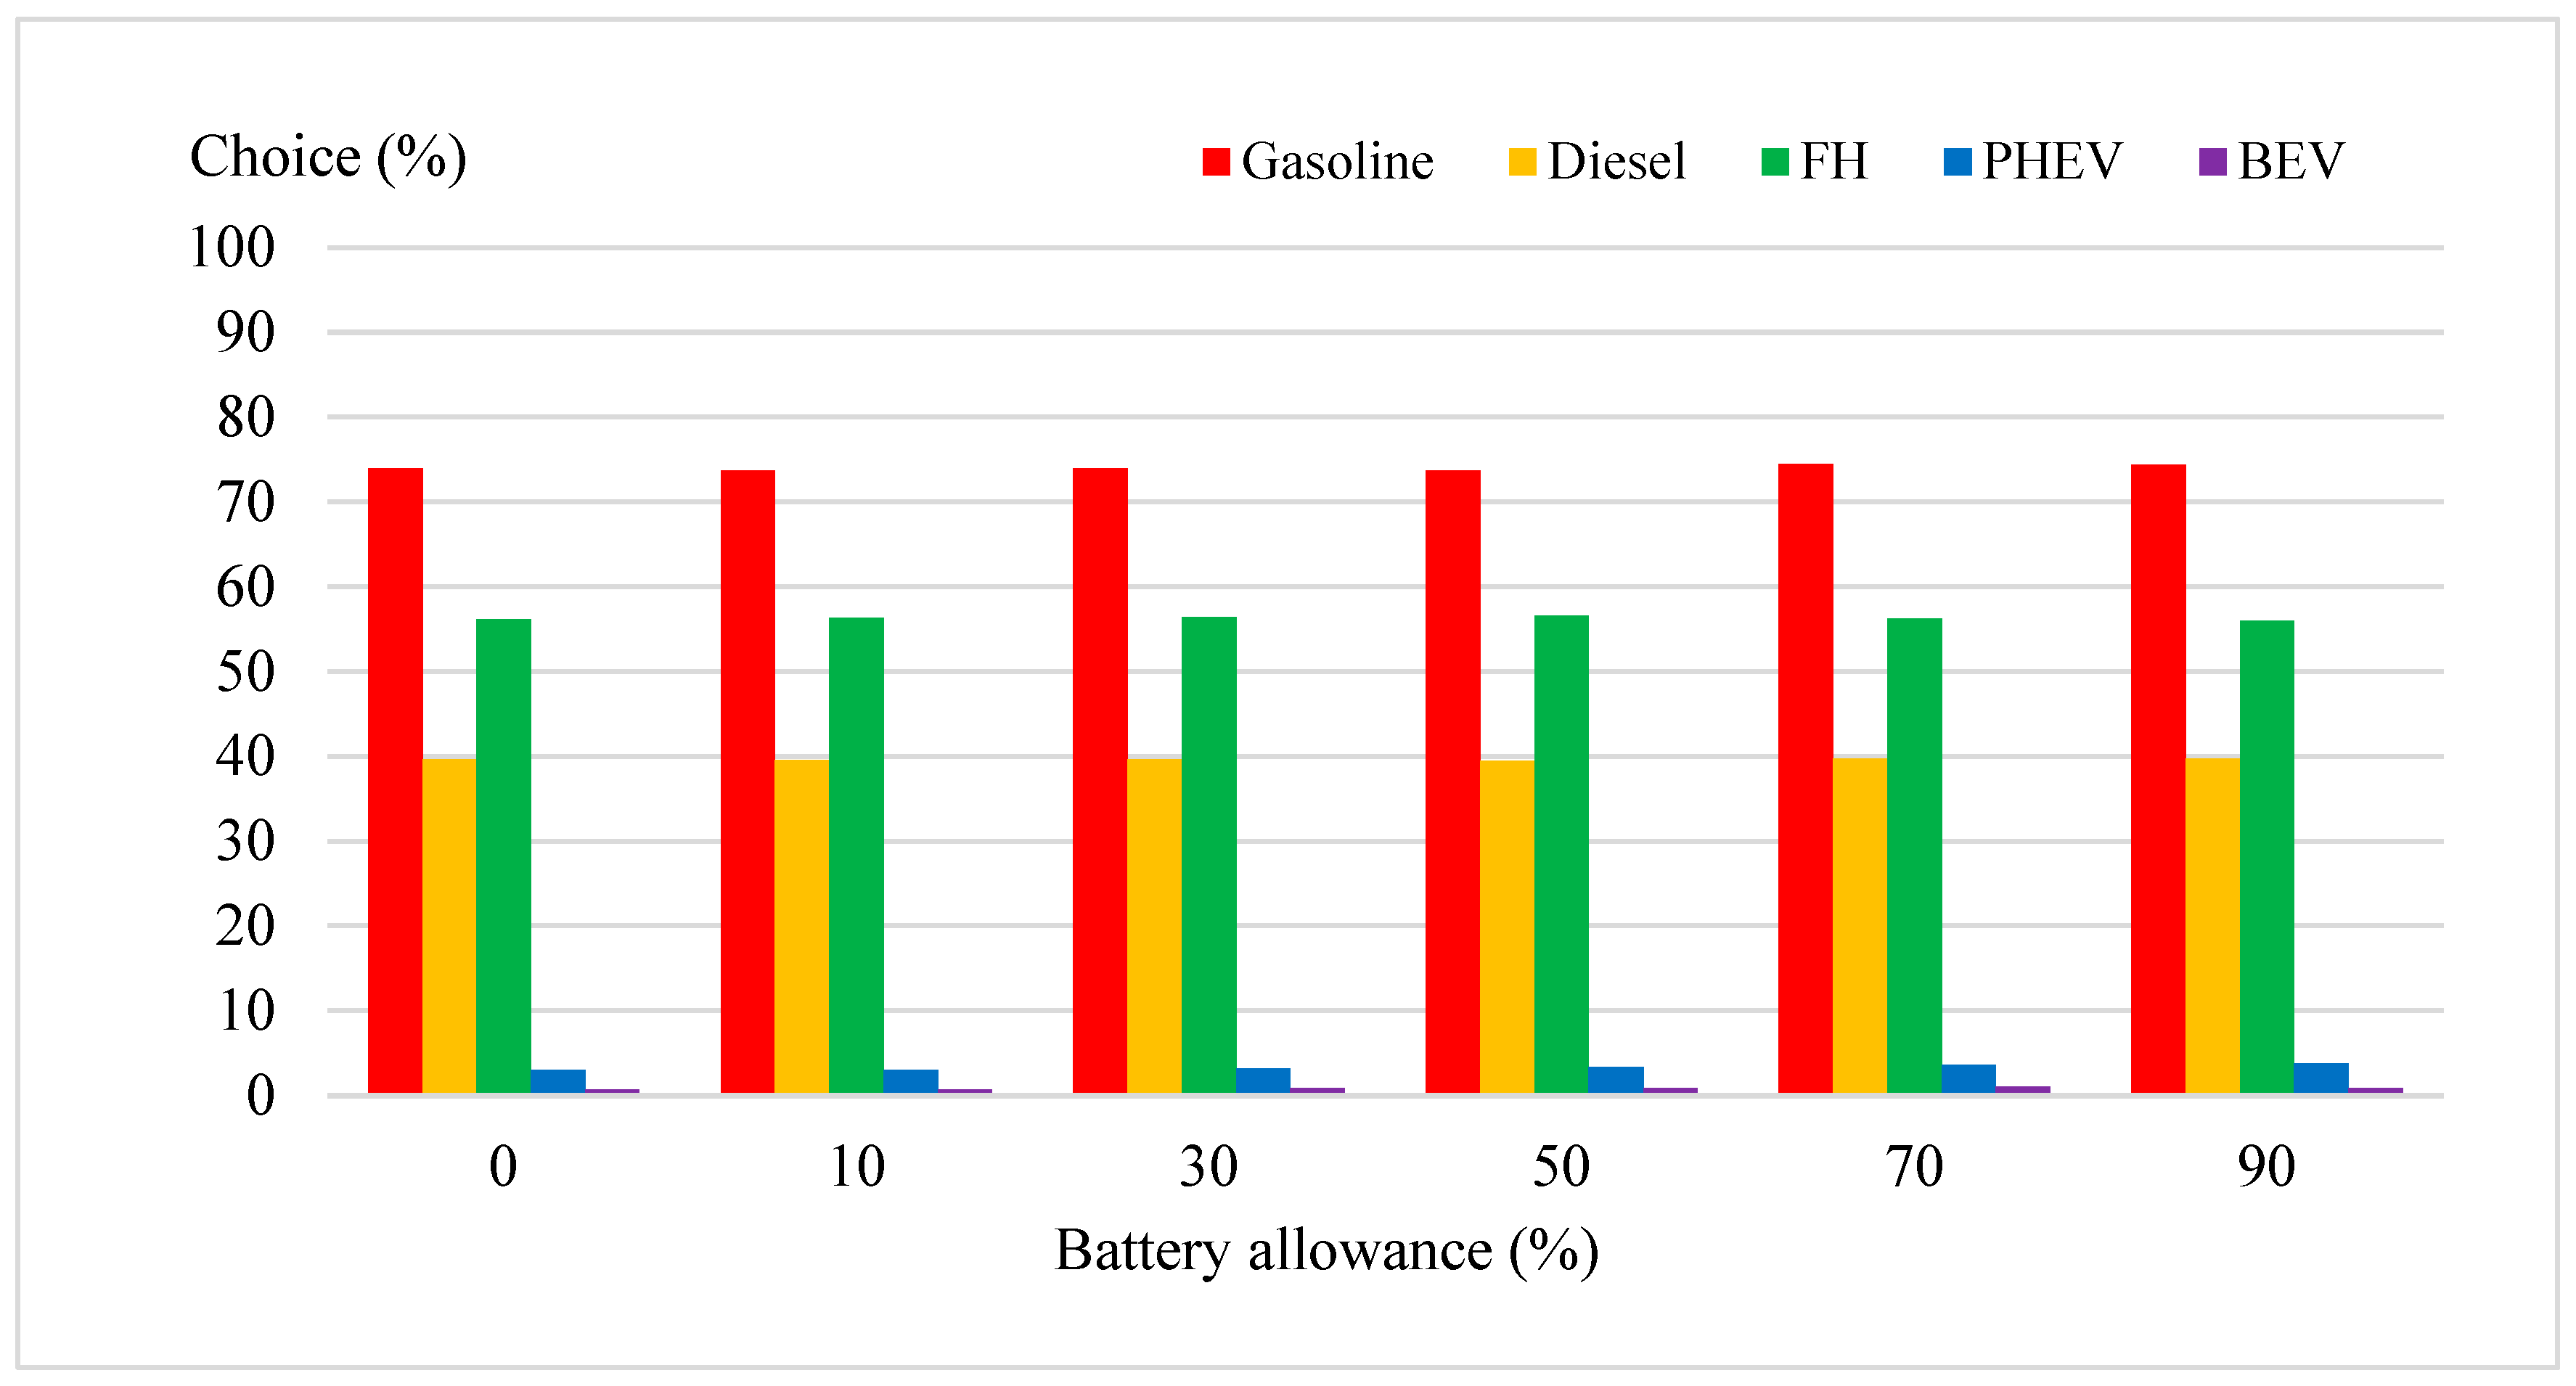
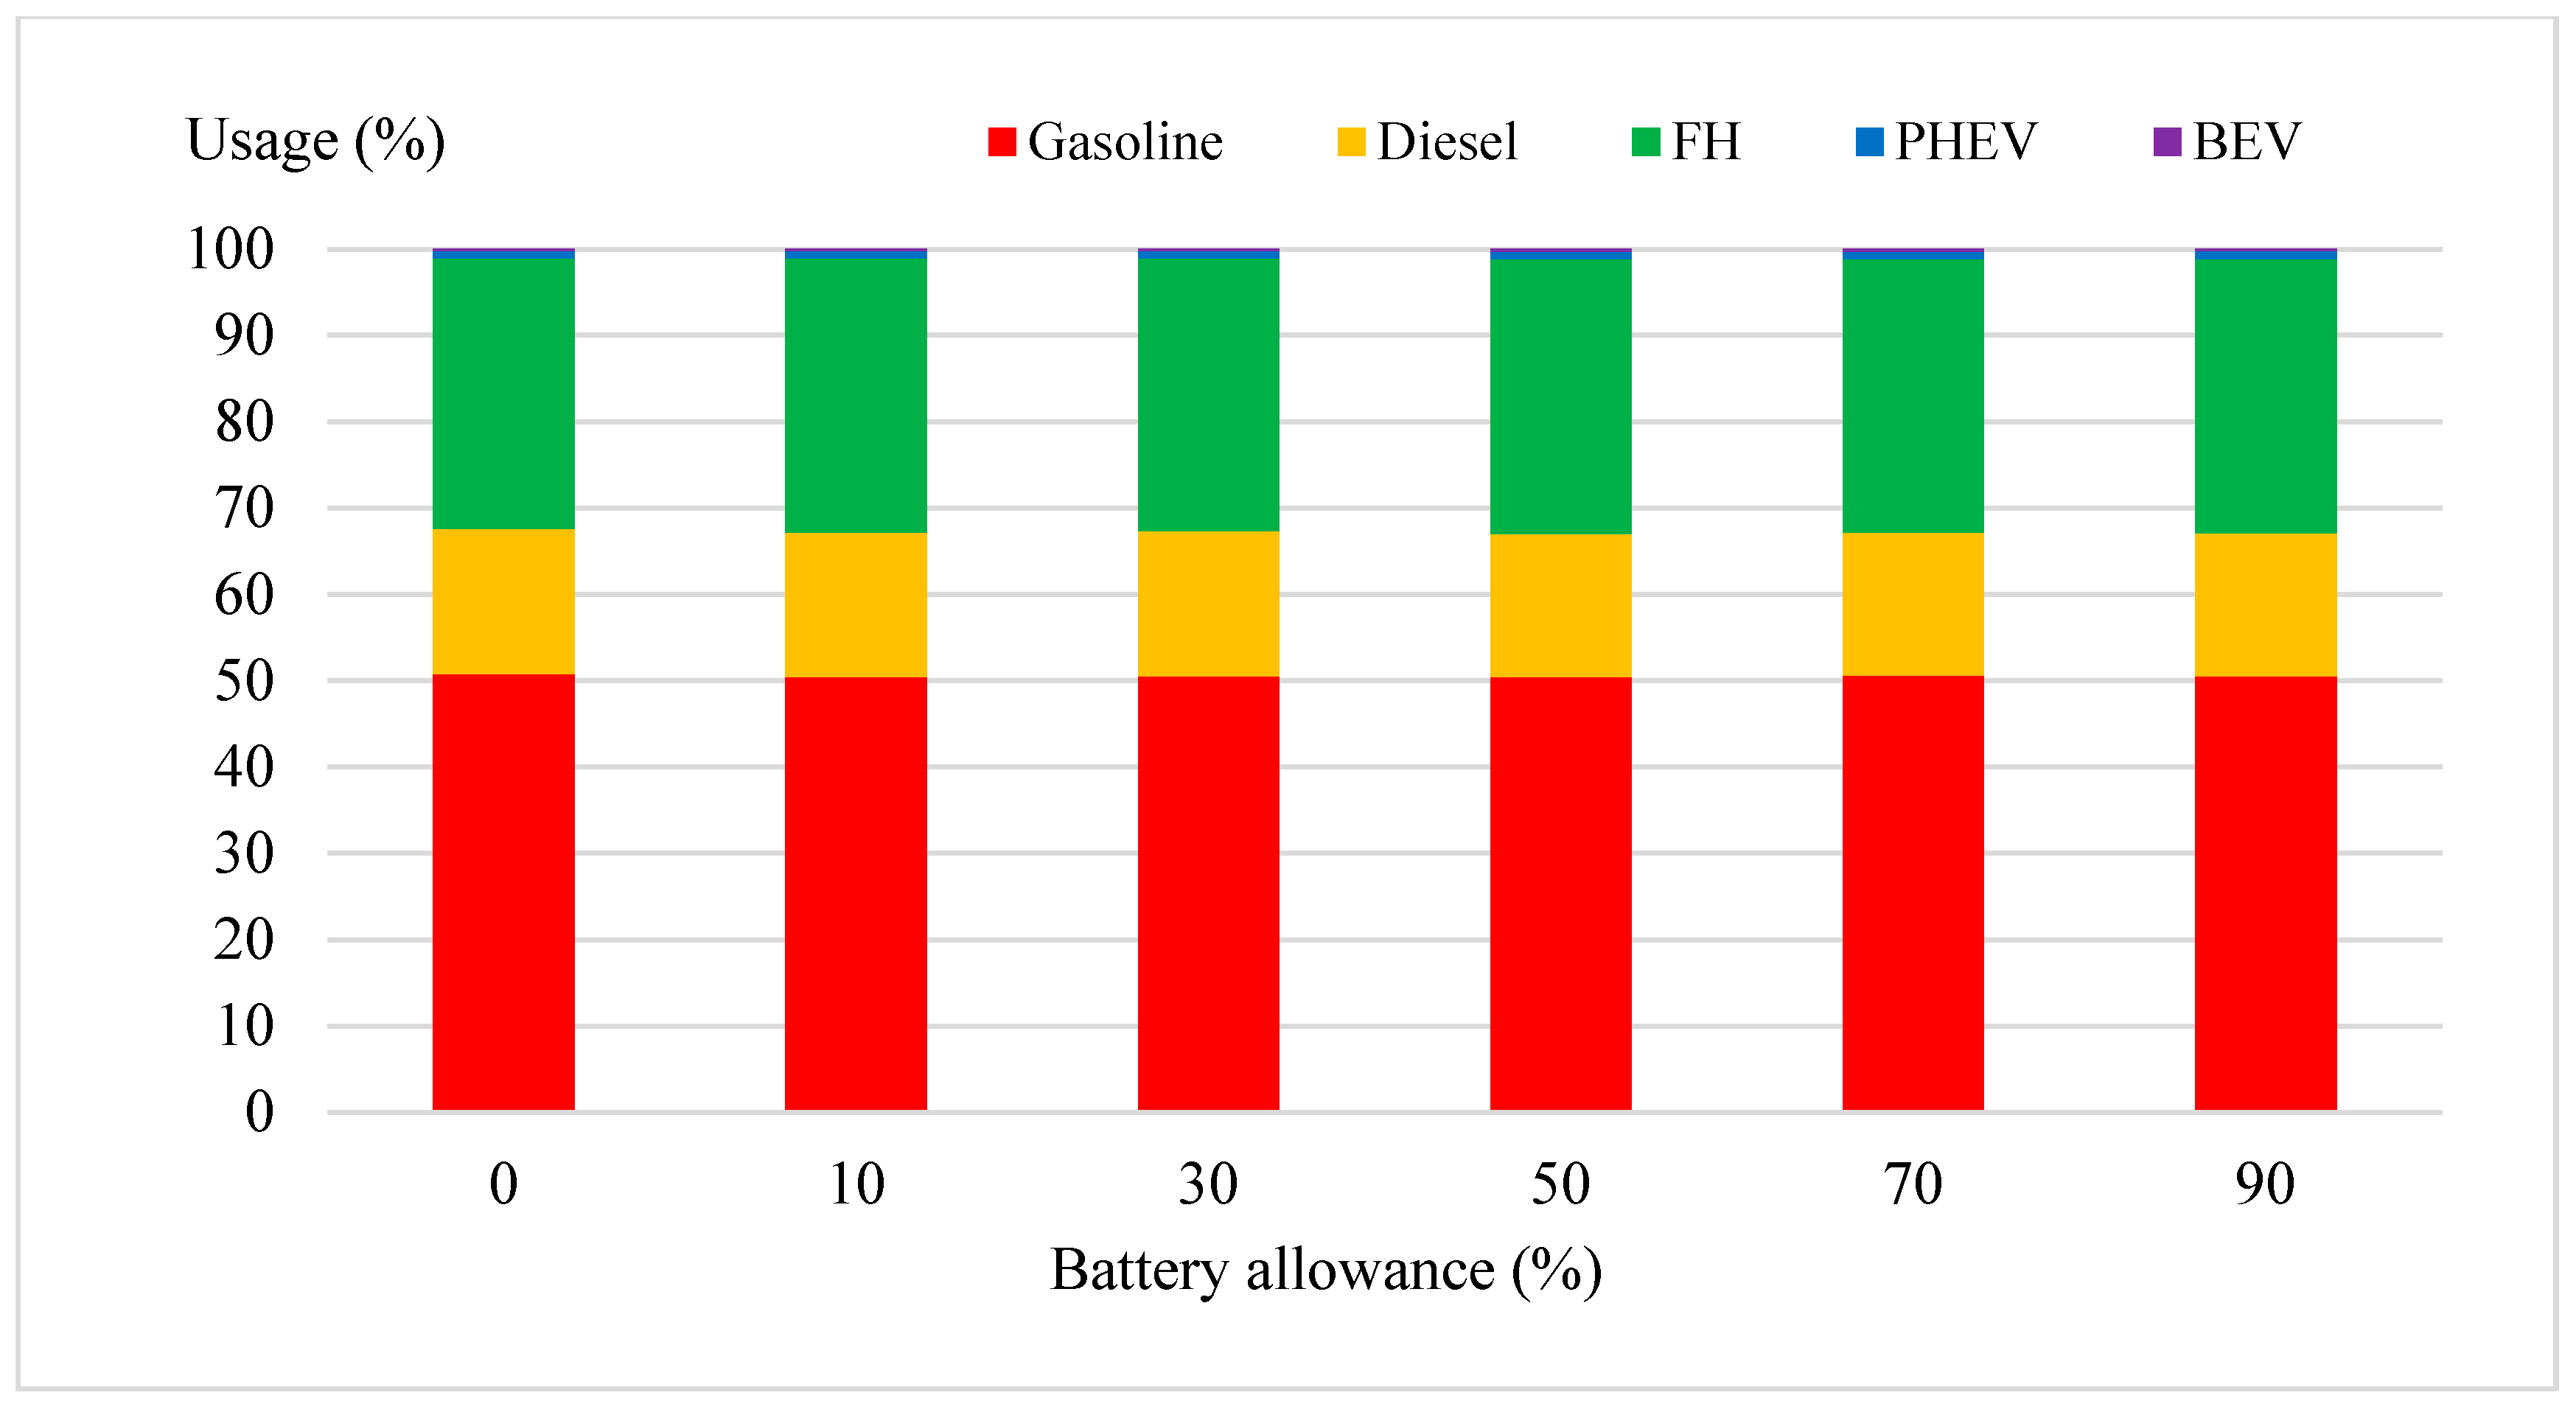
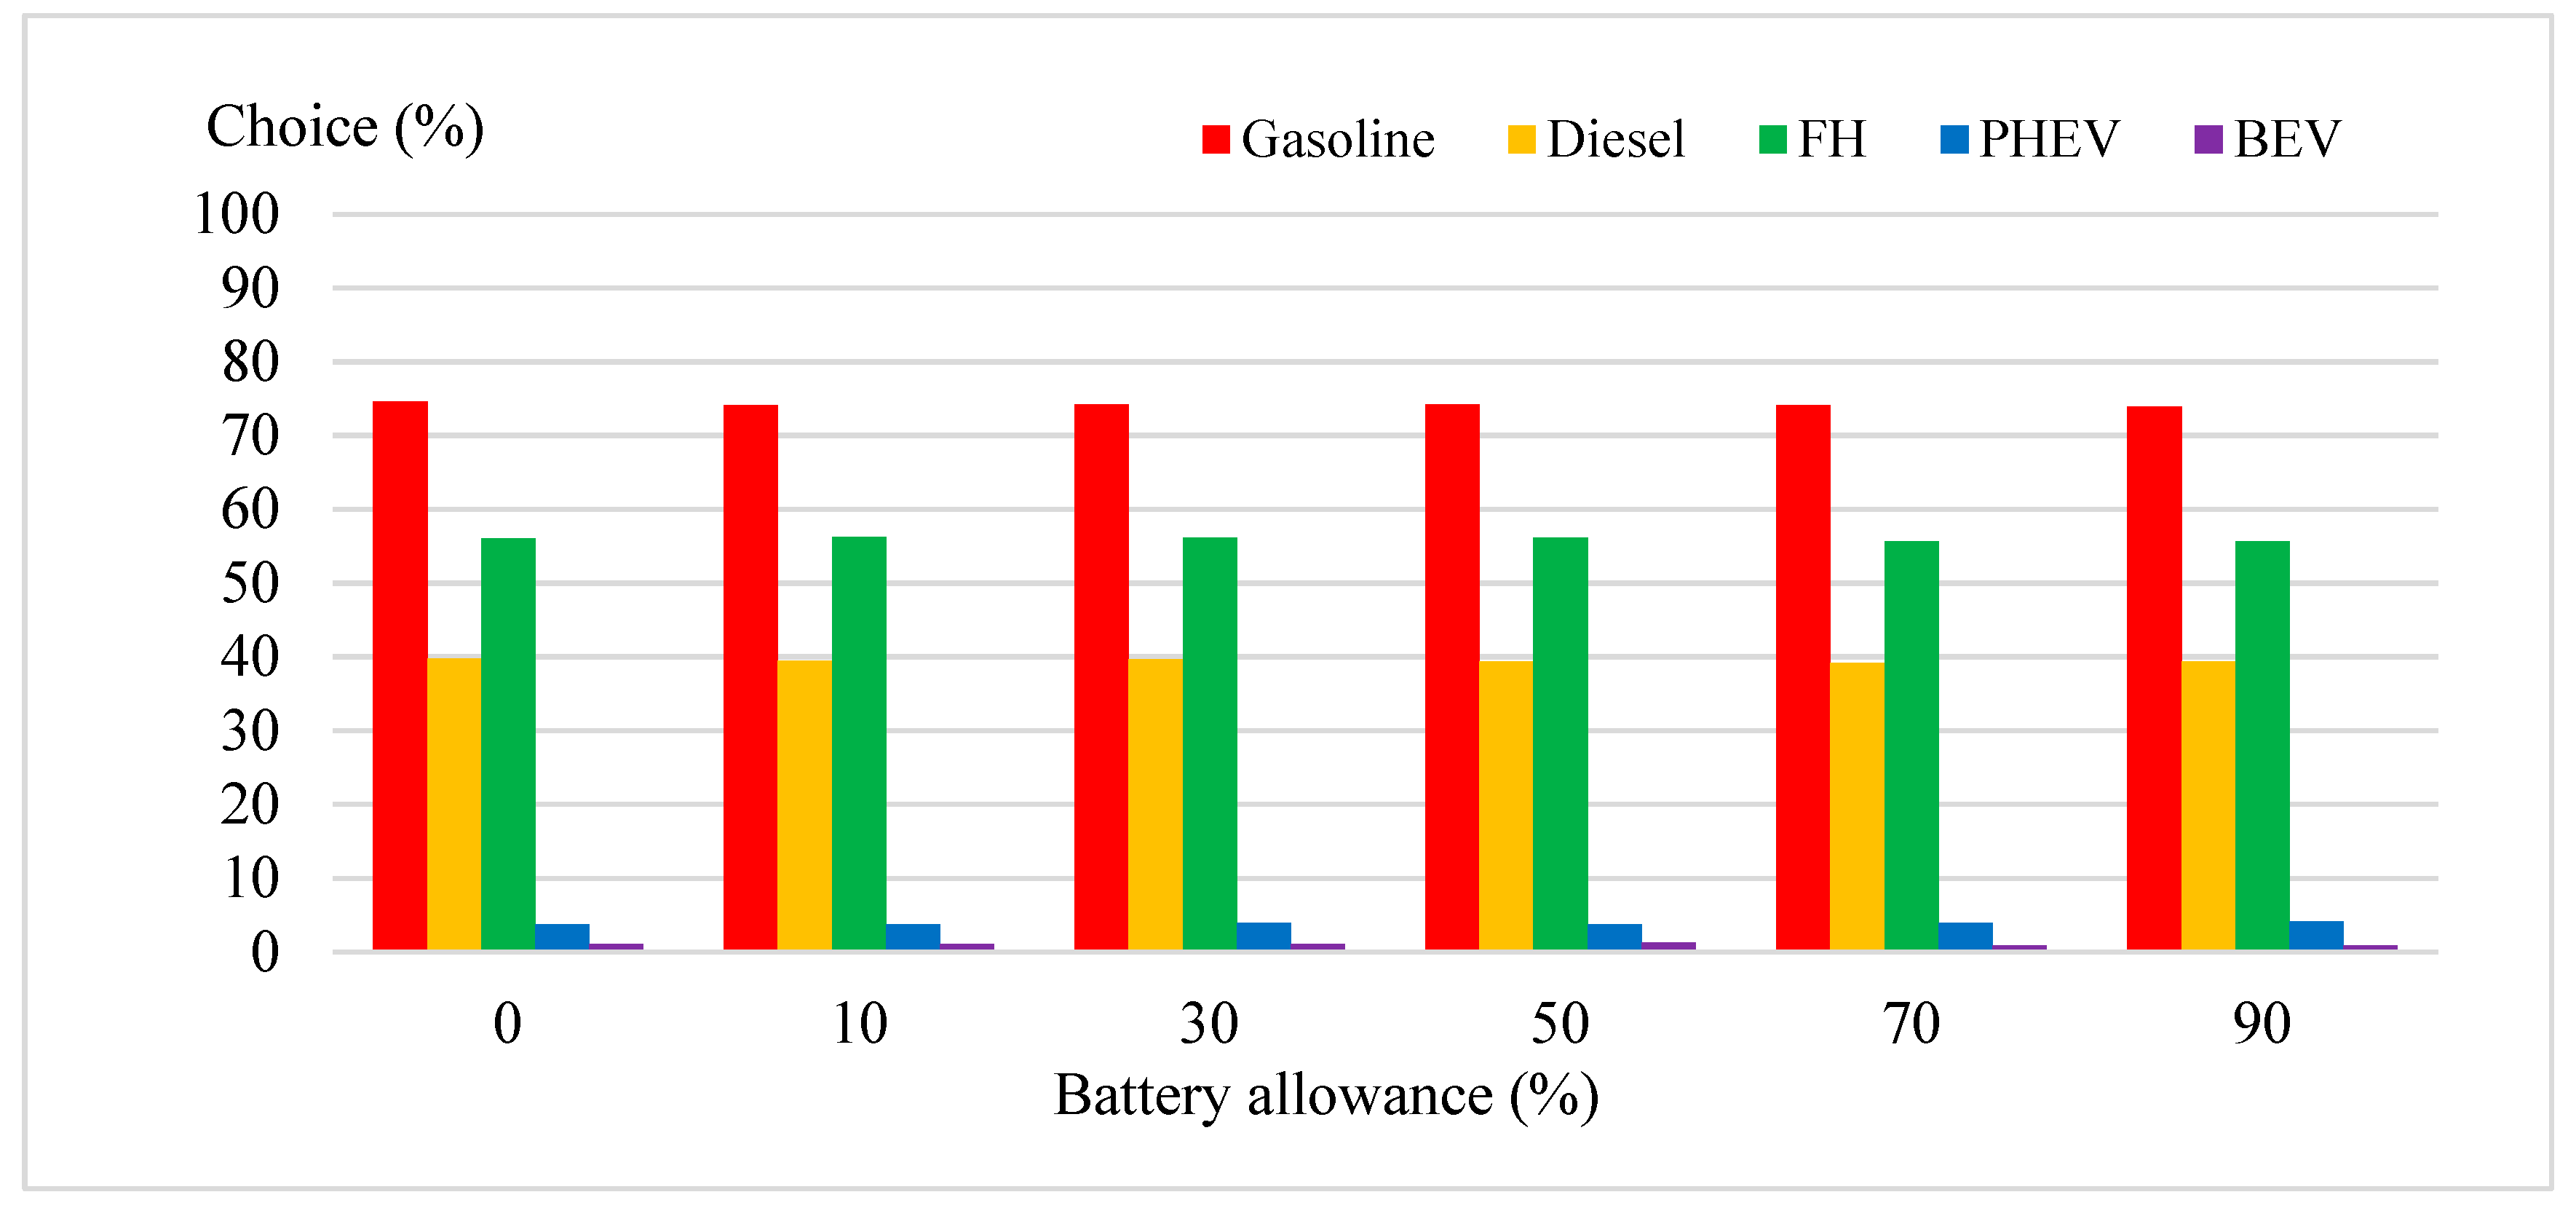
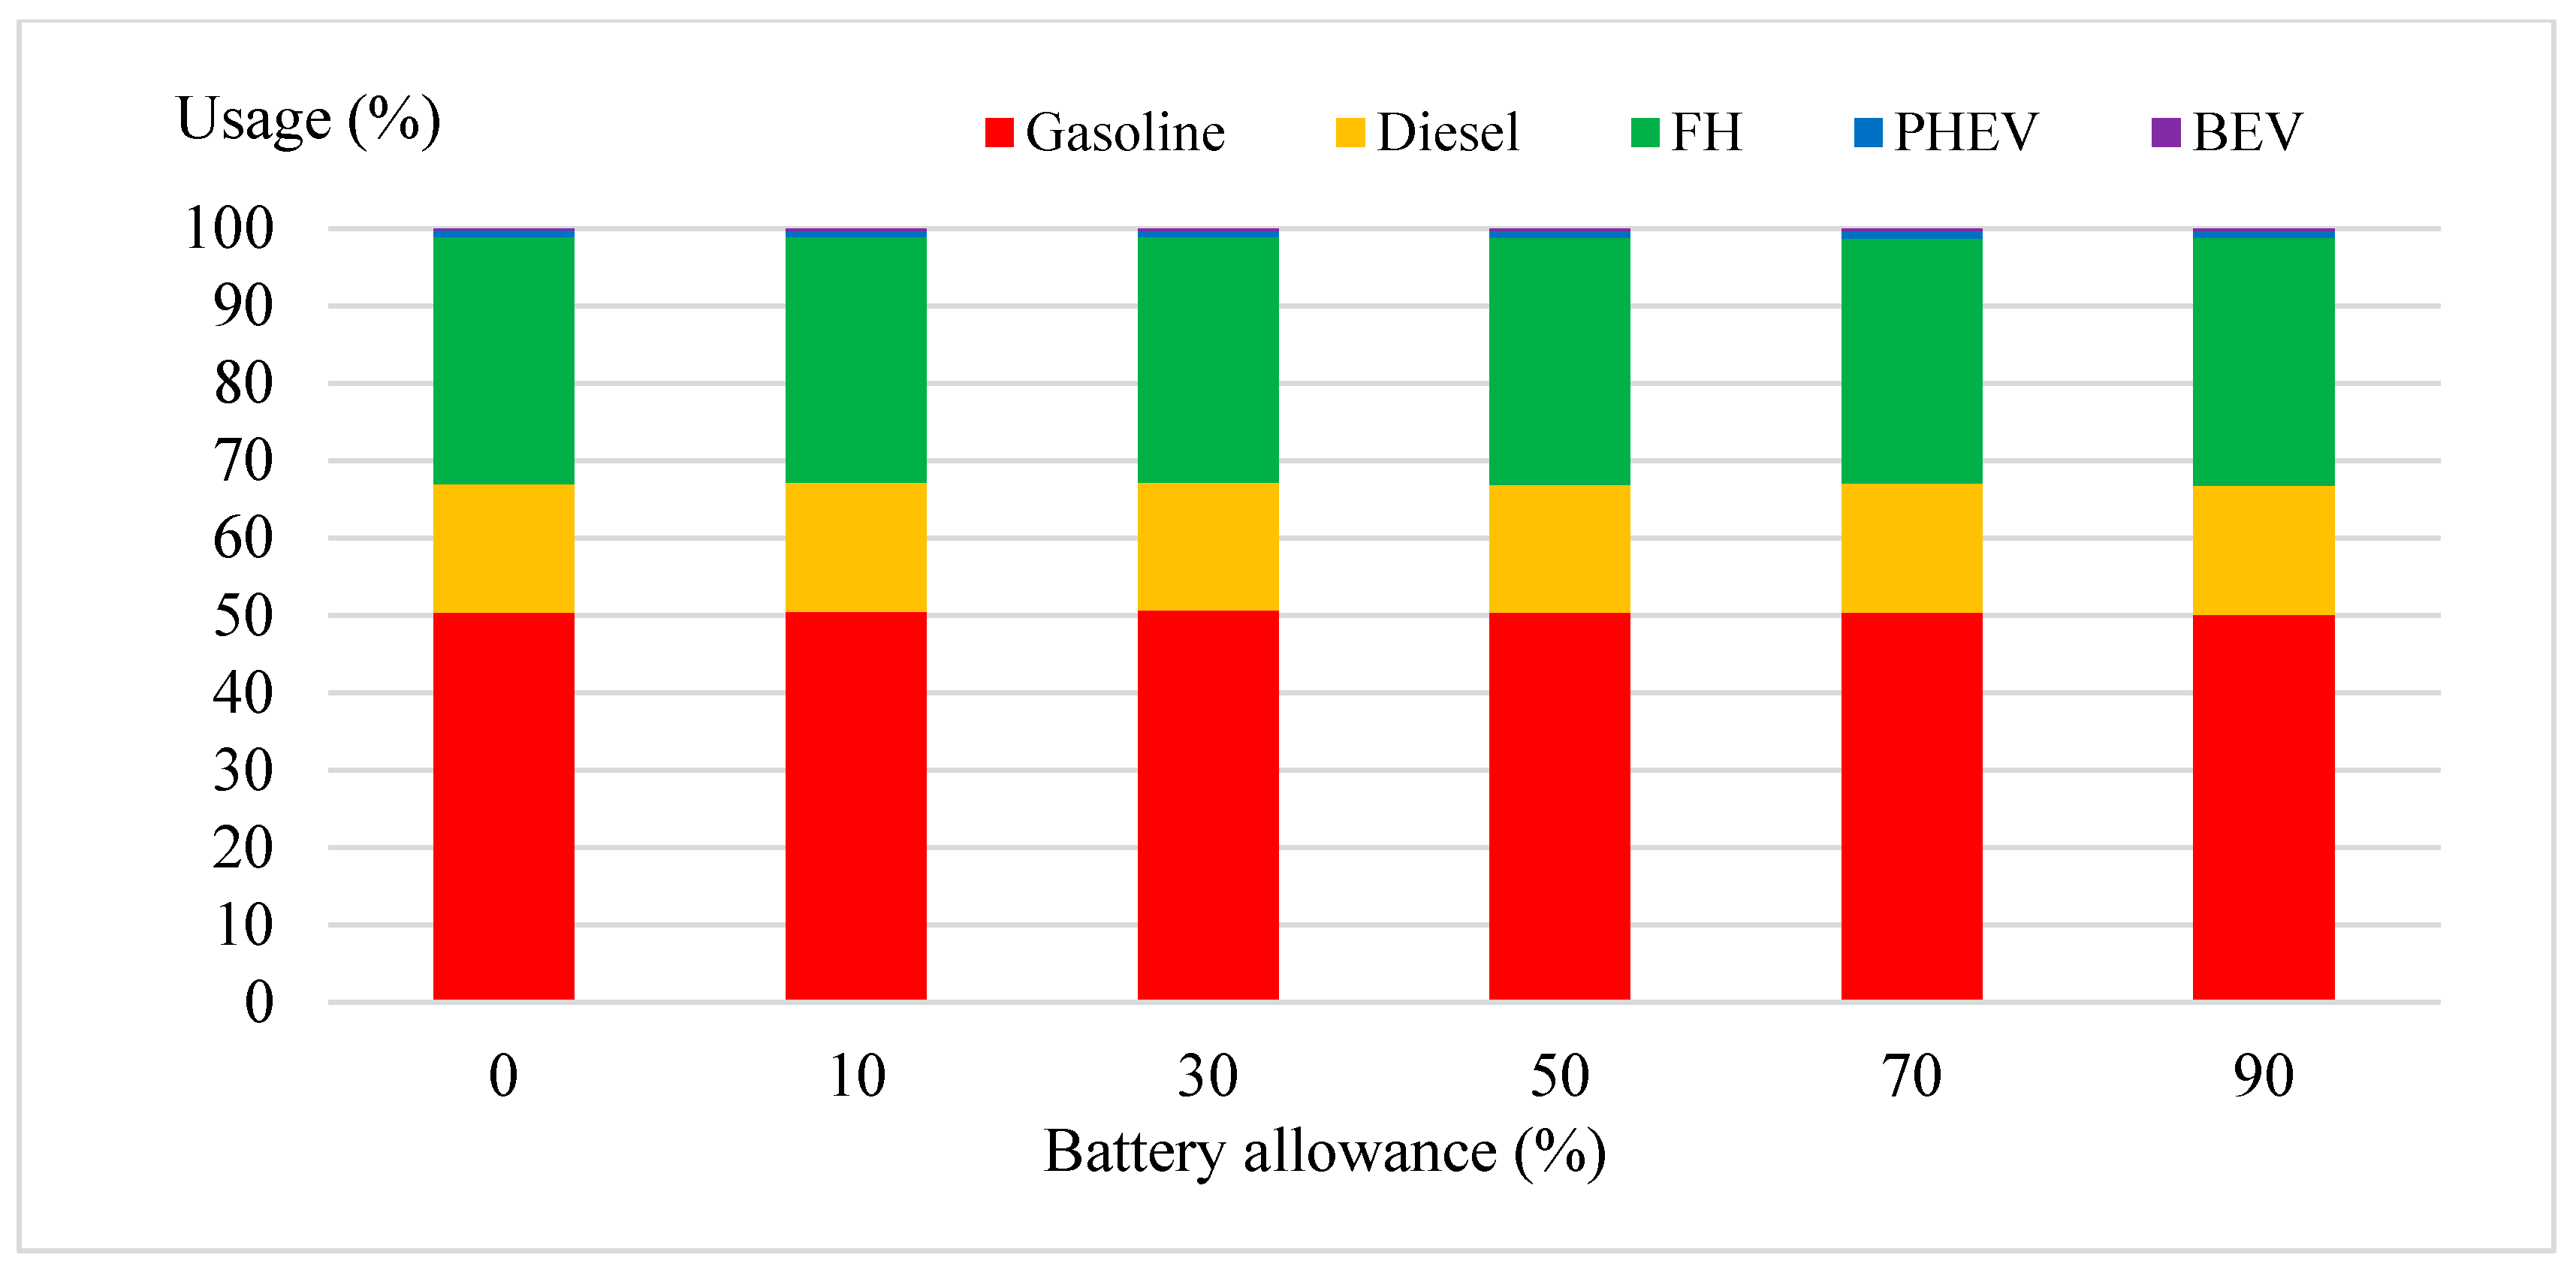
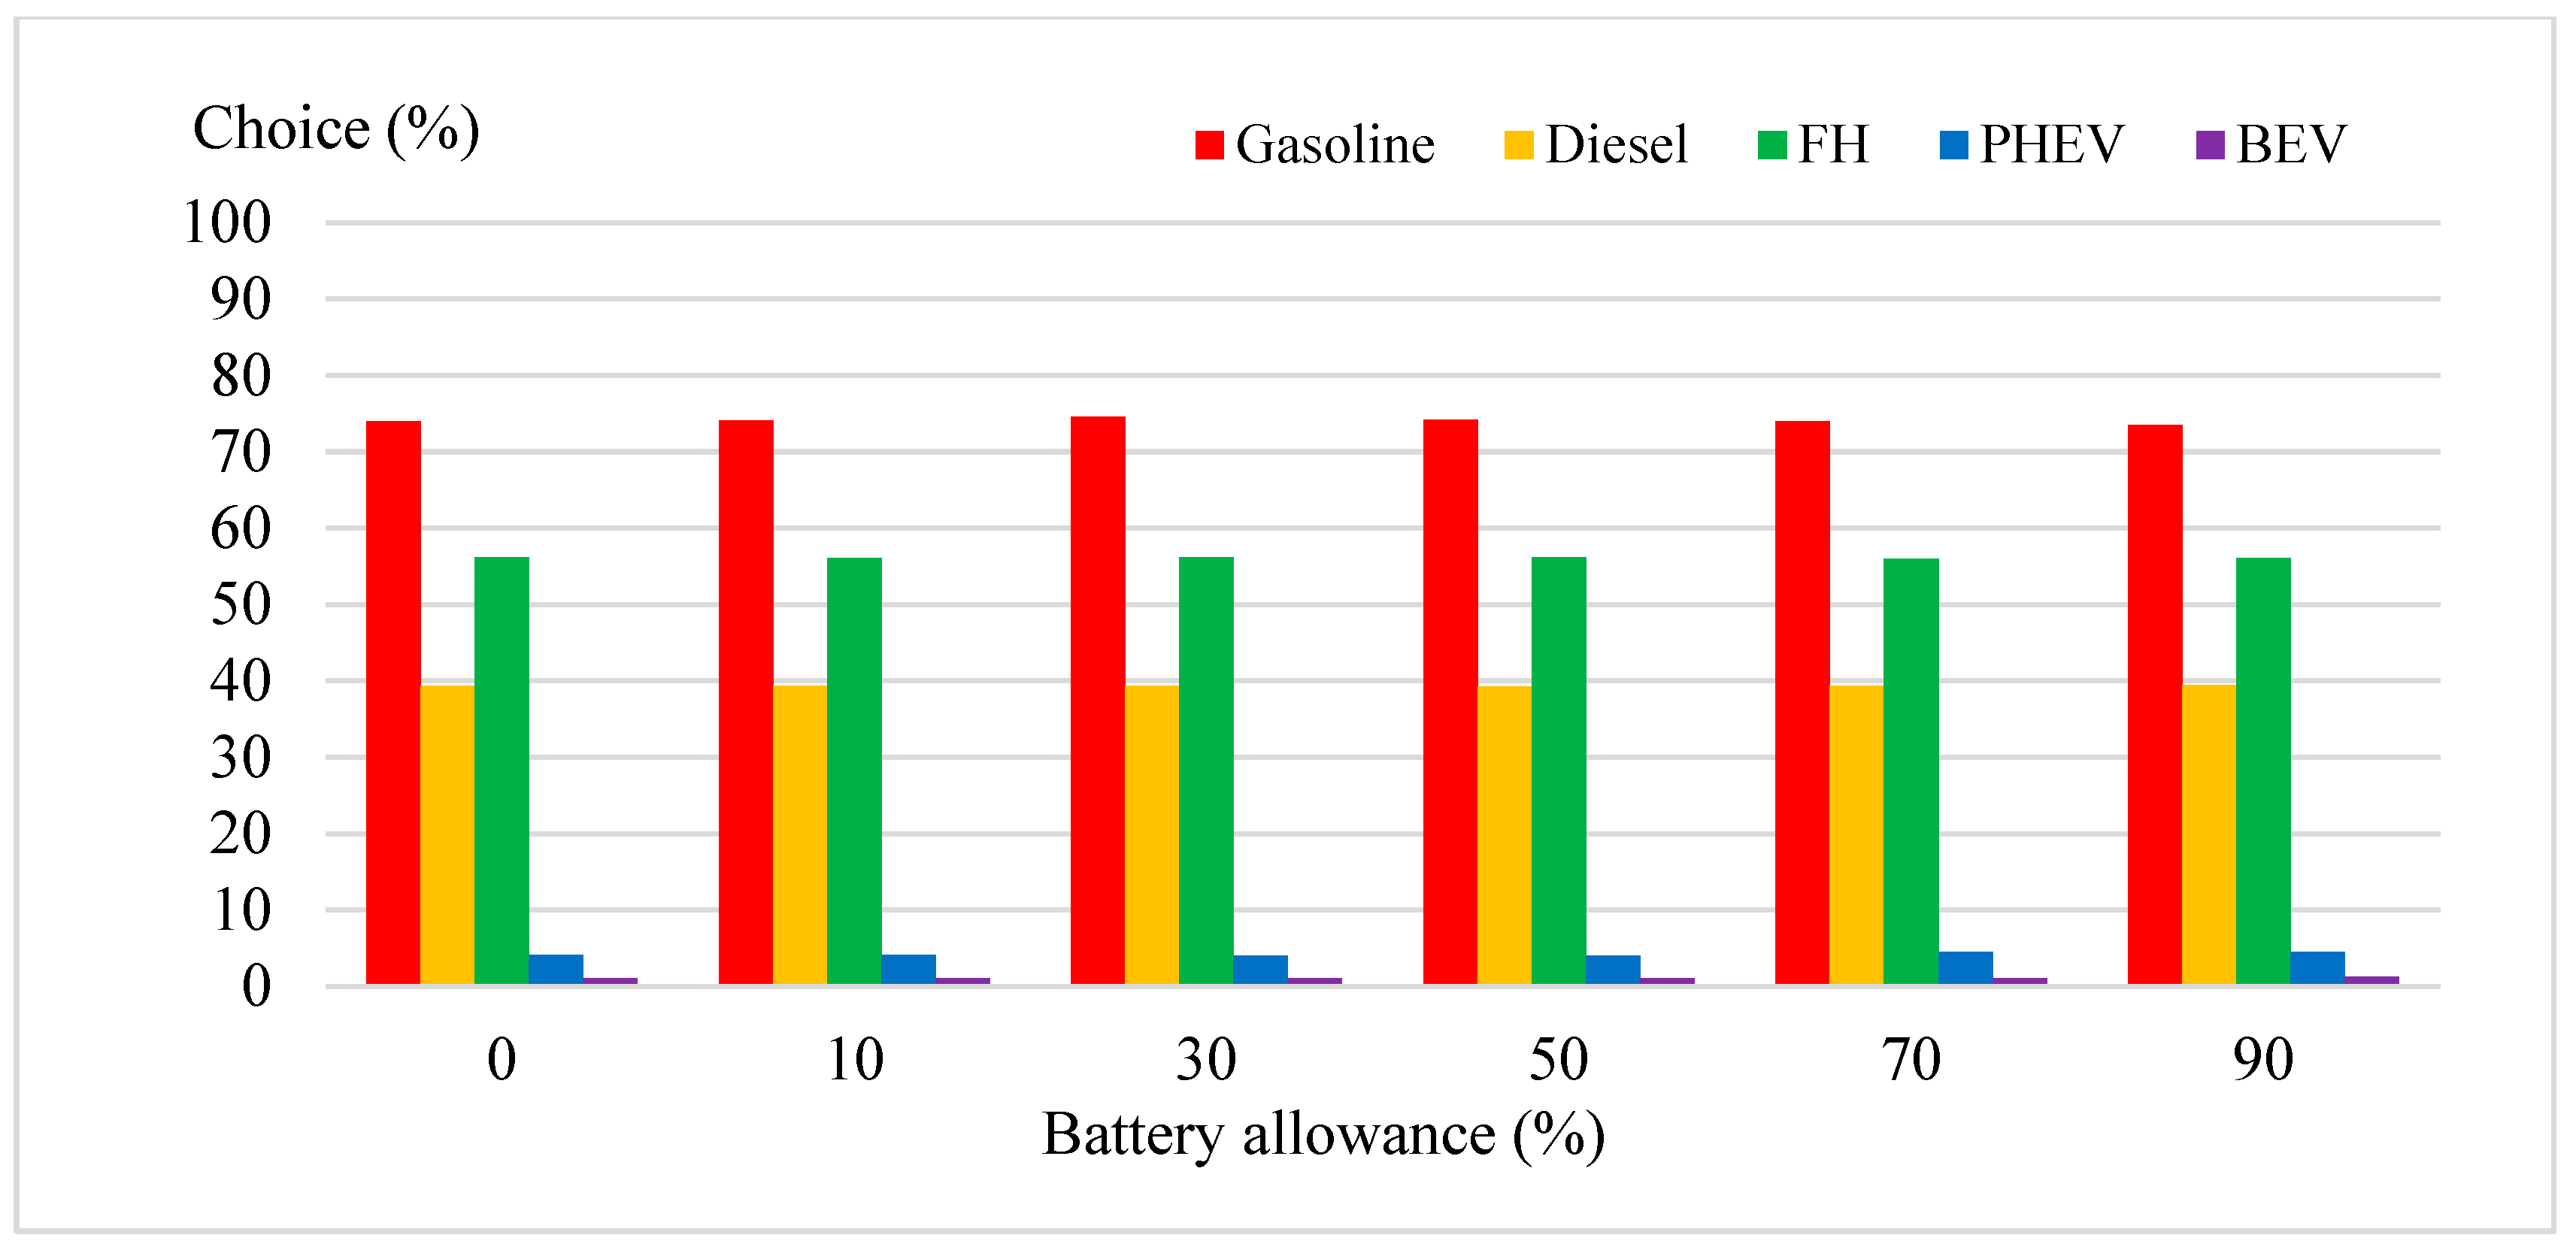
4.2. Scenario Analysis for the Electric Vehicle Market

Since substituting EVs for ICEVs in future automobile markets yields significant effects on the electricity industry, it would be beneficial to analyze the impact of integrating EVs with the smart grid on electricity demand. Therefore, we conduct a scenario analysis to investigate the patterns of vehicle choice and usage under hypothetical conditions. All scenarios assume that consumers can choose a vehicle or vehicles among gasoline, diesel, full hybrid, PHEV, and BEV. We think that drivers with practical experience about fuel types and efficiency would make the V2G energy sharing scenario analysis more realistic. Using the estimated coefficients from the driver group, we predict the choice and mileage for each individual and calculate the average across all individuals. The mileage for each household q is estimated by Equation (9):
Max U q = j = 1 K { [ exp ( β ^ q x q j ) ( m q j + γ q ) α ^ q j ] }   s . t . j = 1 K m q j = M q ,   m q j 0 j .
Here, the mileage constraint M q represents the mileage of the present passenger’s car usage of the household q .
By considering the electricity generation mix, we postulate some hypothetical scenarios to analyze the impact of EV expansion on electricity demand. Scenario A represents the current status of Korean generation mix. Scenario A-1 means Korean government’s electricity generation plan for 2030. Scenario B assumes a renewable focused-electricity generation mix (Scenario B refers to the electricity generation mix of Germany, one of the most developed countries in terms of renewable energy.). The battery allowance is varied to 0%, 10%, 30%, 50%, 70%, and 90% for each scenario. The accessibility of fueling/charging stations (%) is 100% for gasoline, diesel, full hybrid, and PHEV and 27% for BEV, reflecting the domestic conditions in August 2018. Fuel cost and vehicle prices are calculated from weighted averages of the top-selling mid-sized sedans in 2017. Table 5 shows the attribute levels used in these three scenarios.
The choice probability and usage patterns for each type of vehicle are investigated in individual scenarios. The results of scenario A with 0% of battery allowance for V2G show that when the driver group has multiple choices for each vehicle, the choice probabilities of gasoline, diesel, full hybrid, plug-in hybrid, and EVs are 73.97%, 39.68%, 56.19%, 3.05%, and 0.72%, respectively (See Appendix B for results on the entire simulation) (we performed an additional scenario analysis assuming electricity is generated by only renewable energy. In this scenario, the choice probability of PHEV and BEV is higher than scenario B). The results of the changes in usage patterns and choice probability for the three outlined scenarios indicate that the impact of electricity generation mix on the automobile market is minor, less than 1%. From the perspective of the whole market share, a change to renewables-focused electricity generation mix slightly reduces the usage and choice probability of gasoline vehicles but slightly increases the usage and choice probability of PHEVs and BEVs. However, the total market size for EVs in scenario A (even including PHEVs) is less than 4%. Hence, a 1% market share of EV actually means more than 20% expansion for EVs.

4.3. Policy Implications

Based on our results and previous studies on peak shaving effect of EVs in Korea [65], EVs have potential as a new energy storage source. With a V2G system, country could reduce their electricity generation at peak demand time because some portion of electricity can be supplied from EVs, thus individual EV owners could increase revenue from fuel costs compared to ICEV owners. Hence, there is a need to implement various policies along with governmental plans to promote EVs. One such plan is improving the laws and regulations for V2G service licensing. The Ministry of Economy and Finance [66] announced that the Korean electricity retail market would be gradually opened to the private sector to reorganize the regime of competition. Although this plan has been considerably eased over time, there are limitations to fully implementing a V2G system; it is essential to establish a new legislation and improve the current infrastructure. Another way to vitalize the V2G market is to advance various demonstration projects related to V2G. Currently, the Korean government is conducting a pilot project to reduce electricity costs by lowering the peak power demand of campus buildings [67]. In this project, various participants in the V2G market are studying vehicle usage patterns and economic operation plans of V2G. Additionally, the Korea Electric Power Corporation (KEPCO) has started a demo project in Busan, whereby commercial EVs supply power to Busan city during periods of power outage or blackout. Essentially, cooperation between V2G stakeholders will accelerate activation of the V2G market.
The present study provides several policy implications. First, the potential EV consumer preference structure for battery allowance for a V2G system has changed at 27.9%, the smallest point. The consumers have been benefited by more than 55.7% of the battery allowance for V2G. Specifically, the electricity price in South Korea is relatively lower than in other countries, and thus, consumers will consider V2G participation only when the economic benefits from V2G exceed the losses from battery recharging. Additionally, EV owners who predominantly drive during the daytime may be reluctant to share even a small amount of electricity from their battery. On the other hand, other EV owners who do not drive during the daytime may prefer to provide electricity from their battery. These two opposite effects are mixed, so the results show that there is a utility change at about 27% and it becomes positive after about 55%. To set an appropriate battery allowance for V2G energy sharing, we should consider consumer preferences as well as charging technology and the electricity demand-supply situation. Thus, the study’s recommendation regarding battery allowance can serve as a good indicator for determining polices for future V2G services. Second, changes in electricity generation mix have an insignificant effect on EV consumer choice and usage. As mentioned in previous research, factors related to EVs and EVSE facilities, including charging infrastructure, charge price, and travel distance after charging, significantly impact EV consumer choice and usage.

4.4. Limitations

This study has a few limitations. First, we found that customers may be reluctant to lend electricity below a certain battery level and prefer to lend only above a certain level. However, we did not collect any qualitative data from the survey to support this finding. Further study is needed to determine whether this phenomenon is common in other countries or observed only in Korea. Second, we considered only the physical accessibility of charging stations without the technical performance difference of batteries and charging facilities. The charging rate of EVSEs can significantly affect the availability of energy storage and the consumer choice of EVs. Battery degradation can also affect EV user’s decision making. This study analyzed the amount of discharged electricity to the grid when the battery of EV is 100% charged, but in reality, the amount of electricity may vary depending on the remaining battery charge or EV owner’s personal situation. Future studies should consider above factors such as battery degradation, state of charge and the difference in charging rate of EVSEs to analyze consumer preference of EVs and measure the contribution of V2G to the electricity system accurately. Third, we analyzed consumer preferences at specific time points assuming that consumer preference for EVs would be maintained, which is the inherent problem in most stated preference studies. However, consumer preferences can change in line with changes in technology and the environment in the real market. Therefore, consistent and ongoing consumer analysis is needed to reflect the change in consumer preference for EVs.

5. Conclusions

In this study, a conjoint survey and MDCEV models are used to investigate patterns in the consumer usage of automobiles and the impact of EVs on the automobile market, under various electricity generation mixes and battery allowance levels for V2G. The results show that the overall consumers do not prefer PHEVs and BEVs; however, it reveals that drivers tend to prefer PHEVs and BEVs. Additionally, it is found that the accessibility of fueling/charging stations affects driver preferences. The results of the satiation parameters indicate that consumers estimate the potential of BEV to be high.
With the estimation results, a simulation analysis of changes in choice probability and the usage pattern of passenger cars is conducted to determine the feasibility of EVs as an ESS, depending on the battery allowance and energy mix. From the simulation results, it is found that a change to the renewable-focused electricity generation mix leads to a minor decrease in the usage of gasoline vehicles and a minor increase in the usage of PHEVs and BEVs. The effect of the electricity generation mix is likely to be larger after the rise of EV market share or full expansion of EVSE. For a more accurate analysis, further studies need to consider battery degradation, technical factors of EVSE, remaining battery capacity, and EV owner’s personal situation, which are not considered in this study.

Author Contributions

Conceptualization, K.M., J.S. and Y.C.; methodology, K.M. and S.K.; software, K.M.; validation, K.M., J.S. and Y.C.; formal analysis, K.M. and S.K.; investigation, J.S. and Y.C.; data curation, K.M. and S.K.; writing—original draft preparation, K.M.; writing—review and editing, K.M. and Y.C.; visualization, K.M.; supervision, Y.C.; funding acquisition, J.S. and Y.C. All authors have read and agreed to the published version of the manuscript.

Funding

This work was supported by the National Research Foundation of Korea Grant funded by the Korean Government (NRF-2017R1C1B5074293). This work was also supported by Korea Electric Power Corporation (Grant number: R18XA02.

Conflicts of Interest

The authors declare no conflict of interest.

Nomenclature

EVElectric vehicle
V2GVehicle to vehicle
ESSEnergy storage system
ICEVInternal combustion engine vehicle
EVSEElectric vehicle supply equipment
BEVBattery electric vehicle
FCEVFuel cell electric vehicle
PHEVPlug-in hybrid electric vehicle
MDCEVMultiple discrete-continuous extreme value
AFVAlternative fuel vehicle
RUMRandom utility theory
K Number of alternatives in an alternative set
Ψ ( x j ) Baseline utility
x j Attribute of j th alternative
γ Translation parameter
α j Satiation parameter
m j Usage of j th alternative
M Total amount of usage
q Mileage for each household
M q Mileage of the present passenger’s car usage of the household q

Appendix A

Supplementary Information for EVs

Table A1. Existing EVs and their battery capacity.
ManufacturerModelBattery Capacity (kWh)
TeslaModel X (performance)100.0
Model X (long range)100.0
Model S (performance)100.0
Model S (long range)100.0
Model 3 (performance)75.0
Model 3 (long range)75.0
Model 3 (standard)50.0
JaguarI-face90.0
Mercedes-BenzEQC80.0
HyundaiKona (standard)64.0
Kona (economic)39.2
Ionic38.3
KiaNiro (standard)64.0
Niro (economic)39.2
Soul (standard)64.0
Soul (economic)39.2
ChevroletVolt EV60.0
NissanLeaf40.0
BMWi3 120Ah37.9
Renault SamsungSM3 Z.E.35.9
Source: Each manufacturer.

Appendix B

Supplementary Information for Scenario Analysis

Figure A1. Market simulation results (Scenario A: Current Korean energy mix).
Energies 13 04248 g0a1aEnergies 13 04248 g0a1b
Figure A2. Market simulation results (Scenario A-1: Korean energy mix in 2030).
Energies 13 04248 g0a2aEnergies 13 04248 g0a2b
Figure A3. Market simulation results (Scenario B: German energy mix).
Energies 13 04248 g0a3aEnergies 13 04248 g0a3b

References

  1. Ibrahim, H.; Ilinca, A.; Perron, J. Energy storage systems—Characteristics and comparisons. Renew. Sustain. Energy Rev. 2008, 12, 1221–1250. [Google Scholar] [CrossRef]
  2. Hadjipaschalis, I.; Poullikkas, A.; Efthimiou, V. Overview of current and future energy storage technologies for electric power applications. Renew. Sustain. Energy Rev. 2009, 13, 1513–1522. [Google Scholar] [CrossRef]
  3. Rehman, S.; Al-Hadhrami, L.M.; Alam, M.M. Pumped hydro energy storage system: A technological review. Renew. Sustain. Energy Rev. 2015, 44, 586–598. [Google Scholar] [CrossRef]
  4. Energymag. Available online: https://energymag.net/round-trip-efficiency/ (accessed on 29 July 2020).
  5. Korea Ministry of Environment. Guideline for Installation and Operation of Electric Vehicle Charging Infrastructure in 2018; Korea Ministry of Environment: Sejong-si, Korea, 2018. (In Korean)
  6. Korea Ministry of Trade, Industry and Energy. Energy Census 2017; Korea Ministry of Trade, Industry and Energy: Sejong-si, Korea, 2017. (In Korean)
  7. Kim, Y.; Lee, J.-S. Study on the Application of V2G for Electric Vehicles in Korea Using Total Cost of Ownership Analysis. J. Energy Eng. 2015, 24, 129–143. [Google Scholar] [CrossRef]
  8. Newbery, D.; Strbac, G. What is needed for battery electric vehicles to become socially cost competitive? Econ. Transp. 2016, 5, 1–11. [Google Scholar] [CrossRef] [Green Version]
  9. Diao, Q.; Sun, W.; Yuan, X.; Li, L.; Zheng, Z. Life-cycle private-cost-based competitiveness analysis of electric vehicles in China considering the intangible cost of traffic policies. Appl. Energy 2016, 178, 567–578. [Google Scholar] [CrossRef]
  10. Palmer, K.; Tate, J.E.; Wadud, Z.; Nellthorp, J. Total cost of ownership and market share for hybrid and electric vehicles in the UK, US and Japan. Appl. Energy 2018, 209, 108–119. [Google Scholar] [CrossRef]
  11. Weldon, P.; Morrissey, P.; O’Mahony, M. Long-term cost of ownership comparative analysis between electric vehicles and internal combustion engine vehicles. Sustain. Cities Soc. 2018, 39, 578–591. [Google Scholar] [CrossRef]
  12. International Energy Agency. Global EV Outlook 2018: Towards Cross-Modal Electrification; International Agency: Paris, France, 2018. [Google Scholar]
  13. Kempton, W.; Tomić, J. Vehicle-to-grid power implementation: From stabilizing the grid to supporting large-scale renewable energy. J. Power Sources 2005, 144, 280–294. [Google Scholar] [CrossRef]
  14. Noel, L.; de Rubens, G.Z.; Kester, J.; Sovacool, B.K. History, Definition, and Status of V2G. In Vehicle-to-Grid. Energy, Climate and the Environment; Palgrave Macmillan: Cham, Switzerland, 2019; pp. 1–31. ISBN 978-3-030-04864-8. [Google Scholar]
  15. Korea Ministry of Trade, Industry and Energy. The 2nd Basic Plan for Smart Grid (Draft); Korea Ministry of Trade, Industry and Energy: Sejong-si, Korea, 2018. (In Korean)
  16. Sovacool, B.K.; Axsen, J.; Kempton, W. The Future Promise of Vehicle-to-Grid (V2G) Integration: A Sociotechnical Review and Research Agenda. Annu. Rev. Environ. Resour. 2017, 42, 377–406. [Google Scholar] [CrossRef] [Green Version]
  17. Hong, J.; Koo, Y.; Jeong, G.; Lee, J. Ex-ante evaluation of profitability and government’s subsidy policy on vehicle-to-grid system. Energy Policy 2012, 42, 95–104. [Google Scholar] [CrossRef]
  18. Egbue, O.; Long, S. Barriers to widespread adoption of electric vehicles: An analysis of consumer attitudes and perceptions. Energy Policy 2012, 48, 717–729. [Google Scholar] [CrossRef]
  19. Ziegler, A. Individual characteristics and stated preferences for alternative energy sources and propulsion technologies in vehicles: A discrete choice analysis for Germany. Transp. Res. Part A Policy Pract. 2012, 46, 1372–1385. [Google Scholar] [CrossRef]
  20. Hoen, A.; Koetse, M.J. A choice experiment on alternative fuel vehicle preferences of private car owners in the Netherlands. Transp. Res. Part A Policy Pract. 2014, 61, 199–215. [Google Scholar] [CrossRef]
  21. Honarmand, M.; Zakariazadeh, A.; Jadid, S. Optimal scheduling of electric vehicles in an intelligent parking lot considering vehicle-to-grid concept and battery condition. Energy 2014, 65, 572–579. [Google Scholar] [CrossRef]
  22. Koetse, M.J.; Hoen, A. Preferences for alternative fuel vehicles of company car drivers. Resour. Energy Econ. 2014, 37, 279–301. [Google Scholar] [CrossRef]
  23. Parsons, G.R.; Hidrue, M.K.; Kempton, W.; Gardner, M.P. Willingness to pay for vehicle-to-grid (V2G) electric vehicles and their contract terms. Energy Econ. 2014, 42, 313–324. [Google Scholar] [CrossRef]
  24. Sierzchula, W.; Bakker, S.; Maat, K.; van Wee, B. The influence of financial incentives and other socio-economic factors on electric vehicle adoption. Energy Policy 2014, 68, 183–194. [Google Scholar] [CrossRef]
  25. Ahn, J.; Woo, J.; Lee, J. Optimal allocation of energy sources for sustainable development in South Korea: Focus on the electric power generation industry. Energy Policy 2015, 78, 78–90. [Google Scholar] [CrossRef]
  26. De Gennaro, M.; Paffumi, E.; Martini, G. Customer-driven design of the recharge infrastructure and Vehicle-to-Grid in urban areas: A large-scale application for electric vehicles deployment. Energy 2015, 82, 294–311. [Google Scholar] [CrossRef]
  27. Hidrue, M.K.; Parsons, G.R. Is there a near-term market for vehicle-to-grid electric vehicles? Appl. Energy 2015, 151, 67–76. [Google Scholar] [CrossRef] [Green Version]
  28. Huh, S.-Y.; Woo, J.; Lim, S.; Lee, Y.-G.; Kim, C.S. What do customers want from improved residential electricity services? Evidence from a choice experiment. Energy Policy 2015, 85, 410–420. [Google Scholar] [CrossRef]
  29. Langbroek, J.H.M.; Franklin, J.P.; Susilo, Y.O. The effect of policy incentives on electric vehicle adoption. Energy Policy 2016, 94, 94–103. [Google Scholar] [CrossRef]
  30. Lim, S.-Y.; Kim, H.-H.; Yoo, S.-H. Assessment of the Potential Consumers’ Preference for the V2G System. J. Energy Eng. 2016, 25, 93–102. [Google Scholar] [CrossRef] [Green Version]
  31. McLaren, J.; Miller, J.; O’Shaughnessy, E.; Wood, E.; Shapiro, E. CO2 emissions associated with electric vehicle charging: The impact of electricity generation mix, charging infrastructure availability and vehicle type. Electr. J. 2016, 29, 72–88. [Google Scholar] [CrossRef] [Green Version]
  32. Suman, S.; Katiyar, R.; Vijayvargiya, A.; Jain, P.; Bhakar, R. An optimally controlled charging scheme motivating EV owners for supporting grid stability. In Proceedings of the 2016 National Power Systems Conference, Bhubaneswar, India, 19–21 December 2016. [Google Scholar] [CrossRef]
  33. Freeman, G.M.; Drennen, T.E.; White, A.D. Can parked cars and carbon taxes create a profit? The economics of vehicle-to-grid energy storage for peak reduction. Energy Policy 2017, 106, 183–190. [Google Scholar] [CrossRef]
  34. Gough, R.; Dickerson, C.; Rowley, P.; Walsh, C. Vehicle-to-grid feasibility: A techno-economic analysis of EV-based energy storage. Appl. Energy 2017, 192, 12–23. [Google Scholar] [CrossRef] [Green Version]
  35. Li, X.; Chen, P.; Wang, X. Impacts of renewables and socioeconomic factors on electric vehicle demands—Panel data studies across 14 countries. Energy Policy 2017, 109, 473–478. [Google Scholar] [CrossRef]
  36. Woo, J.; Choi, H.; Ahn, J. Well-to-wheel analysis of greenhouse gas emissions for electric vehicles based on electricity generation mix: A global perspective. Transp. Res. Part D Transp. Environ. 2017, 51, 340–350. [Google Scholar] [CrossRef]
  37. Xiang, Y.; Zhou, H.; Liu, J.; Yang, W.; Hong, J.; Wu, Y. Scale Development Simulation for Electric Vehicles. Energy Procedia 2017, 142, 1933–1938. [Google Scholar] [CrossRef]
  38. Choi, H.; Shin, J.; Woo, J. Effect of electricity generation mix on battery electric vehicle adoption and its environmental impact. Energy Policy 2018, 121, 13–24. [Google Scholar] [CrossRef]
  39. Karmaker, A.K.; Ahmed, M.R.; Hossain, M.A.; Sikder, M.M. Feasibility assessment & design of hybrid renewable energy based electric vehicle charging station in Bangladesh. Sustain. Cities Soc. 2018, 39, 189–202. [Google Scholar] [CrossRef]
  40. Mohammadi Landi, M.; Mohammadi, M.; Rastegar, M. Simultaneous determination of optimal capacity and charging profile of plug-in electric vehicle parking lots in distribution systems. Energy 2018, 158, 504–511. [Google Scholar] [CrossRef]
  41. Moon, H.; Park, S.Y.; Jeong, C.; Lee, J. Forecasting electricity demand of electric vehicles by analyzing consumers’ charging patterns. Transp. Res. Part D Transp. Environ. 2018, 62, 64–79. [Google Scholar] [CrossRef]
  42. Sachan, S.; Adnan, N. Stochastic charging of electric vehicles in smart power distribution grids. Sustain. Cities Soc. 2018, 40, 91–100. [Google Scholar] [CrossRef]
  43. Noel, L.; Sovacool, B.K. Why Did Better Place Fail? Range anxiety, interpretive flexibility, and electric vehicle promotion in Denmark and Israel. Energy Policy 2016, 94, 377–386. [Google Scholar] [CrossRef]
  44. Shin, J.; Hong, J.; Jeong, G.; Lee, J. Impact of electric vehicles on existing car usage: A mixed multiple discrete–continuous extreme value model approach. Transp. Res. Part D Transp. Environ. 2012, 17, 138–144. [Google Scholar] [CrossRef]
  45. Bhat, C.R. A multiple discrete–continuous extreme value model: Formulation and application to discretionary time-use decisions. Transp. Res. Part B Methodol. 2005, 39, 679–707. [Google Scholar] [CrossRef] [Green Version]
  46. Kim, J.; Allenby, G.M.; Rossi, P.E. Modeling Consumer Demand for Variety. Mark. Sci. 2002, 21, 229–250. [Google Scholar] [CrossRef]
  47. Bhat, C.R. The multiple discrete-continuous extreme value (MDCEV) model: Role of utility function parameters, identification considerations, and model extensions. Transp. Res. Part B Methodol. 2008, 42, 274–303. [Google Scholar] [CrossRef] [Green Version]
  48. Ahn, J.; Jeong, G.; Kim, Y. A forecast of household ownership and use of alternative fuel vehicles: A multiple discrete-continuous choice approach. Energy Econ. 2008, 30, 2091–2104. [Google Scholar] [CrossRef]
  49. Allenby, G.M.; Rossi, P.E. Marketing models of consumer heterogeneity. J. Econom. 1998, 89, 57–78. [Google Scholar] [CrossRef]
  50. Huber, J.; Train, K. On the Similarity of Classical and Bayesian Estimates of Individual Mean Partworths. Mark. Lett. 2001, 12, 259–269. [Google Scholar] [CrossRef]
  51. Edwards, Y.D.; Allenby, G.M. Multivariate Analysis of Multiple Response Data. J. Mark. Res. 2003, 40, 321–334. [Google Scholar] [CrossRef]
  52. Train, K.E. Discrete Choice Methods with Simulation; Cambridge University Press: Cambridge, UK, 2003; ISBN 9780511753930. [Google Scholar]
  53. Korea Ministry of Land, Infrastructure, and Transport. Statistical Yearbook of MOLIT 2018. Available online: http://stat.molit.go.kr (accessed on 10 July 2020).
  54. Green, P.E.; Srinivasan, V. Conjoint Analysis in Consumer Research: Issues and Outlook. J. Consum. Res. 1978, 5, 103–123. [Google Scholar] [CrossRef]
  55. Green, P.E.; Srinivasan, V. Conjoint Analysis in Marketing: New Developments with Implications for Research and Practice. J. Mark. 1990, 54, 3–19. [Google Scholar] [CrossRef]
  56. Higgins, C.D.; Mohamed, M.; Ferguson, M.R. Size matters: How vehicle body type affects consumer preferences for electric vehicles. Transp. Res. Part A Policy Pract. 2017, 100, 182–201. [Google Scholar] [CrossRef]
  57. Korea Ministry of Trade, Industry and Energy. The 8th Basic Plan of Long-Term Electricity Supply and Demand; Korea Ministry of Trade, Industry and Energy: Sejong-si, Korea, 2018. (In Korean)
  58. Korea Ministry of Environment. Comprehensive Countermeasure for Fine Dust Control; Korea Ministry of Environment: Sejong-si, Korea, 2018. (In Korean)
  59. Hatton, C.; Beella, S.; Brezet, J.; Wijnia, Y. Charging Stations for Urban Settings the design of a product platform for electric vehicle infrastructure in Dutch cities. World Electr. Veh. J. 2009, 3, 134–146. [Google Scholar] [CrossRef] [Green Version]
  60. Shahraki, N.; Cai, H.; Turkay, M.; Xu, M. Optimal locations of electric public charging stations using real world vehicle travel patterns. Transp. Res. Part D Transp. Environ. 2015, 41, 165–176. [Google Scholar] [CrossRef] [Green Version]
  61. Gnann, T. Market Diffusion of Plug-in Electric Vehicles and Their Charging Infrastructure; Fraunhofer Verlag: Stuttgart, Germany, 2015; ISBN 978-3-8396-0933-0. [Google Scholar]
  62. Beggs, S.; Cardell, S.; Hausman, J. Assessing the potential demand for electric cars. J. Econom. 1981, 17, 1–19. [Google Scholar] [CrossRef]
  63. Dagsvik, J.K.; Wennemo, T.; Wetterwald, D.G.; Aaberge, R. Potential demand for alternative fuel vehicles. Transp. Res. Part B Methodol. 2002, 36, 361–384. [Google Scholar] [CrossRef] [Green Version]
  64. Lee, J.; Cho, Y. Demand forecasting of diesel passenger car considering consumer preference and government regulation in South Korea. Transp. Res. Part A Policy Pract. 2009, 43, 420–429. [Google Scholar] [CrossRef]
  65. Khan, S.U.; Mehmood, K.K.; Haider, Z.M.; Rafique, M.K.; Kim, C.-H. A Bi-Level EV Aggregator Coordination Scheme for Load Variance Minimization with Renewable Energy Penetration Adaptability. Energies 2018, 11, 2809. [Google Scholar] [CrossRef] [Green Version]
  66. Korea Ministry of Economy and Finance. Adjustment Method for Energy, Environment and Education Public Sector; Korea Ministry of Economy and Finance: Sejong-si, Korea, 2016. (In Korean)
  67. Korea Electrical Engineering and Science Research Institute. A study on Vehicle to Grid Market. Activation Plan. through Empirical Analysis; Korea Electrical Engineering and Science Research Institute: Seoul, Korea, 2016. (In Korean) [Google Scholar]
Figure 1. The framework of this study.
Energies 13 04248 g001
Figure 2. Sample of the conjoint survey.
Energies 13 04248 g002
Figure 3. The utility of drivers by the battery allowance for V2G.
Energies 13 04248 g003
Table 1. A summary of previous studies.
StudyRegionMethodKey Findings
Hong et al. (2012) [17]KoreaMixed logit modelConsumers are willing to pay more to use the EV charging infrastructure. Social welfare change effected by possible government subsidy polices for EVs.
Egbue and Long (2012) [18]United StatesChi-square testBattery range is the biggest concern affecting uncertainty, followed by cost and the sustainability of fuel source. Subsidizing the cost of EVs and fuel taxes may have a negligible effect on the EV market.
Ziegler (2012) [19]GermanyMultinomial probit modelLow acceptance is influenced by sparse battery charging stations, high battery costs, short driving distance, or a short battery service life.
Hoen and Koetse (2014) [20]DenmarkMixed logit model Multinomial logit modelNegative preferences for limited driving range, considerable range, refueling time, and fuel availability. Preference for AFVs increases with improvements in driving range, refueling time, and fuel availability.
Honarmand et al. (2014) [21]CandaNonlinear programingEV owners preferred to charge in the hour with lower electricity prices while discharge in the hours with higher electricity prices to sell the stored energy. Managing of the charging/discharging of EVs has eliminated the risk of an electricity demand growth during the peak load.
Koetse and Hoen (2014) [22]DenmarkMixed logit model Multinomial logit modelConventional technology is preferred to AFVs because of limited driving range, long recharge/refueling time, and limited availability of refueling opportunities.
Parsons et al. (2014) [23]United StatesRandom utility modelAn increase in the willingness-to-pay (WTP) for EV can be achieved by providing consumers a contract that pays in advance, in the form of subsidy, in exchange for signing a V2G contract.
Sierzchula et al. (2014) [24]30 countriesOrdinary least squaresIncentives and EV adoption display a positive relationship. Charging stations and EV adoption rates display a positive significant relationship.
Ahn et al. (2015) [25]-Optimization simulationReflected the costs incurred by the electricity supply from each energy source to optimize the electricity generation mix for sustainability.
Gennaro et al. (2015) [26]Florence, ItalyScenario analysis with real driving databaseThe increase of electric energy demand from BEVs ranges from 0.7% to 18% of the total demand in the province. V2G interaction strategy can contribute to reducing from 5% to 50% the average daily electric energy demand in specific locations.
Hidrue and Parsons (2015) [27]United StatesContingent valuationRange anxiety, stringent V2G contract, high battery costs, and vehicle model play an important role in the WTP for V2G and EVs.
Huh et al. (2015) [28]South KoreaMixed logit modelElectricity mix is an important consideration in customer choice. Customers are willing to pay more to increase the renewable energy ratio.
Langbroek et al. (2016) [29]Stockholm, SwedenMixed logit modelThe probability of the stated EV adoption increases if policy incentives are offered.
Lim et al. (2016) [30]South KoreaMultinomial logit model
Nested logit model
Increase in available time for power sales has a positive effect on consumers’ marginal WTP. Decrease in residual power and increase in essential connection time have a negative impact on marginal WTP.
McLaren et al. (2016) [31]United StatesScenario analysisCarbon intensity of the electricity grid affects the total emissions associated with EVs. The greenhouse gas (GHG) emissions can be reduced when EV batteries are charged with electricity from renewables.
Suman et al. (2016) [32]New York, United StatesLinear ProgrammingWith optimal solutions, the total charging cost is reduced by 18.5% and aggregator’s revenue is improved by 139% on average. The rise in number of EVs paralleled by an increase in aggregator’s revenue.
Freeman et al. (2017) [33]New York, United StatesA five-year economic model
Sensitive analysis
Electricity sales through V2G system can create positive economic benefits for consumers even if their magnitudes are small. One-way power efficiency and battery lifetime are the key factors for consumers’ electricity transactions.
Gough et al. (2017) [34]United KingdomA hybrid time-series/probabilistic simulationBattery degradation cost and recharging in time have a significant impact on the feasibility of V2G services. The provision of energy to the wholesale electricity market produces an individual vehicle net present value of £8400.
Li et al. (2017) [35]14 countriesMultiple linear regressionThe percentage of renewable energy in electricity generation, number of charging stations, user education level, and population density have apparent and positive impacts on the demands.
Woo et al. (2017) [36]70 countriesWell to wheel analysisThe ratio of resources to the electricity generation mix affects the GHG emissions of EVs. EVs were associated with higher GHG emissions than internal combustion engine vehicles in some countries.
Xiang et al. (2017) [37]-System dynamics simulationCustomer acceptance of EVs promotes adoption of EVs with the support of polices such as subsidies and the construction of charging infrastructures
Choi et al. (2018) [38]South KoreaMixed logit modelAn environmentally friendly electricity generation mix promotes BEV adoption. The renewables-oriented mix scenario most effectively promotes BEV adoption.
Karmaker et al. (2018) [39]BangladeshHybrid Optimization of Multiple Energy Renewables (HOMER)Solar and biogas based EV charging station reduces the burden on the national grid. The designed EV charging station saves approximately $12–$18 per month to recharge an EV which increases the socio-economic standard of EV owner.
Landi et al. (2018) [40]United StatesAn optimization-based problemTwo controlled and uncontrolled charging schemes evaluate the aggregated charging profile of PEVs in parking lots. Reducing the total operating cost weakens the stability of the distribution system.
Moon et al. (2018) [41]South KoreaMixed logit modelConsumers prefer vehicles with lower fuel costs and vehicle prices, as well as diesel-type vehicles. Consumers prefer EVSEs with lower charging costs, shorter time to full charge, and greater accessibility.
Sachan and Adnan (2018) [42]-Optimization simulation with scenario analysisThe impact of different EV charging methods on distribution grid is assessed based on the reduction of network peak load demand and improvement in its operating condition. Wind power flow and electricity price variation are considered with stochastic availability of EVs.
Table 2. Attributes and levels of vehicles for the conjoint survey.
AttributeLevelsDetails
Fuel typeGasoline, Diesel, Full hybrid, PHEV, BEVA full hybrid vehicle mostly uses a gasoline engine and gasoline fuel for driving. However, it generates energy from the engine while driving to run the electric motor. It is possible to drive only by electric motor at the start and during low-speed driving.
A PHEV has an external rechargeable battery, unlike the full hybrid. Hence, it can be driven using only the electric motor at any time.
A BEV uses electricity as fuel and has little noise and a high initial acceleration. However, the travel distance of BEVs after full charge is shorter than that of ICEVs, and the electric charging time is longer than the fueling time of gasoline and diesel.
(Only PHEV and BEV)Electricity generation mixCoal-, Nuclear-, LNG-, Renewable-orientedCoal (coal 61%, nuclear 22%, liquefied natural gas (LNG) 13%, and renewables 4%)
Nuclear (coal 38%, nuclear 43%, LNG 14%, and renewables 5%)
LNG (coal 42%, nuclear 28%, LNG 24%, and renewables 6%)
Renewable (coal 39%, nuclear 26%, LNG 15%, and renewables 20%)
Battery allowance for V2G (%)100, 70, 30, 0The battery allowance level is defined as the maximum proportion of allowable electric energy capacity at which you can lend electricity power from the charged battery of a vehicle. We assumed that the battery of the vehicle is charged up to 100%, and that electricity is mainly lent during the daytime and is recharged before the end of the working day.
Accessibility of fueling/charging facilities (%)10, 50, 80, 100Taking the current supply level of a gasoline stations as reference, the accessibility of fueling/charging stations is defined as the ratio of the number of fueling/charging stations for a specific fuel type to the number of current gas stations.
Fuel cost (KRW/km)50, 100, 150Fuel cost is defined as the cost of driving 1 km.
Vehicle price (KRW 10,000) *2500, 3500, 4500, 5500The cost of buying a car is the purchase price.
* According to the Bank of Korea (www.bok.or.kr), in March 2018, USD 1.00 was KRW 1167.20.
Table 3. Descriptive statistics of the respondents.
CharacteristicsNumber of Respondents (Ratio %)
Total1000 (100%)
GenderMale507 (50.7%)
Female493 (49.3%)
Age range (years)20–29184 (18.4%)
30–39201 (20.1%)
40–49233 (23.3%)
50–59229 (22.9%)
60–69153 (15.3%)
Education levelLess than high school452 (45.2%)
University/college or higher548 (54.8%)
Monthly household incomeUnder 3 KRW million165 (16.5%)
KRW 3–4 million190 (19.0%)
KRW 4–5 million232 (23.2%)
KRW 5–7 million277 (27.7%)
Over KRW 7 million136 (13.6%)
Vehicle usage pattern
DriverYes653 (65.3%)
No (Passenger)347 (34.7%)
Purpose of drivingCommuting483 (74.0%)
Business56 (8.6%)
Leisure/Travel15 (2.3%)
Daily life99 (15.2%)
Fuel cost per monthUnder KRW 100 thousand37 (5.7%)
KRW 100–200 thousand183 (28.0%)
KRW 200–400 thousand373 (57.1%)
KRW 400–700 thousand58 (8.9%)
Over KRW 700 thousand2 (0.3%)
Table 4. The mean and variance of draws for the baseline utility and satiation parameters.
All Respondents (n = 954)Driver Group (n = 618)
Variables Mean   of   β Variance   of   β Mean   of   β Variance   of   β
Baseline
Gasoline (Reference)
Diesel−0.6781***0.9432***−0.0034 0.9823***
Full hybrid−0.2422**0.9738***0.3247*1.0031***
PHEV−0.1556 0.9984***1.5725***1.0179***
BEV−0.0214 0.9794***2.1286***1.0403***
Plug-in hybrid or ElectricElectricity generation mixcoal-oriented (Reference)
nuclear-oriented−0.0093 0.9745***−0.8987***1.0046***
LNG-oriented0.1987*0.9962***1.0334***1.0319***
Renewable-oriented0.0434 0.9777***2.3921***1.0164***
Battery allowance for V2G−0.001 0.9972***−0.3885**1.0219***
(Battery allowance for V2G)20.2144***0.9764***0.6969***1.0108***
Accessibility of fueling/charging stations1.7523***0.8665***5.5836***0.9828***
Fuel cost−1.7892***5.3306***−0.9123***1.7842***
Vehicle price−0.7276***0.4485***−0.4063***0.2517***
Satiation
Mean of δ Mean of α Mean of δ Mean of α
Gasoline−1.01963***0.2651***−0.99107***0.2707***
Diesel−1.02683***0.2637***−1.48748***0.1843***
Full hybrid−0.85732***0.2979***−1.25058***0.2226***
PHEV−0.85923***0.2975***−2.47262***0.0778***
BEV−0.75561***0.3196***−2.55786***0.0719***
Accessibility of fueling/charging stations−1.11199***0.2475***−3.97683***0.0184***
Fuel cost0.308831***0.5766***0.076437***0.5191***
*, **, and *** denote significance levels of 10%, 5%, and 1%, respectively.
Table 5. Attribute levels used in the market simulation.
Alternatives
Fuel typeGasolineDieselFull hybridPHEVBEV
Electricity generation mix---Scenario AScenario A-1Scenario B
Coal (%) 46.00%36.10%34.40%
Nuclear (%) 30.70%23.90%22.90%
LNG (%) 17.10%18.80%12.80%
Renewable (%) 6.30%20.00%30.00%
Battery allowance (%)---0/10/30/50%
Accessibility of fueling/charging stations (%)100%100%100%100%27.16%
Fuel cost (KRW/km)111.0671.4766.5872.7529.21
Vehicle price (KRW 10,000)14311739237327302807

