Article

Cost and Energy Reduction of a New nZEB Wooden Building

Nearly Zero Energy Buildings Research Group, Department of Civil Engineering and Architecture, Tallinn University of Technology, Ehitajate tee 5, 19086 Tallinn, Estonia
*
Author to whom correspondence should be addressed.
Energies 2020, 13(14), 3570; https://doi.org/10.3390/en13143570
Submission received: 2 June 2020 / Revised: 2 July 2020 / Accepted: 6 July 2020 / Published: 10 July 2020
(This article belongs to the Special Issue Energy Performance of Buildings)

Abstract

:
The current study demonstrates the possibilities of reducing energy use and construction costs and provides evidence that wooden nearly-zero-energy buildings (nZEB) are technically possible at affordable construction costs by using novel design processes and procurement models that enable scalable and modular production. The energy efficiency solutions were derived by increasing/decreasing the insulation value of the building envelope in successive steps. Financial calculations were based on the investment needed to achieve the nearly-zero-energy levels. Overall, many opportunities exist to decrease the cost and energy use compared to the current (pre-nZEB) practice because the net present value can change up to 150 €/m² on the same energy performance indicator (EPI) level. The EPI in the cost-even range was reached by combining a ground-source heat pump (between 115 and 128 kWh/(m2·a)) and efficient district heating (between 106 and 124 kWh/(m2·a)). As energy efficiency decreases, improving energy efficiency becomes more expensive by insulation measures. Throughout the EPI range the most cost efficient was investment in the improvement of the thermal transmittance of windows (3–13 €/(kWh/(m2·a))) while investments in other building envelope parts were less effective (4–80 €/(kWh/(m2·a))). If these were possible to install, photovoltaic (PV) panels installed to the roof would be the cheapest solution to improve the energy performance. Integrated project delivery procurement (design and construction together) and the use of prefabricated wooden structures reduced the constructing cost by half (from ~2700 €/net m2 to 1390 €/net m2) and helped to keep the budget within limits.

Graphical Abstract

1. Introduction

In the European Union, the Energy Performance of Buildings Directive (EPBD) recast [1] set an ambitious target of nearly-zero-energy buildings (nZEB) for 2019/2021. According to the EPBD, nZEB should have very high energy performance, which means that nearly zero or a very small amount of energy required should be covered to a very significant extent by energy from renewable sources. Meeting the minimum energy performance requirements set for nZEB should be cost effective. The EPBD defines a cost-optimal level as “the energy performance level which leads to the lowest cost during the estimated economic lifecycle” from two different perspectives: financial (looking at the investment itself at the building level) and macro-economic (looking at the costs and benefits of energy efficiency for society as a whole). By now, good progress has been made in finding cost-optimal energy performance measures, especially when the net present value of the global cost calculation method is used [2,3].
For the constructor, who is the service provider, the construction cost is more important than the whole lifecycle cost. To achieve small heat losses in cold climates, the building envelope of nZEB should be better insulated than business as usual and airtight [4,5]; this will occupy a larger space and increase construction costs. When the building envelope is well insulated, the service systems and energy source will become more important factors in achieving nZEB.
A review of the literature reveals that more research is needed to find cost-effective nZEB solutions for wooden buildings in a cold climate. The current study demonstrates the possibilities of reducing energy use and construction costs and provides evidence that wooden nZEB are technically possible at affordable construction costs by using novel design processes and procurement models that enable scalable and modular production. In our case a children’s day-care centre was selected as an example building. The study focuses on issues concerning more cost-efficient passive solutions to reach the nZEB level.
Including the Introduction, the paper is divided into five main sections. A literature review is presented in Section 2. The case study building and input for the energy simulations and cost calculations are described in Section 3 (Methods). Results and Discussion are presented in Section 4. Conclusions based on the studied building are presented in Section 5 (Conclusions). The paper ends with the References.

2. Literature Review

Many researchers [6,7] have determined that in order to reduce energy and environmental impacts of buildings, it is crucial to reduce the energy use first to a minimum (minimal heat loss of the building envelope) by energy-efficient technologies, and to then apply renewable technologies to offset the remaining energy consumption. To find a good strategy for energy performance, careful and detailed designs are needed [8]. Rey-Hernández et al. [9] analysed strategies to achieve nZEB in Spain and showed that the primary energy indicator, renewable energy generation, and renewable energy ratio could be useful tools for the energy analysis of the nZEB according to the requirements in the European regulations. Garcia and Kranzl [10] analysed nZEB strategies in four EU countries and found that climate conditions, energy requirements, primary energy factors, ambition levels, and calculation methodologies lead to the problem of an uneven cross-country comparison. Therefore, country/climate-specific analyses are needed.
Pikas et al. [11] showed that the extra costs required for nZEB are around 65 €/m2 (heated area) compared to minimum requirements in 2015. Alanne et al. [12] investigated different heat loss properties of the building envelope and various service system options in educational buildings in Finland and showed that the difference in construction costs (above the reference) is 30–65 €/m2. Apollo and Miszewska-Urbańska [13] analysed the influence of passive house technology on the time and cost of the construction investment and showed that the application of passive house technology increases the investment cost by 38% more than the conventional technology. Nevertheless, the cost of an energy efficient building is not always higher than that of a conventional building. Colclough et al. [14] showed that nZEB can be constructed at no extra cost over traditionally built dwellings in Ireland. Zinzi and Mattoni [15] identified solutions to reduce construction costs of nZEB and showed a maximum 15% reduction of energy related construction costs in continental Italy. The question remains whether the reduction of the construction costs of nZEB also applies in cold climates.
Sankelo et al. [16] showed that a highly insulated building envelope is not a cost-optimal energy performance measure; rather, improvement of the ventilation system, onsite use of solar energy, and employing a light control strategy are preferable ways of improving the building energy performance. Michelsson et al. [17] analysed alternative energy-saving design concepts for a typical, new, detached house design in Finland and showed that the payback period is the shortest for air source heat pumps.
Cost reduction is not limited to energy related measures. Bostancioğlu [18] showed that the building shape factor has a significant impact on construction, energy, and lifecycle costs. Zinzi et al. [19] documented the potential for cost reduction in the design and construction process of nZEB-level apartment buildings using a survey that covered close to 100 respondents. Although slightly different expectations are observed in different countries, the need to develop an integrated design process in the planning phase in order to avoid extra costs received the highest score in four countries. Zhang et al. [20] analysed the cost of prefabricated concrete building façade elements and showed that the key to economic viability is to reduce the production cost and to optimize the thermal performance of the novel isolation material Aerogel. Tam et al. [21] showed that up to 100% cost saving can be achieved in precast construction compared to traditional construction. These examples indicate that other measures influence the cost reduction much more than energy-related measures.
When operational energy decreases, the relative importance of embodied energy will increase. Among the different building materials, metal and concrete have the highest contribution to embodied energy and embodied carbon [22,23]. Guo et al. [24] investigated the energy saving and carbon reduction performance of wooden residential buildings in China and showed that the estimated energy consumption and carbon emissions for wooden buildings are 10% and 13% lower, respectively, than those of reinforced concrete buildings in view of a lifecycle assessment. Liu et al. [25] examined the feasibility of using wood as an alternative solution to reinforced concrete for a seven-storey reference building in China. They showed that using wood would reduce energy consumption by more than 30% and decrease CO2 emissions by more than 40%. Lien and Lolli [26] showed that wooden construction elements could be more expensive than concrete elements.

3. Methods

The analysis includes detailed energy performance-related costs of the actual solution components compared with the current practice (referred to as the base case (BC)). The costs due to operational energy use and renewable energy harvesting are calculated. The procurement method and cost data were obtained by interviewing owners and construction company representatives.

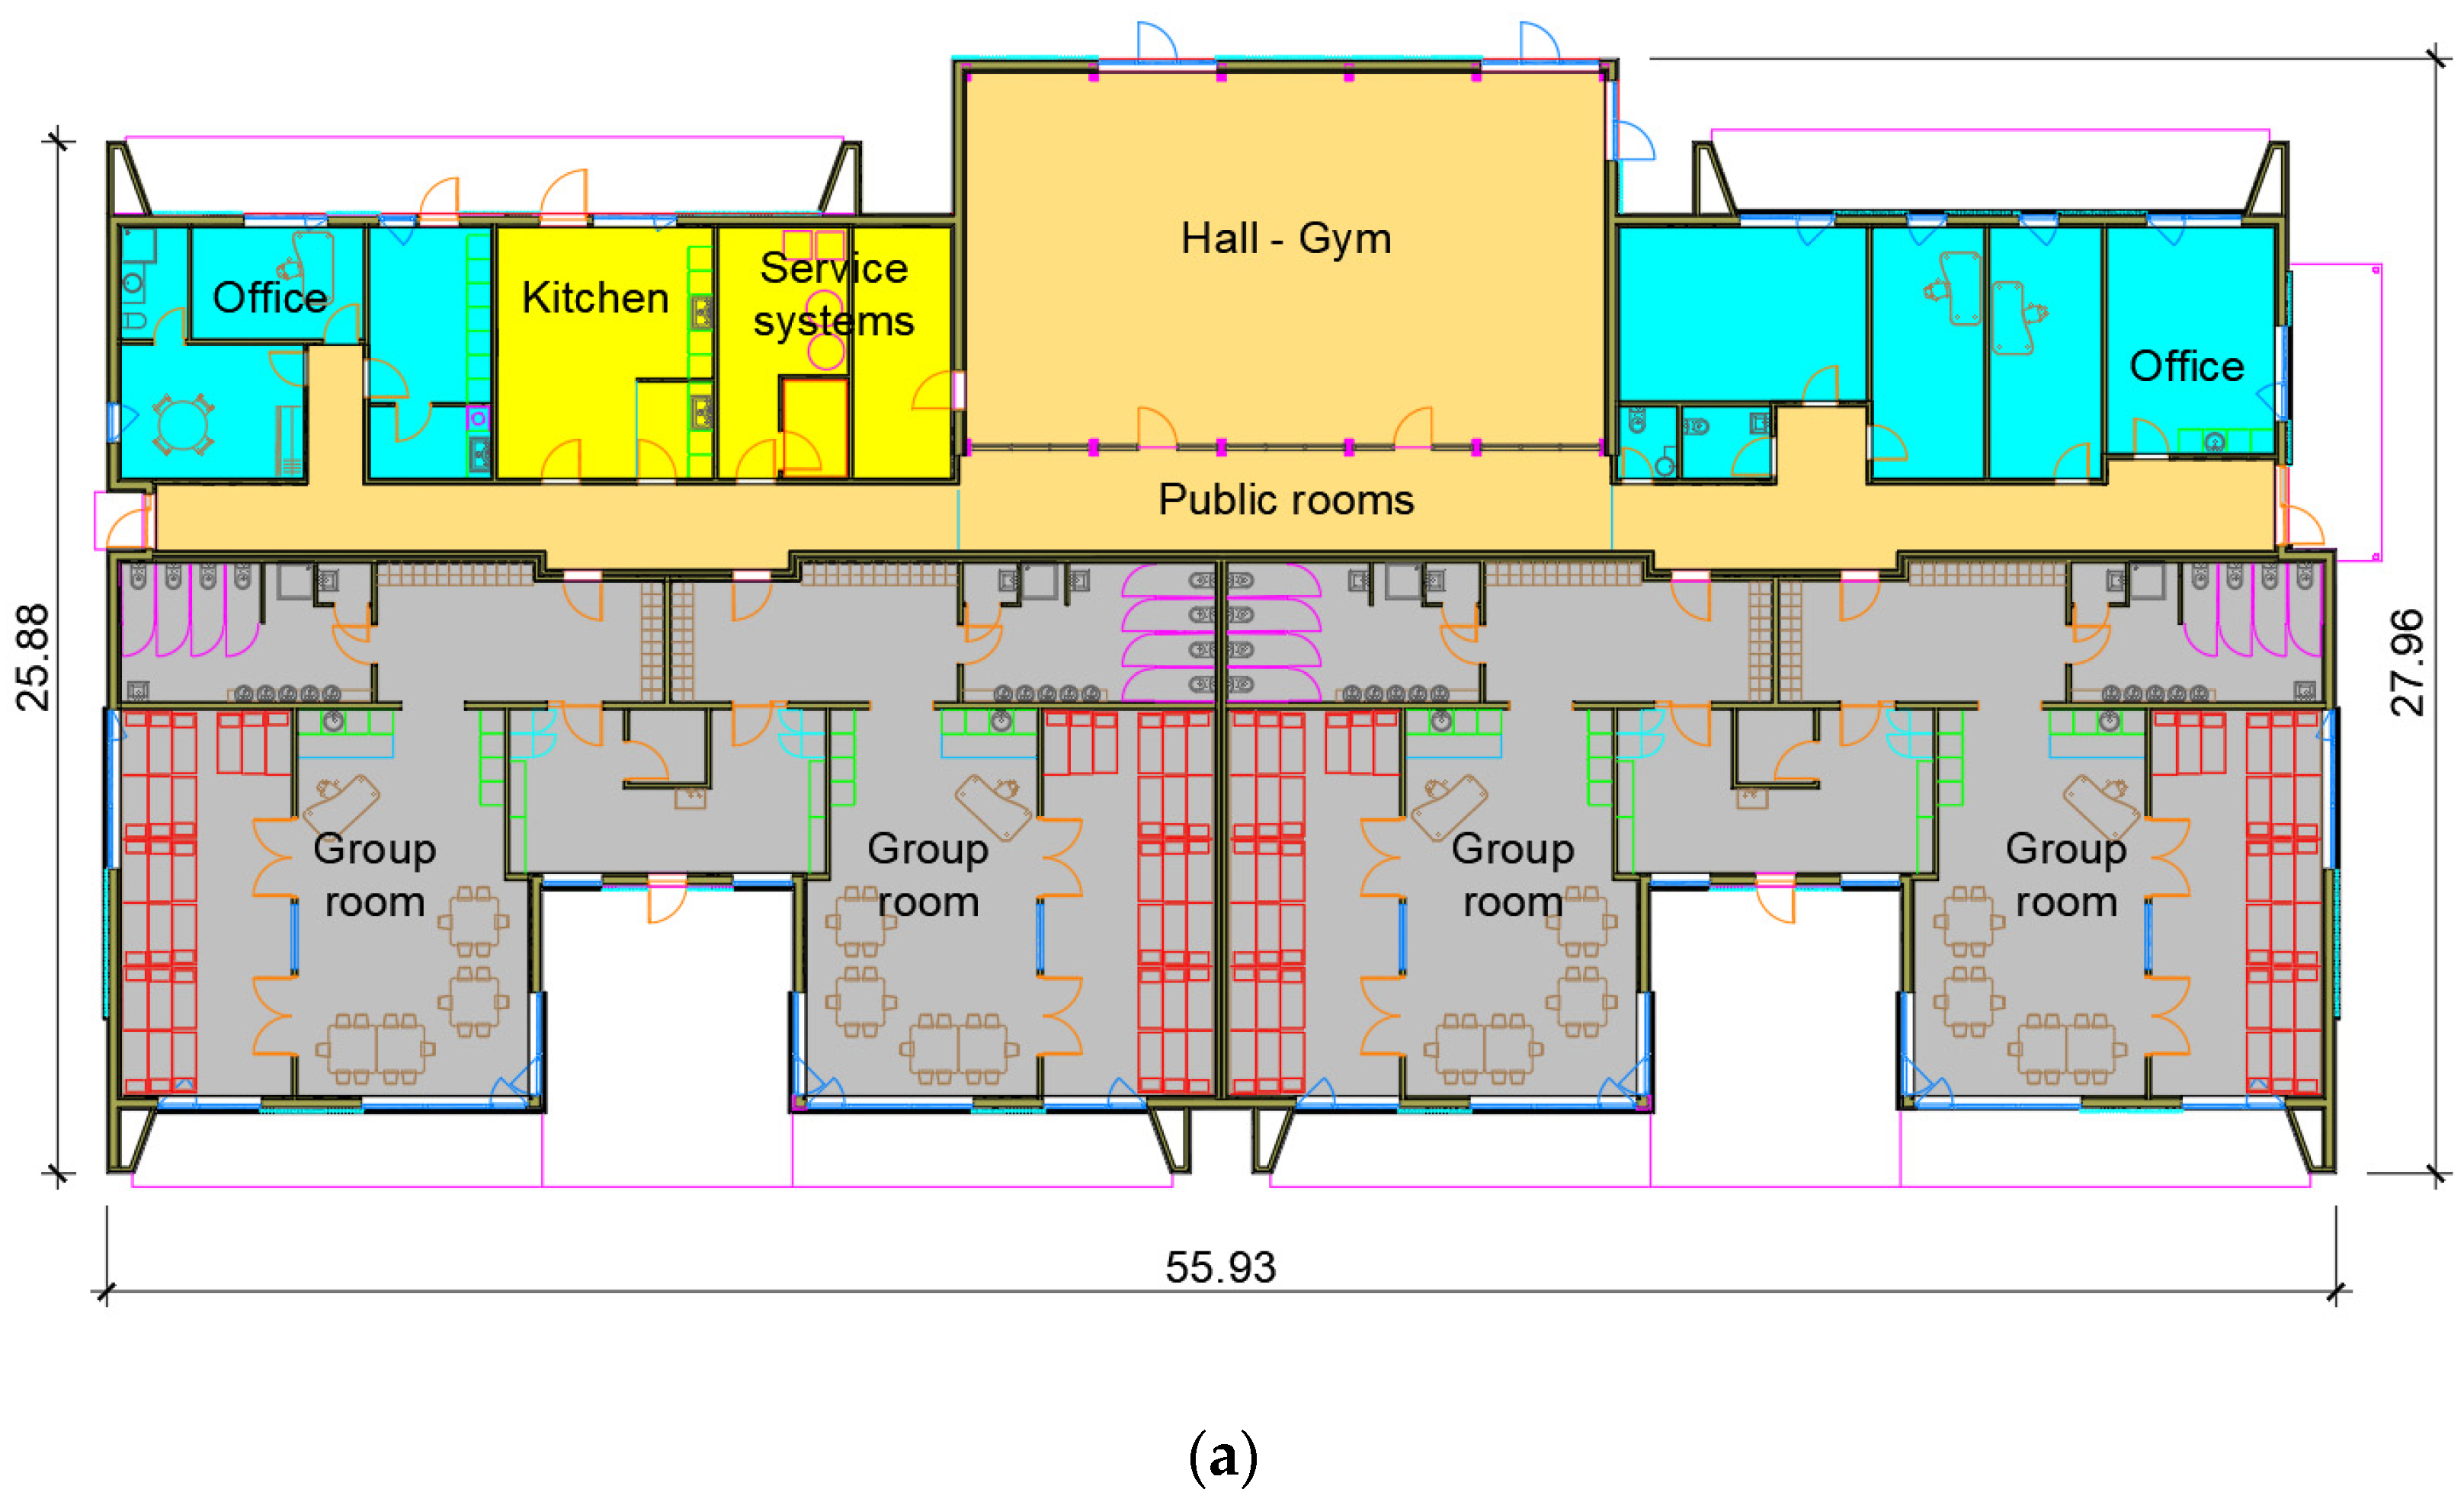
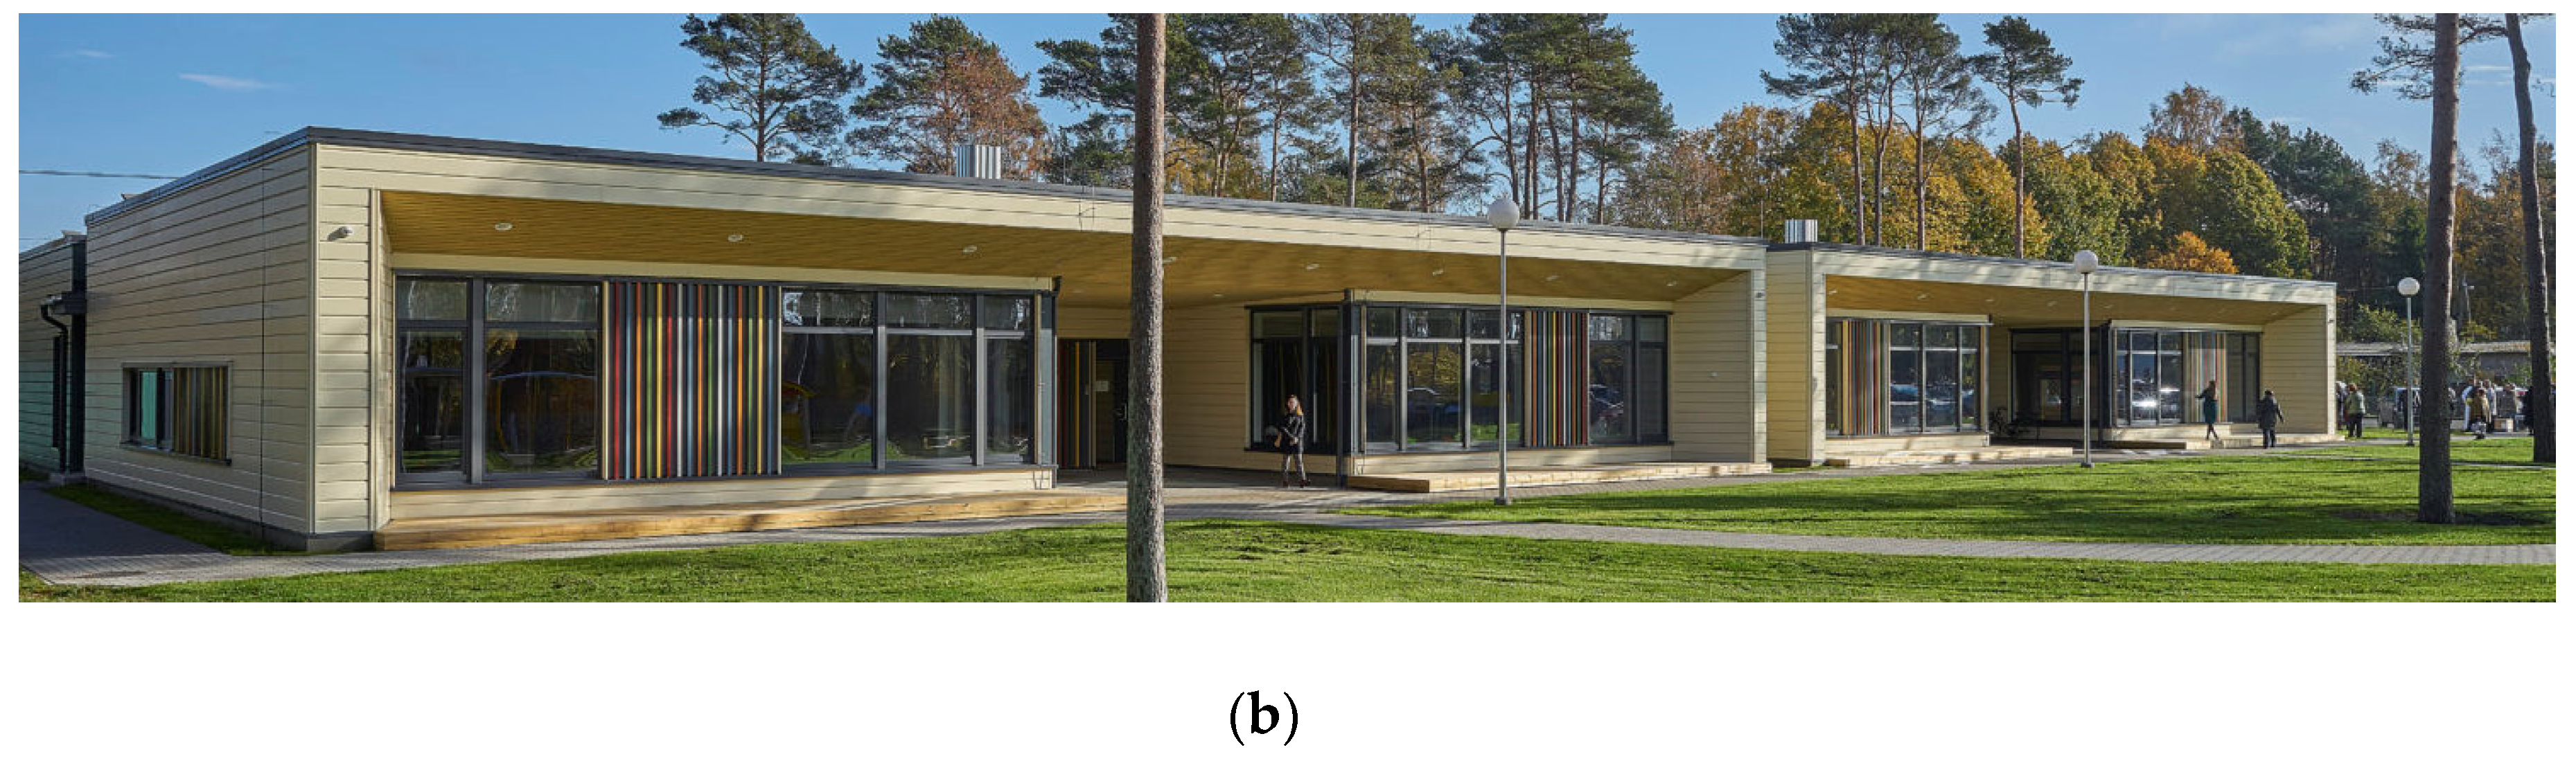
3.1. Description of The Case Study Building

The case study day-care centre is a single-storey timber-frame building designed for 80 children (4 groups, 20 children in each) (see Figure 1). Its floor is an insulated concrete slab on the ground with floor heating. Wooden frame windows with triple glazing are used. The ventilation system has four supply–exhaust air handling units with heat recovery. The supply air is directed to the group rooms. The exhaust air is removed from toilets, bathrooms, and dressing rooms. There is no cooling system. Basic information about the building is given in Table 1.

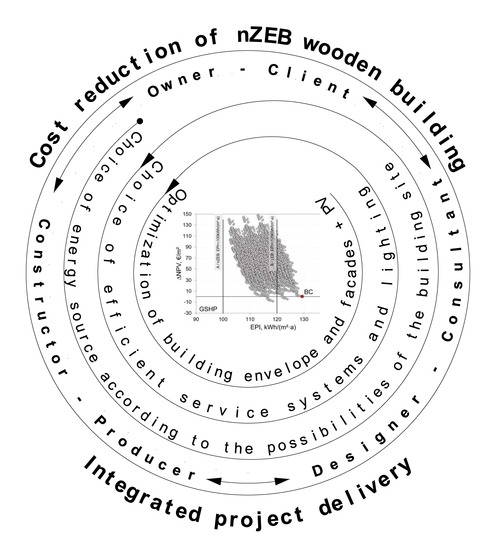
3.2. Design and Construction Process

The local municipality as the owner of the day-care centre was responsible for selecting partners to design and construct the building by using the public procurement process. The type and evaluation method was price; lowest is best (automatic evaluation).
The aim of the procurement was to design at the optimum cost a building that meets the established needs and requirements, which would be perfectly suitable, would be as durable and long-lasting as possible and with low maintenance costs. Construction quality and rationality in operating costs had to be ensured in the best possible way. The design documentation was compiled according to standard [27]. The classification of construction costs was done according to standard [28].
The estimated cost of the procurement for setting up a day-care centre was 1,292,000 € + subscriber reserve (7%) + value added tax (VAT, 20%) [29].

3.3. Indoor Climate and Energy Simulations

Dynamic energy simulation software IDA Indoor Climate and Energy 4.7.1 (IDA-ICE) [30] was used. The software used for simulations has been validated [31,32] and widely used in previous indoor climate and energy simulation studies [33,34,35,36,37]. The results obtained from the dynamic simulations were used to assess the energy savings potential of different measures and to calculate the energy use of buildings mainly with different structural and also some technical solutions.
A room-based simulation model was constructed for the energy simulations. Each room was modelled as a separate zone (in total 37 zones, see Figure 1a). Simulation models were constructed according to the architectural floor plan, views, and sections of the buildings. The solutions for openings and the building envelope were selected according to the building design. For solar shading, a roof overhang as an architectural element, was used. The solar factor of windows was 0.55.
Energy simulations were carried out in the course of standard use of the building. The standard use of the building sets limits for energy simulations in terms of the building’s occupied hours, ventilation air flow rates, heating and cooling set points, and the maximum heat gains from occupants, appliances, and lighting during the occupied hours [38]. The Estonian test reference year (TRY) [39] was used for outdoor climate in the energy simulations. Regardless of the building’s location, the same TRY applies for all buildings in Estonia. The indoor climate and energy use of the building were calculated according to the standard use of buildings (Table 2):
  • Indoor temperature heating set point 21 °C;
  • Air flow rate of supply and exhaust ventilation during occupied hours ±1 h before and after 3.0 l/(s·m2), 3.6 h−1. Supply air temperature 18 °C;
  • Standard use of domestic hot water (DHW): 15 kWh/(m2∙a), i.e., 258 l/(m2·a) at ΔT = 50 K;
  • Standard use of electricity: for appliances and lighting 12.51 kWh/(m2∙a); for circulation pumps 0.5 kWh/(m2∙a);
  • Internal heat gains: inhabitants 8 W/m2 with a usage rate 0.4 (representing average occupancy 4.4 m2 per person); appliances and equipment: 4 W/m2 with usage rate 0.4; lighting 12 W/m2 with a usage rate 0.4.
  • Estonian TRY HDD 4160 °C/d at ti +17 °C.
Initial energy simulations were performed to assess the impact of individual components of the building envelope on the energy use of the building. The variable of the individual modifiable component was the thermal transmittance of the relevant envelope component. In addition to the thermal transmittance, the effect of the building’s air permeability was assessed. In different simulation models only one component was changed, and the result was compared with the energy use of the BC. Besides assessing the impact of the individual components on the building’s energy use, the calculation of the energy efficiency indicator (EPI) was performed for all simulated cases.
Local electricity production was added to the architecturally and technically appropriate combinations. Electricity generation with solar panels was considered a solution for local production of renewable energy.
The energy performance of buildings is expressed as an annual primary energy (PE) usage and is presented as the EPI (kWh/(m2·a). The EPI includes the heat and fuel consumption for space heating, heating of ventilation and infiltration air, DHW and cooling as well as electricity for lighting, electrical appliances, and technical systems. To calculate the EPI from delivered energy, the conversion factors for energy carriers are:
  • electricity 2.0;
  • district heating (DH) 0.9;
  • efficient district heating (eff DH) 0.65.
The nZEB criterion (class “A”) for the day-care centre is EPI ≤ 100 kWh/(m2·a), calculated as EPI ≤ 120 kWh/(m2·a) (class “B”) subtracted the local electricity production 20 kWh/(m2·a).

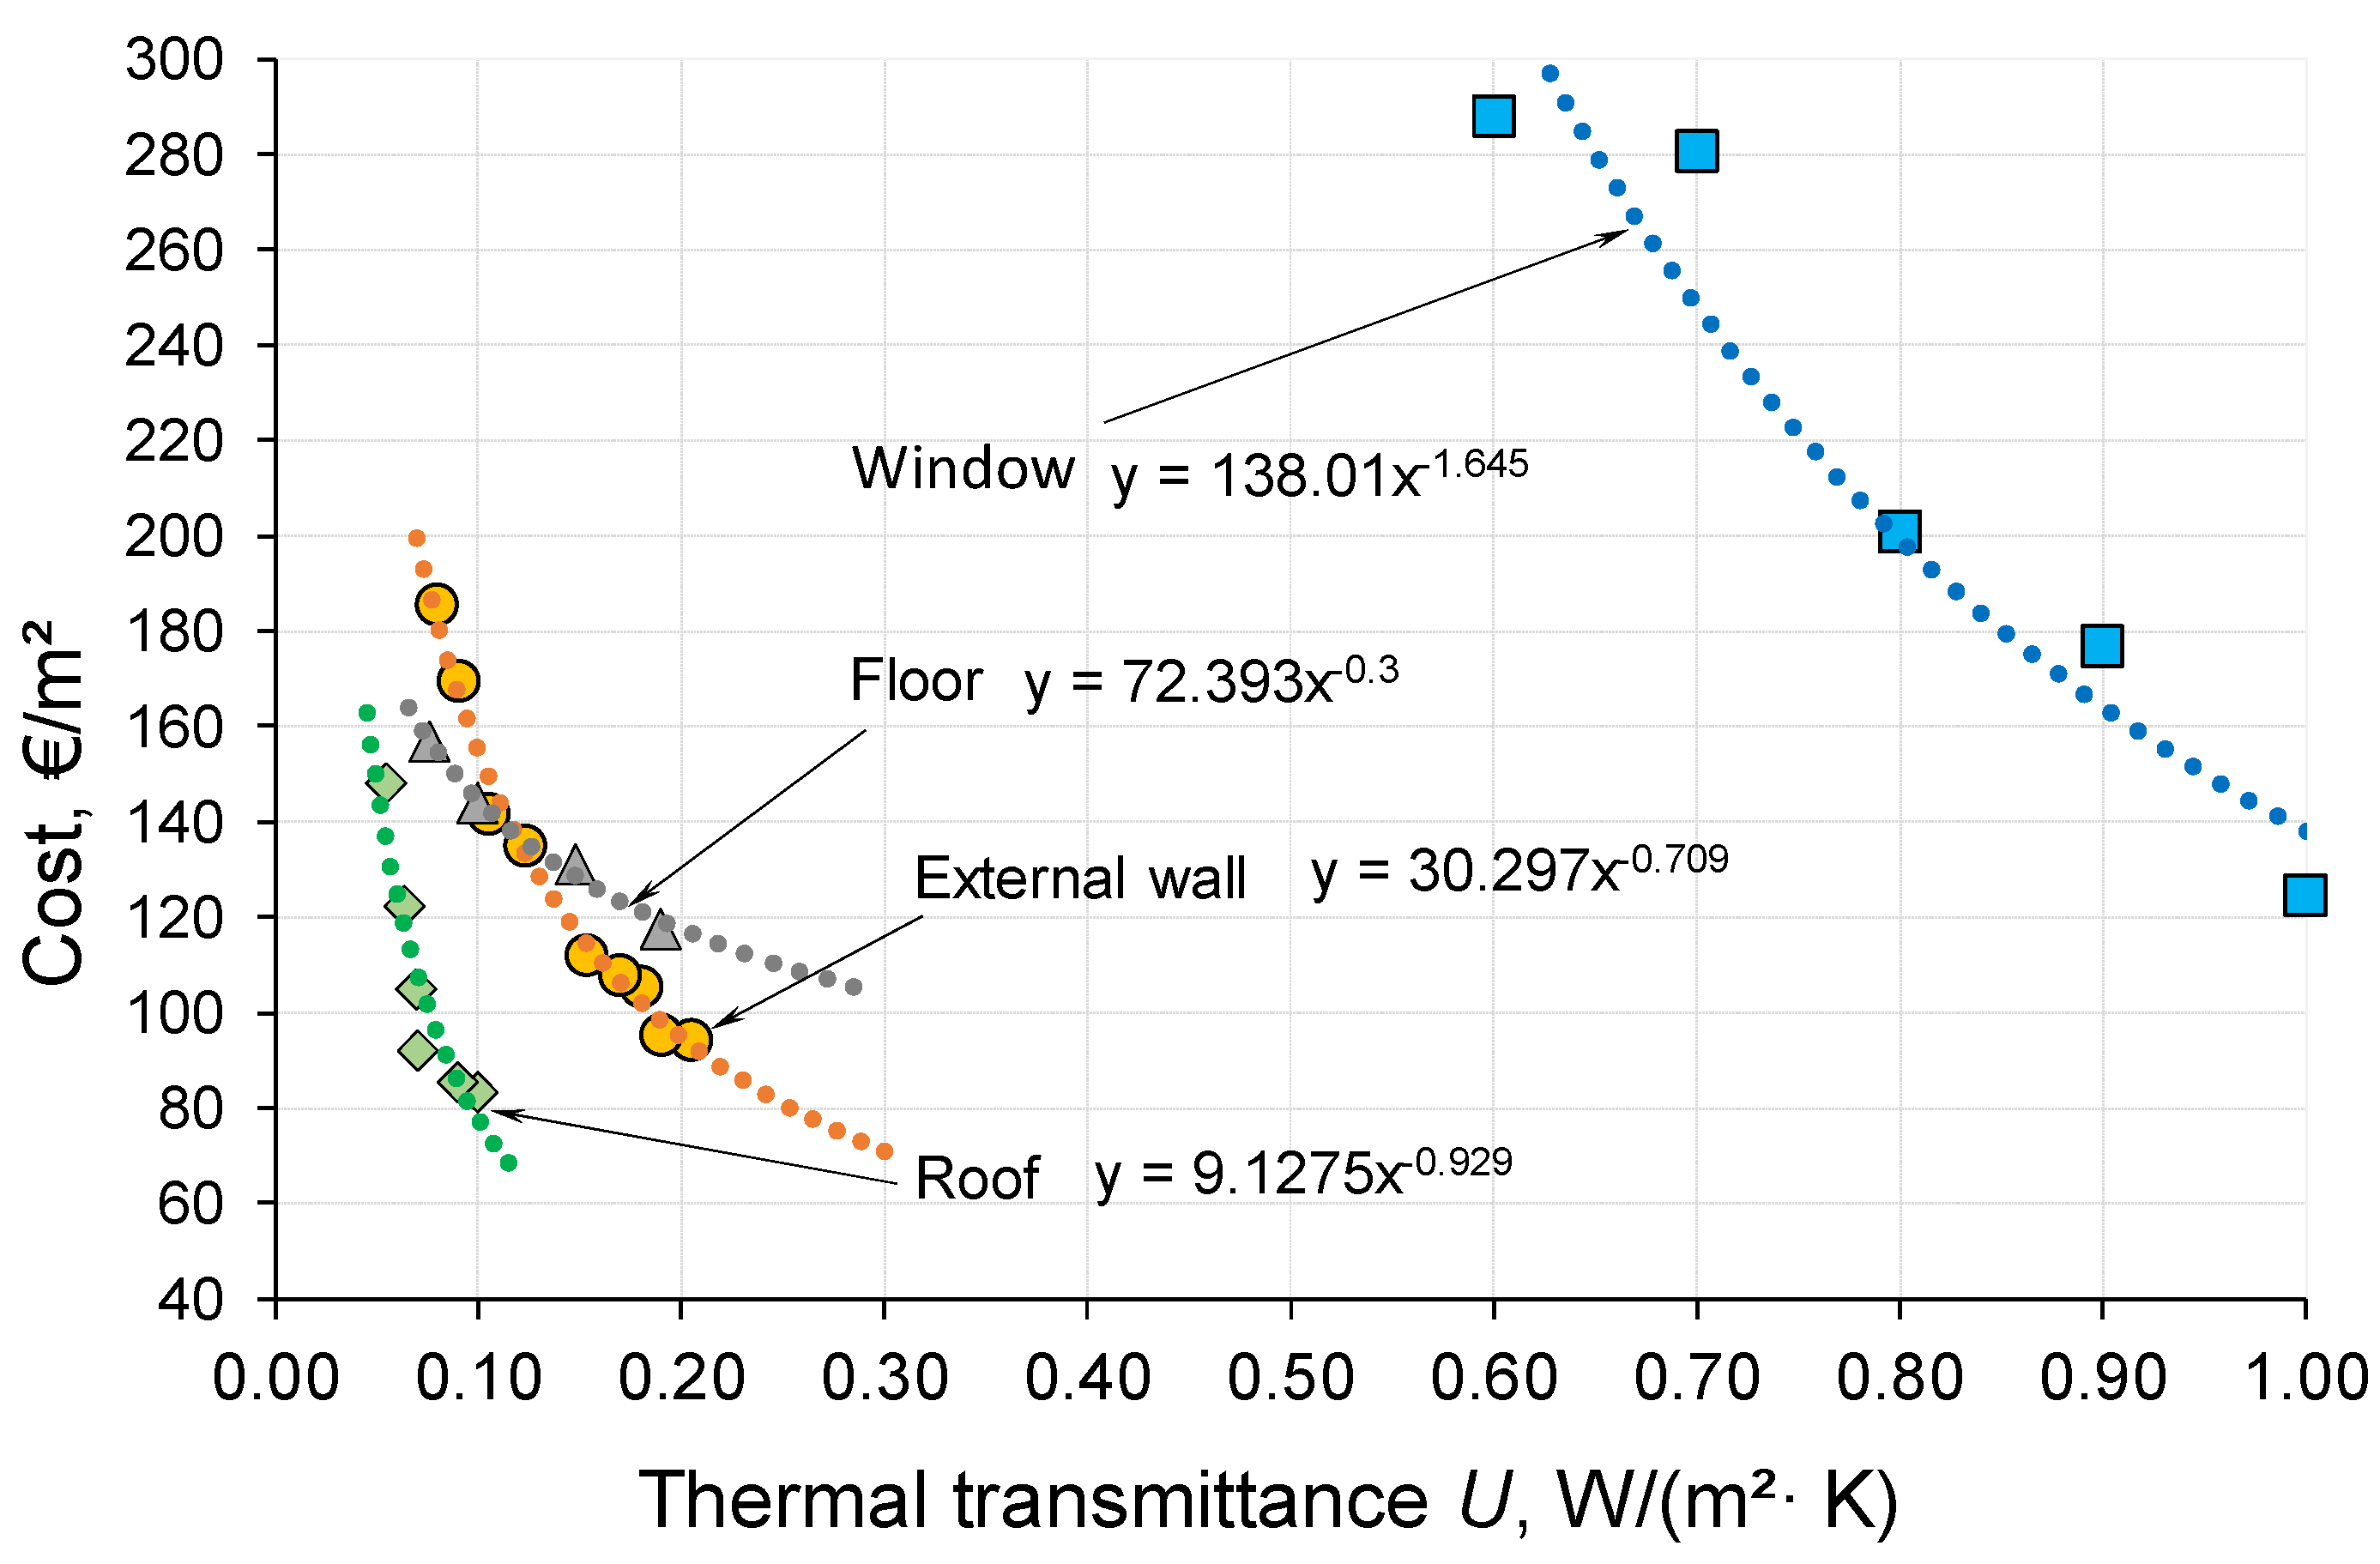
3.4. Cost Effectiveness Calculations

The building envelope solutions are derived by increasing/decreasing the insulation thickness of the external walls, roof, and ground floor in successive steps. The costs of the structural solutions for building based on the bids were received from a construction company and compared with other sources [16]. The repair and maintenance costs were considered in calculating the costs for the reference building. The budget officers provided unit costs per square metre for various structural solutions and openings, which also included the costs of materials and installation. An example of the price deviations depending on the thermal transmittance (U) is presented in Figure 2. None of the presented costs include value added tax (VAT).
In cost-effectiveness calculations, the investment costs for the ventilation system and PV panels were estimated as follows: improvement of the specific fan power (SFP) of the air handling unit (AHU) required an additional investment of 1000 € from SFP 1.8 to SFP 1.75 and 2000 € to achieve SFP of 1.5; the investment cost of PV panels was 1000 € per installed 1 kW of power of the PV system. The financial calculations are based on [40]. The cost-effectiveness of different structural solutions was estimated using the net present value (NPV) method:
C G ( τ ) = C i + i = 1 τ ( C a , i ) R d ( i ) )
where τ is the calculation period; CG(τ) is the total cost (refers to the starting year) over the calculation period; Ci is the initial investment costs for a measure or set of measures j; Ca,i (j) is the annual cost during year i for a measure or set of measures j; Rd(i) is for the discount factor for year i.
The cost-effectiveness of the additional costs related to structural solutions and renewable energy solutions that were needed to meet the requirements of the nZEB-level building was assessed as follows:
Δ NPV = ( C G nZEB C G r e f ) / A f l o o r
The comparison was done relative to a reference building, so the relative values are more relevant than the absolute figures.
The discount was calculated using the calculated interest rate and the relative price increase during the calculation period (see Table 3). Depending on the uses of the buildings, the cost-effectiveness calculation period was chosen to be 20 years (for non-residential buildings). The interest rate of the investment was chosen based on the Estonian National Bank’s statistics and the current market loan interest rates. The discount was based on the real interest rate of 4.0%, which corresponds to the rate of return of 5% when inflation is 1%. The real escalation of energy prices for the calculation period was taken at 2% per annum, similar to previous studies [41,42].
To compare the cost-effectiveness of different solutions, the investment cost and energy costs were used. The costs were adjusted to the current euro values and were used to compare different combination packages. If the latter are equal to or smaller than those in the reference case, the insulation measure can be considered economically viable. Financial calculations were based on the investments needed to achieve the nZEB level. In financial calculations of the additional cost of the measure/package, the prices payable by the customer, including all applicable taxes, VAT (20%) and support, were considered. The calculations did not consider the potential support that may apply to the introduction of various technologies related to the production of renewable energy.
The cost of building components was calculated by totalling the different types of expenses and by applying a discount rate to them using the discount factor.
The criterion of profitability is that the net revenue generated and discounted during the economic life of the investment should be greater than the initial investment.
The cost of the EPI unit was calculated as a derivative of the change of the EPI and the change of the ΔNPV:
cos t   of   EPI   unit = Δ EPI / Δ NPV  
The cost of the EPI unit was calculated considering one-step improvement at different EPI levels.

4. Results and Discussion

4.1. The Design and Construction

To find a partner for the design and construction of the day-care centre, the local municipality conducted two procurement processes:
  • First: design and later construction separately;
  • Second: integrated delivery (design + construction together) with a target price.
In total, four tenders were submitted for the first design procurement. The designer was selected with a total price of 89,000 € [43]. The design process lasted from 8 August 2016 to 4 May 2017. The architectural solution was prepared based on the client’s initial task. The building also had a creative room for about 40 people, with the necessary facilities. The creative room enabled us to organize circular work and joint activities of children and their parents. The aim of the architectural solution was to create a unique public building that enriches the garden city, which would be sensitive to the local nature and the built context. The building’s architectural solution was based on a single storey building with as playful and logistically diverse mobility facilities as possible. The cost of the building was estimated based on the final design solution because lifecycle cost changes (LCC) were not part of the design process. After the design, the budget of the building exceeded 3 million euros (twice as much as initially planned). This price was too high for the municipality. The competition was considered as failed after the second step, when all the offers exceeded the expected cost limit set in the competition conditions. Therefore, a second procurement was needed.
A second competition was announced following integrated delivery (design + construction cost). In both procurement cases, the final evaluation was done based on the lowest cost to construct the buildings. In total, two tenders were submitted to the second procurement—for design and construction procurement (integrated delivery). The best price was 1,582,007 € (construction price 1,478,511 € + subscriber reserve (7%) 103,496 €) [44]. The total price with VAT (20%) was 1,898,408 €. The design process lasted from 28 July 2017 to 28 September 2018. The building was publicly opened on 12 October 2018. The total construction cost of the building was 1,478,511 € (1390 €/net m2). The building was constructed with prefabricated wooden elements. It is noteworthy that the construction time on site was less than five months.
According to the new solution, the building was designed from wood (instead of concrete that was the main construction material for the first solution). Cheerful and child-friendly design solutions were used in the interior and exterior design. Each group of children had its own entrance. The design of the building was thoroughly thought out and offers choices for children and staff, promotes a variety of activities, and is very functional. In the middle of a pine forest in the yard, there are amusement playgrounds for children that take into account their age-specific characteristics. Each group has its own shelter, patio, and play area in the yard with exciting activities for every child.
Integrated project delivery procurement and a prefabricated wooden building helped to keep the budget within limits. Kantola and Saari [45] conducted a workshop for gathering information and developing the layouts for procurement methods and found that the design must be included in the same contract as the construction work so that the bidders are able to use their expertise to make innovations and improve the whole segment of nZEB construction. In the studied case, this idea was proved in practice. Integrated project delivery (design and construction together) procurement reduced the construction cost of the new building by half. No energy performance optimization covers such a large cost difference.

4.2. Energy Performance Calculations

For the BC, the designers’ first solution was selected. It was based on the wood-house producer’s standard solutions. The EPI without local renewable electricity production was 140 kWh/(m2·a). This corresponds to energy performance certificate class “C” [46]. By adding the local electricity production by PV panels on the roof, the energy performance certificate class “A” (nZEB) can be achieved. Table 4 shows the calculated annual energy performance. Sankelo [16] analysed the cost-optimal energy performance of a new day-care building in a similar (cold) climate and obtained the target energy use with similar envelope properties in the same range as the BC.
The energy calculations concerning heating systems take into account the energy use for space heating, the heating of ventilation air, and DHW. The use of heat and electricity is treated separately in order to consider the source of delivered energy. The energy use of the heating system is calculated taking into account the efficiency of the heat source and the losses related to the distribution and output of the heat. The efficiency factors of the heat source, distribution, and output of the heat show large deviations in the EPI. The EPI of the BC with different heat sources is presented in Table 5.

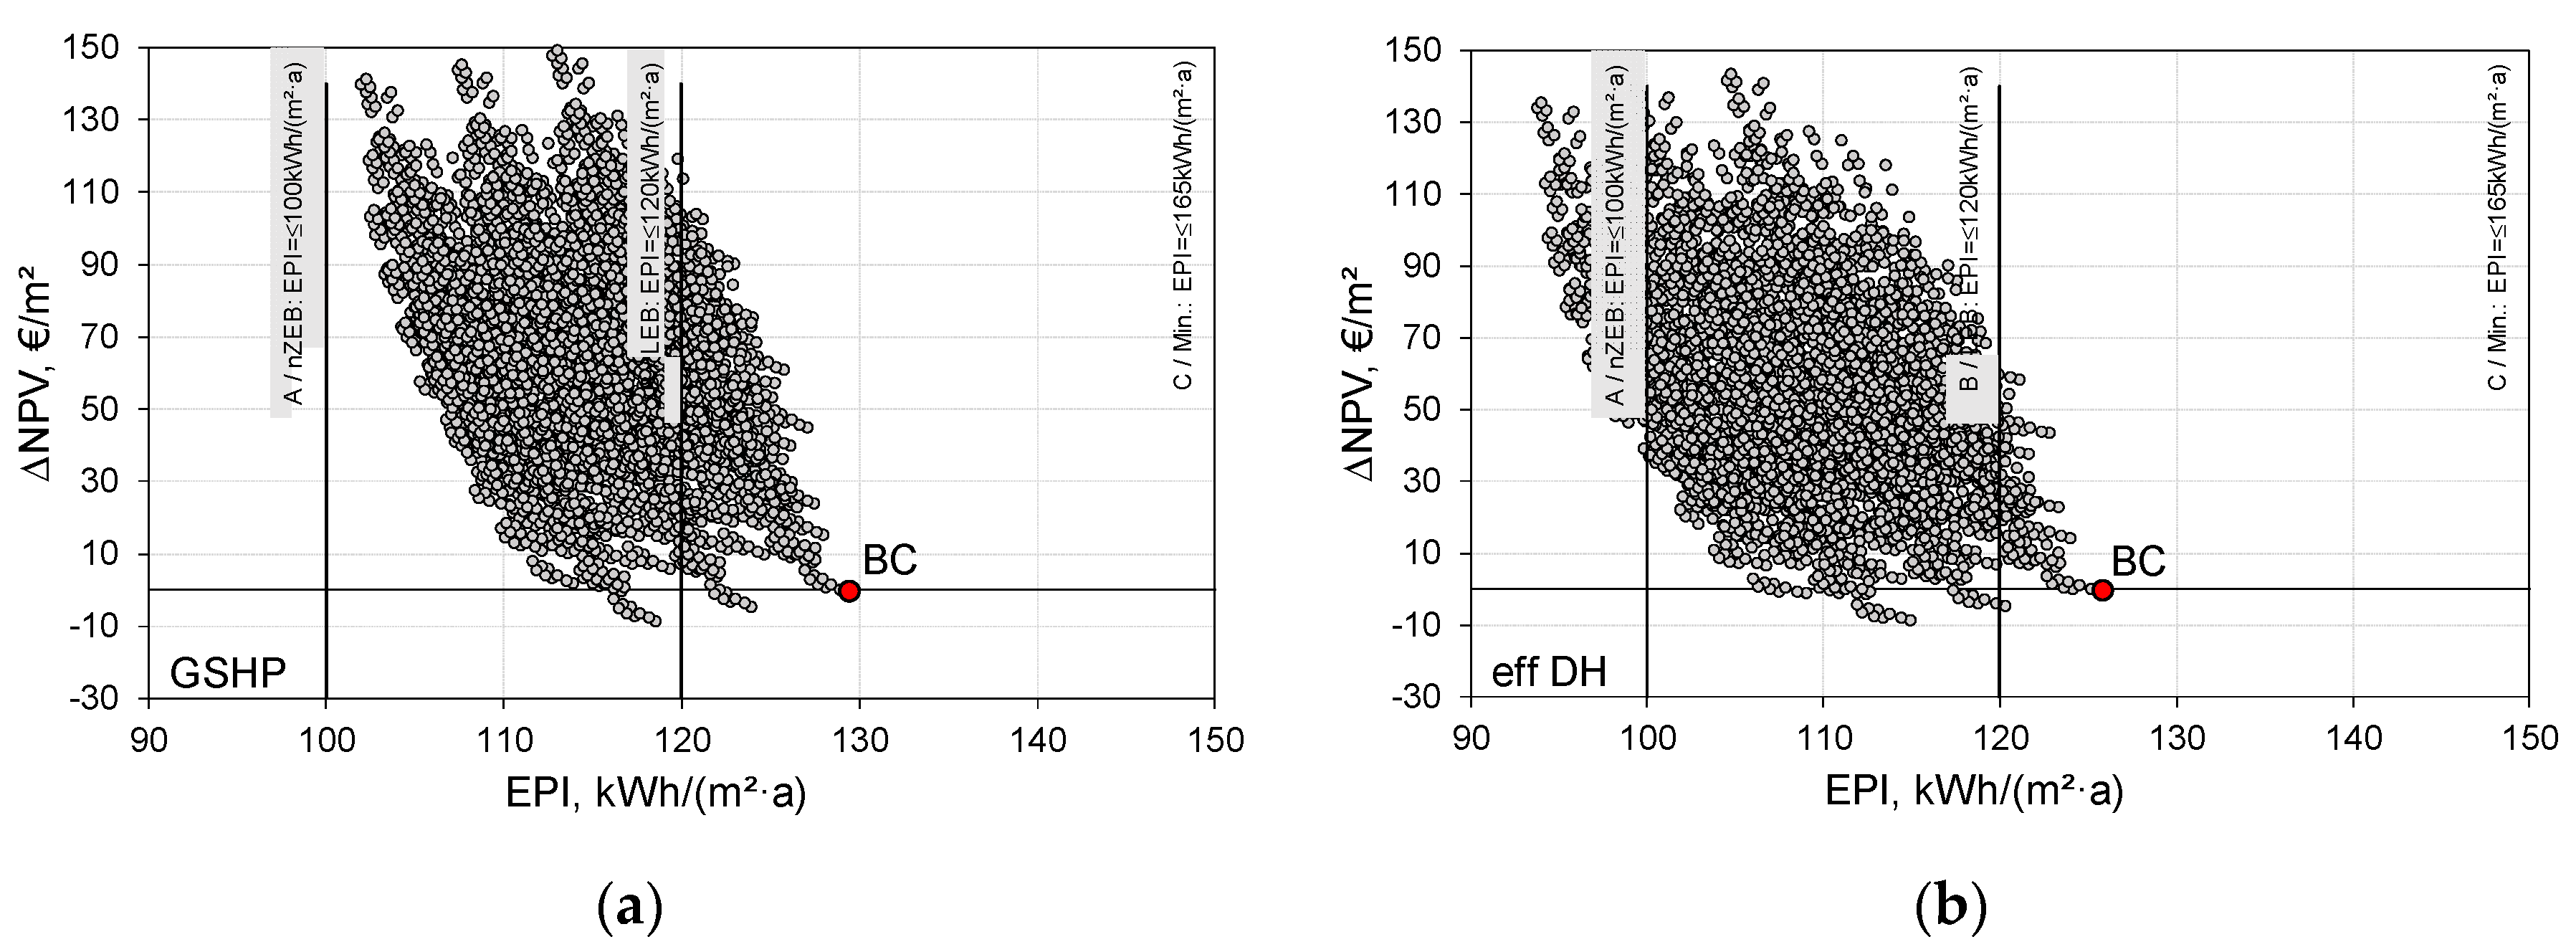
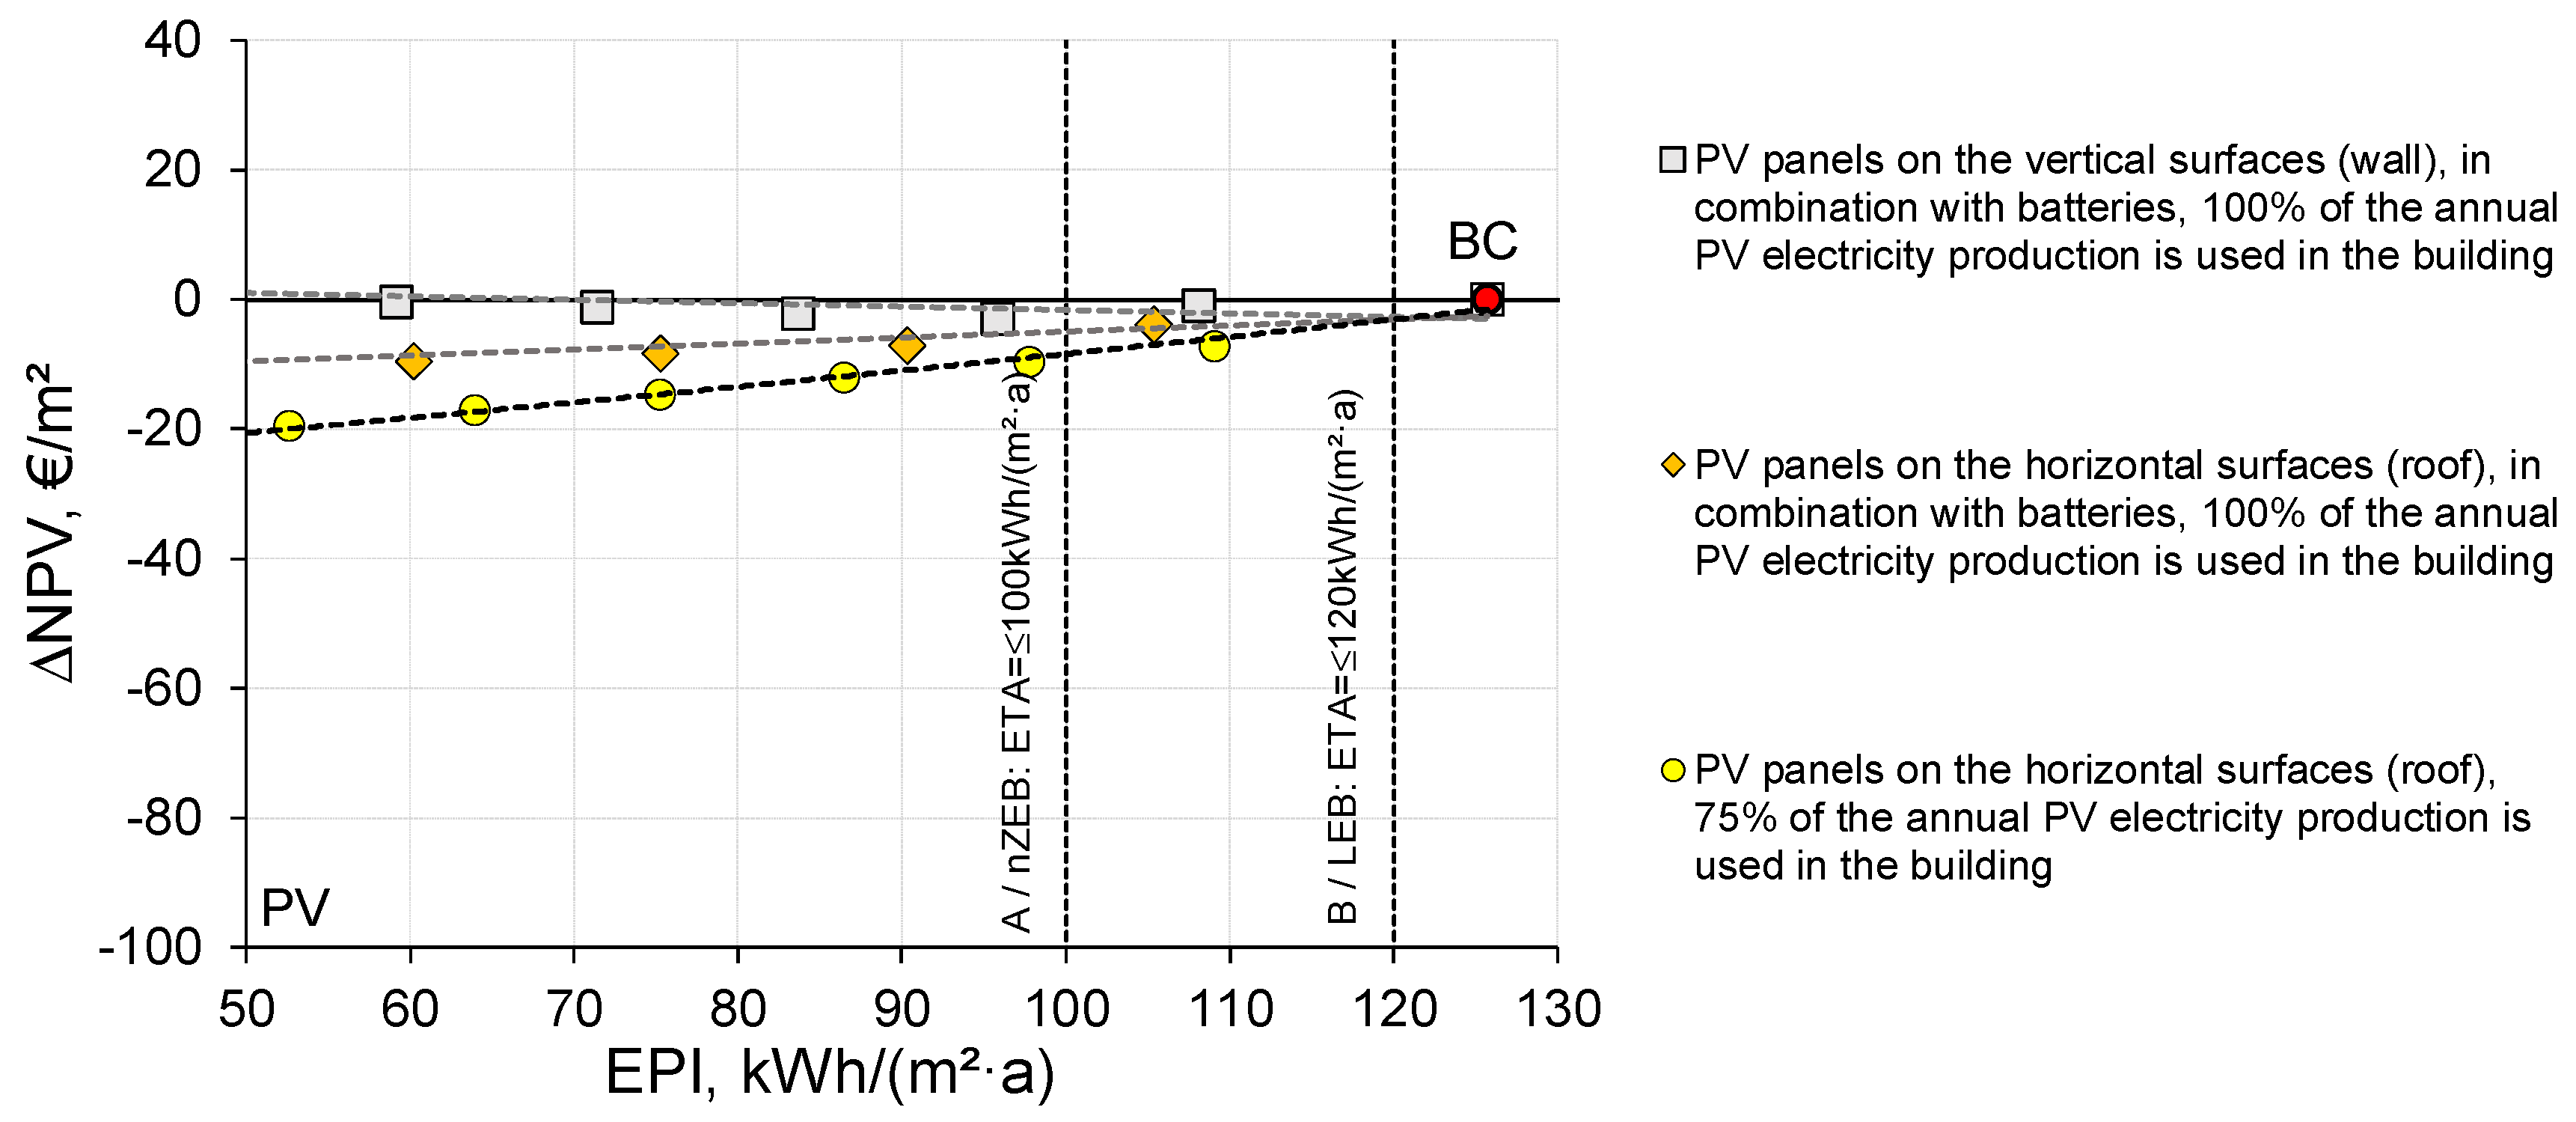
4.3. Calculations of Lifecycle Costs

The changes in lifecycle costs (LCC) caused by the implementation of the nZEB solutions were calculated (see Table 6). The analysis includes detailed energy performance-related costs of the actual solution components compared with the reference solution (minimum requirements, BC solutions). The energy performance solutions are derived by increasing/decreasing the insulation value of the building envelope (external walls, roof, and ground floor) in successive steps. These follow the actual building energy performance solution (as in the planning phase) and a proposal for an energy efficiency requirement to be implemented in the future.
The indoor climate and energy simulations and cost calculations for assessing the cost-effectiveness of technical solutions are based on the selected sample building. In the initial energy simulations, the impact of different improvement measures on the energy consumption of the original building was calculated. The annual energy use in the case of different combinations of structural solutions was calculated by subtracting the sum of the gained energy savings thanks to the used solutions from the delivered energy of the BC. Next, the EPI for different combinations was calculated from this result taking into account the conversion factors for energy carriers. Figure 3 shows the results of the cost-effectiveness calculations for the studied building with different combinations of structural solutions and the EPI with different heat sources. The energy saved over a long term as a result of more efficient insulation solutions lowers the annual costs of the used energy.
The uncertainty of the interest rate and of the escalation of the energy price is high; however, ultimately this has the same effect on the studied and reference building cases. Since the aim of the study was to compare different scenarios, the energy and investment costs of energy saving measures were considered.
The results for different combinations vary to a large degree. An economically optimal solution is assumed to be achieved if the ΔNPV is the lowest. The results of the economic calculation show that higher energy savings gained by combining different insulation measures did not always increase the cost-effectiveness; this was also shown by Pikas et al. [11] and Sankelo et al. [16]. The reason for the drop is the ratio between the cost and the gained energy savings. As more efficient measures are more expensive, investment costs and interest charges will be higher.
In the case of a GSHP (Figure 3a), the cost-even range of the EPI without local production of renewable energy compared to the BC is between 115 and 128 kWh/(m2·a). The low energy building level is reached, but the nZEB level is not reached. In the case of an effective DH, the cost-even range of the EPI without local production of renewable energy compared to the BC is between 125 and 147 kWh/(m2·a). The low energy building level can be reached with extra investments compared with the BC, yet the nZEB level would not be reached. In the case of the effective DH (Figure 3b), the cost-even range of the EPI without local production of renewable energy compared with the BC is between 106 and 124 kWh/(m2·a). The low energy building level can be reached with no extra investments compared with the BC; to reach the nZEB level, extra investments are needed.
Combinations of insulation measures with different heat sources result in significant divergence of the EPI. The choice of the heat source is not always free, being location dependent. The difference between the EPI values must be compensated for by insulation measures or by local energy production. In the case of non-residential buildings, the installation of PV is more cost-optimal than investment in insulation measures [47]. D’Agostino and Parker [48] also showed that a common point in representative climates across Europe is the importance of integrating renewables and energy efficiency measures to reach cost-effective nZEB.
As the architecture of the analysed day-care centre was compact and well orientated, these parameters were not optimized. The window-to-wall ratio (WWR) of the studied building was 30%, which is within the optimal range in a cold climate as shown by Thalfeldt [49] (optimal WWR = 24−38% depending on orientation).
Based on the definition of a nearly zero-energy building given in the Directive on Energy Performance of Buildings, local production of renewable energy is required to reach the nZEB level. Figure 4 shows the trendlines of cost-effectiveness calculations of the PV system in the case of the selected building with different combinations of PV systems: PV on a horizontal surface (roof), PV on horizontal surfaces with a battery system, and PV on vertical surfaces. As the installation of PV is a cost-effective measure, in some cases it is necessary to install more PVs to equalize the contractual measures.
Our study showed application of PVs to be the most cost-effective measure to decrease the primary energy use. Congedo et al. [50] also demonstrated that increasing the number of PVs leads to a reduction of both primary energy usage and global cost. To reach the nZEB level, only the amount of PV electricity that is used in the building can be considered. On a yearly basis, the PV generation used on site could be between 29% [51] and 75% [38] of the annual PV electricity production. In the current single-storey case study building, the area for PVs was not a limiting factor. When there is not enough area for PVs, the solution would be to add batteries to extend the lifetime of assets and allow more flexible usage. A combination of PVs with batteries is not a common solution in the nZEB practice. In future studies cost-optimality analysis with different factors such as free area for PVs, orientation, load matching [52], and a PV system with storage batteries etc. has to be done.
The possible influence on the EPI depends on the combination of the solutions of the BC. The same applies to cost-effectiveness. The results show the influence of insulation measures in the case of the BC if the lowest EPI is reached with the lowest insulation measures in combination with the best building service and technical systems (ventilation with a heat recovery system, very efficient heat source, LED lighting, low plug loads, etc.). The results show that in all cases, installation of PV panels can be considered more cost effective than insulation measures (Table 7).
Additionally, the cost of a one-step improvement in energy performance was calculated. The different insulation measures were combined to reach different starting EPI levels. The combinations and the selected EPI levels are presented in Table 8.
The cost of a one-step improvement in insulation measures was calculated considering the change of the ΔNPV and the change of the EPI. The cost of the EPI unit at different EPI levels is presented in Figure 5. The results show that the most expensive is to improve the roof insulation and the most effective is to improve windows, which means that the gained energy savings compensate more for the investment in the case of windows than in the case of roof insulation.

5. Conclusions

The study showed that without parallel design and cost estimation, the target price cannot be achieved. To design and build a cost-optimal nZEB-level building, more analyses should be performed in the early stage by including LCC. Successful execution of the project needs involvement of all the parties starting with the future building owner, architect, designers, and the contractor. Based on the case study, integrated project delivery procurement (design and construction together) and the use of prefabricated wooden structures reduced the final cost and helped to keep the budget within limits.
Because the standard values for lighting and the efficiency of service systems are conservative, the draft design should also consider building service systems (not only architecture). Our study showed that the ventilation system must be designed to ensure low SFP, and the artificial lighting power must be optimized according to the needed level of illumination and availability of natural lighting to minimize electricity usage. A change of the heat source had a significant impact on the energy performance indicator (EPI) of the solution packages.
In the case of nZEB, the building envelope must be highly insulated and airtight. As EPI decreases, improving energy performance by insulation measures becomes more expensive. Throughout the EPI range, the most cost efficient was investment in the improvement of the thermal transmittance of windows (3–13 €/(kWh/(m2·a))) while investments in other building envelope parts were less effective (4–80 €/(kWh/(m2·a))). The cheapest solution to improve the energy performance was installing PV panels on the roof if this is possible.
Overall, there are different cases offering a range of opportunities to choose combinations to reach a lower EPI compared to the usual practice.
Priority is given to energy efficiency measures reducing the energy use at least enough to fulfil the low energy building requirement. Lower energy usage also reduces carbon emissions that depend on the heat source energy carrier. In further studies, the issue of carbon emissions is important. There may exist solutions that are not that cost-effective but result in lower carbon emissions. To find the best solutions for new nZEB, both lifecycle cost and lifecycle emissions must be considered. An evaluation metric based on the correlation between the lifecycle cost and lifecycle emissions will define a matrix of assessment to find the most efficient combinations of different solutions.

Author Contributions

Supervision, T.K.; conceptualization, E.A. and T.K.; methodology, E.A. and T.K.; formal analysis, E.A. and T.K.; visualization, E.A. and T.K.; writing—original draft preparation, E.A. and T.K.; writing—review and editing, E.A. and T.K. Both authors have read and agreed to the published version of the manuscript. All authors have read and agreed to the published version of the manuscript.

Funding

This research was supported by the Estonian Centre of Excellence in Zero Energy and Resource Efficient Smart Buildings and Districts, ZEBE (grant No. 2014-2020.4.01.15-0016) funded by the European Regional Development Fund, by the Estonian Research Council (grant No. PRG483), and by the European Commission through the H2020 project Finest Twins (grant No. 856602).

Acknowledgments

This research utilizes measurement data from H2020 project No 754177: “NERO—Cost reduction of new Nearly-Zero-Energy Wooden buildings in the Northern Climatic Conditions”.

Conflicts of Interest

The authors declare no conflict of interest. The funders had no role in the design of the study; in the collection, analyses, or interpretation of data; in the writing of the manuscript, or in the decision to publish the results.

References

  1. EPBD. Directive (EU) 2018/844 of the European Parliament and of the Council of 30 May 2018 amending Directive 2010/31/EU on the energy performance of buildings and Directive 2012/27/EU on energy efficiency. Off. J. Eur. Union 2018, 156. Available online: https://eur-lex.europa.eu/legal-content/EN/TXT/PDF/?uri=CELEX:32018L0844&from=EN (accessed on 26 June 2020).
  2. Hamdy, M.; Hasan, A.; Siren, K. A multi-stage optimization method for cost-optimal and nearly-zero-energy building solutions in line with the EPBD-recast 2010. Energy Build. 2013, 56, 189–203. [Google Scholar] [CrossRef]
  3. Kurnitski, J.; Saari, A.; Kalamees, T.; Vuolle, M.; Niemelä, J.; Tark, T. Cost optimal and nearly zero energy performance requirements for buildings in Estonia. Est. J. Eng. 2013, 19, 183–202. [Google Scholar] [CrossRef]
  4. Kalamees, T.; Lupisek, A.; Morck, O.C.; Borodinecs, A.; Almeida, M.G.; Rovers, R.; Op’t Veld, P.; Kuusk, K.; Silva, S.M.; Silva, S.M. What kind of heat loss requirements nZEB and deep renovation sets for building envelope? In Central Europe Towards Sustainable Building 2016: Innovations for Sustainable Future, CESB 2016; 2016; pp. 137–144. Available online: https://explore.openaire.eu/search/publication?articleId=od_______307::73d66cb985ff7685f4ab969881b48200 (accessed on 26 June 2020).
  5. Fu, X.; Qian, X.; Wang, L. Energy Efficiency for Airtightness and Exterior Wall Insulation of Passive Houses in Hot Summer and Cold Winter Zone of China. Sustainability 2017, 9, 1097. [Google Scholar] [CrossRef] [Green Version]
  6. Harkouss, F.; Fardoun, F.; Biwole, P.H. Optimization approaches and climates investigations in NZEB—A review. In Building Simulation; Tsinghua University Press: Beijing, China, 2018; Volume 11, pp. 923–952. Available online: https://link.springer.com/article/10.1007/s12273-018-0448-6 (accessed on 26 June 2020). [CrossRef]
  7. Tabrizi, A.; Sanguinetti, P. Life-cycle cost assessment and energy performance evaluation of NZEB enhancement for LEED-rated educational facilities. Adv. Build. Energy Res. 2015, 9, 267–279. [Google Scholar] [CrossRef]
  8. Arumägi, E.; Kalamees, T. Design of the first net-zero energy buildings in Estonia. Sci. Technol. Built Environ. 2016, 22, 1039–1049. [Google Scholar] [CrossRef]
  9. Rey-Hernández, J.M.; Velasco-Gómez, E.; José-Alonso, J.F.S.; Tejero-González, A.; Rey-Martínez, F.J. Energy Analysis at a Near Zero Energy Building. A Case-Study in Spain. Energies 2018, 11, 857. [Google Scholar] [CrossRef] [Green Version]
  10. Garcia, J.; Kranzl, L. Ambition Levels of Nearly Zero Energy Buildings (nZEB) Definitions: An Approach for Cross-Country Comparison. Buildings 2018, 8, 143. [Google Scholar] [CrossRef] [Green Version]
  11. Pikas, E.; Thalfeldt, M.; Kurnitski, J.; Liias, R. Extra cost analyses of two apartment buildings for achieving nearly zero and low energy buildings. Energy 2015, 84, 623–633. [Google Scholar] [CrossRef]
  12. Alanne, K.; Schade, J.; Martinac, I.; Saari, A.; Jokisalo, J.; Kalamees, T. Economic viability of energy-efficiency measures in educational buildings in Finland. Adv. Build. Energy Res. 2013, 7, 120–127. [Google Scholar] [CrossRef]
  13. Apollo, M.; Miszewska-Urbańska, E. Influence of passive house technology on time and cost of construction investment. E3S Web Conf. 2018, 44, 1–8. [Google Scholar] [CrossRef]
  14. Colclough, S.; Kinnane, O.; Hewitt, N.; Griffiths, P. Investigation of nZEB social housing built to the Passive House standard. Energy Build. 2018, 179, 344–359. [Google Scholar] [CrossRef]
  15. Zinzi, M.; Mattoni, B. Assessment of construction cost reduction of nearly zero energy dwellings in a life cycle perspective. Appl. Energy 2019, 251, 113326. [Google Scholar] [CrossRef] [Green Version]
  16. Sankelo, P.; Jokisalo, J.; Nyman, J.; Vinha, J.; Sirén, K. Cost-optimal energy performance measures in a new daycare building in cold climate. Int. J. Sustain. Energy 2019, 38, 104–122. [Google Scholar] [CrossRef]
  17. Saari, A.; Kalamees, T.; Jokisalo, J.; Michelsson, R.; Alanne, K.; Kurnitski, J. Financial viability of energy-efficiency measures in a new detached house design in Finland. Appl. Energy 2012, 92, 76–83. [Google Scholar] [CrossRef]
  18. Bostanciolu, E.; Bostancioğlu, B. Architectural Science Review Effect of building shape on a residential building’s construction, energy and life cycle costs Effect of building shape on a residential building’s construction, energy and life cycle costs. Archit. Sci. Rev. 2010, 53, 441–467. [Google Scholar] [CrossRef]
  19. Zinzi, M.; Mattoni, B.; Bisegna, F. Survey and solutions for potential cost reduction in the design and construction process of nearly zero energy multi-family houses. In Proceedings of the IOP Conference Series: Materials Science and Engineering, Bari, Italy, 5–7 September 2019. [Google Scholar] [CrossRef] [Green Version]
  20. Zhang, C.; Hu, M.; Yang, X.; Amati, A.; Tukker, A. Life cycle greenhouse gas emission and cost analysis of prefabricated concrete building façade elements. J. Ind. Ecol. 2020, jiec.12991. [Google Scholar] [CrossRef]
  21. Tam, V.W.Y.; Fung, I.W.H.; Sing, M.C.P.; Ogunlana, S.O. Best practice of prefabrication implementation in the Hong Kong public and private sectors. J. Clean. Prod. 2015, 109, 216–231. [Google Scholar] [CrossRef]
  22. Hu, M. A Building Life-Cycle Embodied Performance Index—The Relationship between Embodied Energy, Embodied Carbon and Environmental Impact. Energies 2020, 13, 1905. [Google Scholar] [CrossRef] [Green Version]
  23. Hoxha, E.; Habert, G.; Lasvaux, S.; Chevalier, J.; Le Roy, R. Influence of construction material uncertainties on residential building LCA reliability. J. Clean. Prod. 2017, 144, 33–47. [Google Scholar] [CrossRef]
  24. Guo, H.; Liu, Y.; Meng, Y.; Huang, H.; Sun, C.; Shao, Y. A Comparison of the Energy Saving and Carbon Reduction Performance between Reinforced Concrete and Cross-Laminated Timber Structures in Residential Buildings in the Severe Cold Region of China. Sustainability 2017, 9, 1426. [Google Scholar] [CrossRef] [Green Version]
  25. Liu, Y.; Guo, H.; Sun, C.; Chang, W.-S. Assessing Cross Laminated Timber (CLT) as an Alternative Material for Mid-Rise Residential Buildings in Cold Regions in China—A Life-Cycle Assessment Approach. Sustainability 2016, 8, 1047. [Google Scholar] [CrossRef] [Green Version]
  26. Lien, A.G.; Lolli, N. Costs and procurement for cross-laminated timber in mid-rise buildings. J. Sustain. Archit. Civ. Eng. 2019, 25, 43–52. [Google Scholar] [CrossRef] [Green Version]
  27. EVS 932, “Construction Design Documents,” Tallinn. 2017. Available online: https://www.evs.ee/en/evs-932-2017 (accessed on 26 June 2020).
  28. EVS 885, “Classification of Construction Costs,” Tallinn. 2005. Available online: https://www.evs.ee/en/evs-885-2005 (accessed on 26 June 2020).
  29. Procurement Register. 2020. Available online: https://riigihanked.riik.ee/rhr-web/#/procurement/714146/general-info (accessed on 26 June 2020).
  30. EQUA Simulation AB. IDA-ICE 4.8. Building Performance Simulation Tool. 2018. Available online: https://www.equa.se/en/ida-ice (accessed on 26 June 2020).
  31. Achermann, M. Validation of IDA ICE, Version 2.11.06 with IEA Task 12—Envelope BESTEST. 2000. Available online: http://www.equaonline.com/iceuser/validation/old_stuff/BESTEST_Report.pdf (accessed on 26 June 2020).
  32. Equa Simulation AB. Validation of IDA Indoor Climate and Energy 4.0 Build 4 with Respect to ANSI/ASHRAE Standard 140-2004; Equa Simulation AB: Solna, Sweden, 2010. [Google Scholar]
  33. Kuusk, K.; Kalamees, T. Retrofit cost-effectiveness: Estonian apartment buildings. Build. Res. Inf. 2016, 44, 1–15. [Google Scholar] [CrossRef]
  34. Napp, M.; Kalamees, T. Energy use and indoor climate of conservation heating, dehumidification and adaptive ventilation for the climate control of a medieval church in a cold climate. Energy Build. 2015, 108, 61–71. [Google Scholar] [CrossRef]
  35. Simanic, B.; Nordquist, B.; Bagge, H.; Johansson, D. Predicted and measured user-related energy usage in newly built low-energy schools in Sweden. J. Build. Eng. 2020, 29, 101142. [Google Scholar] [CrossRef]
  36. Hirvonen, J.; Jokisalo, J.; Heljo, J.; Kosonen, R. Towards the EU Emission Targets of 2050: Cost-Effective Emission Reduction in Finnish Detached Houses. Energies 2019, 12, 4395. [Google Scholar] [CrossRef] [Green Version]
  37. Hamburg, A.; Kuusk, K.; Mikola, A.; Kalamees, T. Realisation of energy performance targets of an old apartment building renovated to nZEB. Energy 2019, 194, 116874. [Google Scholar] [CrossRef]
  38. MTMm nr 58. Hoonete Energiatõhususe Arvutamise Metoodika (Methodology for Calculating the Energy Performance of Buildings). 2015. Available online: https://www.riigiteataja.ee/akt/109062015021 (accessed on 26 June 2020).
  39. Kalamees, T.; Kurnitski, J. Estonian climate analysis for selecting the test reference year. In HB 2006—Healthy Buildings: Creating a Healthy Indoor Environment for People, Proceedings of the Healthy Buildings 2006, Lisboa, Portugal, 4–8 June 2006; 2006; Volume 5, pp. 207–212. Available online: https://www.etis.ee/Portal/Publications/Display/f5852b25-92db-4c28-9cef-94c2374efbaa (accessed on 26 June 2020).
  40. EC 2012/C 115/01, Guidelines accompanying Commission Delegated Regulation (EU) No 244/2012 of 16 January 2012 supplementing Directive 2010/31/EU of the European Parliament and of the Council on the energy performance of buildings by establishing a comparative methodology f. Off. J. Eur. Union 2012, 28. Available online: https://www.buildup.eu/en/practices/publications/guidelines-accompanying-commission-delegated-regulation-eu-no-2442012-16 (accessed on 26 June 2020).
  41. Simson, R.; Arumägi, E.; Kuusk, K.; Kurnitski, J. Redefining cost-optimal nZEB levels for new residential buildings. In Proceedings of the E3S Web of Conferences; 2019; Volume 111. Available online: https://www.e3s-conferences.org/articles/e3sconf/abs/2019/37/e3sconf_clima2019_03035/e3sconf_clima2019_03035.html (accessed on 26 June 2020). [CrossRef] [Green Version]
  42. Arumägi, E.; Simson, R.; Kuusk, K.; Kalamees, T. Analysis of Cost-Optimal Minimum Energy Efficiency Requirements for Buildings; Tallinn University of Technology. 2017. Available online: https://ec.europa.eu/energy/sites/ener/files/documents/ee_2018_cost-optimal_en_version.pdf. (accessed on 26 June 2020).
  43. Procurement Register. Muuga Lasteaia Projekteerimistööd (Design of Muuga Kindergarten). 2016. Available online: https://www.mercell.com/en/tender/59217976/hanke-aruanne-muuga-lasteaia-projekteerimistood-br-hanke-voitja-sweco-projekt-as-11304200-br89000-eur-tender.aspx (accessed on 26 June 2020).
  44. Procurement Register. Muuga Lasteaia Projekteerimis- ja Ehitustööd (Design and Construction Works of Muuga Kindergarten). 2017. Available online: https://tenders.rfpalertservices.com/et/2017-8/1/rfp-tender/muuga-lasteaia-projekteerimis-ja-ehitust%C3%B6%C3%B6d-15524475 (accessed on 26 June 2020).
  45. Kantola, M.; Saari, A. Ensuring functionality of a nearly zero-energy building with procurement methods. Facilities 2014, 32, 312–323. [Google Scholar] [CrossRef]
  46. 15 RT I, 05.06.2015, Energiatõhususe Miinimumnõuded (Minimum Requirements for Buildings Energy Performance). 2015. Available online: https://ec.europa.eu/growth/tools-databases/tris/mt/index.cfm/search/?trisaction=search.detail&year=2015&num=88&fLang=ET&dNum=1 (accessed on 26 June 2020).
  47. Pikas, E.; Kurnitski, J.; Thalfeldt, M.; Koskela, L. Cost-benefit analysis of nZEB energy efficiency strategies with on-site photovoltaic generation. Energy 2017, 128, 291–301. [Google Scholar] [CrossRef]
  48. D’Agostino, D.; Parker, D. A framework for the cost-optimal design of nearly zero energy buildings (NZEBs) in representative climates across Europe. Energy 2018, 149, 814–829. [Google Scholar] [CrossRef]
  49. Pikas, E.; Thalfeldt, M.; Kurnitski, J. Cost optimal and nearly zero energy building solutions for office buildings. Energy Build. 2014, 74, 30–42. [Google Scholar] [CrossRef]
  50. Congedo, P.; D’Agostino, D.; Baglivo, C.; Tornese, G.; Zacà, I. Efficient Solutions and Cost-Optimal Analysis for Existing School Buildings. Energies 2016, 9, 851. [Google Scholar] [CrossRef] [Green Version]
  51. Tumminia, G.; Guarino, F.; Longo, S.; Aloisio, D.; Cellura, S.; Sergi, F.; Brunaccini, G.; Antonucci, V.; Ferraro, M. Grid interaction and environmental impact of a net zero energy building. Energy Convers. Manag. 2020, 203, 112228. [Google Scholar] [CrossRef]
  52. Butera, F.M. Zero-energy buildings: The challenges. Adv. Build. Energy Res. 2013, 7, 51–65. [Google Scholar] [CrossRef]
Figure 1. (a) Plan of the case study building; (b) front view of the case study building.
Energies 13 03570 g001aEnergies 13 03570 g001b
Figure 2. Cost of the building envelope.
Energies 13 03570 g002
Figure 3. Energy performance indicator (EPI) and change in the net present value (ΔNPV) for different combinations of structural solutions: (a) with the ground-source heat pump (GSHP); (b) with the efficient district heating (eff DH).
Energies 13 03570 g003
Figure 4. Change in the net present value (ΔNPV) in the case of different PV solutions.
Energies 13 03570 g004
Figure 5. Additional cost of a one-step improvement in different insulation measures at different EPI levels.
Energies 13 03570 g005
Table 1. Technical information of the building.
Building Data
Building TypeDay-Care Centre
Net floor area. Heated area. (m2)1112
Properties of The Envelope
Thermal transmittance U, W/(m2·K)
External wall (EW)0.18
Roof (R)0.08
Floor (F)0.19
Windows (W)0.09
Air leakage rate q50, m³/(h·m2)3.0
Thermal bridges Ψi, W/(m·K)
External wall/external wall0.06
External windows perimeter0.04
Roof/external wall0.08
External slab/external wall0.24
Basic System Information (Initial Estimation)
Ventilation systemMechanical supply and exhaust with heat recovery
Heating systemHydronic floor heating
Heating sourceGround-source heat pump (GSHP) or district heating (DH)
Onsite production/Renewable sourcesPhotovoltaic (PV) panels
Table 2. Standard use of buildings and the corresponding max. values of heat gain.
Building TypeOccupied Hoursh/24 hd/7 dUsage RateLighting W/m2Appliances W/m2Occupants *
W/m2
Day-care center07:00–19:001250.415420
* The internal heat gain from occupants only includes the sensible heat.
Table 3. Parameter values used for discount.
ParameterValue (VAT 0%)
Thermal energy price (DH), EUR/kWh0.050
Electricity price from the grid, EUR/kWh0.1119
Electricity price when sold to the grid, EUR/kWh0.035
Value
Real interest rate, %4.0
Escalation (electricity), %2.0
Escalation (thermal energy), %2.0
Calculation period for residential buildings, years20
Table 4. Calculated annual delivered and primary energy for BC with GSHP.
TitleAnnual Energy Use, kWh/(m2·a)
Delivered EnergyPrimary Energy
Room heating9.318.6
Ventilation air heating16.833.6
Hot water10.020.0
Appliances5.010.0
Lighting12.525.0
Fans and pumps16.332.6
Total70140
Table 5. Energy performance of the BC with different heat sources.
Heat SourceEfficiency of Heat SourceConversion Factors EPI, kWh/(m2·a)EPI ¹, kWh/(m2·a)
District heating0.90.9159148
Efficient district heating0.90.65139126
Ground-source heat pump3.6 (heating)/2.7 (DHW)2143129
Gas boiler0.951164153
Wood pellet boiler0.850.65141129
¹ All the data according to the BC, except that the heat gain and the energy use of electricity of the lighting are changed from 12 W/m2 to 6 W/m2.
Table 6. Thermal transmittance, investment costs, space heating demand (delivered energy), and savings for various insulation measures (VAT 0%).
Insulation MeasureThermal Transmittance U, W/(m2·K)Total Investment Cost, €·103Marginal Investment Cost, €·103Space Heating Demand kWh/(m2·year)Final Heat Savings MWh/year
External wall (EW)0.18 ¹1582-62.2-
0.1515863.660.42.1
0.12159913.158.54.2
0.09161819.556.36.7
0.0816279.055.67.5
Roof (R)0.08 ¹--62.2-
0.07159513.158.74.0
0.064164045.157.85.0
Window (W)0.09 ¹--62.2-
0.84 159412.158.44.4
0.6216005.753.110.4
0.54161918.851.212.6
Floor (F)0.19 ¹--62.2-
0.15 160320.859.63.0
0.10162219.056.17.0
0.08164119.054.19.3
Air leakage rate (q50, m³/(h·m2))3.0 ¹--62.2-
1.015853.059.82.7
0.615886.059.43.2
¹ Thermal transmittance (U) or air leakage rate (q50) of the BC.
Table 7. Most efficient solutions compared to the reference building.
BCCost-Optimal without PVCost-Optimal with PVThe Least PV to Reach ΔNPV = 0
Thermal transmittance W/(m2·K) and air leakage rate m³/(m2·h)UEW 0.183UEW 0.171UEW 0.171UEW 0.153UEW 0.123
UR 0.093UR 0.093UR 0.093UR 0.07UR 0.07
UF 0.148UF 0.148UF 0.112UF 0.10UF 0.10
UW 1.0UW 1.0UW 1.0UW 0.7UW 0.7
q50 1.5q50 1.5q50 1.0q50 0.6q50 1.0
Specific fan power of AHU, kW/(m³/s)1.751.51.51.51.5
Lighting power, W/m2126666
Power of PV,
Wp/net m2
0032.810.517.4
EPI, kWh/(m2·a)126115113100100
ΔNPV, €/m20−8.8−22.800
Total cost, €/m213841386142314551464
Table 8. Combinations of different insulation solutions.
VersionThermal Transmittance W/(m2·K)q50AHU’s SFPEPITotal Cost
Ex. WallRoofFloorWindowm³/(h·m2)kW/m³/skWh/(m2·a)€/m2
Ver -10.280.210.221.431.8139.51298
Ver 10.180.090.191.0631.8125.71384
Ver 20.150.090.151.0631.8118.41405
Ver 30.120.070.100.8431.8109.21456
Ver 40.090.070.080.6211.75101.11498
Ver 50.080.060.080.5411.593.61564

