Abstract
Although renewable technologies are progressing fast, there are still challenges such as the reliability and availability of renewable energy sources and their cost issues due to capital intensity that hinder their broad adoption. This research aims at developing a configuration-sizing approach to enhance the cost efficiency and sourcing reliability of renewable energies integrated in microgrids. To achieve this goal, various technologies were considered, such as solar PV, wind turbines, converters, and batteries for system configuration with minimization of net present cost (NPC) as the objective. Grid connection scenarios with up to 100% renewable contribution were analyzed. The results show that the integration of renewable technologies with some grid backup could reduce the levelized cost of energy (LCOE) to about half of the price of the electricity that the university purchases from the grid. Also, different kinds of solar tracker systems were studied. The outcome shows that by using a vertical axis solar tracker, the LCOE of the system could be reduced by more than 50 percent. This research can help the decision-maker to opt for the best scenarios for generating reliable and cost-efficient electricity.
1. Introduction
Achieving the global aim for access to reliable energy supply and mitigation of emissions requires incrementing renewable technology usage as the only alternative. The worldwide energy sector is facing a quick transition from traditional large centralized electricity generation to decentralized small generation units that can be operated as microgrids [1]. Typically, an urban microgrid is connected to the centralized utility grid, but, in case of power failure or grid stress, it could act as a completely isolated system [2]. Microgrids using integrated renewable energy systems (IRES) in urban areas is a crucial strategy for attaining emission reduction or even net negative emission cities that can seize more carbon than what they emit in total, through supplying their own carbon-free electrical energy [3].
There are several agreements around the world (such as the Paris agreement in 2015) that aim at keeping the global average temperature below 2 °C by changing the ratio of renewable energy and fossil fuels [4]. Those systems commonly use renewable energy resources such as wind, biomass, and solar radiation. Also, by the integration of battery storage (e.g., Li-Ion Batteries), the systems can operate with more flexibility, shift peaks and/or generate electricity during grid outages.
An interesting feature of microgrids is to let prosumers (consumers that also produce energy) actively trade energy in their community and make the local generation and consumption of reliable and sustainable energy possible. Furthermore, implementing such microgrids in urban areas allows the consumers to make a decision on the type of technology to be used for electricity generation in real time, given there is the use of secure and innovative smart information systems [5]. Zhao et al. [6] studied an operation and optimal sizing of a standalone microgrid in a remote area based on multiple objectives like renewable penetration, life cycle cost, and environmental missions. Their proposed sizing strategy and optimization methodology was applied to the construction of an actual microgrid. Another research has been established by Bhuiyan et al. [7] regarding sizing of an islanded microgrid using Photovoltaic (PV) panels, wind turbines, and battery banks as principal components and also a diesel generator as an auxiliary power to minimize the life cycle cost and ensure that the loss of power supply probability is bounded as a constraint. They also considered the impact of seasonal variation of wind speed on the final configuration and sizing of the system. Two scenarios, one using Weibull distribution for predicting wind speed without considering seasonal variation and the other is using historical load data that includes the seasonality and variation of wind speed in different seasons, have been compared in their study. The same set of components has been assumed by Chen [8] to optimize the installation capacity of a standalone microgrid by considering system reliability and cost as objective functions. They also evaluated the amount of emissions resulting from the designed system.
In 2016, Alsaidan et al. [9] scrutinized the impact of using a variety of battery energy storage with different characteristics in a standalone hybrid system, including a diesel generator, one PV unit, and one wind turbine. They considered several cases with different renewable penetration levels, and their results indicate that battery energy storage sizing and technology selection entirely relies on system configuration, and, as the renewable penetration grows, the extent of unmet load demand reduces, which means the improvement of the reliability of the system. Moreover, referring to their findings, with increasing the renewable penetration, the expansion planning cost decreases. However, this was not true for higher penetrations since bigger battery energy storage systems are required to save the excess power that causes higher investment. Abdulgalil et al. [10] proposed a methodology to increase the reliability of the microgrid through optimal sizing of an energy storage system and integrating it with wind turbines considering wind uncertainties, using Weibull distribution parameters for creating different wind speed scenarios. Their results show that using an optimally sized energy storage system is economically feasible even with considering energy storage system investment cost.
Despite the above benefits, research is still emerging in order to provide a cost-efficient structure with better performance and reliability for the integration of renewable technologies in microgrids. Ramli et al. [11] investigated the optimal PV, inverter, and PV/inverter sizes for a grid-connected PV system in Makkah, Saudi Arabia, by considering the net present cost as the objective function while assessing the excess electricity and emissions of the system. The results show that with a PV-to-inverter size ratio of R = 1 and minimizing CO2 emissions, the optimal system could be achieved.
Although the integration of renewable technologies is necessary for low carbon electricity generation, there are still some challenges related to grid management in standalone PV systems in microgrids [12]. Adaramola [13] did a technoeconomic assessment on the feasibility of an 80 kW grid-connected solar PV in the northern part of Nigeria, showing the viability of grid-connected PV in certain locations. Bukar et al. [14] proposed an artificial method called grasshopper optimization to solve the optimal sizing challenges. The objective of their research was sizing the microgrid optimally based on minimizing the loss power supply probability and cost of energy. Regarding the results of their research, the designed microgrid is performed to fulfill the required load demand at zero deficiency of power supply probability and minimum cost of energy. In the proposed microgrid, the photovoltaic systems supply 44% of the electrical demand, while the wind turbines, diesel generator, and battery storage system supply 14%, 16%, and 26%, respectively.
In recent years, several researchers have evaluated the feasibility of microgrids and standalone integrated systems from both technological and economical aspects in rural and urban areas at various scales, including building districts or cities [13,15,16,17,18,19,20,21,22,23]. However, there are only a few studies on the technical analysis of using solar trackers in microgrids and the evaluation of their performance [24,25]. In 2018, Carballo et al. [26] provided a robust tool for the solar tracking field, decreasing the capital cost associated with typical control systems. They designed a new solar tracking system based on computer vision that implemented in developed economical open-source hardware. Optimal sizing of an islanded PV system under different sun tracking system has been investigated by Krishan et al. [27] to supply electricity for a household in India with a good potential for solar power generation. Considering six different types of solar trackers, the results show that, although the system using dual axis adjustment has slightly higher cost of energy, it acts better in terms of electricity generation by absorbing more solar radiation.
Algarani et al. [28] designed an optimal PV grid-connected system considering different types of solar trackers in order to enhance the performance of the proposed grid-connected system. Their results show that utilizing two-axis solar trackers could generate 34% more electricity in comparison with a fixed system. However, the feasibility of using other sources of energy such as wind and battery storage, and a comparison of standalone systems with grid-connected ones was not assessed in this research.
Designing and sizing an optimal integrated renewable energy system, for both isolated and grid-connected microgrids, and comparing their economic and technological performance is the main objective of this paper. In addition, the economic feasibility of grid-connected systems subject to the choice of solar trackers will be evaluated. To the best of the authors’ knowledge, this is a first attempt in providing a comparison between grid-connected and isolated integrated energy systems with and without solar trackers.
This paper is structured in five sections. Section 1 presents the topic and a comprehensive literature review on the integration of renewable technologies and microgrid. In Section 2, the methodology of the research is explained. Section 3 provides a case study. The results, including the economic, technical, and sensitivity analyses, are explained in Section 4. Finally, the conclusions provide a summary of the paper and suggestions for future work, as presented in Section 5.
2. Methodology
The optimal planning of components in isolated and grid-connected microgrids using solar trackers was considered in this research, accompanied by a sensitivity analysis. The aim is to determine the optimal size of the components for different system configuration scenarios. There are several available energy systems optimization tools such as HOMER (Hybrid Optimization of Multiple Energy Resources) [29], TRNSYS [30], iHOGA [29], and RETScreen [31]. HOMER is a comprehensive software that has been used extensively over the last decade due to its high capability in designing optimal systems and its powerful optimization engine [32]. Considering the flexibility of HOMER to input load data (HOMER can use the input load from different time steps), it was chosen over other tools for this study.
2.1. Optimization Framework
The load demand of the buildings, meteorological data, system configuration, and components, economic factors (e.g., initial cost, operation and maintenance (O & M) cost and replacement cost of the components and also inflation and discount rate) and other constraints such as search space for components are among the inputs to the optimization process. Figure 1 illustrates the proposed framework for optimal sizing and configuration of the microgrid systems with renewable energy integration. The input section that is the feed of the optimization part includes electricity consumption demand of case study, climatic data, selected technologies and their related technical constraints and some pricing information like capital costs, operation and maintenance cost and replacement costs of each technology.
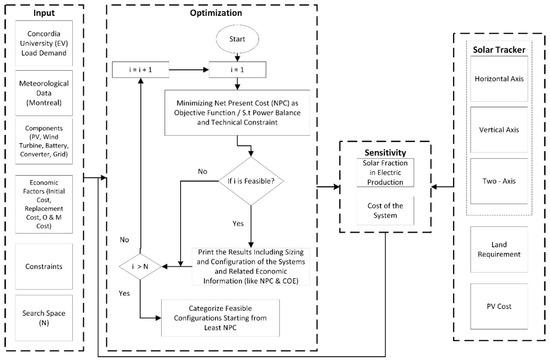
Figure 1.
Schematic of the sizing and ranking process for each configuration scenario.
In the optimization stage, the feasibility of generated configurations was analyzed through an iterative process. The evaluation of the optimal configuration is accomplished by optimizing the objective function, which is the net present cost (NPC) of the system. The decision variables are specified based on the available resources of the location and also the amount of energy consumption. In this research, number of wind turbines, size of PV panels and converter, and number of batteries are considered as the decision variables. The defined objective function then is minimized subject to technical constraints of components and load balance, which guarantees the minimum deficiency of the power supply.
Finally, in case of the feasibility of results, the optimizer lists the different configurations starting from least NPC. In the sensitivity analysis, different types of solar trackers are investigated to improve the performance of the system and reduce the cost. Also, an evaluation of the amount of solar fraction using trackers was done. In addition, another sensitivity analysis has been done on the land requirement and also the price of PV.
2.2. Economic Factors
The net present cost (NPC) is used as the main economic metric or objective to rank different configurations. NPC is a subtraction of the current value of all the costs incurred by the system over its lifetime from the present value of all the earnings it gains over its lifetime:
where is the total annual cash flow of the system, is the interest rate, and n is project lifetime. is a recovery factor that gives the present value as a function of the annuity and can be expressed as Equation (2):
The other economic factor used for comparing different configurations is the levelized cost of energy (LCOE) that illustrates the cost of electricity generated from each IRES over the lifetime per kWh of electrical energy and it can be determined as:
where is the primary electricity load used as input data and is the total electricity sold to the grid utility.
2.3. Components
Due to the land requirement limitations in urban areas, there are a limited number of options for components configuration for the purpose of generating renewable energy on-site. In this research, solar PV, wind turbine, and converter were considered as the main technologies that are coupled with batteries. Figure 2 shows the schematic of the assumed components in both scenarios.
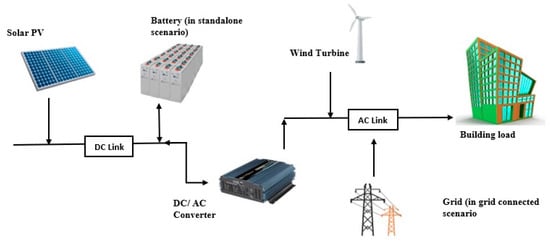
Figure 2.
Schematic diagram of system configuration and technologies.
2.3.1. PV Panels
The generated electricity by PV panels is supplied to the DC line and converted by an inverter to AC power. The total installed cost of PV panels depends on the type of the project (small, medium, or large scale), PV type (polycrystalline, monocrystalline, thin-film), manufacturer, etc. Based on a recent study of eight large scale projects [33], the total installed cost of PV panels ranges from 750 to 1320 USD/kW (excluding inverter price). On that basis, in this paper, 750 USD/kW is considered as a lower estimate for the installed PV panel cost, and 14 USD per year [34] is set for the maintenance of each kW of the installed PV. To provide a sufficient plan for decision-makers, the sensitivity of the installed PV cost with average and maximum limits are also evaluated in the results section. For dealing with the power output reduction caused by dust, shading, and temperature fluctuation and other losses, a derating factor of 80% is presumed. The amount of power output of PV arrays is expressed by the below equation [35,36,37]:
where is the rated capacity of PV array (kW), is the derating factor, is the real solar radiation (kw/m2) and is solar radiation under standard condition (kw/m2), is power temperature coefficient, and are PV temperatures under real and standard conditions, respectively.
2.3.2. Wind Turbines
Several factors should be considered to correctly choose a wind turbine for a given location [38]. Studying the power curve of turbines is needed to evaluate the power output range for various wind speeds and various wind turbine hub heights (rotors height above the ground). For the urban area of the case study with low wind speeds, a 10 kW EO10 wind turbine (Eocycle EO10) with 2.75 m/s and 20 m/s cut-in and cut-out wind speed and with 16 m hub height was chosen. The initial cost of purchasing as well as the replacement cost of each 10 kW wind turbine was assumed as 30,000 USD and 600 USD considering operation and maintenance cost of a turbine per year [34]. The power output of the wind turbine was evaluated according to the following equation [34]:
where is air density (kg/m3), A is the rotor cross-sectional area (m2), is the efficiency of the generator, is gearbox efficiency and is the wind speed at the hub height calculated according to Equation (5) [37]:
where, is the wind speed at anemometer height (m/s), is the hub height of the turbine, is anemometer height and is surface roughness length.
2.3.3. Converter
To convert the power supplied to DC line to AC, a converter should be considered. The maximum input voltage of the power converters should meet the maximum output voltage of the components. In this study, a power converter with initial and replacement cost of 90 USD per kW, 95 percent efficiency, and 15 years of lifetime is considered [26].
2.3.4. Battery
In an isolated microgrid scenario, a battery is required due to the intermittency of a 100 percent renewable energy system. A generic 1 kWh lithium-ion battery with a voltage of 6 V and 90 percent efficiency is considered in the case study. The initial and replacement cost were both set as 156 USD per kWh [39], and the operation and maintenance is assumed as 10 USD per year for each kWh [40]. Battery lifetime is considered 15 years, while the minimum state of charge during the lifetime is specified as 20 percent. The battery capacity is calculated using the following equation:
where DOD is the depth of discharge that is the proportion of the battery’s discharge to its total capacity, and are battery and converter efficiency, respectively, L is the overall load demand (kWh/day) and AD is autonomy day that indicates the period of time that battery will last during power outage.
2.3.5. Solar Tracker
With the fast progress of technologies regarding renewable energies, solar trackers are often used to increase the energy yield of solar PV [41]. A tracker can improve the energy output of the PV arrays by up to 40 percent. There are multiple numbers of trackers available in the market. In this paper, the following trackers were considered [42]:
- ▪
- Horizontal axis solar tracker with continuous adjustment (HAST): horizontal east-west axis rotation with continuous adjustment of the elevation angle;
- ▪
- Vertical axis solar tracker with continuous adjustment (VAST): the elevation angle is fixed, and panel rotates continuously around the vertical axis;
- ▪
- Two-axis solar tracker (TAST): panels rotating in both horizontal and vertical axis.
The price of the horizontal, vertical, and two-axis trackers were set 870, 255, and 1000 USD, respectively [28].
3. Case Study
One of the largest buildings at Concordia University, the so-called EV building, located in Sir George Williams Campus in the downtown of Montreal (Quebec), is considered as the case study. Although there have been remarkable efforts to achieve the slogan of Quebec’s most energy-efficient major university for over twenty sequential years [43], the amount of electricity consumption is still very high and also the contribution of local renewable energy in comparison to the total consumed energy is negligible.
There are three metering systems in the EV building that record the electricity consumption of the building every 15 min. The past six years’ records of historical electricity load demand is provided in this study.
3.1. Solar Radiation and Wind Speed
Several valid sources could be used for receiving climatic information like solar radiation and wind speed. In this study, monthly averaged values of global horizontal irradiance (GHI) were downloaded from NASA’s surface meteorology and solar energy database provided based on the records of the last 22 years [44]. As shown in Figure 3, the annual average GHI is 3.52 kWh/m2/day, and, from March to September, the amount of irradiance is more than the average. The amount of solar radiation in summer is high and reaches to 5.61 kWh/m2/day in June, whereas in winter it goes down to less than 2 kWh/m2/day in December.
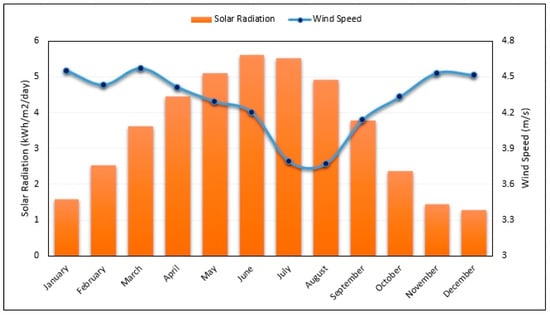
Figure 3.
Average solar radiation and wind speed during the year in Montreal.
With respect to the wind speed profile, the monthly average meteorological wind data was estimated at an anemometer height of 50 m above the surface of the earth. As Barrington-Leigh and Ouliaris pointed in their study [45], although some parts of Quebec province have good potential for onshore wind power developments, Montreal, with an annual average wind speed of 4.29 m/s, does not present the ideal weather condition for generating electricity from wind. Nevertheless, there are still good chances of covering the irradiance deficiency in cold seasons since the lowest wind speed occurs in summer and highest in winter, while, from May to September, when the GHI is relatively high, the wind speed is below average. Figure 3 displays how renewable energies can operate complimentarily.
3.2. Load Data
Although a complete set of load data was provided by facility management of Concordia University for a whole year, there was still some data preparation required before the raw data could be used.
3.2.1. Data Preparation
Twelve datasets for each month were received as load data. Each dataset includes 15 features: the two first attributes indicate the date and time step (every 15 min), and the other 13 attributes refer to the electricity that was being consumed in different floors or sections of the building. For example, one of the features declares the amount of electricity consumption on the floor where all Heating, Ventilation and Air Conditioning (HVAC) systems are installed, and the major part of the electricity consumption belongs to this floor. Dealing with more than 45,000 data points in each dataset can be considered as big data. The sizing optimization model needs the total hourly load demand of the building for a whole year using just two attributes of time step (h) and load demand (kW). In addition, the missing data and outliers should be identified before using the data. Data preparation and preprocessing techniques such as outlier detection and removing missing values were done in the Python programming language.
3.2.2. Load Profile
After preprocessing, the final electricity load curve of the building was obtained, as shown in Figure 4a. The load profile follows a similar trend throughout the year with some of the outliers in November, December, and January related to holiday periods with lower electricity consumption. This could be explained by the fact that Concordia University mainly uses natural gas to generate heat during cold seasons, and also that there is an HVAC system that consumes electricity during summer.
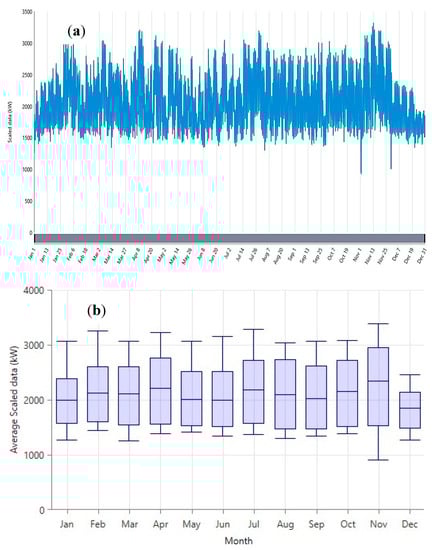
Figure 4.
Demand load profile (a) hourly graph (b) monthly averaged box plot graph.
3.3. Grid Schedule and Feed-In Tariff
One of the two scenarios analyzed was a grid-connected system. In this system, no storage was considered, and electricity can always be supplied by grid utility if needed. Since the EV building of Concordia University is located in the middle of downtown, and it was already connected to the grid, there is no cost for grid extension and interconnection charge. Also, the capacity of grid sale and purchase was assumed as infinite.
The grid rate schedule was planned at two different rates. The time interval of the highest electrical power demand from the grid, known as peak demand, refers to Hydro Quebec’s definition for peak demand events, and is from 6 a.m. to 9 a.m. and 4 p.m. to 8 p.m. [46]. The other time spans of the day were considered off-peak. Considering a tariff DP, the average price of electricity in Montreal is 0.0894 USD per kWh in off-peak hours, while the cost of purchasing power was assumed 0.12 USD per kWh in peak hours. In addition, the sell-back price of excess electricity to the grid was set at 0.045 and 0.06 USD per kWh for off-peak and peak hours, respectively [46].
4. Results and Discussion
The results of comparing grid-connected and isolated microgrids, as well as analysis of the effect of using solar trackers, will be discussed in the following sections.
4.1. Comparing Grid-Connected and Isolated Scenarios
The three best integrated renewable systems proposed by the optimization engine are shown in Table 1. For the grid-connected scenario, the best configuration is using just PV systems and no wind turbine. As mentioned in the grid feed-in tariff section, the cost of electricity that Concordia University pays is 0.0894 USD per kWh. Employing the best configuration of grid connected scenario, this cost can be decreased to 0.0472 USD per kWh. This means that by investing 15.7 million USD as the initial capital cost required for purchasing and installation of PV panels and converters and connecting the whole system to the grid, the cost of energy could be about 50 percent less than grid electricity cost that currently is being used in the university.

Table 1.
Components sizing and economic results of grid-connected and isolated scenarios.
By adding three 10 kW wind turbine in the second proposed configuration, the cost of energy will be even slightly less than the first configuration. As the net present cost of the system was slightly increased, this configuration is ranked second. In the last proposed configuration, the wind turbine is selected as the only component, with no converter, having the wind turbine electrical output directly transferred to the AC line. Although the third proposed system has the highest cost of energy among the three configurations, its cost is still close to the current grid price.
The proportion of electrical generation by PV panels in the G1 configuration in grid-connected scenario varies in different months of the year, depending on solar radiation. Regarding Figure 5, which illustrates the solar fraction in monthly average electrical production, it is clear that the solar fraction is always higher than 50%, even in winter when the amount of solar irradiance is meager.
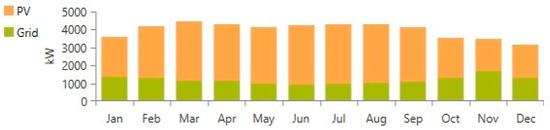
Figure 5.
Monthly average electrical generation by solar PVs and grid.
The PV panels in the system produce electricity during the daylight period, and this interval varies over the year (see Figure 6).
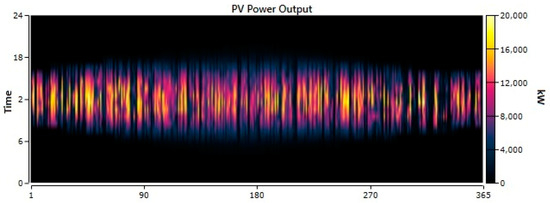
Figure 6.
PV electricity generation during daytime throughout the year.
On the other hand, for the standalone scenario with 100% renewables and no grid backup, the situation is different, and the cost of energy for the best-proposed configuration (I1) is more than three times the price that Concordia University now pays for grid electricity. Furthermore, the net present cost of the system is extremely high, which is not appealing for investors.
The best configuration of the isolated scenario maybe even economically feasible in some locations where the price of electricity is more than 0.3 USD per kWh, but, as Quebec has the lowest electricity cost compared to other provinces in Canada [47], this system is not economically feasible. Figure 7 presents a comparison between the two explained scenarios considering the net present cost of each component. The main reason for the high required investment for an isolated microgrid is the high cost for battery storage. Although the progress of battery technology has been very fast during the last decade and the price of batteries has diminished tremendously, storage cost is still one of the main challenges of isolated microgrids.
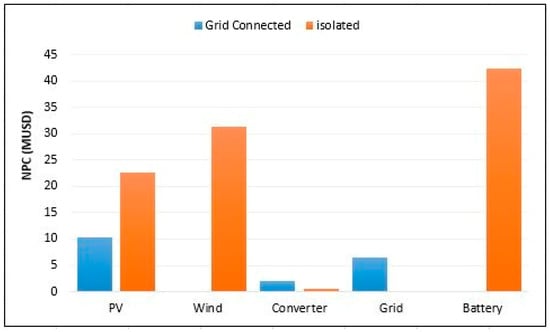
Figure 7.
Comparing the net present cost of grid-connected and isolated scenarios (G1 & I1) categorized by components.
4.2. Sensitivity Analysis
4.2.1. Solar Tracker
After opting for the first configuration of the grid-connected scenario as the most economical feasible option, there were still some components that could be added to the system to improve its operation and efficiency.
The effect of using three different kinds of solar trackers on the economic aspect of the system is summarized in Table 2.
Table 2.
Results of using different solar trackers on system performance and economic factors.
The following interesting points can be interpreted from Table 2:
- ▪
- Horizontal and two-axis solar tracker were not economically feasible and raised the cost of energy and net present cost of the system. Using vertical trackers not only reduces LCOE and NPC by about 10 cents and more than one million USD, respectively, but also can improve the total performance of the system by increasing the renewable fraction of the IRES from 68% to 73.5%. It can also make this system much more appealing for investors by lowering the return on investment from 12 years to 7.4 years.
- ▪
- For the horizontal and two-axis trackers, the excess electricity and the payback period of the system were decreased. Regarding Figure 8, with these trackers, the configurations change to the grid centered with a low renewable fraction. On the other hand, for the vertical trackers, due to their good economics, the optimal decision accounts for the use of more kW of PV panels, and thus, the PV output increases, as seen in Figure 9.
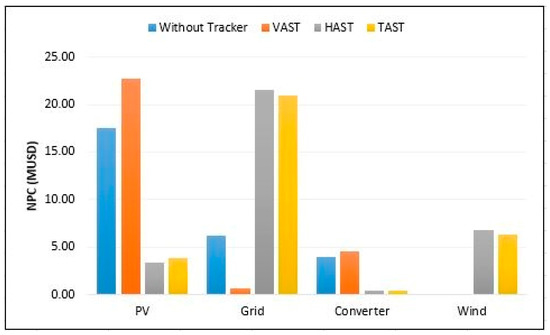 Figure 8. Comparing the net present cost of systems using different solar trackers and without solar tracker categorized by components.
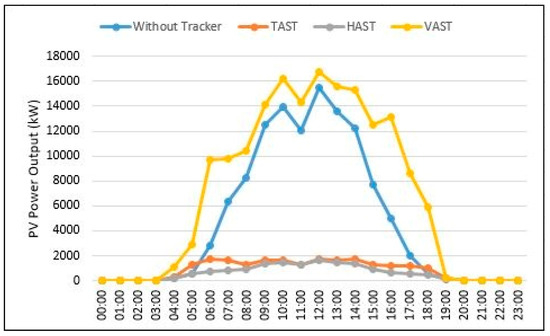 Figure 9. Daily electricity generation graph by PV with different trackers.
4.2.2. Land Requirement
The evaluation of the required space for local renewables is one of the essential tasks of designing microgrids for urban areas. Typically, the roof area of a building is the main zone used for installing the components. Concordia University’s available roof area for its main buildings in the downtown campus was extracted from the CityGML 3D data model of Montreal, as listed in Table 3.
Table 3.
Available roof area for installing components.
Regarding Table 1, 19,248 kW of PV was needed for the best configuration of the grid-connected scenario. Assuming 1 kW/m2 irradiance and 16.4% efficiency of the panels, about 6 m2 area is needed for installing 1 kW PV panels [48]. Hence, the land requirement will be about 115,488 m2. As presented in Table 3, the total available roof area of all campus buildings is only 24,487 m2. Therefore, it seems that land requirement is one of the substantial challenges that need to be addressed. Reducing the size of the local PV generation leads to lower solar fractions and less amount of excess electricity generated. A sensitivity analysis was done for different amounts of excess electricity and the resulting sales capacity to the grid, as summarized in Figure 10.
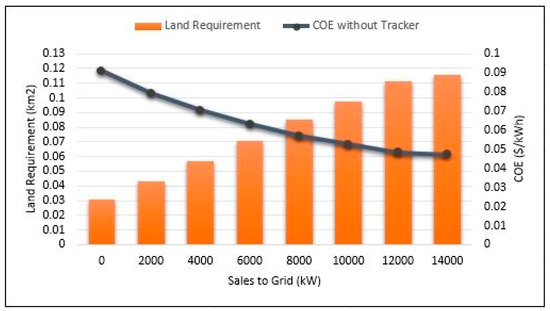
Figure 10.
Land requirement and levelized cost of energy (LCOE) change of the system with different sales capacity.
Although the LCOE of the system will be nearly doubled with decreasing the amount of sales to the grid, the required land could be reduced from 192,480 m2 to about 30,000 m2. Another option of reducing land requirements is the use of solar trackers. In this sense, a sensitivity analysis was also done to capture the impact of vertical solar trackers.
Figure 11 shows that using a vertical solar tracker reduces the required land (to about 24,000 m2) as well as LCOE in comparison with not using a tracker.
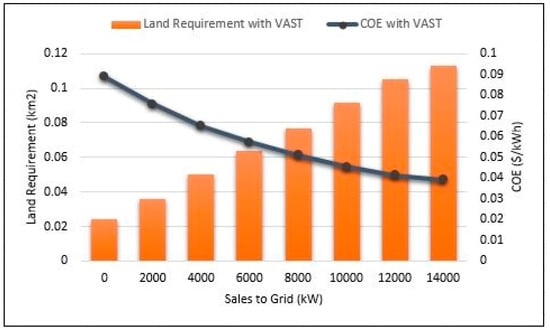
Figure 11.
Land requirement and LCOE change of the system using vertical solar tracker with different sales capacity.
The outcome of land requirement sensitivity analysis shows that in case of land limitation, that usually occurs in dense urban areas, by reducing the sales to the grid, the system size and required space can be decreased accordingly. In addition, the results show that, even with zero sales of electricity to the grid, the designed system is still economically feasible and competitive with current means of supplying electricity to university buildings. Furthermore, using a vertical solar tracker could also make the designed system more viable and practical as the required land is even less than the available roof area of the university.
4.2.3. The Installed Cost of PV
As mentioned in prior sections, the cost of PV depends on different factors creating various ranges. Therefore, as the impact of PV cost on the final cost of energy and configuration of the system is considerable, the evaluation of this effect is essential. In a recent study in 2018 [33], the total installed cost of PV panels ranges from 750 to 1320 USD/kW. In this research, 750 USD/kW was considered as the final price of installed PV panels. The effect of changing this price to the average or maximum values of the above-mentioned range of LCOE is evaluated and presented in Figure 12.
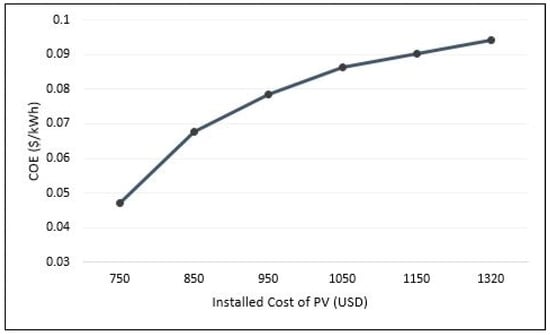
Figure 12.
Change of LOCE of the G1 configuration with installed cost of the PV.
By using the maximum value of the above-mentioned range, the cost of energy doubles, however, the final LCOE still remains comparable/competitive to the grid electricity price.
5. Conclusions
This paper analyzed the economic optimization of renewable energy supply for a University Campus Building in Montréal, Canada, for microgrids with variable renewable fractions. Different sizing and various configuration scenarios of renewable energy systems were evaluated, showing that a grid-connected scenario with high renewable fractions and no battery storage is the best option considering the economic aspect as the objective of the research. Using the grid backup scenario could reduce the cost of electricity by about 50 percent compared with the grid electricity price in Quebec.
The impact of solar trackers was also analyzed, considering that the land requirements for high renewable fractions are mostly higher than the available roof spaces. While horizontal and two-axis solar trackers were not economically feasible, vertical trackers improved the system performance in both technical and economic aspects and also raised the fraction of renewable generation.
The impact of reducing excess electricity sales to the grid and using solar trackers on the needed area for PV panels was also discussed. The results show that decreasing the required land for the installation of PV panels is possible, and although it raises the final LCOE of the system, the system still remains economically feasible.
This study can be extended in a number of directions. The land requirement could be considered as a constraint in the optimization model, and its sensitivity and impact on the final sizing and configuration of the system can be further investigated. Moreover, the feasibility of using other components such as fuel cells or a small scale biomass gasifier plant in the microgrids could be explored. Also, the model is based on electricity supply and pricing in Quebec, with the presence of a centralized (and monopoly) firm, Hydro Quebec. As such, the configuration-sizing model could be extended to account for dynamic, oligopolistic, or decentralized pricing schemes. Finally, a multicriteria decision-making approach can be adopted as an extension to the proposed model to incorporate technical aspects such as capacity and area requirement, flexibility and reliability; economical aspects such as initial and operating cost; and environmental aspect such as reduction of carbon emission collectively to design a robust building-integrated green energy system in urban areas [49].
Author Contributions
Modeling with software, data collection and preprocessing, and preparation and writing the original draft has been done by N.S., and writing review and editing, supervision, and project administration have been done by F.N. and U.E. All authors were involved in the visualization, methodology, and conceptualization of this paper. All authors have read and agreed to the published version of the manuscript.
Funding
“This research was funded by [NSERC Discovery grant] grant number [RGPIN-2016-06727]” and also the [Canada Excellence Research Chair in Smart, Sustainable and Resilient Communities and Cities] funded by [Tri-Agency Institutional Program Secretariat].
Acknowledgments
The authors would like to express appreciation to the facility management of Concordia University for providing the load demand data of EV building. Also, we would like to thank the three esteemed reviewers that provided helpful comments that improved the quality of the manuscript.
Conflicts of Interest
The authors declare no conflict of interest.
References
- Aurelio, M.; Castro, L. Chapter 9. Urban Microgrids: Benefits, Challenges, and Business Models** the Views and Opinions Expressed in this Chapter are the Author’s Own and do not Necessarily Reflect ANEEL’s Point of View; Elsevier: Amsterdam, The Netherlands, 2020; ISBN 9780128195215. [Google Scholar]
- IRENA International Renewable Energy Agency. Renewable Power Generation Costs in 2017; IRENA: Abu Dhabi, UAE, 2018; ISBN 978-92-9260-040-2. [Google Scholar]
- Kennedy, C.; Stewart, I.D.; Westphal, M.I.; Facchini, A.; Mele, R. Keeping global climate change within 1.5 °C through net negative electric cities. Curr. Opin. Environ. Sustain. 2018, 30, 18–25. [Google Scholar] [CrossRef]
- Castillo-Calzadilla, T.; Macarulla, A.M.; Kamara-Esteban, O.; Borges, C.E. A case study comparison between photovoltaic and fossil generation based on direct current hybrid microgrids to power a service building. J. Clean. Prod. 2020, 244. [Google Scholar] [CrossRef]
- Mengelkamp, E.; Gärttner, J.; Rock, K.; Kessler, S.; Orsini, L.; Weinhardt, C. Designing microgrid energy markets: A case study: The Brooklyn Microgrid. Appl. Energy 2018, 210, 870–880. [Google Scholar] [CrossRef]
- Zhao, B.; Zhang, X.; Li, P.; Wang, K.; Xue, M.; Wang, C. Optimal sizing, operating strategy and operational experience of a stand-alone microgrid on Dongfushan Island. Appl. Energy 2014, 113, 1656–1666. [Google Scholar] [CrossRef]
- Bhuiyan, F.A.; Yazdani, A.; Primak, S.L. Optimal sizing approach for islanded microgrids. IET Renew. Power Gener. 2015, 9, 166–175. [Google Scholar] [CrossRef]
- Chen, H.C. Optimum capacity determination of stand-alone hybrid generation system considering cost and reliability. Appl. Energy 2013, 103, 155–164. [Google Scholar] [CrossRef]
- Alsaidan, I.; Khodaei, A.; Gao, W. Determination of battery energy storage technology and size for standalone microgrids. In Proceedings of the 2016 IEEE Power and Energy Society General Meeting (PESGM), Boston, MA, USA, 17–21 July 2016; pp. 1–5. [Google Scholar] [CrossRef]
- Abdulgalil, M.A.; Khalid, M.; Alismail, F. Optimal sizing of battery energy storage for a grid-connected microgrid subjected to wind uncertainties. Energies 2019, 12, 2412. [Google Scholar] [CrossRef]
- Ramli, M.A.M.; Hiendro, A.; Sedraoui, K.; Twaha, S. Optimal sizing of grid-connected photovoltaic energy system in Saudi Arabia. Renew. Energy 2015, 75, 489–495. [Google Scholar] [CrossRef]
- Ma, T.; Yang, H.; Lu, L. Long term performance analysis of a standalone photovoltaic system under real conditions. Appl. Energy 2017, 201, 320–331. [Google Scholar] [CrossRef]
- Adaramola, M.S. Viability of grid-connected solar PV energy system in Jos, Nigeria. Int. J. Electr. Power Energy Syst. 2014, 61, 64–69. [Google Scholar] [CrossRef]
- Bukar, A.L.; Tan, C.W.; Lau, K.Y. Optimal sizing of an autonomous photovoltaic/wind/battery/diesel generator microgrid using grasshopper optimization algorithm. Sol. Energy 2019, 188, 685–696. [Google Scholar] [CrossRef]
- Butturi, M.A.; Lolli, F.; Sellitto, M.A.; Balugani, E.; Gamberini, R.; Rimini, B. Renewable energy in eco-industrial parks and urban-industrial symbiosis: A literature review and a conceptual synthesis. Appl. Energy 2019, 255, 113825. [Google Scholar] [CrossRef]
- Al Garni, H.; Kassem, A.; Awasthi, A.; Komljenovic, D.; Al-Haddad, K. A multicriteria decision making approach for evaluating renewable power generation sources in Saudi Arabia. Sustain. Energy Technol. Assess. 2016, 16, 137–150. [Google Scholar] [CrossRef]
- Abo-Elyousr, F.K.; Elnozahy, A. Bi-objective economic feasibility of hybrid micro-grid systems with multiple fuel options for islanded areas in Egypt. Renew. Energy 2018, 128, 37–56. [Google Scholar] [CrossRef]
- Tomar, V.; Tiwari, G.N. Techno-economic evaluation of grid connected PV system for households with feed in tariff and time of day tariff regulation in New Delhi—A sustainable approach. Renew. Sustain. Energy Rev. 2017, 70, 822–835. [Google Scholar] [CrossRef]
- Waite, M.; Modi, V. Potential for increased wind-generated electricity utilization using heat pumps in urban areas. Appl. Energy 2014, 135, 634–642. [Google Scholar] [CrossRef]
- Tiwary, A.; Spasova, S.; Williams, I.D. A community-scale hybrid energy system integrating biomass for localised solid waste and renewable energy solution: Evaluations in UK and Bulgaria. Renew. Energy 2019, 139, 960–967. [Google Scholar] [CrossRef]
- Shahzad, M.K.; Zahid, A.; Rashid, T.; Rehan, M.A.; Ali, M.; Ahmad, M. Techno-economic feasibility analysis of a solar-biomass off grid system for the electrification of remote rural areas in Pakistan using HOMER software. Renew. Energy 2017, 106, 264–273. [Google Scholar] [CrossRef]
- Schleicher-Tappeser, R. How renewables will change electricity markets in the next five years. Energy Policy 2012, 48, 64–75. [Google Scholar] [CrossRef]
- Olatomiwa, L.; Blanchard, R.; Mekhilef, S.; Akinyele, D. Hybrid renewable energy supply for rural healthcare facilities: An approach to quality healthcare delivery. Sustain. Energy Technol. Assess. 2018, 30, 121–138. [Google Scholar] [CrossRef]
- Jamroen, C.; Komkum, P.; Kohsri, S.; Himananto, W.; Panupintu, S.; Unkat, S. A low-cost dual-axis solar tracking system based on digital logic design: Design and implementation. Sustain. Energy Technol. Assess. 2020, 37, 100618. [Google Scholar] [CrossRef]
- Burhan, M.; Oh, S.J.; Chua, K.J.E.; Ng, K.C. Double lens collimator solar feedback sensor and master slave configuration: Development of compact and low cost two axis solar tracking system for CPV applications. Sol. Energy 2016, 137, 352–363. [Google Scholar] [CrossRef]
- Carballo, J.A.; Bonilla, J.; Roca, L.; Berenguel, M. New low-cost solar tracking system based on open source hardware for educational purposes. Sol. Energy 2018, 174, 826–836. [Google Scholar] [CrossRef]
- Krishan, O. Sathans Optimum sizing and techno-economic analysis of grid-independent PV system under different tracking systems. In Proceedings of the 2018 IEEE 8th Power India International Conference (PIICON), Kurukshetra, India, 10–12 December 2018; pp. 1–6. [Google Scholar] [CrossRef]
- Al Garni, H.Z.; Awasthi, A.; Ramli, M.A.M. Optimal design and analysis of grid-connected photovoltaic under different tracking systems using HOMER. Energy Convers. Manag. 2018, 155, 42–57. [Google Scholar] [CrossRef]
- Elkadeem, M.R.; Wang, S.; Azmy, A.M.; Atiya, E.G.; Ullah, Z.; Sharshir, S.W. A systematic decision-making approach for planning and assessment of hybrid renewable energy-based microgrid with techno-economic optimization: A case study on an urban community in Egypt. Sustain. Cities Soc. 2020, 54, 102013. [Google Scholar] [CrossRef]
- Saleem, M.S.; Abas, N.; Kalair, A.R.; Rauf, S.; Haider, A.; Tahir, M.S.; Sagir, M. Design and optimization of hybrid solar-hydrogen generation system using TRNSYS. Int. J. Hydrogen Energy 2019. [Google Scholar] [CrossRef]
- Pan, Y.; Liu, L.; Zhu, T.; Zhang, T.; Zhang, J. Feasibility analysis on distributed energy system of Chongming County based on RETScreen software. Energy 2017, 130, 298–306. [Google Scholar] [CrossRef]
- Bahramara, S.; Moghaddam, M.P.; Haghifam, M.R. Optimal planning of hybrid renewable energy systems using HOMER: A review. Renew. Sustain. Energy Rev. 2016, 62, 609–620. [Google Scholar] [CrossRef]
- Perkins, G. Techno-economic comparison of the levelised cost of electricity generation from solar PV and battery storage with solar PV and combustion of bio-crude using fast pyrolysis of biomass. Energy Convers. Manag. 2018, 171, 1573–1588. [Google Scholar] [CrossRef]
- Duman, A.C.; Güler, Ö. Techno-economic analysis of off-grid PV/wind/fuel cell hybrid system combinations with a comparison of regularly and seasonally occupied households. Sustain. Cities Soc. 2018, 42, 107–126. [Google Scholar] [CrossRef]
- Baek, S.; Park, E.; Kim, M.G.; Kwon, S.J.; Kim, K.J.; Ohm, J.Y.; del Pobil, A.P. Optimal renewable power generation systems for Busan metropolitan city in South Korea. Renew. Energy 2016, 88, 517–525. [Google Scholar] [CrossRef]
- Bagheri, M.; Delbari, S.H.; Pakzadmanesh, M.; Kennedy, C.A. City-integrated renewable energy design for low-carbon and climate-resilient communities. Appl. Energy 2019, 239, 1212–1225. [Google Scholar] [CrossRef]
- Welcome to HOMER. Available online: https://www.homerenergy.com/products/pro/docs/3.9/index.html (accessed on 28 March 2020).
- IRENA. Renewable Energy Technologies: Cost Analysis Series—Biomass for Power Generation, 2nd ed.; Elsevier Ltd.: Amsterdam, The Netherlands, 2012; Volume 1, ISBN 9780080983301. [Google Scholar]
- Battery Pack Prices Fall as Market Ramps up with Market Average at $156/kWh in 2019|BloombergNEF. Available online: https://about.bnef.com/blog/battery-pack-prices-fall-as-market-ramps-up-with-market-average-at-156-kwh-in-2019/ (accessed on 28 March 2020).
- Bagheri, M.; Shirzadi, N.; Bazdar, E.; Kennedy, C.A. Optimal planning of hybrid renewable energy infrastructure for urban sustainability: Green Vancouver. Renew. Sustain. Energy Rev. 2018, 95, 254–264. [Google Scholar] [CrossRef]
- Awasthi, A.; Shukla, A.K.; Murali Manohar, S.R.; Dondariya, C.; Shukla, K.N.; Porwal, D.; Richhariya, G. Review on sun tracking technology in solar PV system. Energy Rep. 2020, 6, 392–405. [Google Scholar] [CrossRef]
- Sinha, S.; Chandel, S.S. Analysis of fixed tilt and sun tracking photovoltaic-micro wind based hybrid power systems. Energy Convers. Manag. 2016, 115, 265–275. [Google Scholar] [CrossRef]
- Energy. Available online: https://www.concordia.ca/about/sustainability/sustainability-initiatives/energy.html (accessed on 28 March 2020).
- Solar Insolation (1 Month)|NASA. Available online: https://neo.sci.gsfc.nasa.gov/view.php?datasetId=CERES_INSOL_M (accessed on 28 March 2020).
- Barrington-Leigh, C.; Ouliaris, M. The renewable energy landscape in Canada: A spatial analysis. Renew. Sustain. Energy Rev. 2017, 75, 809–819. [Google Scholar] [CrossRef]
- Rate DP|Hydro-Québec. Available online: http://www.hydroquebec.com/residential/customer-space/rates/rate-dp.html (accessed on 28 March 2020).
- Electricity Rates by Province. Available online: http://www.ontario-hydro.com/electricity-rates-by-province (accessed on 28 March 2020).
- Area Required for Solar PV Power Plants—Suncyclopedia. Available online: http://www.suncyclopedia.com/en/area-required-for-solar-pv-power-plants/ (accessed on 28 March 2020).
- Si, J.; Marjanovic-Halburd, L.; Nasiri, F.; Bell, S. Assessment of building-integrated green technologies: A review and case study on applications of Multi-Criteria Decision Making (MCDM) method. Sustain. Cities Soc. 2016, 27, 106–115. [Google Scholar] [CrossRef]
© 2020 by the authors. Licensee MDPI, Basel, Switzerland. This article is an open access article distributed under the terms and conditions of the Creative Commons Attribution (CC BY) license (http://creativecommons.org/licenses/by/4.0/).