Article

Effect of Synthesis Temperature on Structure and Electrochemical Performance of Spinel-Layered Li1.33MnTiO4+z in Li-Ion Batteries

1
Falcuty of Biotechnology, Chemistry and Environmental Engineering, Phenikaa University, Hanoi 10000, Vietnam
2
A&A Green Phoenix Group, Phenikaa Research and Technology Institute (PRATI), 167 Hoang Ngan, Hanoi 10000, Vietnam
3
Division of Materials Science and Engineering, Hanyang University, 222 Wangsimni-ro, Seongdong-gu, Seoul 04763, Korea
*
Authors to whom correspondence should be addressed.
Energies 2020, 13(11), 2962; https://doi.org/10.3390/en13112962
Submission received: 21 May 2020 / Revised: 5 June 2020 / Accepted: 8 June 2020 / Published: 9 June 2020
(This article belongs to the Special Issue Smart and Functional Materials for Lithium-Ion Battery)

Abstract

:
Herein, the spinel-layered cathode material Li1.33MnTiO4+z (0.8LiMnTiO4•0.2Li2Mn0.5Ti0.5O3) is investigated for the purpose of developing a high-capacity, low-cost, and environmentally friendly cathode for Li-ion batteries. Sol-gel synthesis is conducted and the relationships between synthesis temperature, structure, and electrochemical performance of the cathodes are studied. The effects of size and purity on the capacities of these cathodes are discussed. The samples fired at 500 and 600 °C contain an impurity phase of TiO2, thus delivering capacities of 208 and 210 mAh g−1 at C/10, respectively. The sample fired at 700 °C without the impurity phase of TiO2 shows a high capacity of 222 mAh g−1 at C/10 and capacity retention of 90.5% after 100 cycles at 1C.

1. Introduction

Although the spinel LiMn2O4 cathode material has a lot of advantages such as its low cost, eco-friendliness, and ease of synthesis, it exhibits a low capacity (<148 mAh g−1) and a narrow working voltage range (3–4.5 V) because of its structural instability caused by Mn dissolution at low voltages and Jahn–Teller distortion. Therefore, many efforts have been made to stabilize its structure by substituting Mn with Ti, Al, Ni, or Li [1,2,3,4,5]. In the work done by Wang et al., the capacity retention of spinel LiMn2−xTixO4 was increased from 76% to 83% after 80 cycles when x increased from 0.5 to 1 [6]. When half of Mn is substituted by Ti in LiMn2O4, a new spinel phase of LiMnTiO4 is formed [7]. In this phase, the oxidation states of Mn and Ti are +3 and +4, respectively. From a crystal structure point of view, the O2− ions form a cubic close-packed array, and the Li+ ions occupy tetrahedral 8a sites as in LiMn2O4, whereas the Mn3+ and Ti4+ ions alternatively occupy octahedral 16d sites. The high binding energy of Ti–O (662 kJ mol−1) can suppress the Jahn–Teller distortion and the cathode material can be used in a wide range of voltages (2–4.8 V). Consequently, the capacity is improved because more than one Li+ can be extracted or inserted, which is associated with the oxidation or reduction of the Mn4+/Mn3+ and Mn3+/Mn2+ redox couples [8]. Ti4+ is electrochemically inactive in this voltage range, and thus decreases the capacity of LiMnTiO4 to less than 180 mAh g−1. The introduction of a layered phase of Li2Mn0.5Ti0.5O3 can increase the quantity of Li available for intercalation, leading to increased capacity [9]. Moreover, the layered phase can stabilize the spinel phase at low voltages, resulting in improvement in cycling stability [10]. Therefore, a strategy to study composite (1 − x)LiMnTiO4xLi2Mn0.5Ti0.5O3 has potential for identifying new cathode materials for Li-ion batteries (LIBs).
Synthesis methods have a significant effect on the electrochemical performance of electrode materials [11,12]. Among them, the sol-gel method has many advantages, such as mixing precursors at the atomic scale, synthesizing at low temperatures and in a short time, and uniform particle size in the nanometer range. Nano-sized materials can provide short diffusion lengths for Li+. Zhang et al. [13] used the sol-gel method and heat treatment at 700 °C to prepare a 120 mAh g−1 LiMnTiO4 cathode material. By contrast, Chen et al. [8] reported a low-temperature sol-gel route at 500 °C to synthesize high-capacity LiMnTiO4 up to 200 mAh g−1. The increased capacity may be a result of the higher surface area of nanoparticles synthesized at lower temperatures. However, in comparison to micromaterials, nanomaterials have many disadvantages, such as low volumetric energy density and poor cycle life, caused by high surface energy, which increases the undesirable surface reaction. Additionally, at a low firing temperature of 500 °C, the TiO2 impurity phases cannot be removed. The synthesis temperature affects not only particle size and purity but also the phase content, as well as the phase properties, of cathode materials [10].
Based on the above investigation, in this work, we studied the effects of synthesis temperature and the sol–gel method on the electrochemical performance of Li1.33MnTiO4+z (0.8LiMnTiO4•0.2 Li2Mn0.5Ti0.5O3). This work aims to increase the capacity and cycling stability of LiMnTiO4 while taking advantage of its unique qualities, including low cost, thermal stability, and nontoxicity.

2. Materials and Methods

2.1. Preparation of Cathode Materials

LiCH3COO·2H2O, Mn(CH3COO)2·4H2O, and citric acid with a molar ratio of 1.33:1:2.33, respectively, were dissolved in a mixed solvent of distilled water and ethylene glycol. Then, titanium (IV) isopropoxide with a molar amount equal to that of Mn(CH3COO)2·4H2O was added dropwise. The sol was stirred for 5 h and then heated to 140 °C for 12 h. The obtained xerogel was fired in the air at 500, 600, and 700 °C (ramping rate: 2 °C min−1) for 14 h and then cooled naturally. The resulting Li1.33MnTiO4+z nanoparticles are denoted as S500, S600, and S700, respectively.

2.2. Structural, Physical, and Electrochemical Characterization

X-ray diffraction measurements (Rigaku X-ray diffractometer with Cu-Kα radiation at 45 kV and 200 mA with a scanning step of 0.02°) were conducted to analyze the phase of the samples in the range of 10° ≤ 2θ ≤ 100°. Rietveld refinement was conducted using the General Structure Analysis System (GSAS) program [14]. A scanning electron microscope (SEM, Nova NanoSEM 450) and a high-resolution transmission electron microscope (HRTEM, JOEL JEM-2100F) were used to determine the morphologies of the particles. X-ray photon spectroscopy (XPS, K-Alpha+ Thermo Scientific) was used to determine the oxidation state of the elements. The Brunauer–Emmett–Teller method was used to determine the surface area of particles (BET, BEL JAPAN Inc., Japan).
Coin cells were fabricated to evaluate the electrochemical properties of the cathodes (reference electrode is Li metal). The working electrodes comprised the active material, Ketjen black, and teflonrized acetylene black (TAB) as a binder, in a mass ratio of 70:10:20, respectively. These materials were mixed thoroughly and pressed onto a stainless steel mesh, and dried under vacuum at 120 °C for 12 h. The mass loading of cathodes was 3.57 mg/cm2. A 2032 coin-type cell, which consisted of the cathode, a separator, and Li metal, was assembled in an Ar-filled glovebox. The electrolyte was a 1 M LiPF6 solution in a 1:1 mixture of ethylene carbonate and dimethyl carbonate. The cell was aged for 12 h prior and whose electrochemical properties were tested by a NAGANO BTS-2004H battery charger between 0.1 and 3 V vs. Li+/Li. Electrochemical impedance spectroscopy (EIS) measurements were taken with an Autolab electrochemical workstation over a frequency range of 106 to 10−2 Hz with a voltage of 10 mV amplitude.

3. Results and Discussion

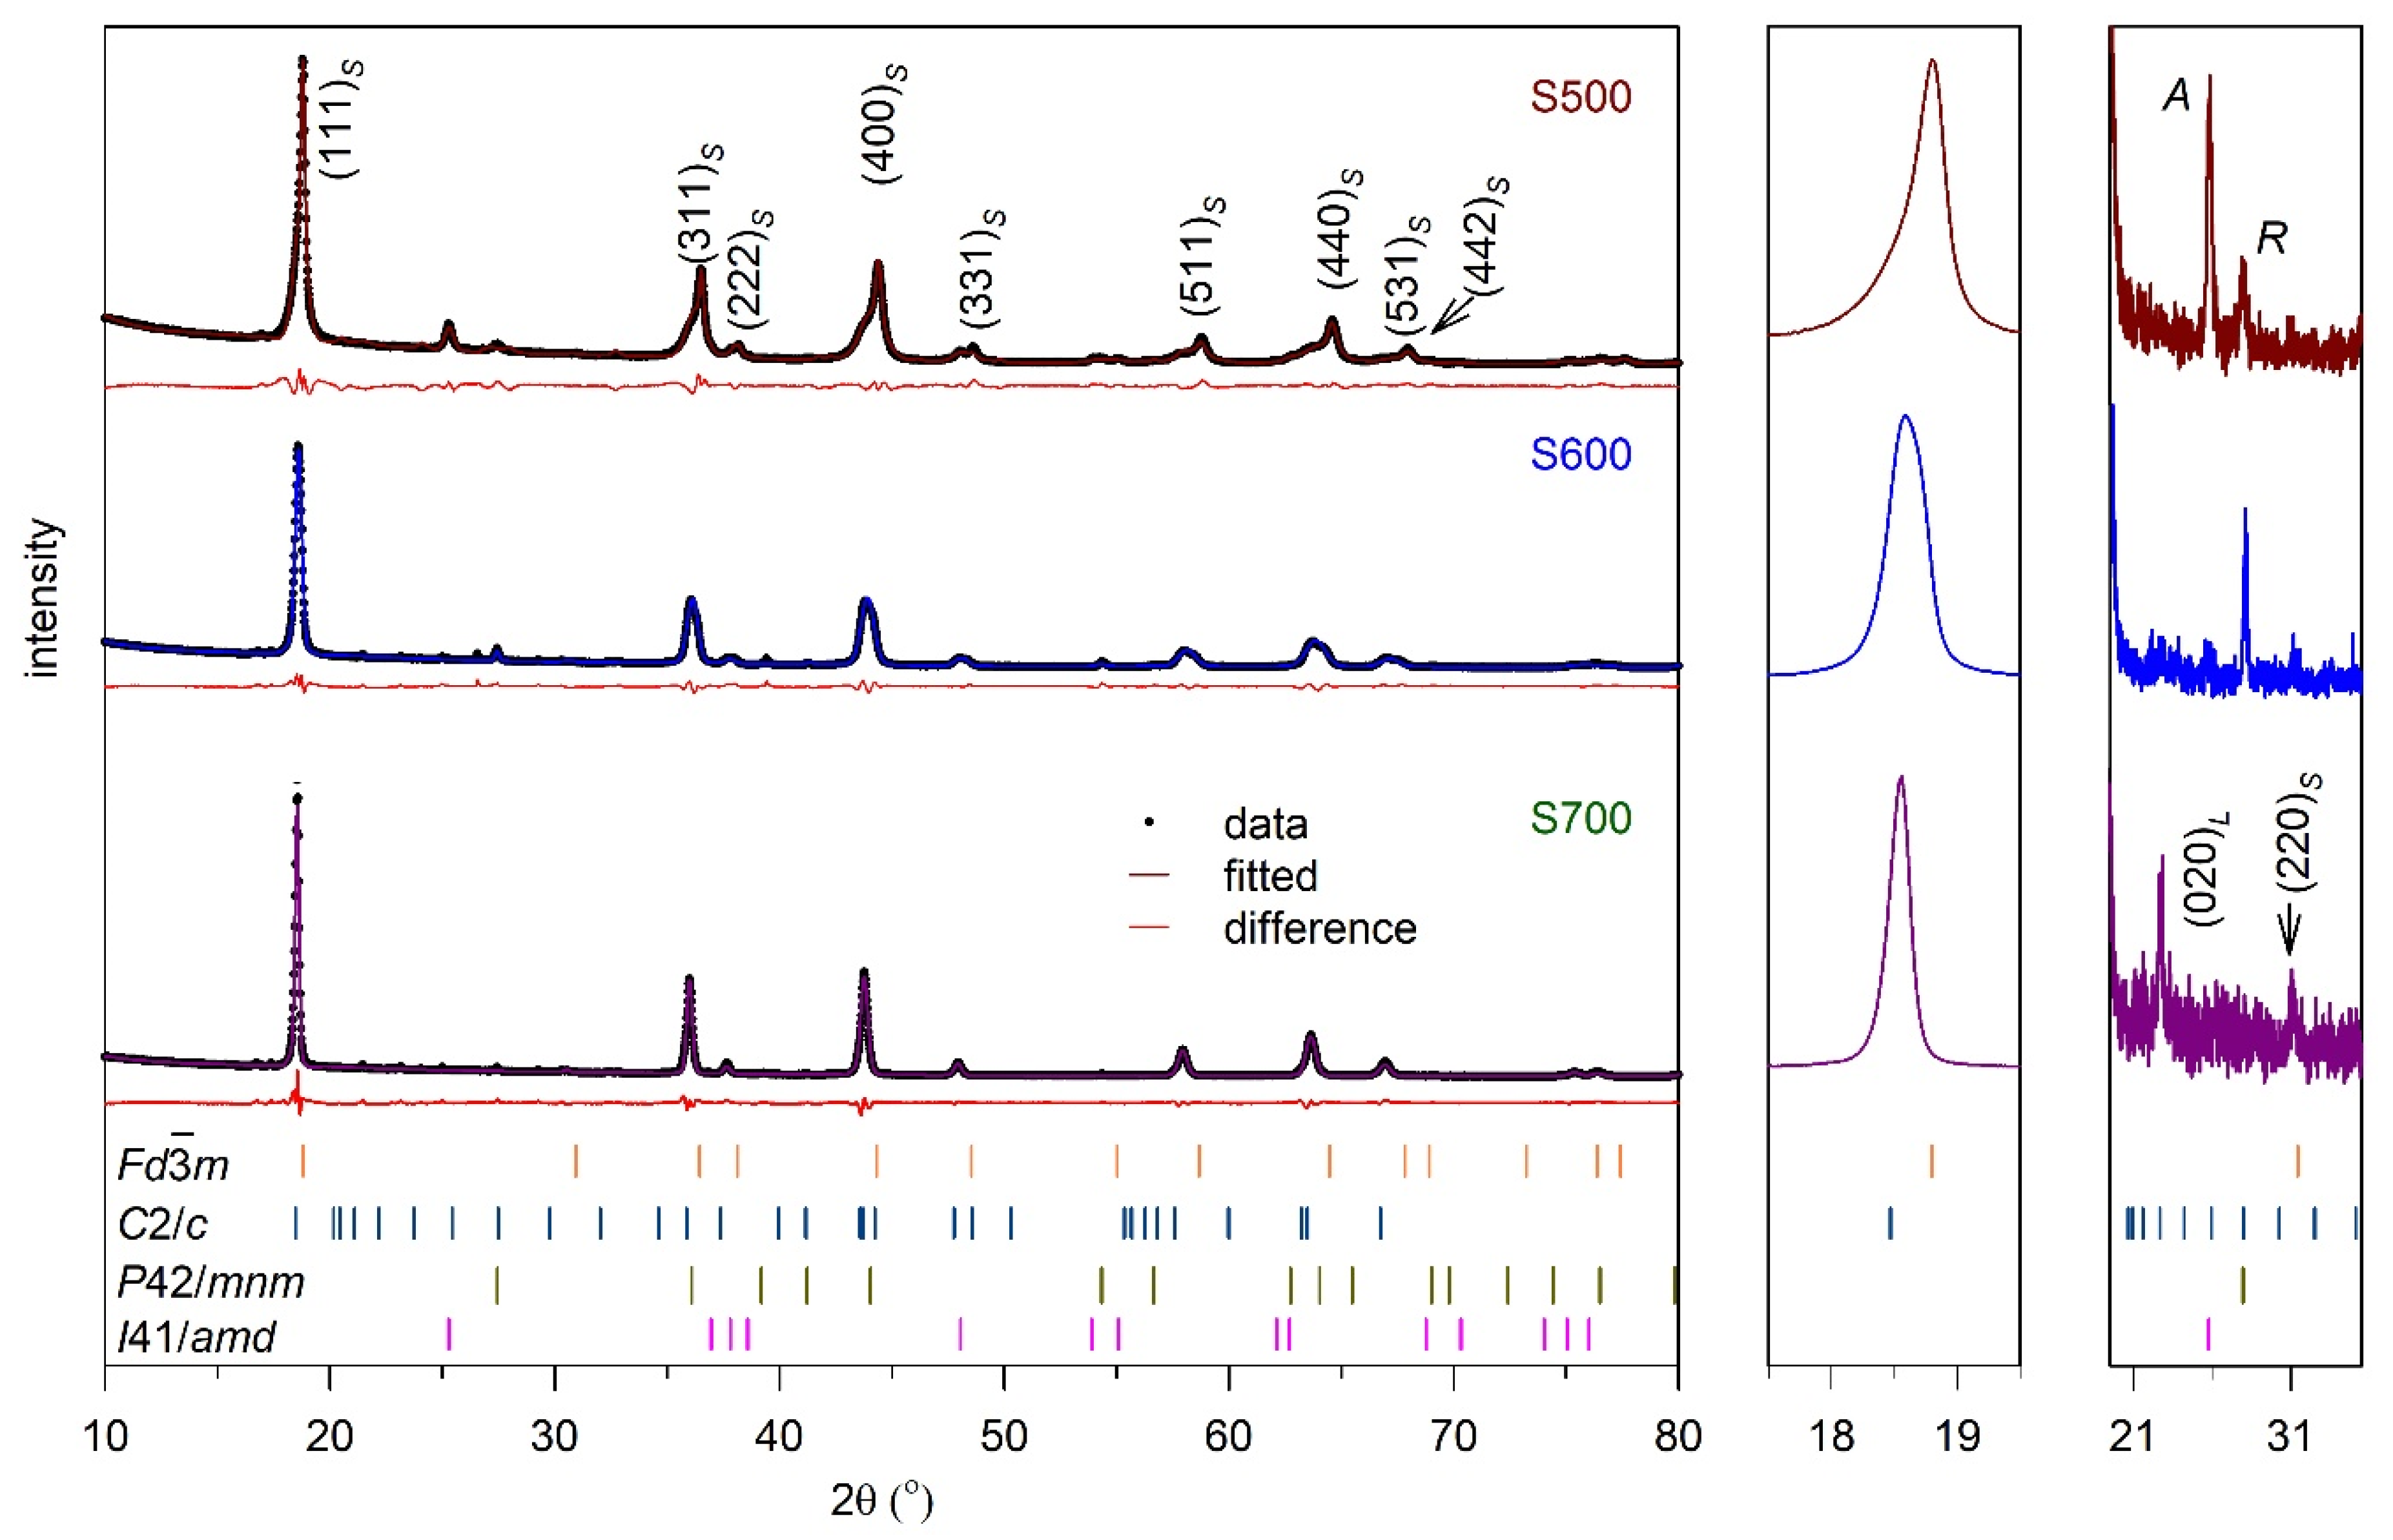
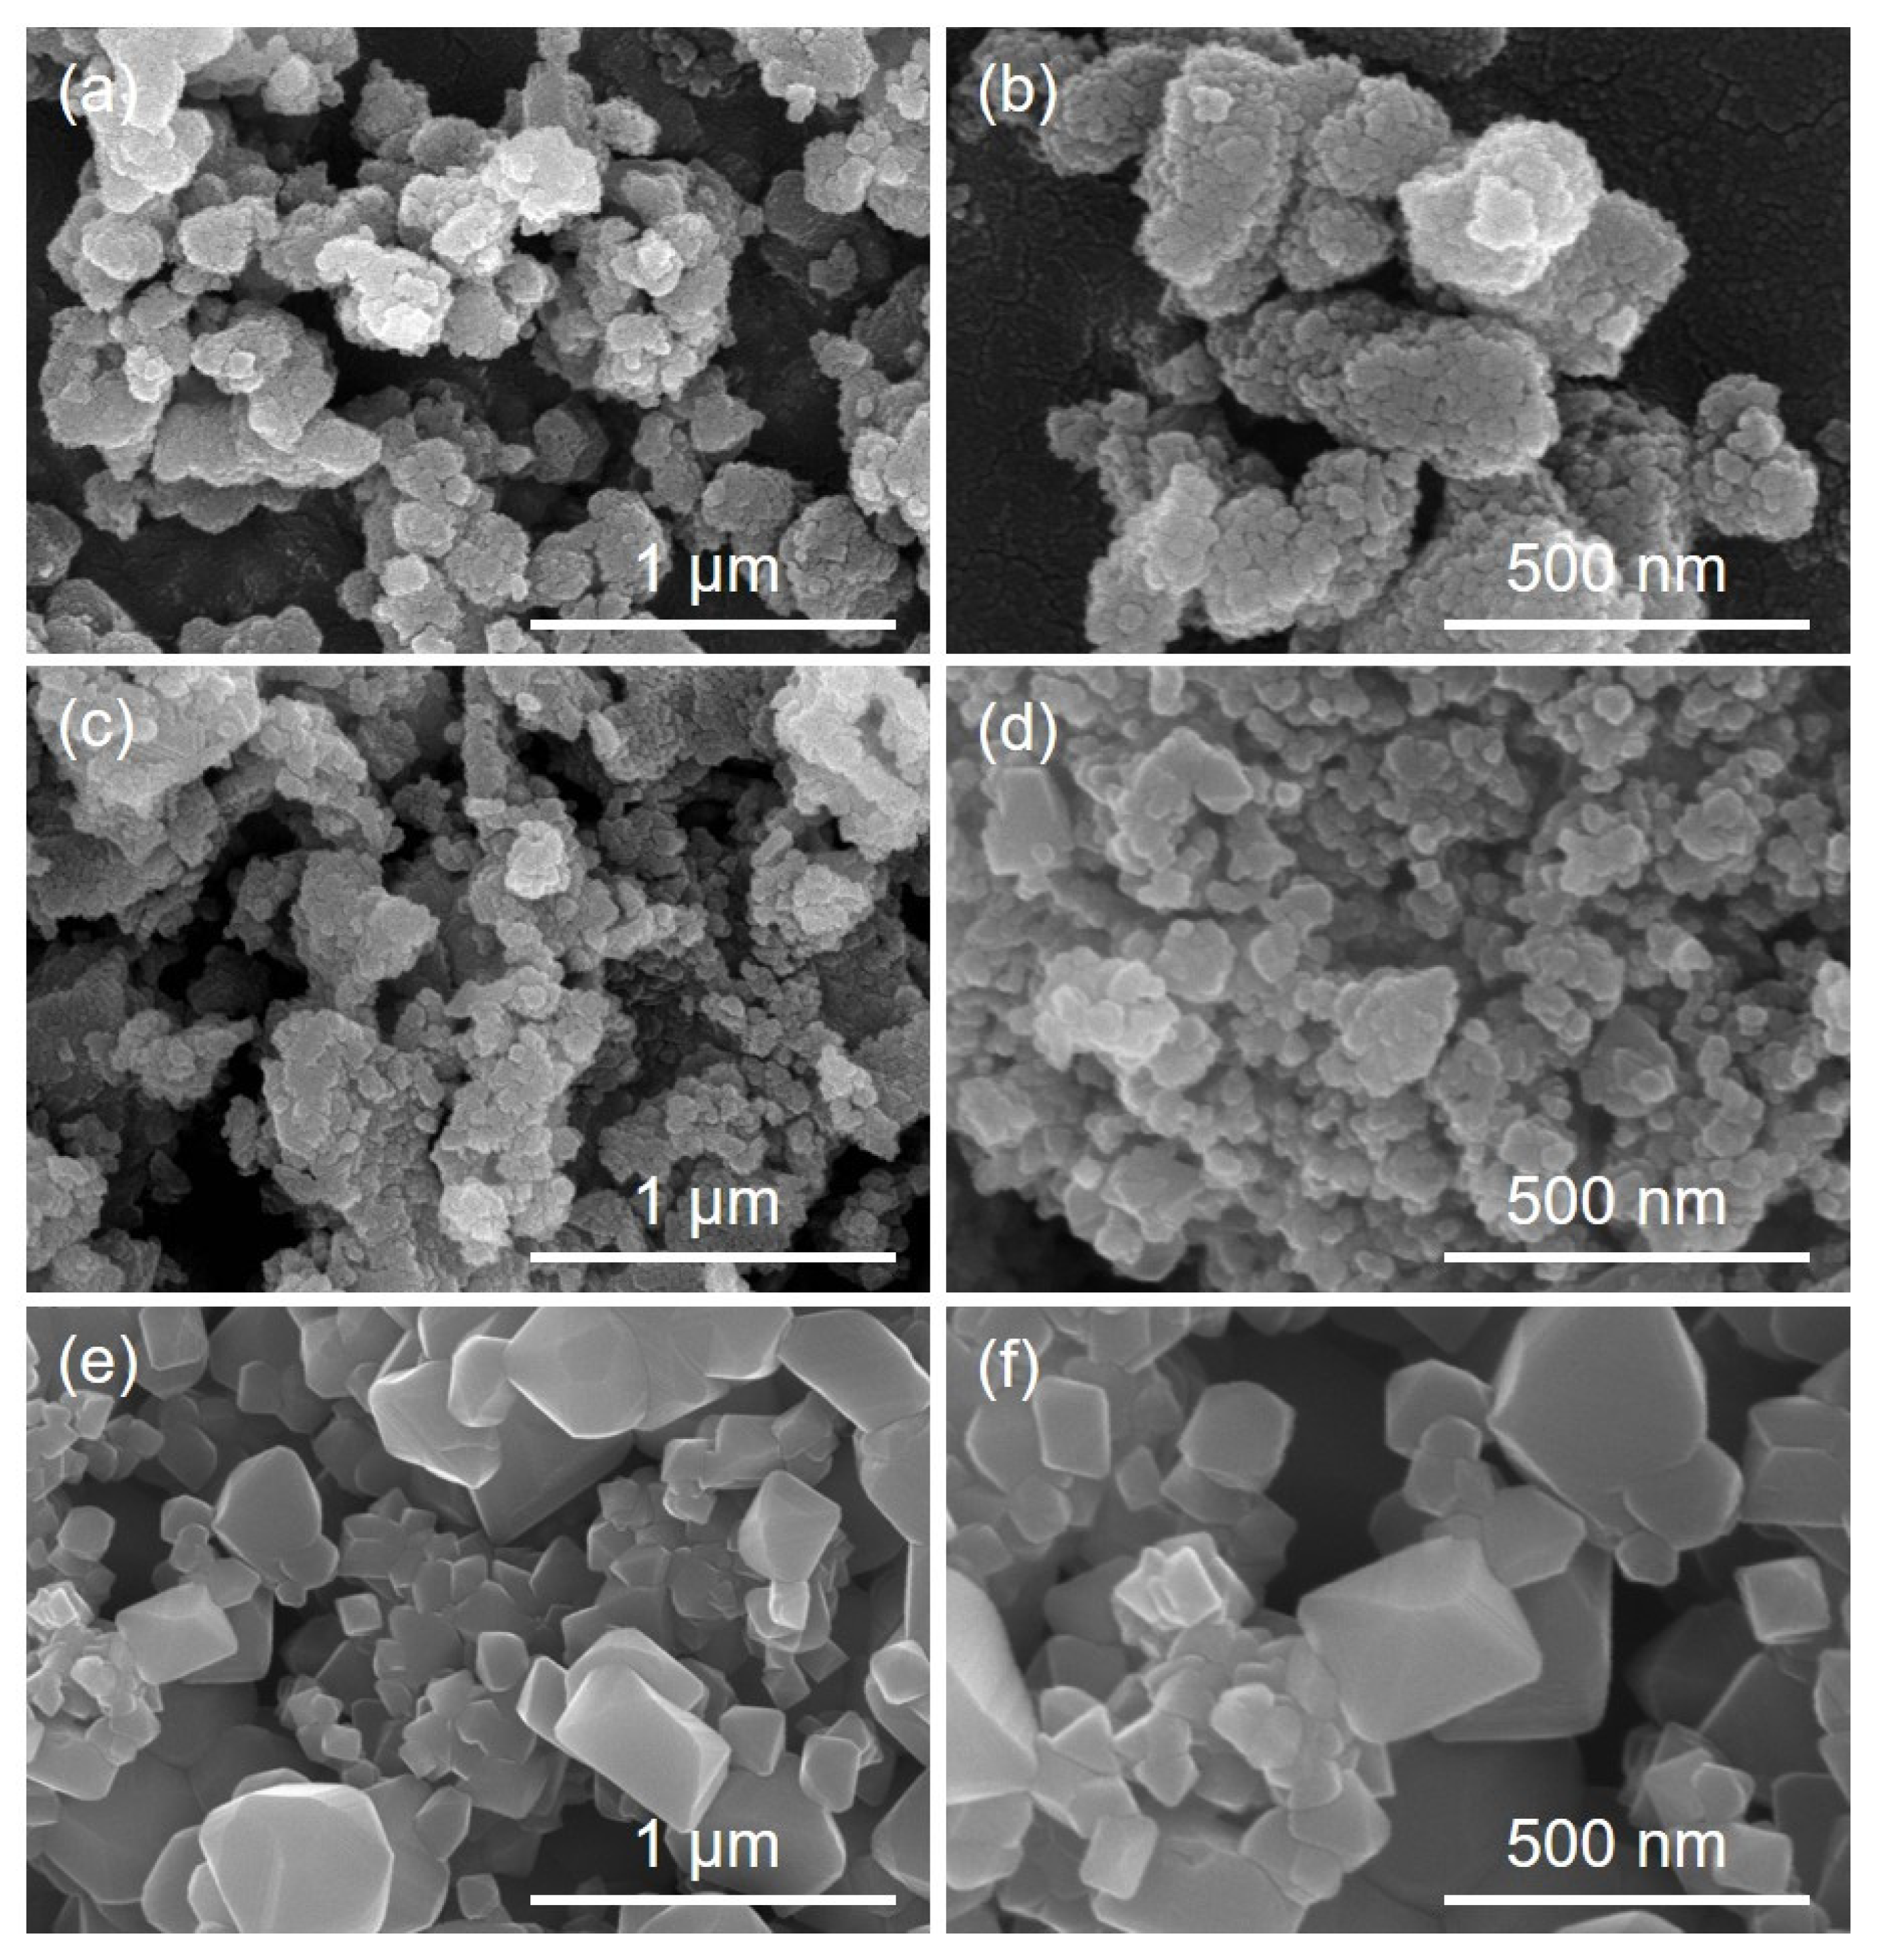
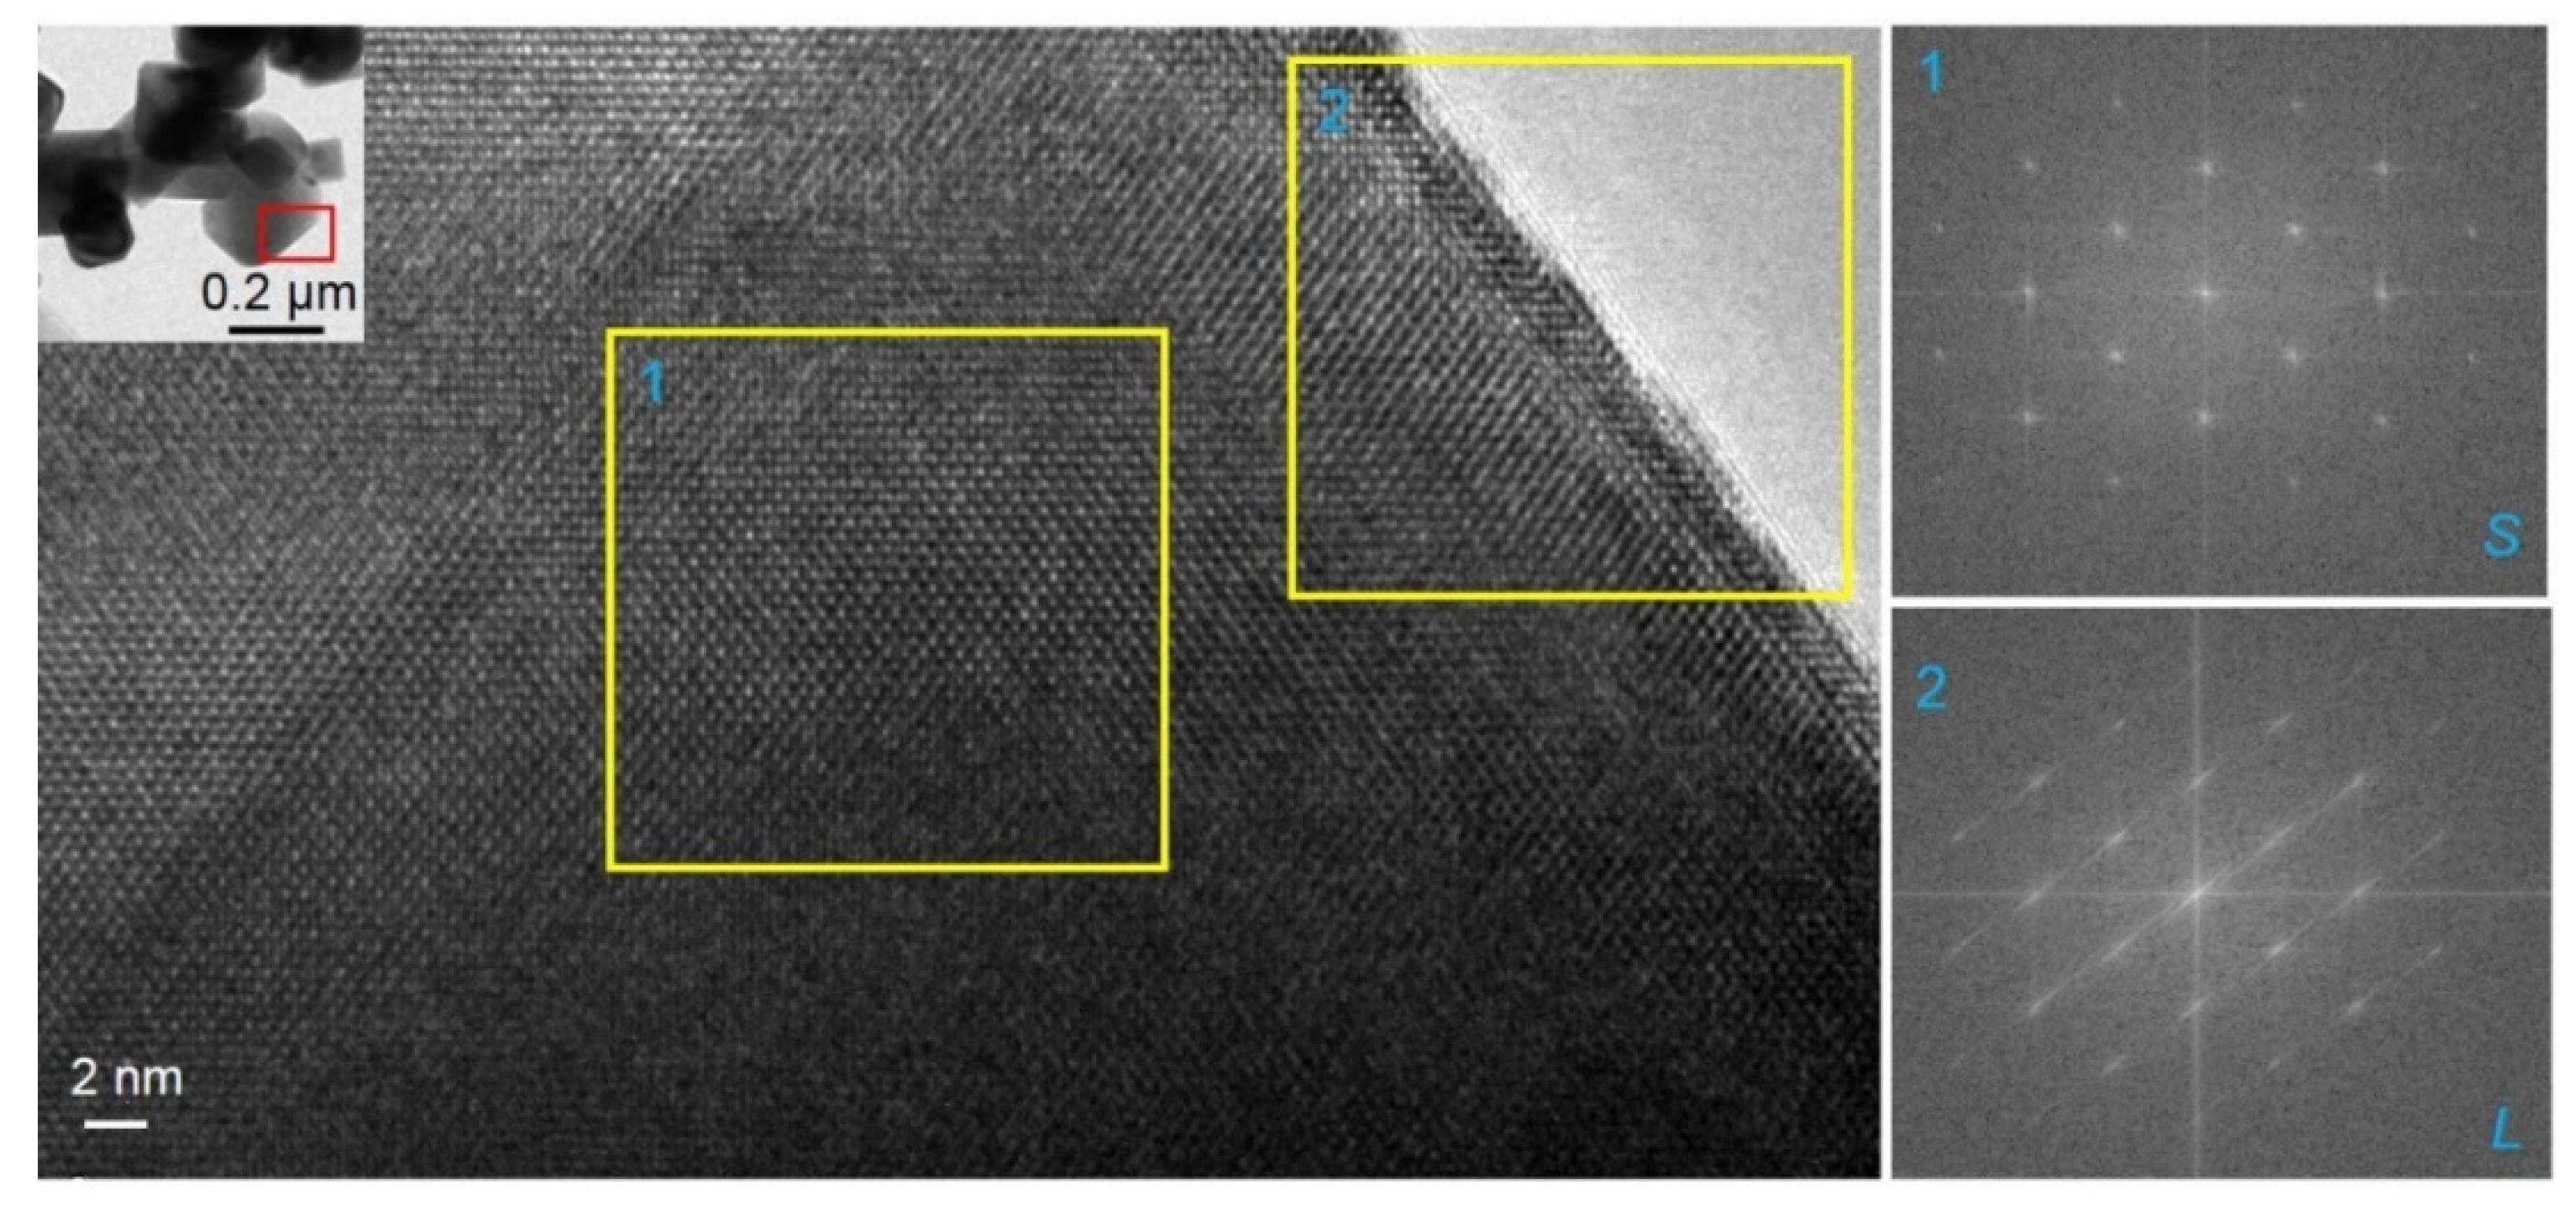
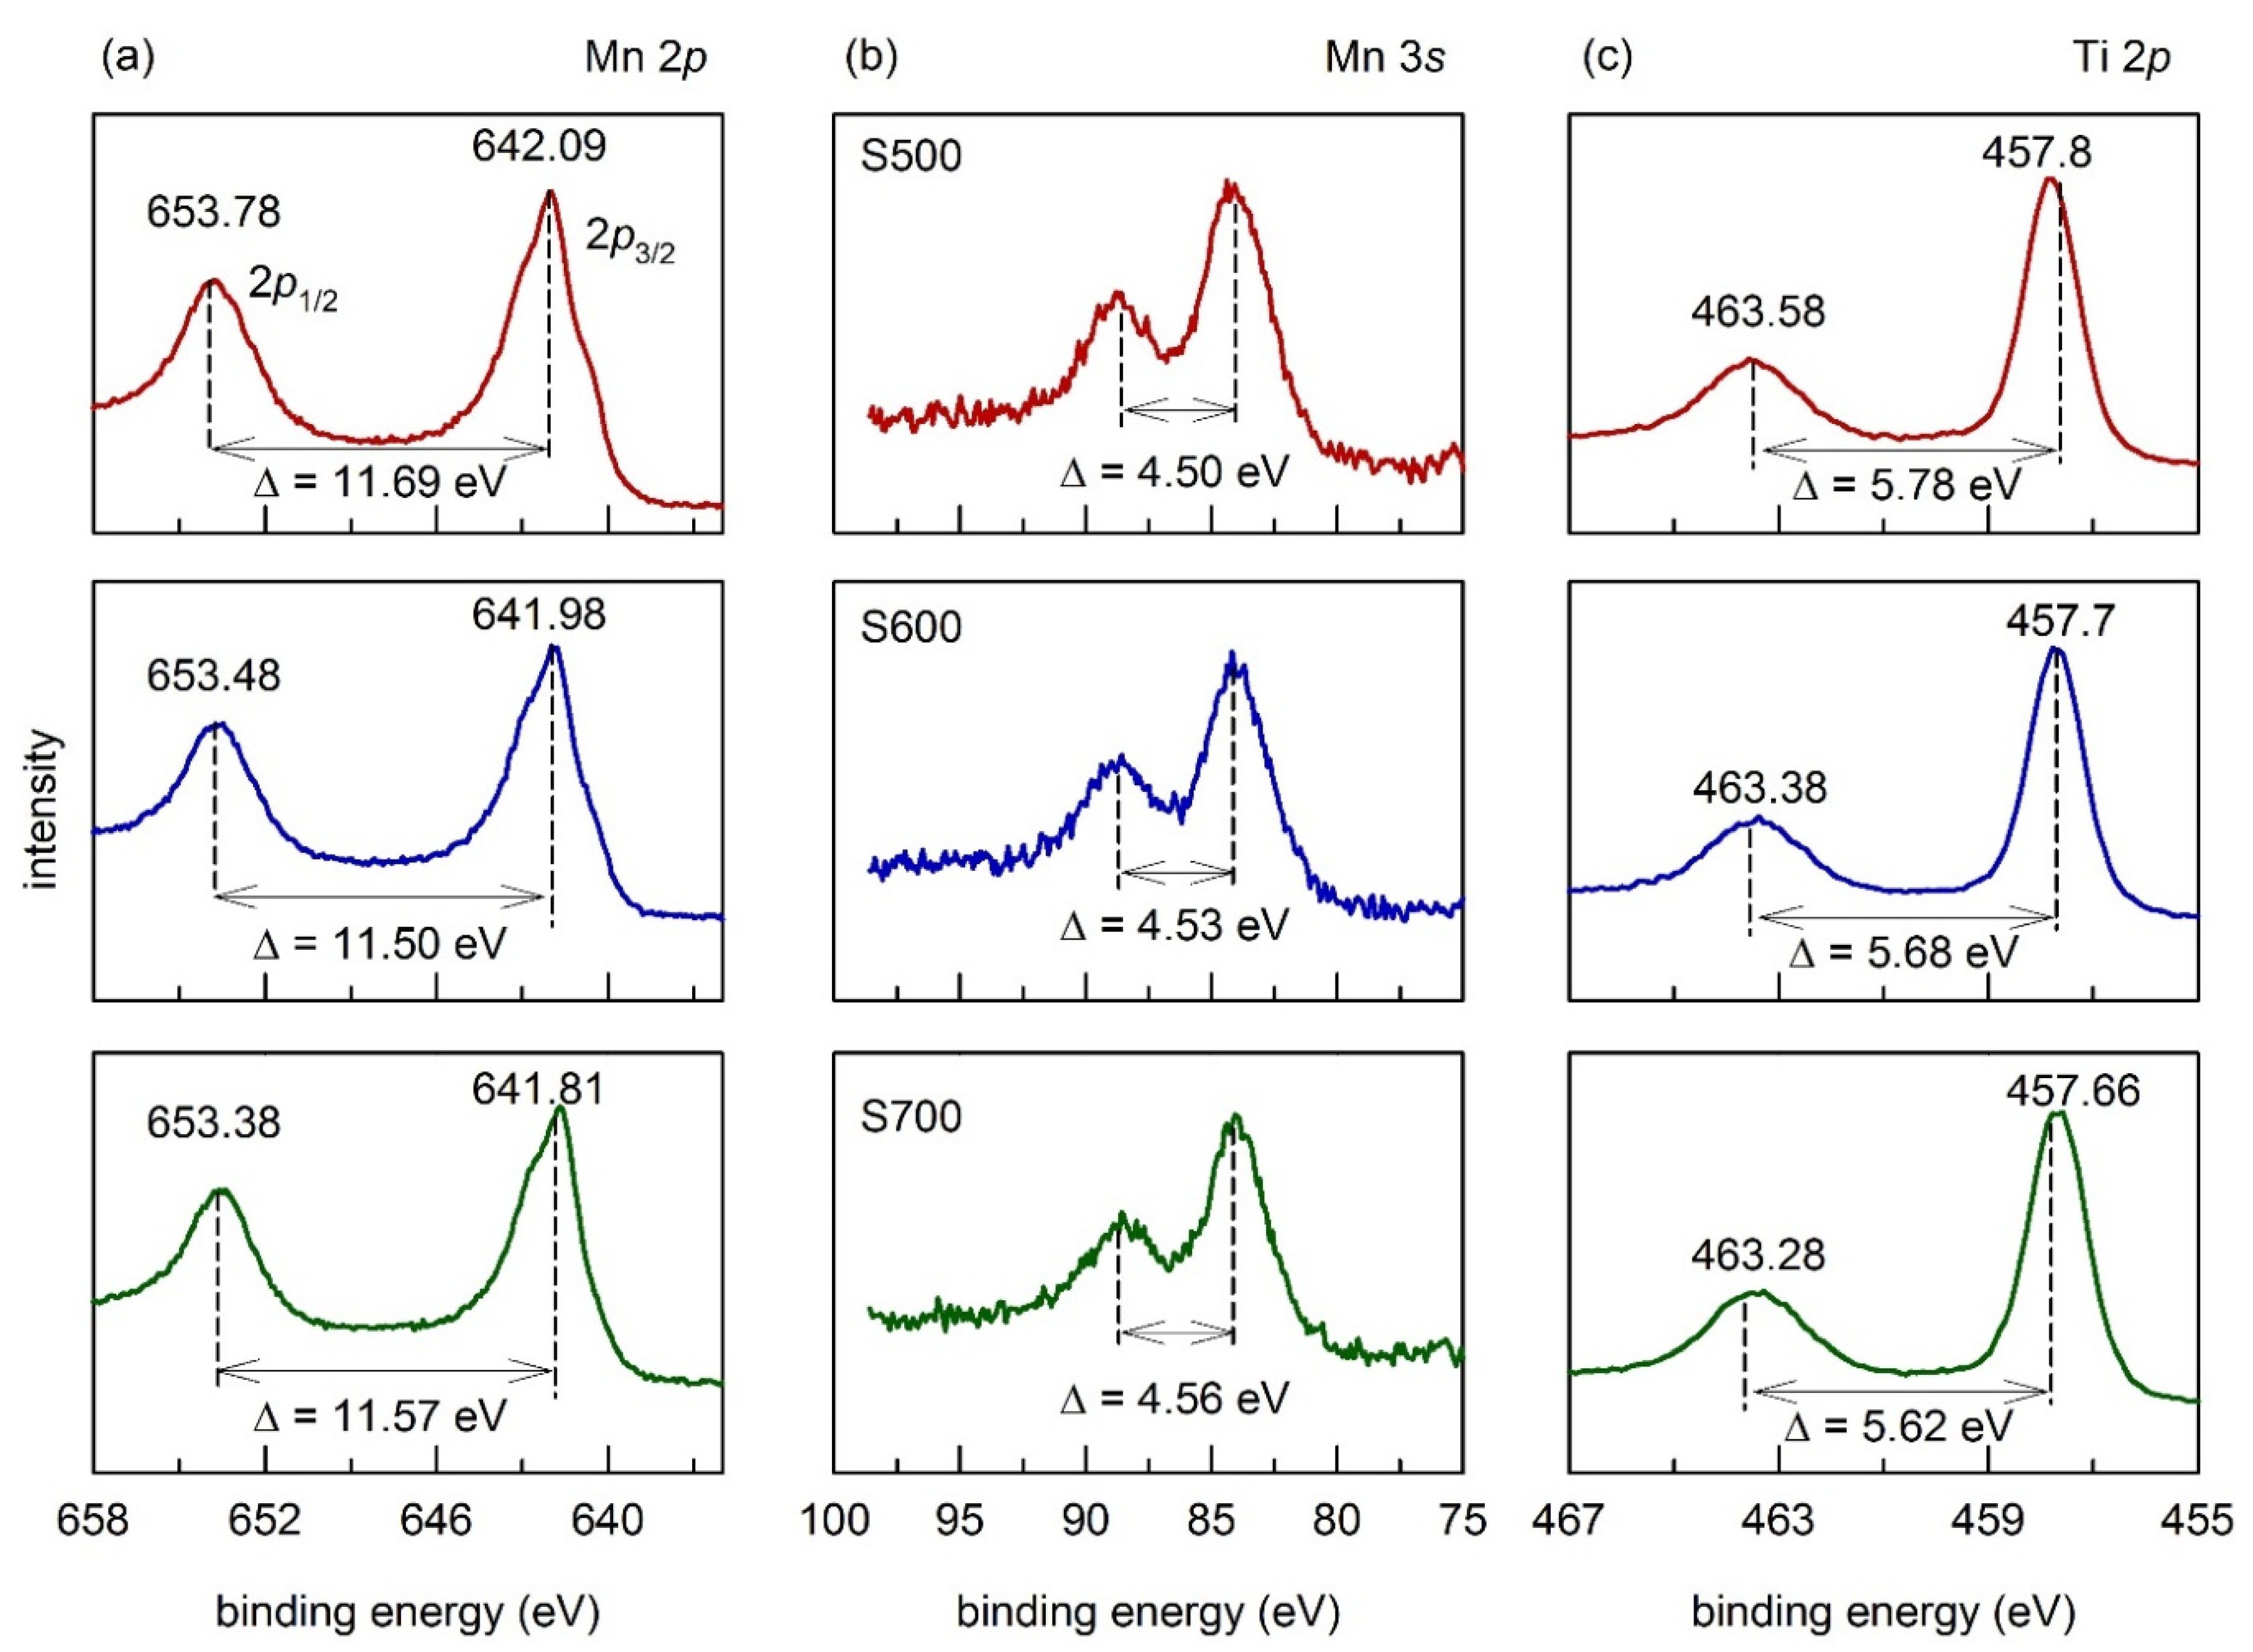
3.1. Structural Characterization of Cathodes

Figure 1 illustrates the comparison of the XRD patterns of three samples. As can be seen, with increasing synthesis temperature, the full-width at half-maximum peaks decreased, indicating an increase in particle size. The pattern of LiMn2O4, PDF# 35-0782 (dcell = 8.2472) standard with the cubic spinel structure and space group of Fd3m, was used to index these peaks. The S500 exhibited an impurity phase of anatase (A, peak located at 2θ = 25.2°) and rutile (R, a peak located at 2θ = 27.4°) TiO2, which was similar to the results reported in Ref. [8]. The anatase phase transforms into the rutile phase at 600 °C. Therefore, in the S600 sample, only the peak of the rutile phase was present. The low synthesis temperature did not provide sufficient energy to complete the reaction. At this temperature, if the amount of Li was increased, the reaction would be completed with no impurity phase of rutile and with an increase in the layered content in the composite [9,15,16]. For the S700 sample, no impurity phase was observed. All peaks could be indexed with LiMn2O4 and the space group of Fd3m. From the selected region, the strongest peaks of the (111) plane in the S500 and S600 samples shifted to a higher angle, caused by the formation of the spinel phase of Li1+xMn2−xyTiyO4. With increasing synthesis temperature, this phase decomposed to the spinel LiMnTiO4 and layered Li2Mn0.5Ti0.5O3, which is similar to Li2TiO3 [17]. This reaction can be defined using the following equations:
Li - Mn - Ti   citrate   salt   500   ° C     Li 1 + x Mn 2 x y Ti y O 4   ( anatase + rutile )   600   ° C     Li 1 + x Mn 2 x y Ti y O 4 + TiO 2   ( rutile )   700   ° C     LiMnTiO 4 + Li 2 Mn 0.5 Ti 0.5 O 3 + O 2
In the selected region from 19° to 33°, the intensity of the (020)L peak in the layered phase at ~20.5° and the (220) peak increased, moving from the S500 sample to the S700 sample. In the S700 sample, they could be clearly observed. The (020)L peak belongs to the ordering of the LiMn(Ti)6 units in the Li2Mn0.5Ti0.5O3 component and can be attributed to the Li and Mn (Ti) cation ordering in the transition metal layers. This peak was weaker in the S600 and S500 samples because of the disordering of Li and Mn (Ti). Conversely, the (220) peak caused by the substitution of Ti induced heavy atoms, especially Mn, to occupy the Li-occupied 8a sites [2,18,19,20,21].
Rietveld refinements were performed to evaluate the phase fraction and position of atoms in the phases of the three samples. The results are presented in Table 1 and Table S1. In the three samples, there were two main phases: The spinel phase (in the Fd3m space group) and the layered phase (in the C2/m space group for S500 or C2/c for S600 and S700). For the spinel phase, the lattice parameter increased because of the replacement of Ti4+ ions with a larger radius in the spinel frame. It exhibited a value of 8.267 in S700 and 8.212 in S500, similar to a report in Ref. [11]. When less Ti was substituted for Mn (S500), the layered phase was similar to Li2MnO3 (belonging to the C2/m space group), whereas it converted to C2/c similar to Li2TiO3 in S600 and S700 when large quantities of Ti were substituted for Mn. The total impurity of TiO2 in S500 was the highest, at 18% (in Ref. [8] it was 15%). When the synthetic temperature increased, the TiO2 impurity phase decreased and was respectively 5% and 0% for S600 and S700.
Figure 2 depicts the SEM images of the three samples. It was apparent that S500 exhibited the smallest particle size (Figure S1). The particles grew larger with increasing synthesis temperature. The primary nanoparticles in the S500 and S600 samples aggregated into secondary particles as a result of their large surface areas (Figure 2b,d). The S700 sample exhibited particle sizes of 100–300 nm. In the S700 sample, the octahedral shape of the particles was clear. This indicates the high crystallinity of this sample, consistent with the XRD data. The particle size and the crystallinity both affected the electrochemical performance of the cathode; the former enhanced the rate ability, whereas the latter enhanced the capacity and cycling stability.
We further analyzed the S700 sample using HRTEM because it had no impurity phase of TiO2 The results were shown in Figure 3. The lattice fringe spacing was determined to be 0.487 nm, which belonged to the (111) plane of the spinel phase or the (002) plane of the layered phase. The composite structure was clear in the marked region. Moreover, the FFT of the selected region confirmed the co-existence of the spinel and layered phases.
The oxidation states of Mn and Ti were determined by XPS measurements for all samples, as depicted in Figure 4. Accordingly, the Mn 2p peaks of all samples exhibited significantly split spin-orbit components (the splitting values were all greater than 11.5 eV), which were allocated for Mn 2p3/2 and Mn 2p1/2 [22]. The Mn 2p3/2 peak shifted to lower binding energy as the synthesis temperature increased because of the co-existence of Mn4+ and Mn3+. The values were 642.09, 641.98, and 641.81 eV for S500, S600, and S700, respectively. The XPS spectra of Mn 2p3/2 were deconvoluted to quantify the percentage of each ion, as depicted in Figure S2. The Mn3+ content increased, moving from S500 to S700, whereas the Mn4+ content decreased in this direction. To further confirm the existence of both Mn4+ and Mn3+ in these samples, the Mn 3s spectra were analyzed. The coupling of 3s electrons and 3d electrons could induce peak splitting in the Mn 3s spectrum, and its magnitude (ΔE) could be used to recognize the oxidation state of Mn. In general, ΔE values for MnO2 (Mn4+), Mn2O3 (Mn3+), and MnO (Mn2+) are 4.7, ≥5.3, and 6.0 eV, respectively [23]. The existence of a lower oxidation state of Mn causes an increase in ΔE. The values of ΔE for S500, S600, and S700 were 4.5, 4.53, and 4.56, respectively. These values were lower than those in MnO2 because of the effects of Li and Ti in the structure. However, these values indicate that most of the Mn in the three samples is in the +4 oxidation state. Additionally, the amount of Mn4+ in the S500 was the highest, and the amount of Mn3+ increased for S600 and S700. This result was consistent with the XRD analysis and the mechanism proposed above. For Ti, the Ti 2p in the three samples was also split into two peaks, similar to that of Mn 2p, which is a typical characteristic for a 3d transition metal. The Ti 2p3/2 binding energies increased in the following sequence: S500 > S600 > S700. The value for S700 was 457.66 eV, in agreement with the Ti4+ of the Li2TiO3 [24]. However, S500 and S600 exhibited Ti 2p3/2 binding energies of 457.8 and 457.7 eV because of the presence of the impurity phases of TiO2.

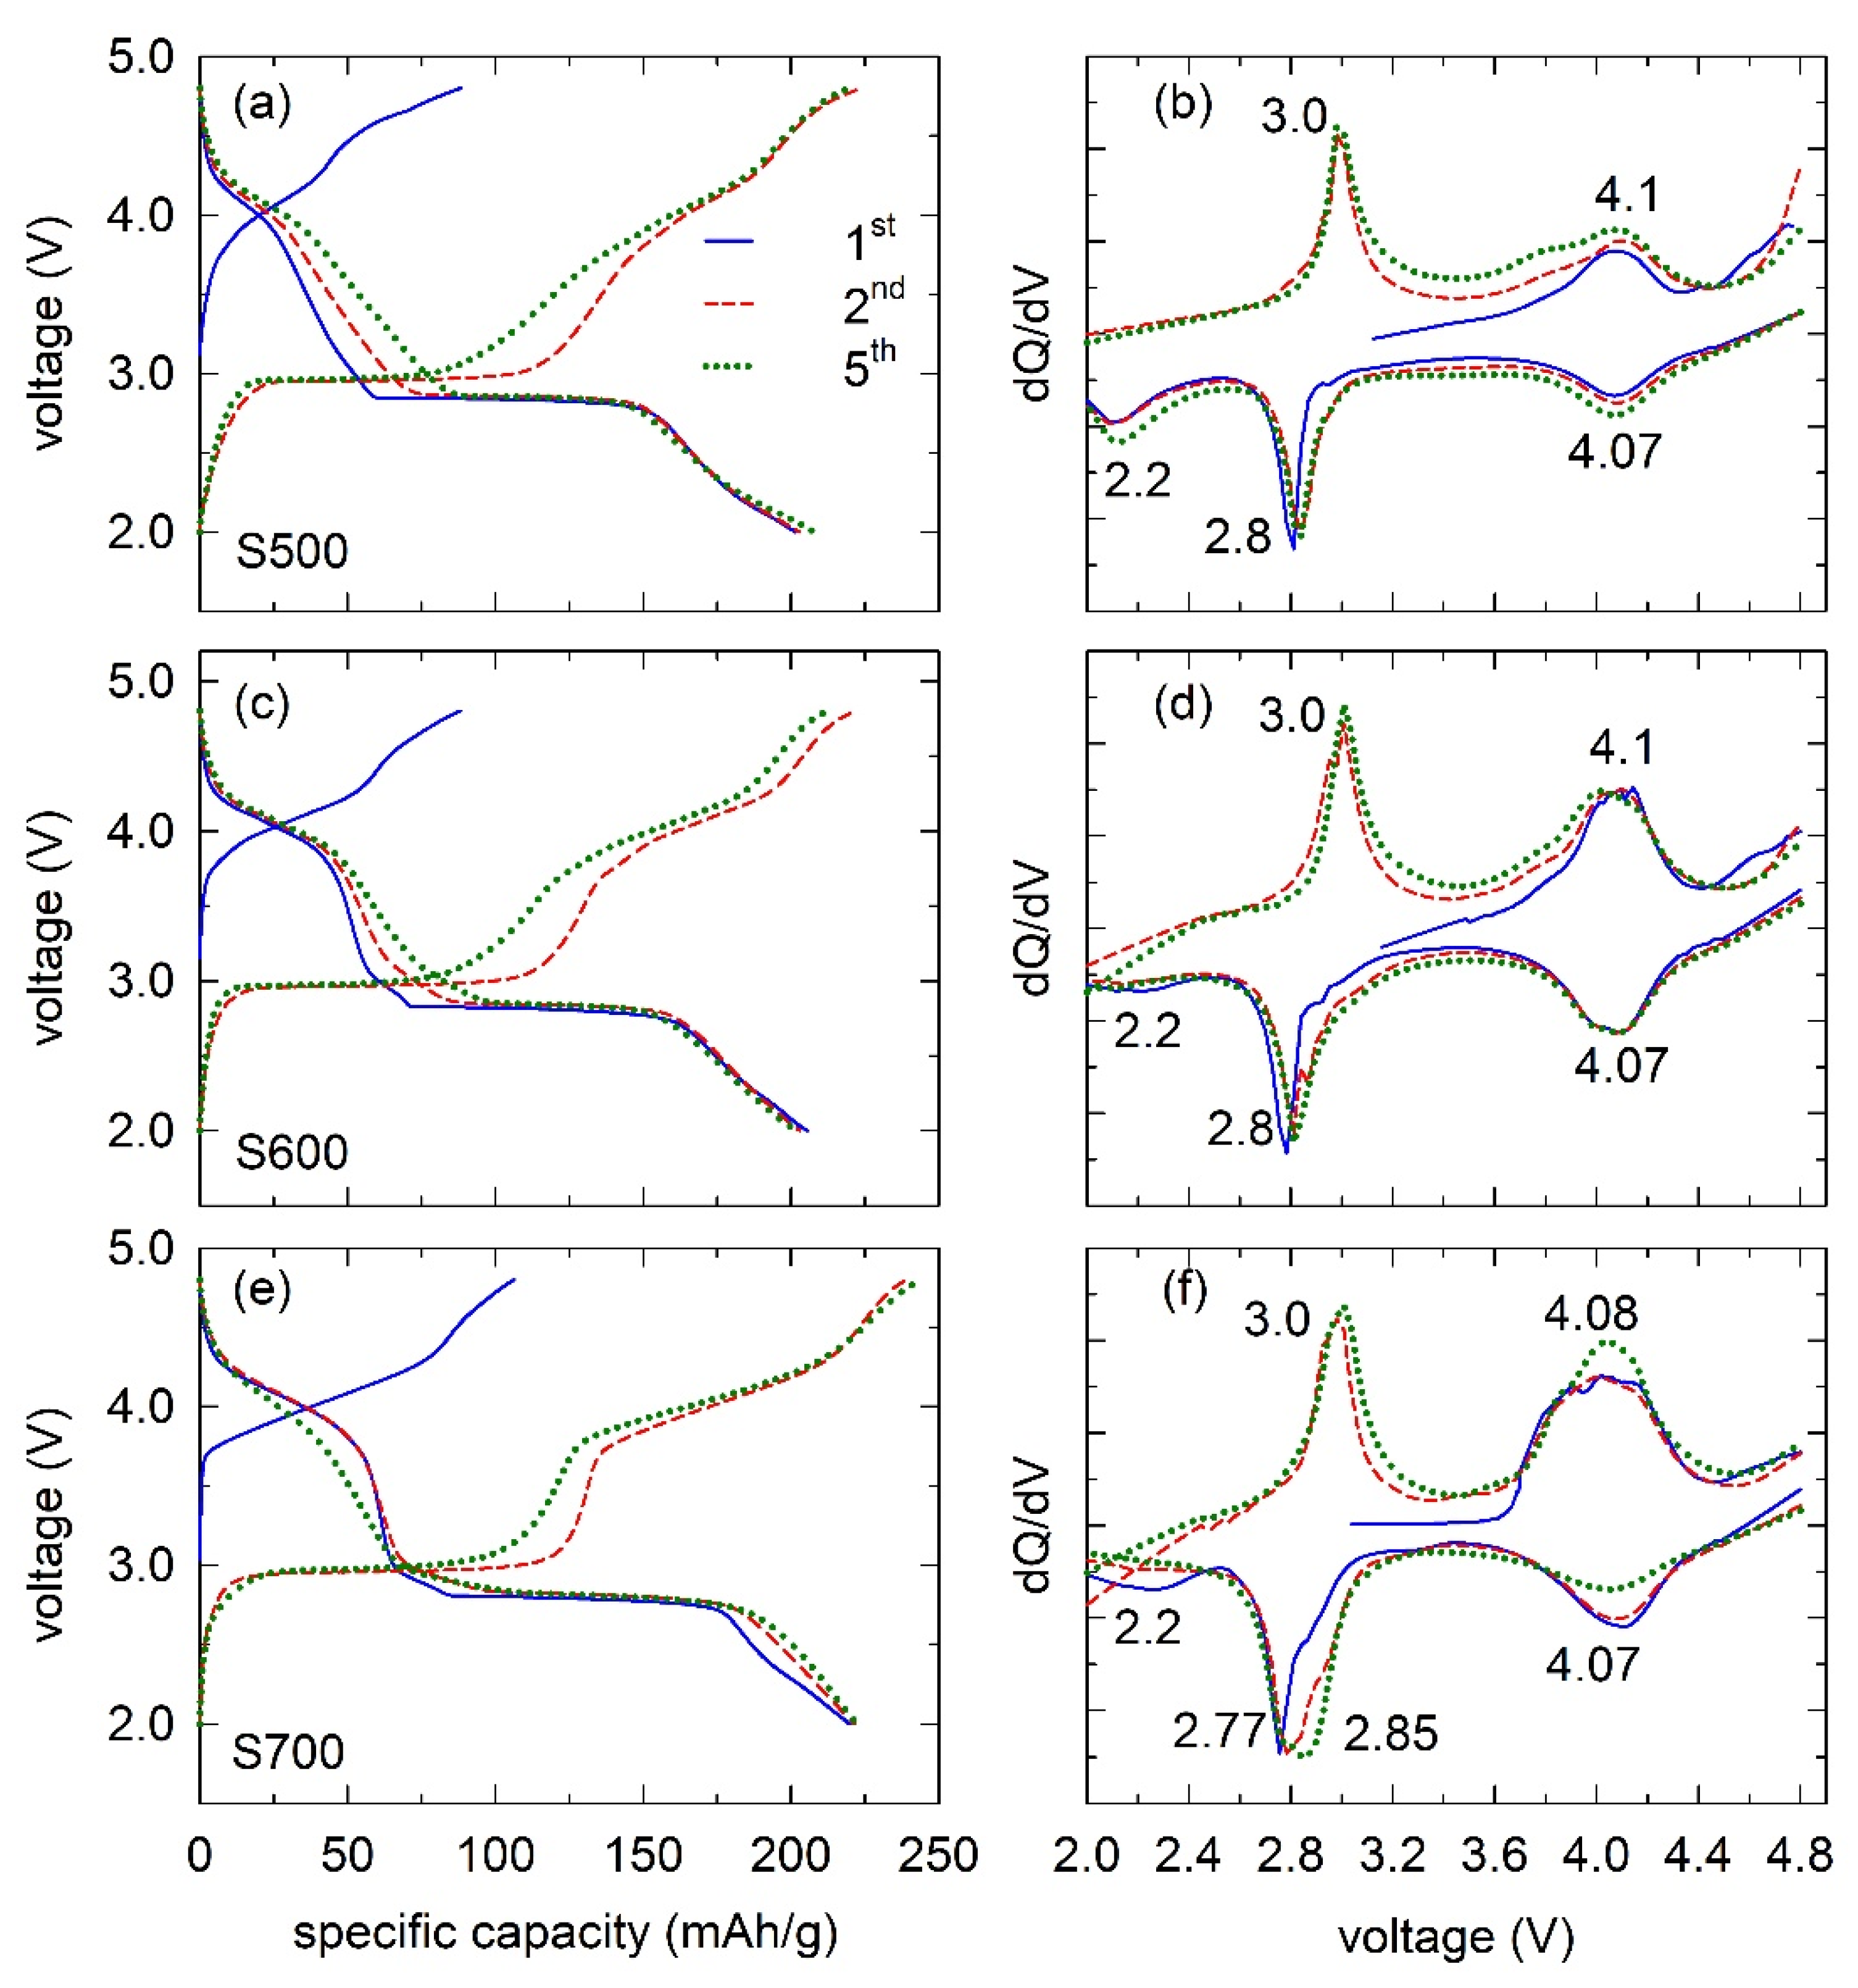
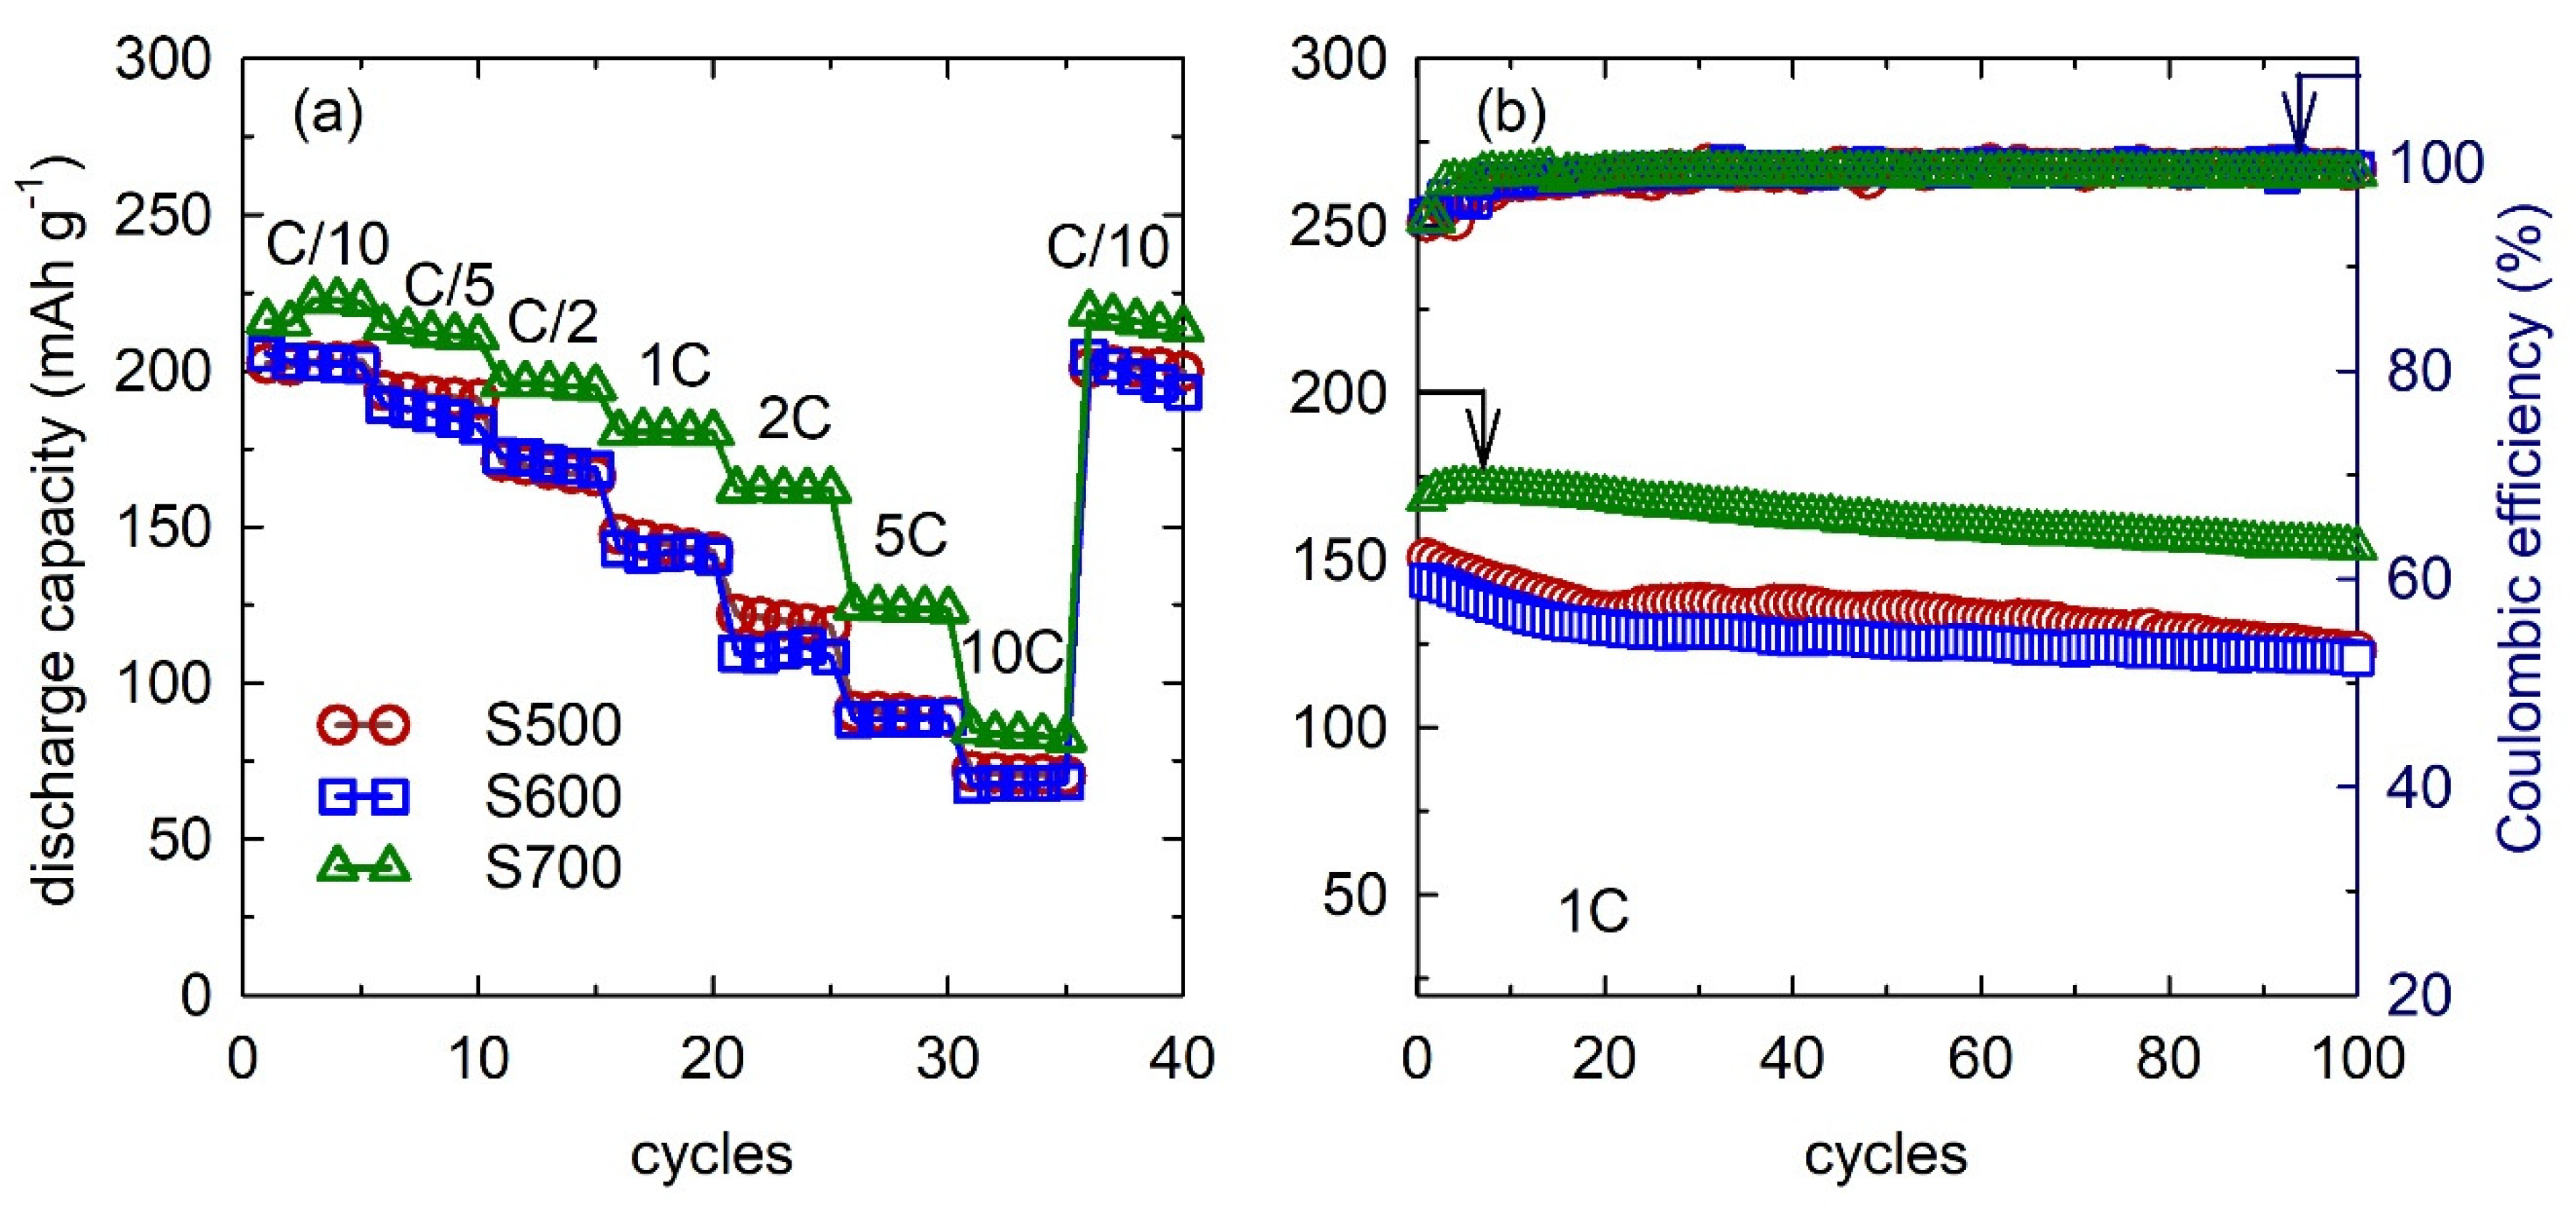
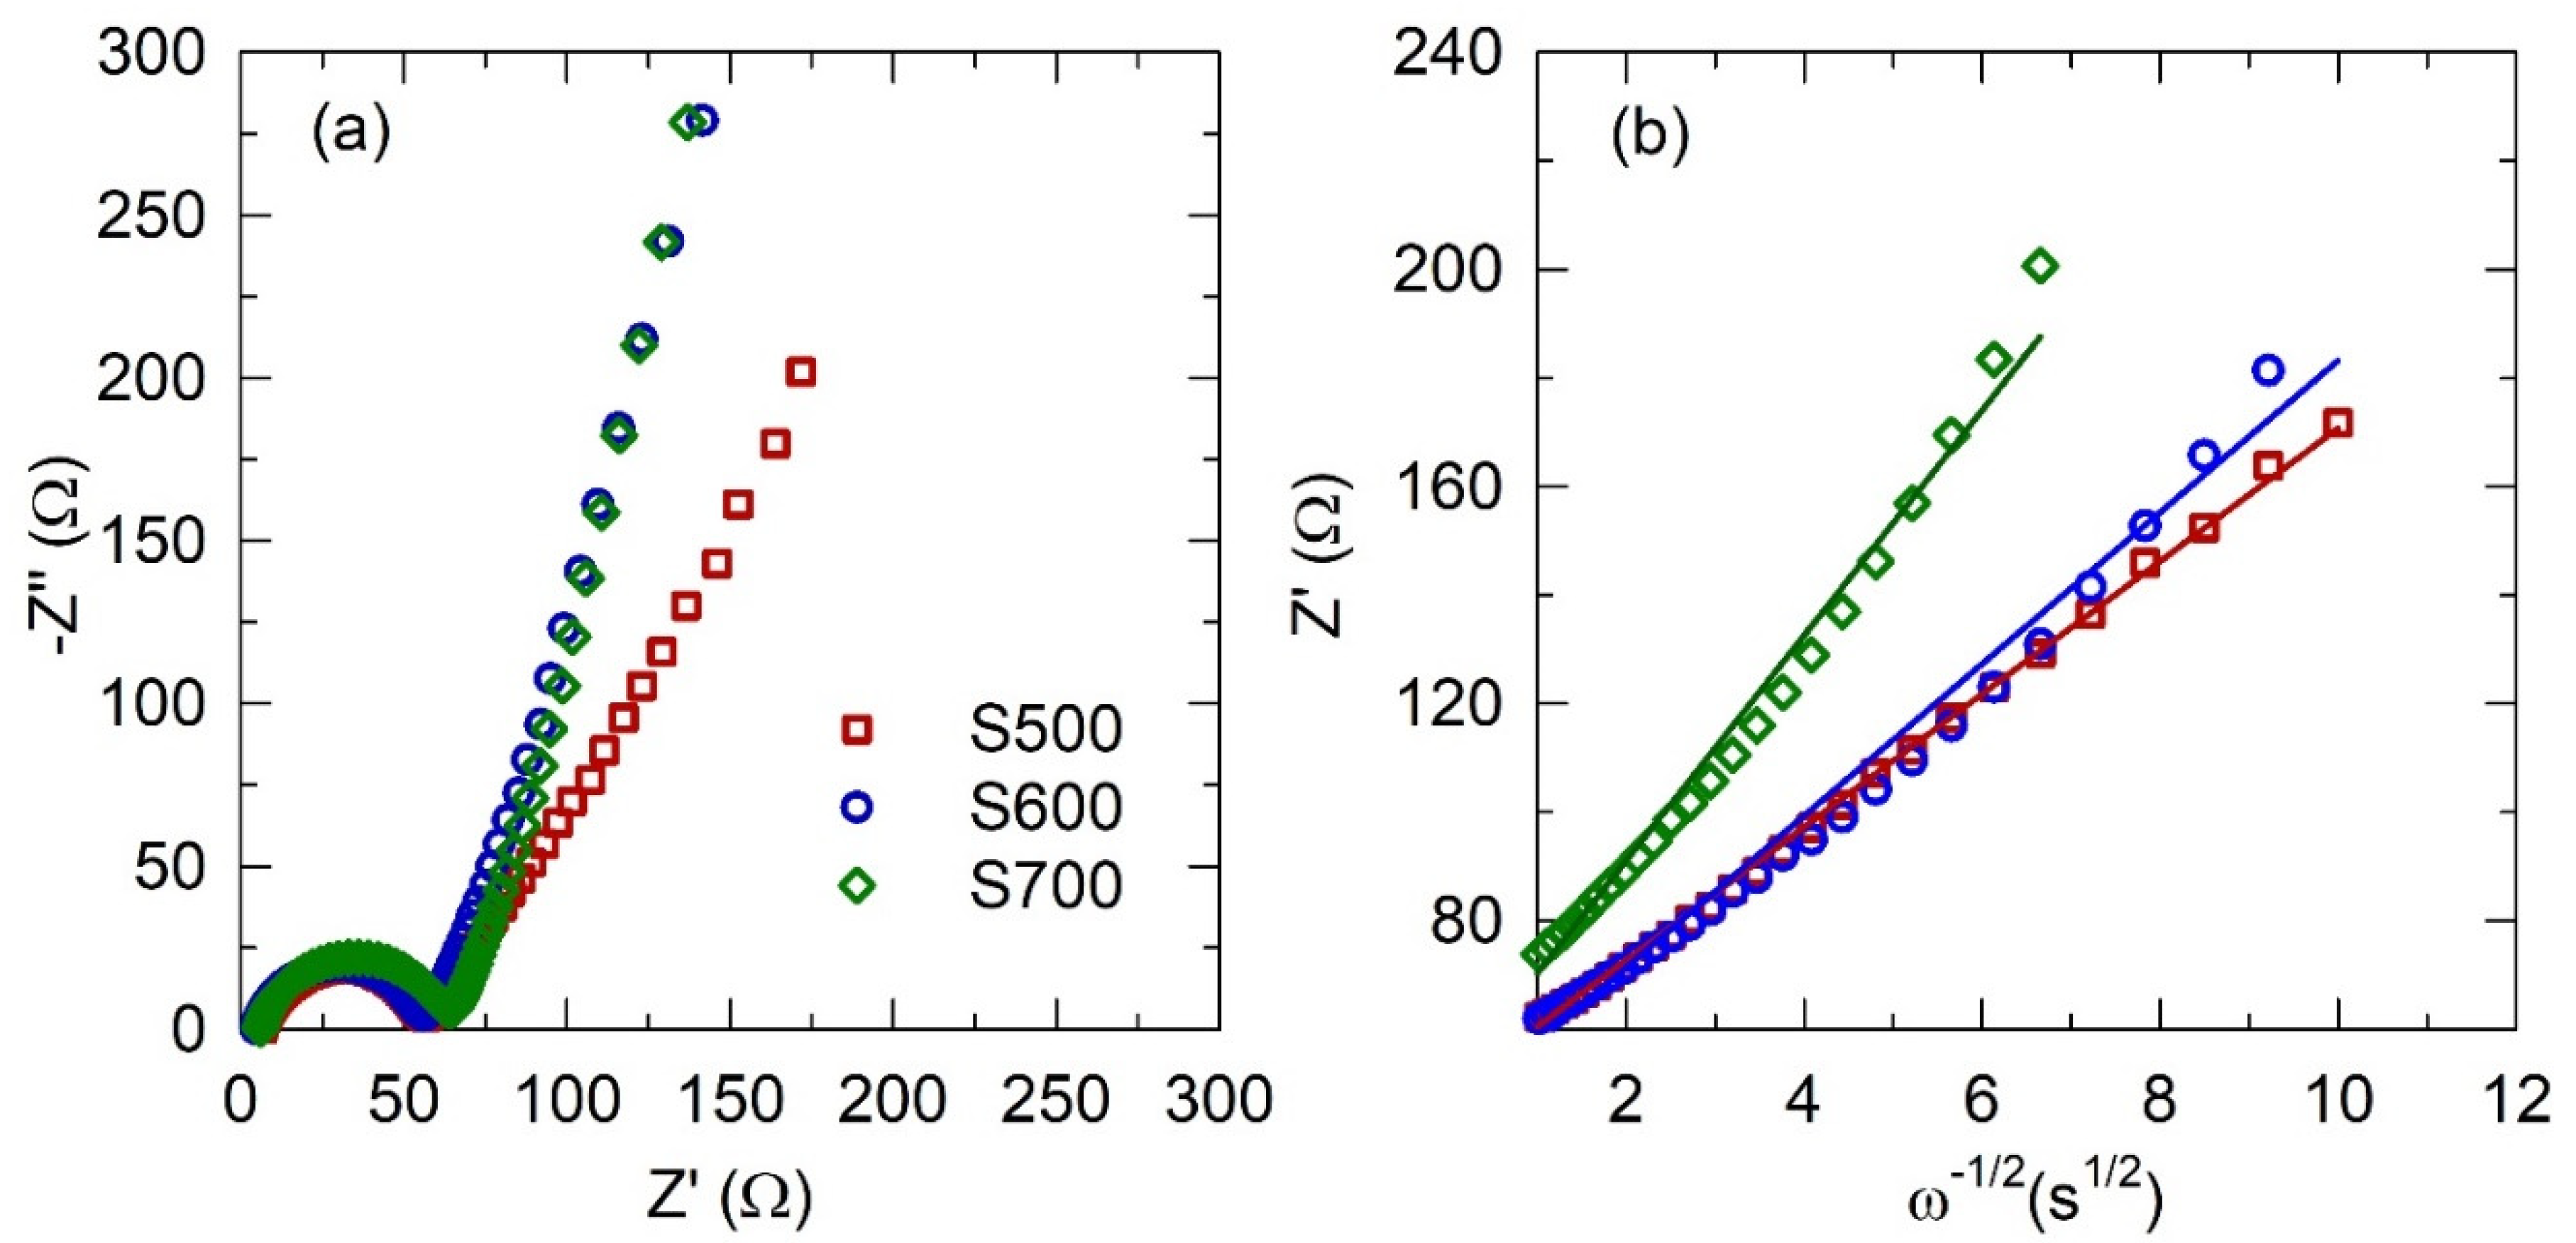
3.2. Electrochemical Properties

Figure 5a,c,e depict the charge-discharge profiles of the three cathodes at C/10 (1C = 154 mA g1). In the initial charging process, these cathodes exhibited similar profiles, with a plateau at ~4.1 V. This plateau was attributed to the extraction of Li+ from the tetrahedral 8a site in the spinel cathode, with simultaneous oxidation of Mn3+ to Mn4+. The capacity of S700 (106 mAh g1) was higher than those of S600 and S500 (88 mAh g1) because of the absence of a TiO2 impurity phase. During the discharge process, the three cathodes exhibited two plateaus, located at ~4.07 and ~2.8 V. The first one corresponded to the formation of the LiMnTiO4 phase, in which Li+ was inserted back to the 8a site, similar to what occurred in LiMn2O4. The second one was related to the formation of Li2MnTiO4, in which Li+ was inserted into the 16c site.
The discharge capacities of the S500 and S600 cathodes were similar (~205 mAh g1), whereas that of the S700 cathode was the highest (218 mAh g1). There are three effects that contribute to the discharge capacity, including size effect, structure effect, and purity effect. The S500 and S600 samples exhibited lower particle sizes, thereby increasing their surface areas and further enhancing their discharge capacities (the surface area of S500 and S600 is 13.8 and 8.81 m2 g1, respectively). However, they also exhibited an impurity phase of TiO2, thus reducing the amount of active material. The S700 sample exhibited larger particle sizes (its surface area is 4.19 m2 g1); however, there was no impurity phase of TiO2, thus providing maximum active material. Additionally, the disordering structure in S500 and S600 was higher than that in S700, thereby increasing the capacity of the cathodes [25]. The S600 and S700 cathodes exhibited a layered phase at the 3 V region, which was not clear in the S500 sample. This is clearly observed in the dQ/dV plot and is discussed later. However, in the subsequent cycle, the activation of the layered phase was apparent in the three cathodes by increasing the working voltage over the 3 V region. The first Coulombic efficiency (CE) was over 100%, which is characteristic of the spinel phase. In the subsequent cycle, the capacity of the three cathodes increased because of the activation of the layered phase. This activation caused the CE to increase with cycling. After five cycles, the discharge capacity of the S700 sample was the highest, at 222 mAh g1 (specific energy ~679 Wh kg1, which is higher than that of LiMn2O4, ~480 Wh kg1), whereas it was 208 and 210 mAh g1 for S500 and S600, respectively.
The corresponding dQ/dV plots of the three cathodes at the 1st, 2nd, and 5th cycle are depicted in Figure 5b,d,f, respectively, for a better understanding of the electrochemical performance of these samples. For the 1st charge–discharge process, these cathodes exhibited peaks at ∼4.1 V, which was related to the extraction/insertion of Li+ from the 8a sites of the spinel structure and the oxidation/reduction of the redox couple Mn3+/Mn4+. These peaks matched the voltage plateau (Figure 5a,c,e). The activation peak of the layered phase at ~4.5 V for the first charging was absent because there were fewer layered phase components in the composite. However, the activation of the layered phase was evident by the peak at ∼3 V that stemmed from the reduction reaction of Mn4+ to Mn3+ [26]. The last peak at ~2.2 V in the three cathodes was attributed to the reduction of Mn3+ and the rearrangement of the structure. This peak disappeared in the next cycles of the S600 and S700 cathodes, whereas it was still observed in the S500 cathode. The capacity contribution in the 4 V region originated from the anion redox couple because of the disordering in the structure synthesized at low temperatures for the S500 and S600 samples. By contrast, for the S700 cathode, the capacity in the 4 V region decreased because of the higher crystallinity and ordering.
Figure 6 depicts the performance of the three cathodes with different C-rates. Their rate capabilities are depicted in Figure 6a. As can be seen, S500 exhibited the smallest particle size; thus, its capacity was slightly higher than that of S600 at a high C-rate. Moreover, the S500 exhibited an anatase phase of TiO2, demonstrating remarkable electrochemical properties in comparison to the rutile phase. The S700 cathode exhibited the highest performance at all C-rates. The lowest impurity phase, intermediate particle size, and contribution of the layered phase could be the reason for this behavior. In particular, the S700 cathode delivered the highest capacities of 222, 212, 196, 180, 162, 124, and 85 mAh g−1 at C/10, C/5, C/2, 1C, 2C, 5C, and 10C, respectively. The S700 cathode exhibited a capacity that was 141% higher than those of S500 and S600 at 5C.
The cycling stability of the cathodes in the voltage range of 2.0–4.8 V at 1C is depicted in Figure 6b (all cathodes were activated at C/10 for three cycles). Similar to rate capability, the capacities of the cathodes decreased in the following sequence: S700 > S500 > S600. The values were 170, 135, and 130 mAh g−1 at the 20th cycle for S700, S600, and S500, respectively. The capacity of the S700 cathode was superior (13% higher) in comparison to that for LiMnTiO4 reported in the literature [6]. The higher capacity of the S700 cathode is explained by the absent impurity phase and the highest Mn3+ content, which improves conductivity. The capacity retention values for S500, S600, and S700 after 100 cycles were 82%, 84.02%, and 90.6%, respectively. The poor cycling stability of S500 may be caused by the small particle size, facilitating the decomposition of the electrolyte, or due to impurities and poor crystallinity. For S700, the inherent property of the layered phase that transformed into the spinel phase during cycling was the main reason for the capacity loss. However, the layered phase could be stabilized to the spinel phase at low voltages, resulting in an improvement in cycling stability. The CE values of all samples were close to 100%, exhibiting insignificant energy loss during the charge and discharge processes.
The electrochemical behavior of these cathodes was further investigated by EIS, as depicted in Figure 7. The Nyquist plots of the three cathodes depicted in Figure 7b include two parts, representing two features. The charge-transfer resistance (Rct) is characterized by a semicircle in the medium-frequency region, whereas the Li+ diffusion through the cathode (Warburg diffusion) is characterized by a sloped line in the low-frequency region. The Rct values of S500, S600, and S700 were 49.86, 51.32, and 58 Ω, respectively. A lower value of Rct caused an increase in the capacity of the cathode. Additionally, the Li+ diffusion coefficients of the three cathodes, which are presented in Table S2, were 4.11 × 10⁻¹¹, 3.16 × 10⁻¹¹, and 1.66 × 10⁻¹¹ for S500, S600, and S700, respectively. S500 exhibited the highest Li+ diffusion coefficient and the lowest Rct; however, its capacity was lower than that of S700 because of the presence of a large impurity phase. The diffusion coefficient of S700 was higher than that of LiMn2O4 reported in the literature [27] due to the effects of the layered phase.

4. Conclusions

The low-cost spinel-layered cathode material 0.8LiMnTiO4•0.2Li2Mn0.5Ti0.5O4 was successfully synthesized by a sol–gel method. The effects of synthesis temperature on the electrochemical properties of the cathodes were investigated. Based on XRD and Rietveld refinement analysis, the synthesis temperature not only affected the impurity phase of TiO2, but also affected the ratio and composition of the spinel and layered phases. Moreover, the XPS analysis confirmed the existence of Mn4+, Mn3+, and Ti4+ in the three samples and a decrease in Mn4+ content when increasing the synthesis temperature. Consequently, it affected the electrochemical behavior. The optimized sample, which was synthesized at 700 °C, could deliver a high capacity of 222 and 170 mAh g−1 at C/10 and 1C, respectively. The capacity retention was 90.5% after 100 cycles. Understanding the relationship between synthesis temperature and the structure of this system can contribute to the development of inexpensive and non-toxic cathode materials for LIBs.

Supplementary Materials

The following are available online at https://www.mdpi.com/1996-1073/13/11/2962/s1, Figure S1: Particle size distribution extracted from SEM images of (a) S500, (b) S600, and (c) S700; Figure S2: XPS spectra of Mn 2p3/2 with signal deconvolution and assignment to the indicated ions of S500, S600, and S700; Table S1: Atomic coordinates and atomic occupancies of S500, S600, and S700 extracted from the Rietveld refinement using X-ray powder diffraction; Table S2: Warburg factor and diffusion coefficient of S500, S600, and S700.

Author Contributions

N.H.V., V.-D.D. and W.B.I. conceived and designed the experiments; N.H.V. and H.T.H. performed the experiments. N.H.V., V.-D.D. and W.B.I. analyzed the experimental data and wrote the paper. All authors have read and agreed to the published version of the manuscript.

Funding

This research is funded by the Vietnam National Foundation for Science and Technology Development (NAFOSTED) under grant number 103.02-2019.26.

Conflicts of Interest

The authors declare no conflict of interest.

References

  1. Krins, N.; Hatert, F.; Traina, K.; Dusoulier, L.; Molenberg, I.; Fagnard, J.F.; Vanderbemden, P.; Rulmont, A.; Cloots, R.; Vertruyen, B. LiMn2−xTixO4 spinel-type compounds (x ≤ 1): Structural, electrical and magnetic properties. Solid State Ion. 2006, 177, 1033–1040. [Google Scholar] [CrossRef] [Green Version]
  2. Lee, Y.-S.; Yoshio, M. Unique Aluminum Effect of LiAlxMn2−xO 4 Material in the 3 V Region. Electrochem. Solid-State Lett. 2001, 4, A85–A88. [Google Scholar] [CrossRef]
  3. Kim, J.H.; Myung, S.T.; Sun, Y.K. Molten salt synthesis of LiNi0.5Mn1.5O4 spinel for 5 V class cathode material of Li-ion secondary battery. Electrochim. Acta 2004, 49, 219–227. [Google Scholar] [CrossRef]
  4. Gao, Y.; Dahn, J.R. Synthesis and Characterization of Li1 + xMn2 − x O4 for Li-Ion Battery Applications. J. Electrochem. Soc. 1996, 143, 100–114. [Google Scholar] [CrossRef]
  5. Liu, Q.; Wang, S.; Tan, H.; Yang, Z.; Zeng, J. Preparation and Doping Mode of Doped LiMn2O4 for Li-Ion Batteries. Energies 2013, 6, 1718–1730. [Google Scholar] [CrossRef]
  6. Wang, S.; Yang, J.; Wu, X.; Li, Y.; Gong, Z.; Wen, W.; Lin, M.; Yang, J.; Yang, Y. Toward high capacity and stable manganese-spinel electrode materials: A case study of Ti-substituted system. J. Power Sources 2014, 245, 570–578. [Google Scholar] [CrossRef]
  7. Arillo, M.Á.; López, M.L.; Pico, C.; Veiga, M.L. Structural, thermal and magnetic properties of LiMnTiO4 spinel in different atmospheres. Solid State Sci. 2008, 10, 1612–1619. [Google Scholar] [CrossRef]
  8. Chen, R.; Knapp, M.; Yavuz, M.; Heinzmann, R.; Wang, D.; Ren, S.; Trouillet, V.; Lebedkin, S.; Doyle, S.; Hahn, H.; et al. Reversible Li+ Storage in a LiMnTiO4 Spinel and Its Structural Transition Mechanisms. J. Phys. Chem. C 2014, 118, 12608–12616. [Google Scholar] [CrossRef]
  9. Vu, N.H.; Arunkumar, P.; Im, W.B. High-performance spinel-rich Li1.5MnTiO4+δ ultralong nanofibers as cathode materials for Li-ion batteries. Sci. Rep. 2017, 7, 45579. [Google Scholar] [CrossRef]
  10. Vu, N.H.; Arunkumar, P.; Im, J.C.; Ngo, D.T.; Le, H.T.T.; Park, C.-J.; Im, W.B. Effect of synthesis temperature on the structural defects of integrated spinel-layered Li1.2Mn0.75Ni0.25O2+δ: A strategy to develop high-capacity cathode materials for Li-ion batteries. J. Mater. Chem. A 2017, 5, 15730–15742. [Google Scholar] [CrossRef]
  11. Vu, N.H.; Arunkumar, P.; Im, J.C.; Im, W.B. High capacity spinel@layered Li1.5MnTiO4+δ as thermally stable core-shell-driven cathode materials for lithium-ion batteries. J. Alloys Compd. 2017, 704, 459–468. [Google Scholar] [CrossRef]
  12. Vu, N.H.; Unithrattil, S.; Hoang, V.H.; Chun, S.; Im, W.B. Template-engaged synthesis of spinel-layered Li1.5MnTiO4+δ nanorods as a cathode material for Li-ion batteries. J. Power Sources 2017, 355, 134–139. [Google Scholar] [CrossRef]
  13. Zhang, X.; Yang, M.; Zhao, X.; Wang, Y.; Wang, M.; Ma, L. The spinel phase LiMnTiO4 as a potential cathode for rechargeable lithium ion batteries. J. Mater. Sci. Mater. Electron. 2015, 26, 6366–6372. [Google Scholar] [CrossRef]
  14. Larson, A.C.; Von Dreele, R.B. General Structure Analysis System (GSAS); Los Alamos National Laboratory Report LAUR; Los Almos National Laboratory: Los Almos, NM, USA, 1994; pp. 86–748. [Google Scholar]
  15. Sathiyaraj, K.; Bhuvaneswari, G.D.; Kalaiselvi, N.; Peter, A.J. H2O2-Aided One-Pot Hydrothermal Synthesis of Nanocrystalline LiMn2O4 Cathode for Lithium Batteries. IEEE Trans. Nanotechnol. 2012, 11, 314–320. [Google Scholar] [CrossRef]
  16. Fujimoto, D.; Lei, Y.; Huang, Z.-H.; Kang, F.; Kawamura, J. Synthesis and Electrochemical Performance of LiMnPO4 by Hydrothermal Method. Int. J. Electrochem. 2014, 2014, 768912. [Google Scholar] [CrossRef]
  17. Im, J.C.; Vu, N.H.; Tran Huu, H.; Lee, D.S.H.; Im, W.B. Effects of Fluorine Doping on Electrochemical Performance of Spinel-Layered Li3Mn3O7.5-xFx as Cathode Materials for Li-Ion Batteries. J. Electrochem. Soc. 2019, 166, A1568–A1573. [Google Scholar] [CrossRef]
  18. Song, D.; Ikuta, H.; Uchida, T.; Wakihara, M. The spinel phases LiAlyMn2−yO4 (y = 0, 1/12, 1/9, 1/6, 1/3) and Li(Al,M)1/6Mn11/6O4 (M = Cr, Co) as the cathode for rechargeable lithium batteries. Solid State Ion. 1999, 117, 151–156. [Google Scholar] [CrossRef]
  19. Fey, G.T.-K.; Lu, C.-Z.; Kumar, T.P. Preparation and electrochemical properties of high-voltage cathode materials, LiMyNi0.5−yMn1.5O4 (M = Fe, Cu, Al, Mg; y = 0.0–0.4). J. Power Sources 2003, 115, 332–345. [Google Scholar] [CrossRef]
  20. Xiao, L.; Zhao, Y.; Yang, Y.; Cao, Y.; Ai, X.; Yang, H. Enhanced electrochemical stability of Al-doped LiMn2O4 synthesized by a polymer-pyrolysis method. Electrochim. Acta 2008, 54, 545–550. [Google Scholar] [CrossRef]
  21. Xiong, L.; Xu, Y.; Tao, T.; Goodenough, J.B. Synthesis and electrochemical characterization of multi-cations doped spinel LiMn2O4 used for lithium ion batteries. J. Power Sources 2012, 199, 214–219. [Google Scholar] [CrossRef]
  22. Hu, J.-P.; Sheng, H.; Deng, Q.; Ma, Q.; Liu, J.; Wu, X.-W.; Liu, J.-J.; Wu, Y.-P. High-Rate Layered Cathode of Lithium-Ion Batteries through Regulating Three-Dimensional Agglomerated Structure. Energies 2020, 13, 1602. [Google Scholar] [CrossRef] [Green Version]
  23. Fu, C.; Li, G.; Luo, D.; Zheng, J.; Li, L. Gel-combustion synthesis of Li1.2Mn0.4Co0.4O2 composites with a high capacity and superior rate capability for lithium-ion batteries. J. Mater. Chem. A 2014, 2, 1471–1483. [Google Scholar] [CrossRef]
  24. He, X.; Xu, X.; Wang, L.; Du, C.; Cheng, X.; Zuo, P.; Ma, Y.; Yin, G. Enhanced Electrochemical Performance of LiNi0.8Co0.15Al0.05O2 Cathode Material via Li2TiO3 Nanoparticles Coating. J. Electrochem. Soc. 2019, 166, A143–A150. [Google Scholar] [CrossRef]
  25. Lee, J.; Seo, D.-H.; Balasubramanian, M.; Twu, N.; Li, X.; Ceder, G. A new class of high capacity cation-disordered oxides for rechargeable lithium batteries: Li-Ni-Ti-Mo oxides. Energy Environ. Sci. 2015, 8, 3255–3265. [Google Scholar] [CrossRef] [Green Version]
  26. Rozier, P.; Tarascon, J.M. Review—Li-Rich Layered Oxide Cathodes for Next-Generation Li-Ion Batteries: Chances and Challenges. J. Electrochem. Soc. 2015, 162, A2490–A2499. [Google Scholar] [CrossRef]
  27. Normakhmedov, O.O.; Brylev, O.A.; Petukhov, D.I.; Kurilenko, K.A.; Kulova, T.L.; Tuseeva, E.K.; Skundin, A.M. Cryochemically Processed Li1+yMn1.95Ni0.025Co0.025O4 (y = 0, 0.1) Cathode Materials for Li-Ion Batteries. Materials 2018, 11, 1162. [Google Scholar] [CrossRef] [Green Version]
Figure 1. X-ray Rietveld refined patterns of S500, S600, and S700. The black dots represent the observed profiles; dark red (S500), blue (S600), and dark green (S700) lines represent the fitted profiles; and the profile differences are represented by the red lines. The standards marked with C2/c (PDF#33-0831), Fd3m (PDF#35-0782), P42/mnm (PDF#21-1276), and I41/amd (PDF#21-1272) exhibit peaks corresponding to Li2MnO3, LiMn2O4, rutile TiO2, and anatase TiO2, respectively. The XRD pattern with enlarged Bragg angle ranges of 17.5–19.5° and 20–31° is depicted to compare the differences between the three samples. A, R, L, and S represent anatase, rutile, layered, and spinel, respectively.
Energies 13 02962 g001
Figure 2. SEM images of (a,b) S500, (c,d) S600, and (e,f) S700.
Energies 13 02962 g002
Figure 3. High-resolution transmission electron microscope (HRTEM) images of S700 with FFT of marked regions 1 and 2, showing the presence of the spinel phase and the layered phase. L and S indicate layered and spinel, respectively.
Energies 13 02962 g003
Figure 4. XPS spectra of (a) Mn 2p, (b) Mn 3s, and (c) Ti 2p for the S500, S600, and S700 samples.
Energies 13 02962 g004
Figure 5. Voltage profiles and corresponding dQ/dV plots of (a,b) S500, (c,d) S600, and (e,f) S700 at C/10 in the 2.0–4.8 V voltage window for the 1st, 2nd, and 5th cycles.
Energies 13 02962 g005
Figure 6. (a) Cycling stability curves at different C-rates and at (b) 1C for the S500, S600, and S700 samples.
Energies 13 02962 g006
Figure 7. (a) EIS and (b) real parts of the complex impedance versus ω1/2 for S500, S600, and S700 before cycling.
Energies 13 02962 g007
Table 1. Rietveld refinement and crystal data obtained from the XRD data.
Sample S500S600S700
Space Group
Fd3mPhaseLi1.15Mn1.05Ti0.8O4Li1.1Mn1.1Ti0.8O4LiMnTiO4
Phase content (%)507183
Lattice parameter (Å)8.2128.2478.264
C2/m (S500) or C2/c (S600 and S700)PhaseLi2Mn0.9Ti0.1O3Li2Mn0.5Ti0.5O3Li2Mn0.5Ti0.5O3
Phase content (%)322417
Lattice parameter (Å)a = 4.989
b = 8.647
c = 4.999
β = 109.49°
a = 4.850
b = 8.936
c = 9.776
β = 99.187°
a = 4.850
b = 8.936
c = 9.729
β = 99.187°
I41/amdPhaseTiO2 anatase
Phase content (%)1000
Lattice parameter (Å)a = b = 3.791
c = 9.466
P42/mnmPhaseTiO2 rutileTiO2 rutile
Phase content (%)850
Lattice parameter (Å)a = b = 4.610
c = 3.126
a = b = 4.629
c = 2.950
Fitting qualityRwp (%)
Rp (%)
χ2 (%)
5.34
3.99
4.91
5.43
4.04
3.55
6.49
4.61
2.95

