Abstract
Recently, as OLED displays are widely used in smartphones, their power management has become an important issue. Since OLED display devices show a large difference in power consumption depending on the colors used, proper color selection is important to reduce power consumption, but this may affect quality-of-experience (QoE) perceived by users. To address this tradeoff, this paper proposes a new power management scheme for graphical-user-interface (GUI) applications in OLED-based mobile devices. First, we examine the relationship between power consumption and color usage based on actual measurements and derive a model to express color preferences. Next, we present a dynamic programming algorithm that adaptively changes the color of the GUI objects in the applications to limit the total power consumption while effectively reflecting the color preferences of the user. The proposed scheme was implemented on a commercial smartphone, and real power measurements were conducted to examine whether it uses the given energy budget accurately under various color preference configurations. Experimental results show that color preferences significantly affect both power consumption and QoE, thereby demonstrating that personalized color selection plays an important role in reducing total power consumption of an OLED smartphone.
1. Introduction
Recent advances in mobile technology have enabled people to use their mobile devices such as smartphones and tablet PCs anytime, anywhere. Organic light-emitting diode (OLED) displays become widely used as their display devices because they have many advantages compared with liquid crystal display (LCD) displays such as wide viewing angles, high picture quality, thin form factor and so on [1].
Display is known to be one of the biggest energy consumers in mobile devices. Although OLED has no backlight, consuming relatively lower power than LCD with backlight, it still consumes a high proportion of power in mobile devices [1]. For example, it is known to account for as much as two-thirds of the power used by the device, which makes its effective power management essential. In addition, the tendency to use smartphones with large displays makes this power problem worse.
Each pixel in OLED is composed of light emitting diodes with three primary colors (red, green, and blue), and a combination of these colors allows the representation of a specific color. The amount of power consumed by the OLED display is then highly dependent on the intensity of these colors; thus, a pixel with white color with the highest intensity consumes the highest power, whereas that with black color consumes the lowest power [1,2]. Therefore, reducing their intensity is known as an effective way to reduce OLED power consumption and most of the OLED power management schemes were developed using this property. For example, some methods converted the colors of graphical user interface (GUI) objects with high power consumption to the color with low power consumption [2]; some other methods have shrunken bright areas in the display by using dimming techniques [3,4]; several methods made use of alpha blending techniques to reduce the brightness level [5]. However, these kinds of methods may degrade quality-of-experience (QoE) perceived by users.
Power capping for smartphones is an important issue for users as well as application developers. For users, if the remaining battery capacity is low, it is very necessary to minimize the consumed power and use it within the specified power limit. It is thus essential to develop application programs to run within its power budget, which requires exact power estimation depending on the application characteristics. What is more, in many cases, OLED power reduction may entail QoE degradation, and effective compromise of this tradeoff is mandatory.
Games are one of the most popular applications in smartphones and typically consist of several GUI objects. By changing the colors of the GUI objects to those with low power consumption, OLED power can be effectively reduced [2,6]. However, most of the previous works took no account of power capping issues and color preference. In particular, although QoE is highly dependent on the results of personalized color preference [7,8], to the best of our knowledge, there was no attempt that tackles this issue in terms of OLED power optimization.
This paper proposes a new power management scheme for GUI applications with multi-color objects in OLED-based mobile devices. To derive power model against GUI object colors, power was actually measured, while to take account of personal color preference, a color preference model is presented based on Euclidean distance in CIELAB color space. Based on the color preferences and power values of each GUI object, an optimization problem is formulated to reflect users’ color preference as much as possible subject to the power budget. Then, a dynamic programming algorithm is proposed to select the optimal color for each GUI object. To examine the effect of color preference on power consumption, we extensively evaluate our scheme in terms of power and color preference on a commercial smartphone.
2. Related Work
As OLED displays in smartphones are gaining popularity, many studies have been conducted to reduce their power consumption. For example, several color-conversion techniques have been presented using the relationship between color usage and OLED power consumption. Dong and Zhong [2] developed a web browser that allows color transformation based on a color-mapping table that reflects user preferences. To avoid high computational overhead on smartphones, this mapping table is constructed offline on a cloud server. Li et al. [6] developed an automatic way to rewrite a web application that produces energy-efficient web pages based on a program analysis of the structure of the web-application implementation. Linares-Vasquez et al. [9] also developed a color-conversion technique that generates color palettes using a multi-objective optimization technique. This technique produces color maps by optimizing the contrast while using consistent colors with respect to the original color palette. Chang et al. [10] presented an OLED power-saving scheme under scrolling operations for web browsers based on the generation of power-saving color-transformation maps for web pages. Most of the studies mentioned above, however, were developed specifically for web applications.
Some previous studies made use of partial dimming techniques in which a portion of the display is darkened to reduce power consumption. Tan et al. [3] proposed a technique that darkens relatively non-focused display areas to take account of user usage patterns. Chen et al. [4] presented a method for darkening the touched part by tracking the touch of the finger on the smartphone. Ginny et al. [11] proposed a dynamic local dimming scheme that dims the display region of non-critical application windows by making use of context switching information among applications. Lin et al. [12] developed an app called ShiftMask that enhances the display region of users’ interests, while dimming the remainder of the screen. To find the regions of interests, it kept track of visual attention, changes in view focus, screen scrolling, etc. Yeh et al. [13] presented a visual-attention-based pixel dimming technique to achieve power saving for real-time video playback. For this purpose, they extracted a motion vector from each frame to partially dim unnoticeable parts of the video frames.
Alternatively, some previous works have attempted to minimize image quality degradation during the process of color conversion. Li et al. [14] presented a scheme to change the display color of regions that are not classified as regions of interest by making use of edge-detection algorithms. Lin et al. [15] proposed a power saving scheme that minimizes image distortion incurred during the dimming process by analyzing humans’ focus of attention. Yan et al. [16] presented a scheme called ShutPix, which is a power-saving display system for OLED smartphones that can optimally shut off the redundant subpixels before the content is displayed. Pagliari et al. [17] focused on reducing overheads required for image quality enhancement during the process of color conversion, which is necessary for OLED power minimization.
Parameters used in video processing affect OLED power consumption. By exploiting this property, Lin et al. [15] adjusted the degree of brightness in GUI applications by reducing the brightness of display areas that are not attracting the interest of the user at a given moment. Chen et al. [18] developed a video-recording system called MORPh that optimizes the parameters of video clips during the video-recording phase to reduce OLED energy consumption in video playback. Park and Song [19] presented an alpha-blending scheme specifically for video playback, wherein the brightness factors are dynamically adjusted by considering QoE. Refresh rates in display systems also have a significant impact on OLED power consumption. Kim et al. [20] presented a scheme that optimally adjusts the refresh rates according to the content frame rate. This allows for the elimination of redundant display updates, thereby minimizing OLED power consumption.
A QoE metric is the result of personal preferences, which need to be reflected in power optimization. For example, Yan et al. [21] examined how the use of dynamic backlight scaling policies employed in LCD power optimization affects QoE and proposed the combination of different backlight scaling techniques. However, to the best of our knowledge, no OLED power management scheme has been reported that limits power consumption based on personal color preferences.
3. Basic Idea and System Model
3.1. Basic Idea
GUI applications are typically composed of multiple GUI objects, each with its own color. The amount of OLED power consumption can be effectively reduced by converting GUI colors to less power-consuming colors, but this may affect the QoE perceived by users. In particular, people have strong preferences concerning the perception of colors. Such preferences must be reflected for color selection [7,8]. For example, some users prefer dark colors over bright ones, leaving room for more power reduction without deteriorating the QoE. To address this tradeoff, the objective of this paper is to take account of such color preferences, subject to a prescribed energy budget, in GUI-based applications. Accordingly, our objectives can be concisely explained as follows:
- Color preference score modeling: each color is assumed to be associated with a score. The most preferred color may be found through a survey [7,8]. For example, users can be shown colors and be asked to rate their preferences for at an absolute score or they can be asked to indicate which of two simultaneously presented colors they prefer for each possible pair of colors in the sample. We assume that the most preferred color is known in advance. The color preference score for a specific color is then modeled by its relative color difference from the most preferred color. To express the color difference, we used the Euclidean distance model based on the CIE76 formula, one of the most famous color difference models [7,8]. We also used a 5-point scale metric that is commonly used to express QoE: the most preferred color is 5 points, and the color with the maximum difference from the most preferred color is 0 points, thereby following the ITU-T guidelines for QoE scores [22]. The minimum unit of score is set to 0.01.
- Power modeling: the color of the pixel in the screen determines the amount of power consumed by the OLED display [2]. Given that each smartphone has different OLED power characteristics depending on the color, we made real power measurements for various colors on a prescribed smartphone. We then derived the amount of power per pixel for each color.
- Problem formulation and algorithm development: the goal of our study is to accurately limit the power consumption while taking account of personal color preferences. For this purpose, we define an optimization problem through which the color of each GUI object is determined with the aim of maximizing the overall color preference score subject to a power limit. We then propose an optimal algorithm to solve such a problem using a dynamic programming technique.
3.2. Color Preference Model
Consider a GUI application with GUI objects and pixels (Table 1 summarizes the symbols used in this paper). Let be the number of colors that can be configured for each GUI object in the application. Let be the number of pixels for the i-th GUI object, ().

Table 1.
Important symbols used in this paper.
Assume that the background image in the GUI application is fixed. Then, the relative color preference score compared to the background image is expressed as a value between 0 (worst) and 5 (best) with a minimum unit of 0.01 [22]. We consider 29 colors with their corresponding indices as tabulated in Table 2. There are seven basic colors (i.e., red, green, blue, cyan, magenta, yellow, and white). Based on this, the intensity of each color is reduced to three levels from the original color that, in turn, reduces its brightness. For example, the intensity of red, , is (255,0,0) and then the three colors with reduced brightness are (191,0,0), (127,0,0), and (63,0,0) as shown in Table 2. A black color is also added to express the darkest color.
Table 2.
Color name, color intensity ratio from original color, RGB code, and power consumption per pixel.
We define the color preference score for the j-th color of the i-th GUI object as follows:
- We assume that the QoE score based on color preference for the j-th color of the i-th GUI object in the background image of the game is fixed. Then, the relative-color-preference score in comparison with the background image is expressed as a value between 0 (worst) and 5 (best) with a minimum unit of 0.01. These scores can be derived using a survey to reflect personalized preferences [7,8]. Let be the color preference score for color j compared to the background image.
- The color of large GUI objects has a greater impact on the user QoE than smaller objects. To reflect this, we calculate the score for the j-th color of the i-th GUI object as follows:
To derive the color difference, the CIE76 formula is typically used in which the color difference compared with the preferred color can be objectively calculated by using the Euclidean distance in the CIELAB color space [7,23]. We assume that the most preferred color is known a priori. Let be the index of the color that a particular user prefers the most for a specific background color image. The values of can then be calculated as follows:
- Suppose that respectively represents the values of (lightness, red/green, blue/yellow) for color j in the CIELAB color space. These values can be easily calculated from the intensity values of red, green, and blue, [7,19]. Based on the CIE76 formula, we can calculate the color difference, , between color j and m as follows [7,19]:
- Let be the index of the color that shows the maximum value of color difference compared with color . It can be expressed as follows:
- A color preference score of 0 is given to color , which represents the maximum color difference compared to the most preferred color. Accordingly, the color preference score for color j, can be calculated to derive the relative color difference as follows:In this equation, the value of is set to 5, the highest value on the 5-point scale which is widely used for the QoE score. Thus, the highest score of 5 is given to color , and the score decreases as the difference in color increases.
- Then, a color preference score of the j-th color of the i-th GUI object, can be easily derived using Equation (1).
A user survey may be required to find the most preferred color. There are various methods for the survey [7,8]. One simple method to derive the color index is to ask the user to score each color when the background image is fixed and then the color with the highest score can be selected as the most preferred color [8]. These kinds of methods typically takes a little time [7,8].
3.3. Oled Power Modeling
Each OLED-display device has its own power consumption characteristics depending on color, which is typically represented by red, green, and blue intensity values, denoted as , in an sRGB color space, where . To model OLED power consumption, we used a Monsoon power measurement tool [24] to measure the power consumed by the entire smartphone (Samsung Galaxy Note Edge) according to the following procedure:
- Power was measured when the entire display was filled with one of the 29 colors and black. Let be the full-screen power for the j-th color, .
- We then derived the power consumption per pixel for the j-th color, , by dividing by the total number of pixels in the screen, . The values of are described in Table 2.
- Let be the number of pixels of the i-th GUI object. Then, the power consumed by the object i for the j-th color, , can be calculated as follows:
Table 2 tabulates the power consumption per pixel for 29 different colors, from which the following conclusions can be drawn:
- As expected, for each basic color, the amount of power is reduced as the color intensity decreases.
- Power consumption varies notably depending on the color. For example, white requires 2.6 times higher power than green but consumes only 1.03 times more energy than cyan.
- The power consumption of each color can be sorted in an ascending order as follows: black, green, red, blue, yellow, magenta, cyan, and white. As expected, black consumes the least power, whereas white consumes the greatest power. Green and red are relatively power-efficient colors compared to magenta and cyan.
4. Color Selection Algorithm
4.1. Problem Formulation
Based on the color preferences and power model in the previous section, we here formulate an optimization problem that selects the color of each GUI object to maximize the overall color preference score while limiting the overall smartphone power consumption. Let be the selection parameter indicating that the -th color is selected for the i-th GUI object, . Then, the overall color preference score for all the GUI objects can be calculated as . The objective of the problem is to limit the smartphone power consumption by . We can then formulate the color selection problem that determines the value , for GUI object i, , as follows:
The is NP-hard because it may correspond to a multiple-choice knapsack problem [25]. In a multiple-choice knapsack problem, there is a limited-weight knapsack; each object has different items, each of which has a weight and a profit. This problem then determines the item of each object to be included into the knapsack to maximize the total profit of the objects in the knapsack, subject to the limited knapsack weight. The has a finite number of GUI objects that can be filled with one of the different colors, where each color j for each GUI object i also has and values. Then, the determines the color of each object to maximize the overall color preference score, subject to the power budget .
4.2. Color Selection Algorithm
Here, we present a dynamic-programming algorithm called color selection algorithm (CSA) that provides an optimal solution for the . The CSA basically builds a table that contains a tuple composed of a maximum color preference score and its color index for each GUI object i and power value, m, (here, the minimum unit of power value is set to 1 mW). Let be the maximum color preference score that can be achieved for the GUI objects from 1 to i when the power value is m, . It then uses a recurrence relationship between two consecutive GUI objects, i and , to find the values of , so as to fill the entire table. Given that represents the maximum color preference score, represents the optimal color preference score achieved over all the GUI objects when the power budget is .
The CSA also records the color index for each object i that achieves the maximum color preference score of so that the algorithm can find the values of after all the columns in the table are filled using recurrence. Let be the color index for object i that should be selected to produce the value of when the power value is m. Therefore, the CSA is composed of three phases, namely initialization, recurrence establishment, and color determination:
- Initialization: To fill the initial values for the entire table that stores tuples of (,), the values of , are all initialized to 0 and 1, respectively, . Next, for all the values of m, , the values of and for the first GUI object are initialized according to the following steps:
- (a)
- It first finds the color indices of the first object that satisfies .
- (b)
- Among these colors, the index of the color with the maximum value of can be chosen for .
- (c)
- is then set to .
- Recurrence establishment: In this phase, a recurrence relationship is established to find the values of from the second GUI object, . The recurrence relationship between and can be found as follows:
- (a)
- For all color indices of j, , the values of are calculated.
- (b)
- Then, the value, , is compared with the value of . Then, the value of is updated with the larger value between these two values.
- (c)
- can be then calculated as .
- Color determination: After completing the recurrence process, we can find the value of that contains the maximum color preference score achieved over all the GUI objects when the power is limited by . Given that contains the color index for the th GUI object to achieve the maximum color preference score, the value of is set to . Next, the backtracking phase starts to find the color indices of the previous GUI objects, from object to 1, step by step. For example, suppose that the backtracking step chooses as the color index of GUI object . Then, the color index of the i-th GUI object can be set to because the value of is allocated for the power of the GUI object . This backtracking step needs to be run until the color index of the first GUI object can be found.
Algorithm 1 shows the details of the algorithm including an initialization step (lines 2–14), a recurrence establishment step (lines 15–27), and a backtracking step (lines 28–33). The recurrence establishment step in turn includes nested “for" loops, which incur time complexity, , (lines 15–27). The algorithm builds a table that contains a tuple composed of (, ) for the GUI objects from 1 to i when the energy limit is m. The initialization step fills the table for the first GUI object (lines 8–14), and based on recurrence, it fills remaining columns, (lines 15–27) so that represents the optimal color preference score achieved for energy limit, . Since the color index, for each column is stored in the table, the color index of each GUI object can be found using a backtracking technique (lines 15–27).
| Algorithm 1 Color Selection Algorithm (CSA) |
|
4.3. Use of CSA Algorithm
Figure 1 shows two display images before and after the CSA is applied when . Table 3 shows the color and CIE color coordinate values selected for each GUI object, which indicates that the CSA aims at minimizing color differences.
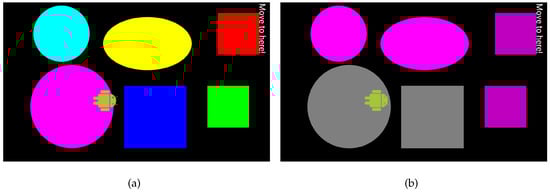
Figure 1.
Two sample display images before (a) and after (b) the CSA is applied.
Table 3.
Color combinations and CIE color coordinates before and after the CSA is applied for a sample image.
Some existing mobile applications have multi-color objects. Since our color preference model is mainly developed for single-color GUI objects, it cannot be applied directly to the multi-color objects. One way to extend this model to support multicolored objects is to divide each GUI object into multiple segments of a single color, so that each segment can be an individual object of a single color. Since the pixel-wise power value for each color is already available, the power values of the segments can be easily derived regardless of the shape of each segment.
5. Experimental Results
5.1. Experimental Environments
We developed a simple GUI application as shown in Figure 2a. The goal of the application is to find a specific GUI object by moving the icon object. The acceleration sensor data are used to detect this motion. One out of two colors (black or white) was used as a background color, which cannot be then used as the color of a GUI object. Six different GUI objects, each with different sizes, can be configured with up to 29 colors tabulated in Table 2.
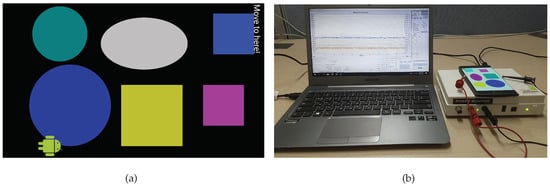
Figure 2.
(a) User interface of a simple GUI application used for the test. (b) Experimental environment to measure power consumption.
To verify the effectiveness of the proposed method, experiments were conducted on a Samsung Galaxy Note-edge smartphone equipped with an OLED display. A Monsoon digital multimeter [24] was used to measure the power consumed by the smartphone, as shown in Figure 2b. In the following subsections, we examine the efficacy of the proposed scheme in terms of the following three aspects: (1) power comparison depending on the color preferences, (2) overall color preference score comparison, and (3) effectiveness of the power capping algorithm, i.e., CSA.
Suppose that a particular user prefers one among seven basic colors (red, green, blue, cyan, magenta, yellow, and black or white) in Table 2. Let and respectively be the maximum and minimum power that can be consumed by the color selection of each GUI object for each background color. For example, if the background color is white, is used when all objects are cyan, whereas power is used when all objects are black, because the cyan color consumes the greatest power whereas black consumes the least, as described in Table 2. We then introduce a new variable, , to effectively represent the power limit value, , as follows:
so that increases with .
5.2. Power Comparison against Color Preferences
We first examined how the values of and the most preferred color affect total power consumption of an OLED smartphone when the aforementioned simple GUI application is running. The results are shown in Figure 3. The most preferred color is chosen from seven basic colors (red, green, blue, cyan, magenta, yellow, and black or white). Table 4 and Table 5 tabulate the color combinations selected for each object for different values of when white and black were selected as background colors, respectively.
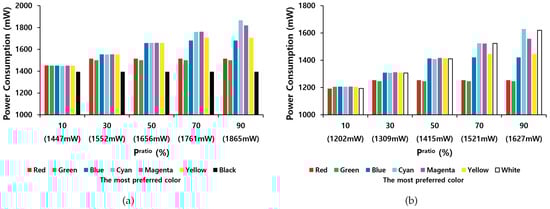
Figure 3.
Total power consumption of an OLED smartphone as a function of values of when the background color is white (a) or black (b).
Table 4.
Combinations of the selected color for each object for different values of according to the most preferred color when the background color is white.
Table 5.
Combinations of selected color for each object depending on different values of according to the most preferred color when the background color is black.
- The total power consumption of an OLED smartphone increases with the value of , but it gradually tails off.
- A white background consumes more power than a black background.
- If black is the most preferred color, black is always selected for the color of each object, so the OLED smartphone consumes the same system-wide power regardless of the value of . Similarly, if the most preferred color consumes low power per pixel, the preferred color is usually chosen even at low values of . For example, when the most preferred color is red, green, or blue, these colors or their dark versions are usually chosen regardless of , as tabulated in Table 4 and Table 5.
- The difference in total power consumption of an OLED smartphone between colors tends to be high at higher values of . However, as decreases, this power gap narrows. For example, when is 90% and the background color is white, if the most preferred color is cyan, 1865 mW is consumed, but if the most preferred color is red, 1514 mW is consumed. By contrast, when is 10%, if the most preferred color is cyan, 1447 mW is consumed, but if the most preferred color is red, 1442 mW is consumed. The CSA attempts to select colors with as little difference as possible compared to color . Therefore, if the most preferred color already consumes small power, the actual power consumption is low, even at high values of . However, if the most preferred color consumes high power, the colors of high power consumption are usually selected to increase the overall color preference score.
- Brightness of colors also affects power consumption. When is low, dark colors with low color intensity tend to be selected as described in Table 4 and Table 5. For example, when , 19% of colors are set at 25% color intensity whereas 85.7% of colors are set at 75% intensity or below compared to the original basic colors.
5.3. Overall Color Preference Score Comparison
Figure 4 shows overall color preference scores when one out of seven basic colors was chosen as the most preferred color when the background color is white or black. The following observations can be drawn:
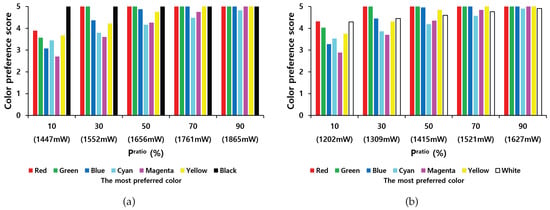
Figure 4.
Overall color preference score as a function of values of when the background color is white (a) or black (b).
- As expected, the overall score increases with . For example, when the background is white, on average, the score is 3.62 when and 4.97 when .
- The most preferred color considerably affects the scores. For example, when the background is white, if the most preferred color is black, then the score is always 5 because black, which is the color achieving the lowest power consumption, is always chosen. However, if the most preferred color is magenta, the score can be decreased to 2.71, and if the most preferred color is cyan, the score can be decreased to 3.45.
- The worst scores for each preferred color range between 2.71 and 5 when the background is white and between 2.89 and 5 when the background is black. The worst score is not considered low (it exceeds 2.71 even when ) because the CSA algorithm attempts to find the optimal color configuration to meet the power limit.
- If the most preferred color is white when the background is black, then a darker version of white (gray) is usually chosen, thereby indicating a score higher than 4 because the Euclidean color difference between white and gray is not high, rendering high scores. This also argues when color preference score degradation is allowed by less than 10%, the proposed method can reduce the total power consumption by 16.1% as described in previous section.
5.4. Effectiveness of Power Capping
We performed real power measurements to evaluate how accurately the CSA algorithm predicts the power consumption. Table 6 and Table 7 tabulate the percentage difference (minimum, maximum, and average) between the predicted and actual power measured for different values of . From these tables, we point out the following observations:
Table 6.
Difference between predicted and real power for different values of when the background color is white (%).
Table 7.
Difference between predicted and real power for different values of when the background color is black (%).
- If the background color is white, the largest difference between expected and actual power was 2.55% whereas the smallest difference was 0.91%, but for the black background color, they are 4.33% and 0.15%, respectively.
- The difference between real and predicted power consumption is not affected by the values of .
- The maximum average difference is 2.15%, which indicates that the power model is accurate. This can be effectively used for power capping of smartphones.
5.5. Comparison Results with a Brightness Reduction Scheme
Power can be reduced by lowering the brightness on the OLED smartphone; however, this may result in QoE degradation because personal color preference is not taken into account. To verify this, we consider two GUI object configurations when the black color is chosen for the background with the following (object number, color) pairs:
- GUI configuration 1: ((1, Yellow (100%)), (2, Cyan (100%)), (3, Red (100%)), (4, Green (100%)), (5, Blue (100%)), (6, White (100%)))
- GUI configuration 2: ((1, Red (100%)), (2, Green (100%)), (3, Blue (100%)), (4, Cyan (100%)), (5, Magenta (100%)), (6, Yellow (100%)))
The color intensity determines the brightness level of the OLED display, so the brightness reduction (BR) method uniformly reduces the color intensity to 25%, 50% and 75%. The power and color preference scores were then calculated for each brightness level.
Table 8 and Table 9 show the color preference scores for the CSA and BR schemes for GUI configurations 1 and 2, respectively when was set to the power value obtained at each brightness level. The BR scheme can also reduce total power consumption by lowering the brightness level, but the overall preference score is significantly reduced compared to CSA. For example, when the same power is consumed, the proposed technique has a color preference score of 23% to 66% higher than the BR scheme because it takes into account personal color preferences.
Table 8.
Overall color preference score comparison between CSA and BR schemes for GUI color configuration 1.
Table 9.
Overall color preference score comparison between CSA and BR schemes for GUI color configuration 2.
5.6. Effects of Color Difference Model
To calculate the color difference in our color preference model, we used the CIE76 formula, the most widely used model [7,23]. We applied another color difference model based on the CIEDE2000 formula [26,27] to examine the effect of the color difference model on the score. The proposed algorithm, CSA, can be used for any kind of color difference model by modifying the value of to match the model.
To examine the effect of this perceptual uniformity, the results produced by the CIEDE2000 and CIE76 formulas were compared when the same algorithm, CSA is used. Table 10 and Table 11 tabulate the difference values of color preference score and power between them when the background colors are white and black, respectively. There is no color preference score difference for 54.3% of the total case, which shows that the two color distance models mostly give similar results. However, the maximum color preference score difference is 0.7, when the most preferred color is magenta and is 10%.
Table 10.
The difference in color preference score and power percentage difference by applying CIEDE76 formula and CIEDE2000 formula to calculate color distance for different values of according to the most preferred color when the background color is white.
Table 11.
The difference in color preference score and power percentage difference by applying CIEDE76 formula and CIEDE2000 formula to calculate color distance for different values of according to the most preferred color when the background color is black.
The color distance model may affect power consumption, but its impact is almost negligible. For example, the maximum percentage difference of indicates only 1.13%, and the selected colors of both models are the same for 63% of the whole case.
6. Conclusions
We proposed a method that considers the color preferences of the users to limit the power consumption of applications with multiple GUI objects. First, we developed a color preference model to derive a color preference score for each color based on a color difference model in the CIELAB color space and an OLED power model to derive the power consumption of each color based on real power measurements. A color selection problem was formulated to maximize the overall color preference score while limiting the power consumption of the smartphone, and a dynamic programming algorithm was presented to derive an optimal combination of colors for each GUI object.
Experimental results show that the CSA can reduce the total power consumption of an OLED smartphone by up to 27.3% when less than 10% in color preference score degradation is allowed. They also demonstrated that our scheme is accurate in terms of power limitations, achieving a maximum average difference of 2.15% compared to real measurements. The scheme can also maximize the overall color preference score by choosing the colors that achieve the highest score at the lowest power consumption. As our future works, we plan to apply machine learning techniques to derive a color preference model based on measured preference data.
Author Contributions
Conceptualization, M.S. and Y.L.; methodology, M.S. and Y.L.; software, Y.L.; supervision, M.S.; validation, M.S. and Y.L.; writing-original draft, M.S. and Y.L.; Writing-review and editing, M.S.; All authors have read and agreed to the published version of the manuscript.
Funding
This work was supported by INHA UNIVERSITY Research Grant.
Conflicts of Interest
The authors declare no conflict of interest.
References
- Chen, X.; Chen, Y.; Ma, Z.; Fernandes, F. How is energy consumed in smartphone display applications? In Proceedings of the ACM Workshop on Mobile Computing Systems and Applications, San Diego, CA, USA, 28–29 February 2013. [Google Scholar]
- Dong, M.; Zhong, L. Chameleon: A color-adaptive web browser for mobile OLED displays. IEEE Trans. Mob. Comput. 2012, 11, 724–738. [Google Scholar] [CrossRef]
- Tan, K.; Okoshi, T.; Misra, A.; Balan, R. Focus: A usable & effective approach to OLED display power management. In Proceedings of the ACM International Joint Conference on Pervasive and Ubiquitous Computing, Zurich, Switzerland, 8–12 September 2013; pp. 573–582. [Google Scholar]
- Chen, X.; Nixon, K.; Zhou, H.; Liu, Y.; Chen, Y. FingerShadow: An OLED power optimization based on smartphone touch interations. In Proceedings of the ACM Workshop on Power-Aware Computing and Systems, Portland, OR, USA, 20–24 October 2014; pp. 1–6. [Google Scholar]
- Tan, T.; Balan, R. Adaptive display power management for OLED displays. In Proceedings of the ACM Workshop on Mobile Gaming, Helsinki, Finland, 13 August 2012; pp. 25–30. [Google Scholar]
- Li, D.; Tran, A.; Halfond, W. Making web applications more energy efficient for OLED smartphones. In Proceedings of the ACM International Conference on Software Engineering, Hyderabad, India, 31 May–7 June 2014; pp. 527–538. [Google Scholar]
- Palmer, S.; Schloss, K. Color preference. Encycl. Color Sci. Technol. 2015, 11, 1–7. [Google Scholar]
- Palmer, S.; Schloss, K. An ecological valence theory of human color preferences. Proc. Natl. Acad. Sci. USA 2010, 107, 8877–8882. [Google Scholar] [CrossRef] [PubMed]
- Linares-Vasquez, M.; Bayota, G.; Cardenas, C.; Oliveto, R.; Penta, M.; Poshyvanyk, D. Optimizing energy consumption of GUIs in Android apps: A multi-objective approach. In Proceedings of the ACM Joint Meeting on Foundations of Software Engineering, Lincoln, NE, USA, 9–13 Sepember 2015; pp. 143–154. [Google Scholar]
- Chang, H.; Yang, Y.; Yu, L.; Lin, C. FLASH: Content-based Power-saving Design for Scrolling Operations in. Browser Applications on Mobile OLED Devices. In Proceedings of the ACM/IEEE International Symposium on Low Power Electronics and Design, La Jolla, CA, USA, 11 August 2019; pp. 1–6. [Google Scholar]
- Singh, G.; Rohit, M.; Kumar, C.; Naik, K. MultiDroid: An energy optimization technique for multi-window operations on OLED smartphones. IEEE Access 2018, 6, 31983–31995. [Google Scholar] [CrossRef]
- Lin, H.; Hsiu, P.; Kuo, T. ShiftMask: Dynamic OLED power shifting based on visual acuity for interactive mobile applications. In Proceedings of the IEEE/ACM International Symposium on Low Power Electronics and Design, Fukuoka, Japan, 1–3 July 2011; pp. 1–6. [Google Scholar]
- Yeh, C.; Lo, K.; Lin, W. Visual Attention Based Pixel Dimming Technique for OLED Display on Mobile Devices. IEEE Trans. Ind. Electron. 2019, 66, 7159–7167. [Google Scholar] [CrossRef]
- Li, D.; Guo, B.; Shen, Y.; Li, J.; Huang, Y. Make image more energy efficient for mobile OLED displays. In Proceedings of the IEEE International Conference on Embedded Software and Systems, Austin, TX, USA, 10–12 August 2016; pp. 143–147. [Google Scholar]
- Lin, C.; Kang, C.; Hsiu, P. Catch your attention: Quality-retaining power saving on mobile OLED displays. In Proceedings of the ACM/EDAC/IEEE Design Automation Conference, San Francisco, CA, USA, 1–5 June 2014; pp. 1–6. [Google Scholar]
- Yan, Z.; Chen, C. Too many pixels to perceive: Subpixel shutoff for display energy reduction on OLED smartphones. In Proceedings of the ACM International Conference on Multimedia, Mountain View, CA, USA, 23–27 October 2017; pp. 717–725. [Google Scholar]
- Pagliari, D.; Marcii, E.; Poncino, M. LAPSE: Low-overhead adaptive power saving and contrast enhancement for OLEDs. IEEE Trans. Image Process. 2018, 27, 4623–4637. [Google Scholar] [CrossRef] [PubMed]
- Chen, X.; Mao, J.; Gao, J.; Nixon, K.; Chen, Y. MORPh: Mobile OLED-friendly recording and playback system for low power video streaming. In Proceedings of the ACM/EDAC/IEEE Design Automation Conference, Austin, TX, USA, 5–9 June 2016; pp. 1–6. [Google Scholar]
- Park, M.; Song, M. Saving power in video playback on OLED displays by acceptable changes to perceived brightness. IEEE/OSA J. Disp. Technol. 2016, 12, 483–490. [Google Scholar] [CrossRef]
- Kim, D.; Jung, N.; Chon, Y.; Cha, H. Content-centric energy management of mobile displays. IEEE Trans. Mob. Comput. 2016, 15, 1925–1938. [Google Scholar] [CrossRef]
- Yan, Z.; Liu, Q.; Zhang, T.; Chen, C. Exploring QoE for power efficiency: A field study on mobile videos with LCD displays. In Proceedings of the ACM International Conference on Multimedia, Brisbane, Australia, 26–30 October 2015; pp. 431–440. [Google Scholar]
- ITU-R Recommendation BT.500. Methodology for the Subjective Assessment of the Quality of Television Pictures; ITU: Geneva, Switzerland, 2000. [Google Scholar]
- Dong, M.; Zhong, L. Power modeling and optimization for OLED displays. IEEE Trans. Mob. Comput. 2012, 11, 1587–1599. [Google Scholar] [CrossRef]
- Monsoon Solutions. Available online: https://www.msoon.com (accessed on 12 March 2020).
- Martello, S.; Toth, P. Knapsack Problems: Algorithms and Computer Implementations; J. Wiley & Sons: Hoboken, NJ, USA, 1990. [Google Scholar]
- Sharma, G.; Wu, W.; Dalal, E. The CIEDE2000 color-difference formula: Implementation notes, supplementary test data, and mathematical observations. Color Res. Appl. 2005, 30, 21–30. [Google Scholar] [CrossRef]
- Ferradans, S.; Bertalmio, M.; Provenzi, E.; Caselles, V. An analysis of visual adaptation and contrast perception for tone mapping. IEEE Trans. Pattern Anal. Mach. Intell. 2011, 33, 2002–2012. [Google Scholar] [CrossRef] [PubMed]


© 2020 by the authors. Licensee MDPI, Basel, Switzerland. This article is an open access article distributed under the terms and conditions of the Creative Commons Attribution (CC BY) license (http://creativecommons.org/licenses/by/4.0/).