Abstract
Water electrolysis with a fast change of polarity generates a high concentration of bulk nanobubbles containing H and O gases. When this concentration reaches a critical value, a microbubble pops up, which is terminated quickly in an explosion process. In this paper, we provide experimental information on the phenomenon concentrating on the dynamics of exploding microbubble observed from the top and from the side. An initial bubble with a size of m expands to a maximum size of m for s and then shrinks in the cavitation process. The sound produced by the event is coming from two sources separated in time: exploding bubble and cavitating bubble. The observed dynamics supports expansion of the bubble with steam but not with H and O mixture. A qualitative model of this puzzling phenomenon proposed earlier is refined. It is demonstrated that the pressure and temperature in the initial bubble can be evaluated using only the energy conservation law for which the driving energy is the energy of the combusted gas. The temperature in the bubble reaches 200 C that shows that the process cannot be ignited by standard combustion, but the surface-assisted spontaneous combustion agrees well with the observations and theoretical estimates. The pressure in the microbubble varies with the size of the merging nanobubbles and is evaluated as 10–20 bar. Large pressure difference between the bubble and liquid drives the bubble expansion, and is the source of the sound produced by the process. Exploding microbubbles are a promising principle to drive fast and strong micropumps for microfluidic and other applications.
1. Introduction
When water is decomposed electrochemically by normal DC electrolysis, hydrogen and oxygen gases are released on different electrodes in the form of well visible bubbles. On a timescale of ms gas bubbles with diameters of 10–1000 m were observed [1,2]. The current density in this process [3] is typically not larger than A/cm and the relative supersaturation [4] does not exceed 100. These limiting parameters are reached when a significant part of the electrode surface is covered with bubbles preventing further current increase [3,5,6]. Screening of a nanoelectrode surface with a single nanobubble was observed recently [7] as a clear manifestation of this effect.
In contrast with the DC electrolysis, the alternating polarity (AP) process demonstrates essentially different behavior [8]. If the polarity of electrodes is switched sufficiently quickly (with frequency ∼kHz), the Faraday current density can be as high as A/cm and the relative supersaturation in a thin layer above the electrodes is estimated as ∼1000. Despite the high current and supersaturation, no visible bubbles are observed. Apparent gas disappearance was explained by formation of very small bubbles [9], which do not scatter visible light. The size of these bubbles was measured with the dynamic light scattering [10] as 60–80 nm. Due to small size, the Laplace pressure in these nanobubbles (NBs) is high (about bar), which results in a large effective supersaturation.
Nanobubbles have been actively investigated in the last 20 years [11,12,13] because of their exceptional stability. However, the main interest is directed to surface NBs existing at the solid–liquid interface. Bulk NBs, which are relevant to this paper, are investigated much less. They have been produced mechanically [14,15], by DC electrolysis [16], or by ethanol–water exchange [17]. They have been observed by scanning electron microscopy from freezefracture replicas [14], by phase microscopy and polarimetric scatterometry [18], or using a new NanoSight instrument [17,19]. Modeling of these tiny objects has been undertaken [20]. Investigation of individual bulk NBs is complicated by their small size and absence of fixed positions.
On the other hand, the AP electrolysis generates so many NBs that one can easily observe collective effects produced by them. Liquid enriched with NBs changes the refractive index around the electrodes that can be observed by shading techniques [10] or even by direct observation of optical distortion [21]. The latter method allows estimation of the concentration of NBs [22] that can be as high as ∼m. When this concentration is reached, the NBs are nearly touching each other and the medium is rather a nanofoam than a liquid.
If one increases further the amplitude of AP pulses, an interesting phenomenon occurs [23]. In the medium, a microbubble (MB) pops up with an initial size of about m; in s, it grows to a size of m and disappears completely in s. The event is accompanied by an audible click and for continuous application of the electrical pulses the clicks are repeated nearly periodically in ms. Qualitative interpretation of the phenomena includes merging of close-packed NBs with formation of an initial MB containing stoichiometric mixture of H and O gases. In this mixture, the combustion reaction is ignited spontaneously, presumably via the surface-assisted mechanism [24,25] responsible for ignition of gases in NBs. The process releases significant energy, part of which is radiated as sound.
Spontaneous combustion of H and O gases in NBs was proposed to explain gas disappearance in the AP electrochemical process [9]. It was demonstrated that one can use this effect as a driving principle for a fast and strong microactuator [26] to drive microfluidic and other microdevices in autonomous regime. However, according to the classical theory combustion in small volumes has to quench due to fast heat escape [27,28]. To explain combustion in NBs, a surface-assisted mechanism has been proposed [24] that includes as a key element dissociation of H molecules on charged centers on the gas–liquid interface. The nature of these centers is not quite clear, but the existence of the surface-assisted dissociation explains well low-temperature character of the observed combustion in NBs. This conclusion was independently confirmed by molecular dynamics calculations [25].
In this paper, we provide experimental information on the dynamics of exploding microbubbles and propose a model that gives not only qualitative understanding of the effect but is able to estimate pressure and temperature in the bubble immediately after the combustion reaction.
2. Experiment
2.1. Materials and Methods
In contrast with the first observation of exploding MBs [23], we used the samples with circular electrodes fabricated on Si substrates. Instead of a thick copper layer, the electrodes were made of thin film titanium. It makes explosions more stable and more powerful; the sound produced by the explosions is more pronounced. These electrodes demonstrated the best durability for the AP process [26], which is especially important for microdevices using AP electrolysis. Several other materials such as Pt, Au, W, Cu, and Fe have been investigated as thin film electrodes. However, all the tested materials were not able to withstand a high overpotential with fast changing polarity during a reasonably long time. The electrode disintegrated on the time scale specific for each material. At the moment, Ti demonstrated the best stability, but, possibly, there are other options, for example, stainless steel [29].
The electrodes were fabricated on an oxidized silicon wafer and consisted of two metal layers deposited by magnetron sputtering. The bottom layer was m thick Al. It was necessary to reduce the resistance of the contact lines. The working layer was m thick Ti. The electrodes were patterned by UV lithography and wet etching of Ti and Al. The connecting lines were insulated by an m SU-8 photoresist layer. Fabricated electrodes are shown in Figure 1a. The outer diameter of the structure was m.
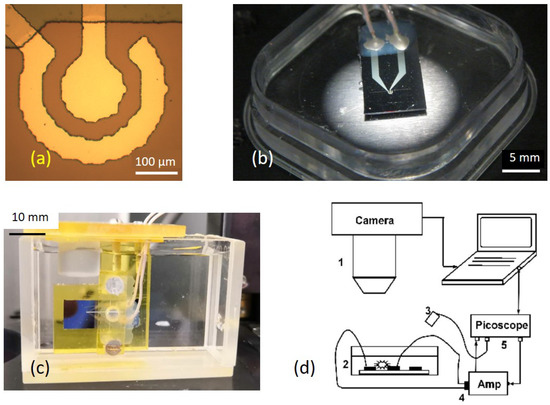
Figure 1.
(a) Optical image of the electrodes, top view. The contact lines are covered by the SU-8 layer. (b) Petri dish with a sample inside. It is used to observe the process from the top. (c) Cuvette filled with the electrolyte, where the sample is installed vertically, to observe the process from the side. (d) Scheme of the setup: 1 is the fast camera, 2 is the Petri dish filled with the electrolyte with a sample inside, 3 is the microphone, 4 is the amplifier, and 5 is the Picoscope.
After fabrication the wafer was divided into samples with a size of mm. Wires were attached to the contact pads by conductive epoxy, and the joints were insulated with silicone sealant. The sample was fixed on the bottom of a Petri dish (see Figure 1b) or in a specially made transparent cuvette (see Figure 1c) filled with an electrolyte. The electrolyte was a molar solution of sodium sulfate (NaSO) in distilled water.
To produce an explosion, series of square voltage pulses of positive and negative polarity were applied to the working electrode while the other one was grounded. The frequency of the pulses could be as high as kHz. High frequency of pulses ≳kHz is a distinctive feature of the AP process that guarantees generation of only nanobubbles. The highest frequency is preferable since it minimizes damage of the electrodes. The upper limit was restricted by electronics and for this reason it is not known if the process itself limits the highest frequency. The driving signal was provided by a homemade PC-controlled signal generator (for details, see [26]). The voltage and current flowing through the electrodes were recorded by a PicoScope 5000. The square voltage pulses are the best choice to drive the process since only high overpotential is able to generate high density of nanobubbles needed for explosions. Sinusoidal pulses can also produce the explosions, but with less efficiency because part of the time the potential is not sufficiently high.
Fast dynamics of the microbubbles was observed with a high speed camera Photron FASTCAM 1024PCI. The camera was triggered synchronously with the driving pulses. The sound produced by the explosion was recorded at different distances from the sound source by a microphone synchronously with the current.
2.2. Results
If single polarity pulses are applied to the working electrode, water decomposition stops very quickly because the anode is coved by a continuous layer of titanium oxide. For alternating polarity pulses, the process proceeds with a high current and the gases (H and O) are produced. The gases are collected in the solution in the form of nanobubbles with a size of 60–80 nm [10]. When the voltage amplitude becomes larger than V, one can hear distinctive clicks. The process driven by the pulses with the amplitude V and frequency kHz was recorded at a frame rate of 23 fps (see Video S1). The video shows series of explosions accompanied by clicking sounds. The frame rate is too low to resolve the exploding bubbles. For that, we used the fast camera at a frame rate of 10,000. The events were observed from the top and from the side. In the latter case, the special cuvette shown in Figure 1c was used, where the sample was positioned vertically. Six successive images of the exploding bubble are shown in Figure 2 for both top and side views (for full video, see Videos S2 and S3). From these images, one can see that a bubble grows above the electrodes, reaches a maximum size of ∼mm, and then shrinks. Only Image 3 is looking more or less contrast because the process develops too quickly even for 10,000 fps. The first images in both columns were made just before the explosion. In the left image, one can notice a dark halo near the central electrode. This is the area where the concentration of NBs is especially high. The lateral size of the area is of about m; it is nearly invisible above well reflecting metal. In comparison with the explosion, the halo is formed during a very long time (about ms) and is a precursor of exploding MB.
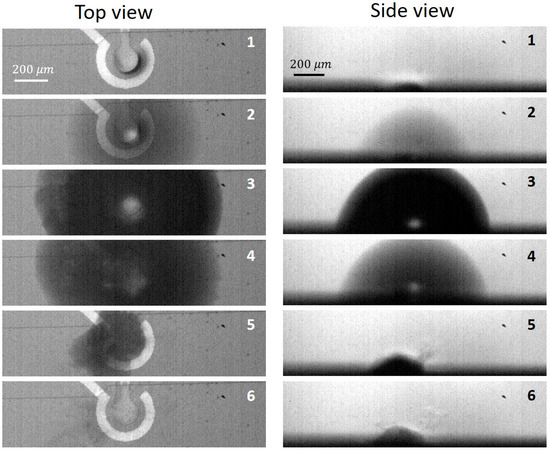
Figure 2.
Successive images of the MB explosion separated by a time interval of s. Development of the process observed from the top (left column) and from the side (right column) are shown. The driving pulses have an amplitude of V and a frequency of kHz.
For the first time, the explosion of microbubbles was observed by Postnikov et al. [23]. In this study, due to the use of thin film Ti electrodes, it was possible to produce more powerful explosions and investigate the dynamics of the process in more detail. Moreover, here, the exploding bubble was observed from the side for the first time. It demonstrates that, during the expanding and shrinking phases, the bubble exists in the form of a hemisphere attached to the substrate.
A better impression of the involved timescales gives the current flowing through the electrochemical cell. This current is shown in Figure 3. A sharp decrease of the current indicates the formation of the MB that covers the electrode area. It happens in s and then the electrodes stay nearly dry during s. Retreat of the bubble in the final stage happens even more quickly, in just 10–15 s, and then a new smaller bubble grows. The shrinkage process resembles very much the cavitation including the destructive effect on the electrodes and on the substrate (see Figure S1). The time resolved current at different stages of the process is shown below the main graph. One can notice that not only the amplitude but also the shape of the current changes. It is worth mentioning that the appearance of the exploding MB cannot be related to an electrical breakdown. In this case, the process would be characterized by a sharp current rise but not current decrease. Additionally, one can exclude significant generation of water vapor by Joule heating of the electrolyte. For the same electrodes, a direct measurement of the temperature rise just below the threshold of exploding microbubble formation was smaller than 10 C [10].
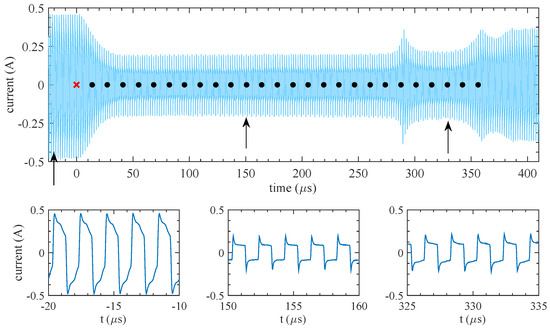
Figure 3.
Current through the electrochemical cell. Position of the fast video frames that were recorded at 73,000 fps synchronously with the current are shown by the black circles. The position of the very first frame (before the bubble starts to grow) is shown by the red cross. The time resolved currents at different stages of the process (indicated by the arrows) are shown below the main graph.
A special explanation has to be given to the residual current observed during the explosion. When the bubble covers the electrodes completely, the current does not drop to zero. This is due to presence of m-thick insulating SU-8 layer that is visible in the upper part of Figure 1a as a broken horizontal line. When the bubble moves over this line, a liquid bridge stays in the corner in front of the layer that connects the electrodes. Therefore, even when the bubble covers the electrodes completely, the current can flow through this liquid bridge.
One has to note that for Ti electrodes the average current per pulse is reduced during a few minutes but then reaches a steady state. A special investigation [30] showed that the current decrease is related to growth of titanium oxide layer and during this growth there is disbalance between oxidation and reduction processes. Finally, the balance is reached due to presence of cracks and pores in the oxide layer. Explosions are possible at all stages but the threshold amplitude is larger (about V) in steady state. In comparison with normal electrolysis, the scan rate is incredibly high and reaches V/s during the change of polarity. In this case, the total current includes the charging–discharging effects responsible for the peaks in the beginning of each pulse. Some details on the current behavior in the AP process are presented in [8].
Based on images in Figure 2, one can assume that the bubble grows axisymmetrically. With this assumption, we can follow the detailed dynamics of the bubble growth with the fast camera. For that, we set the image size to pixels that corresponds to a frame rate of 73,000 fps. Each frame is a narrow stripe oriented horizontally and having its left end near the center of the electrodes (see Video S4). In this way, we were able to observe development of the bubble edge with a time increment of s. Since the video and the current are recorded synchronously, the position of each frame can be marked in the current (black circles). The radius of the growing bubble extracted from the video frames is shown in Figure 4 by the black circles. The initial radius of the bubble cannot be determined from these video frames. As an estimate, we used the halo size that gives m. This value is indicated by the red cross. The initial expansion rate of the bubble was estimated as m/s. In s, the bubble radius reaches the maximum value m and then starts to shrink. At the final stage (at s), the shrinkage becomes very fast as it should be for the cavitation. The minimum bubble radius cannot be resolved with our frame rate. Then, a new expansion cycle starts with a smaller amplitude due to dissipation. In the current, we can see two additional cycles but can resolve only one in the video.
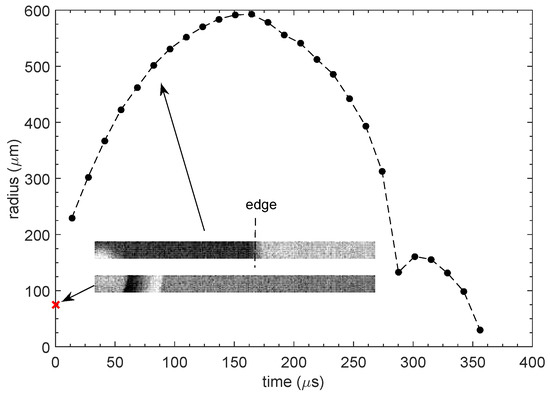
Figure 4.
Radius of the exploding bubble as a function of time. Black circles show the values found from the video frames. The red cross corresponds to the first frame and shows the expected value of the initial radius. The images in the insets show the first and the sixth frames.
The sound was recorded by the microphone synchronously with the current. The driving pulses have an amplitude of V and a frequency of kHz. To exclude the crosstalk with the driving pulses, the sound was averaged over a period of s. The averaged sound signal at a distance of cm (in air) from the source is shown in Figure 5. The moment of time when the current starts to decrease is taken as the beginning of the explosion corresponding to the moment . If the sound is generated by the explosion, it has to appear with a time delay of s, where cm is the distance from the source to the microphone and m/s is the speed of sound in air. This moment is shown by the left vertical dashed line. The second vertical line corresponds to the moment when the sound from the cavitation bubble [31] has to reach the microphone. It is clear that the signal between the vertical lines is generated solely by the explosion, but the signal on the right from the second vertical line is produced by both sources. Note that the cavitation produces stronger sound than the explosion. To all appearance, this is because the shrinking bubble reaches the size smaller than , in which the pressure is larger than in the initial bubble. The two sources of sound were separated here for the first time and the time delay unambiguously relates the explosion and the sound.
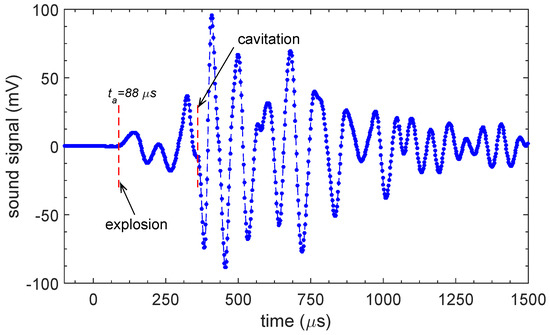
Figure 5.
Sound signal at a distance of cm from the sample. The signal is averaged over s time. The vertical red lines show the moments when the sound from the explosion (left line) and from the cavitation (right line) has to reach the microphone. Only the sound of explosion exists between the red lines.
Fourier transform of the signal demonstrates the frequency composition of the sound. The power spectral density (PSD) of the signal is shown in Figure 6 in the audible frequency range. The main line corresponds to the sound frequency kHz and has a full width of kHz. As was already stressed earlier [23], the exact position of the main line depends on the surrounding objects and most importantly on the size of the Petri dish. For the sound shown in Figure 5, the sample was placed in a circular Petri dish with a diameter of mm. Since the Fourier spectrum mix the sounds of explosion and cavitation, we cannot use PSD to estimate the amplitude of the sound coming from the explosion.
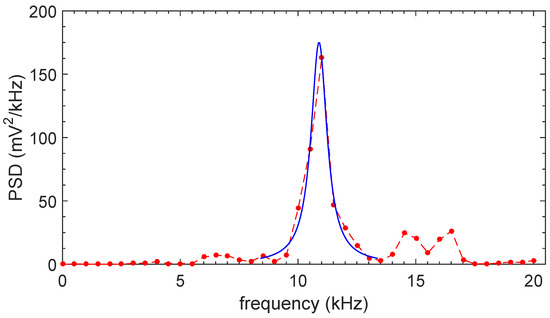
Figure 6.
Power spectral density of the sound in Figure 5 presented in the audible range (circles). The solid blue curve is the best fit of the main frequency line with the Lorentzian line.
3. Theory
3.1. Qualitative Model
Due to fast change of the polarity in the AP process, the gases are not spatially separated as it occurs in the DC electrolysis. That is why the liquid is filled with the stoichiometric mixture of hydrogen and oxygen. The gases are collected in NBs forming a cloud above the electrodes [10], but no microbubbles able to strong scattering of light are observed. The cloud consists of separate H and O NBs, which are in dynamic equilibrium. The equilibrium is established because the gas produced by the electrochemical process is terminated in the surface-assisted combustion reaction that is ignited spontaneously in NBs. If a NB contains mixture of gases, it ends up as a smaller H or O nanobubble. The bubbles filled with one of the gases are collected in the system. Occasionally, two NBs containing different gases merge; the stoichiometric part turns back to water but the remaining gas forms a smaller NB.
With the increase of the voltage amplitude, the concentration of NBs increases and finally reaches a critical value such that a large number of NBs merge at the same time. The critical concentration can be associated with the close packing of spherical NBs, for which the volume fraction of gas is . Dynamic light scattering demonstrates that at fixed frequency the size distribution of the bubbles is narrow [10]; therefore, it is safe to assume the uniform distribution. The merging can be initiated by the diffusion exchange of the gases via liquid membranes. The diffusive exchange proceeds quickly between the bubbles with different gases and slowly between the bubbles containing the same gas. The timescale for the fast process is estimated as ns, where nm is the thickness of a liquid membrane between two NBs and m/s is the diffusion coefficient for the gases in liquid. The minimal thickness h of a stable liquid membrane is defined by the disjoining pressure in the liquid film [32]. The diffusion is driven by high concentration difference of one gas, say H, in the neighboring bubble filled with O. On the contrary, in the case of the bubbles with the same gas, the concentration difference is low and the diffusive exchange is going slowly. The initial size of a MB that is formed as a result of the merging is defined by the space domain with the highest concentration of NBs. The estimate for the radius of the initial MB is m as was discussed above. Note that in the earlier experiment [23] this radius was considerably smaller (15–25 m). In our case, the size increase of the initial MB is due to the use of thin film titanium electrodes that provide more homogeneous generation of NBs. It results in more stable and more powerful explosions.
The initial bubble with the radius contains a stoichiometric mixture of H and O at pressure that is defined by the pressure in the constituent NBs , where is the ambient pressure, is the surface tension, and r is the average radius of NBs. For nm, this pressure is bar. The surface tension in the MB cannot balance this pressure. Here, two scenarios are possible. If there is no chemical interaction between gases, the bubble starts to expand due to pressure difference inside and outside of the bubble. The expansion can be described by the Rayleigh–Plesset equation [33] for the time-dependent radius , in which we can neglect the viscous and surface tension terms:
where “dot” means the time derivative, P is the pressure in the bubble, and is the mass density of the liquid. Let us note that, as long as we neglect viscous effects, the equation describing a bubble in infinite liquid is the same as the equation for a hemispherical bubble on a solid substrate. This is because, due to symmetry of the problem in infinite liquid, the normal component of the velocity in the middle plane is zero. The same is true for a hemispherical bubble as the boundary condition on the solid substrate [34].
For a gas-filled bubble, which is in thermal equilibrium with liquid, the pressure can be presented as . In this case, the solution of Equation (1) presented in terms of the normalized variables,
is shown in Figure 7 by the thick solid curve. Only increasing part of the curve is plotted together with the experimental data (circles) corresponding to m. One can see that the maximum radius of the bubble is smaller than the experimental one. It is obvious also that the time scale is at least five times smaller than the observed time scale. We have to conclude that the expansion of the bubble filled with hydrogen and oxygen is not supported by the observed dynamics. There is independent experimental evidence that the gases in MB formed by merging of many NBs get into the chemical reaction. In Refs. [26,35], formation and disappearance of such MBs were observed in closed volumes covered with a flexible membrane. After many cycles the membrane always returned to its initial position indicating complete termination of H and O gases in the chemical reaction.
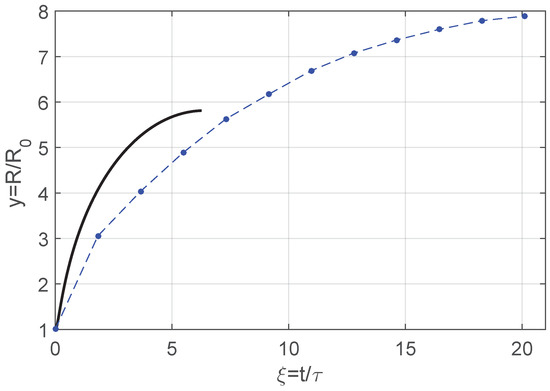
Figure 7.
Normalized radius of the bubble as a function of normalized time for H and O gases that do not react (solid line). Only the increasing branch of the solution of Equation (1) is presented. The experimental data corresponding to the initial radius m are shown by the circles.
Therefore, we consider as realistic the second scenario when the reaction between the gases proceeds first and then the bubble containing steam starts to expand. Immediately after the merging, the gases fill in the volume , where is the volume of MB (hemisphere). The rest of the volume is filled with liquid in the form of nanodrops (NDs), which appear as the result of the nanofoam breaking. The timescale for formation of NDs by coalescence of NBs is defined by the balance of viscous and surface tension effects [36]: ns, where Pa·s is the viscosity of liquid. For close packing of spheres, there are three free volumes per sphere. It is assumed that each free volume forms a ND with a radius , which is related to the radius of NB as
One has to stress that, due to these NDs, the surface-to-volume ratio in the MB is of the same order as for a single NB:
This large ratio is favorable for ignition of the surface-assisted reaction between the gases [24].
Since the total area of NDs is much larger than the area of the side walls of MB, the nanodrops play the role of the reaction centers. The average distance between NDs is , i.e., smaller than but larger than . In these conditions, it is expected that the surface-assisted reaction between H and O gases will happen on the combustion timescale of ns that is defined by a combination of the involved reaction constants [24]. The energy that is released in the combustion process is
where kJ/mol is the enthalpy of the reaction and we are using the ideal gas law to express the number of molecules N in the MB. When very small NBs merge, the pressure can be so high that one has to use a more general equation of state that takes into account the van der Waals interaction between gas molecules.
The energy (Equation (5)) produced by the reaction is distributed in the final MB, which contains the reaction product (steam) and NDs. Due to presence of NDs, the time needed to reach the thermal equilibrium between the liquid and steam is defined by the heat diffusion in steam over a distance d between NDs. This time is estimated as ns, where we take for the estimate the heat diffusion coefficient [37] m/s in saturated steam at C. This time is shorter than the reaction time ns and we conclude that the NDs and steam are in equilibrium inside of the final MB. In this case, the pressure in the MB is completely defined by the steam–water equilibrium curve [38].
Such a MB can be described by Equation (1) with only at the beginning of the expansion. This is because at later moments of time the heat produced by the reaction escapes to the bulk liquid via the bubble walls. The rate of the heat transfer is defined by the relation
where and are the heat conductivity and heat diffusion coefficient of the liquid, respectively, and and are the temperature in the bubble after the reaction and temperature of the liquid far from the bubble, respectively. Integrating this expression over time at fixed R and , we can find . The timescale for heat losses is defined by the condition . For the initial bubble radius m and pressure bar, one finds for the reaction energy J. Using for the estimate C, W/m/K, m/s, one finds for the heat losses J, where t has to be taken in microseconds. Comparing and , one can conclude that the heat losses become important at s. This time can be compared with the characteristic time in the Rayleigh–Plesset Equation (2) s. It means that the heat losses become important before the bubble starts to expand, but long after the chemical reaction is completed and the thermal equilibrium is established. Therefore, there is a well-defined state of the MB, in which the bubble has not yet expanded, but the chemical reaction is already over and the steam–liquid equilibrium is established. We are interested in the determination of this state. Knowledge of the pressure and temperature in the bubble immediately after the reaction allows answering two questions: (1) Is the pressure in the bubble large enough to be responsible for the bubble expansion? (2) Is the temperature low enough to exclude the normal combustion of the gases?
The above-described main steps explaining formation of exploding MBs are shown schematically in Figure 8. This simple model does not take into account the detailed dynamics of the process, but this dynamics is not necessary for determination of the pressure and temperature in the final state.
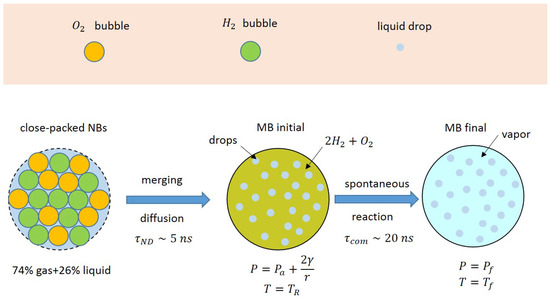
Figure 8.
The scheme explaining formation of exploding microbubble. Densely packed NBs merge and form an initial MB filled with H and O mixture of gases. This mixture is ignited spontaneously due to high surface-to-volume ratio in the MB. The gases turn to water vapor producing a significant energy. The thermal equilibrium is reached in the final state before the MB starts to expand.
3.2. Energy Balance
The initial MB is defined as the bubble before the explosion. The pressure in this bubble is and the temperature is equal to room temperature. Internal energy of the initial MB includes the gas enthalpy and the total enthalpy of liquid drops , which are
where and are the concentrations of gas and liquid, respectively; kJ/mol is the enthalpy per gas molecule, which is nearly the same for H and O molecules; and is the enthalpy of liquid water that can be calculated [37] as J/mol (here is in bar). The total internal energy of the initial MB is
The final MB is defined as the bubble of the same radius containing the reaction products (water vapor) and water NDs. Of course, pressure and temperature in the final state are different. Since the thermal equilibrium between NDs and steam is reached very quickly (ns), the pressure and temperature are related to each other and the state in the final bubble is completely defined by temperature . This temperature can be found without detailed knowledge of the dynamics using only the energy conservation law.
The energy balance equation is , where is the internal energy in the final state. In this state, the volume fraction of gas f differs from that in the initial state because partial vaporization or condensation of the NDs can happen. It can be presented as
where the gas (vapor) and liquid concentrations are taken at and the effective concentration of water molecules is defined via the total number of water molecules in MB, which is the same for the initial and finial states. The latter is because we neglect energy and mass exchange via the sidewalls of the MB on the timescale shorter than s. From the initial state, one finds
Note that for calculation two H and one O are counted as two HO molecules.
Similar to Equation (7), we can define the enthalpy of vapor and liquid in the final state
Here, all the values , , , and the enthalpy of vapor can be taken from the vapor–liquid equilibrium tables [38]. Additional energy is spent on vaporization of NDs:
where is the enthalpy of vaporization per molecule. The second term in square brackets shows that the vapor formed in the reaction does not contribute. Now, we can construct the internal energy in the final state as
where . In and one has to include also the terms containing surface energy of NDs. However, the surface tension effect is very small. From Equations (4) and (5), the ratio is estimated as 1%. Actual difference of the surface energies in the initial and final states is even smaller.
Let us present the energy balance in the following form:
This equation says that the energy produced by the reaction is spent on gas heating (first term), on heating of the NDs (second term), on partial vaporization of these NDs (third term), and on the pressure change in the bubble (fourth term). Normalizing each of these entries to the reaction energy , we define as ():
One has to note that the enthalpies per molecule and in the initial state and the enthalpies for the equilibrium steam–water state , , and in the final state of MB are taken from the data tables [37,38] that already include intermolecular interaction. On the other hand, the number of gas molecules N in the initial bubble (or gas concentration at ) is calculated via the equation of state. This number enters all the terms in the energy balance equation (Equation (14)) and depends on the model used for description of the equation of state. Below (see Figure 9), we compare the ideal gas law with the Peng–Robinson equation of state [39] to demonstrate that the deviations from the ideal gas are not very important while merging NBs are larger than 20 nm in diameter. Influence of intermolecular interaction on the combustion dynamics at high pressure was considered earlier [40]. In our case, this dynamics is not important since for the energy balance we consider only the initial and final states.
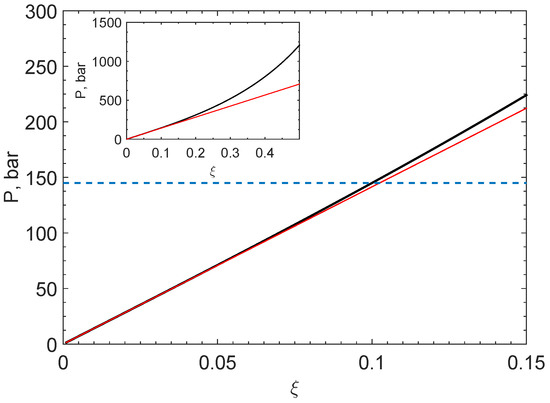
Figure 9.
Pressure given by the Peng–Robinson equation of state (Equation (17)) for stoichiometric mixture of H and O (black curve). The red line shows the pressure for the ideal gas law. The horizontal blue line shows the pressure level in the merging NBs of the smallest size (nm) considered in this paper. The inset demonstrates the same pressure in the larger range of the parameter .
To check the deviation from the ideal gas law, we follow the procedure used in Ref. [40], but present the Peng–Robinson equation in a slightly different form
where has the meaning of a minimum volume taken by a molecule and the variable is the ratio of the minimum volume taken by N molecules to the volume of the system. The parameter A is defined as and the function is given by the relation
Here, and a is the acentric factor of the molecule. Equation (17) can be applied to a gas with the critical pressure and temperature consisting of the same molecules. In our case, the initial bubble is filled in with the stoichiometric mixture of hydrogen and oxygen. To adjust Equation (17) for a mixture of gases, one can define the parameters A and B as and , where is the fraction of ith gas. For the stoichiometric mixture of H and O (, ), we have found and , where is the Avogadro number. For these parameters and temperature , we have found the pressure as a function , which is shown in Figure 9 by the black curve. For comparison in the same graph the pressure for the ideal gas law () is shown by the red line. The horizontal dashed blue line corresponds to the pressure bar in the initial MB that is formed by merging NBs with the radius nm. This size is considered as the lower limit for the AP process while the observed radius of NBs is in the range nm [10]. The inset demonstrates that in a wider interval of these two functions deviate strongly. In the figure, it is obvious that the ideal gas law describes pressure in the range of interest bar quite well and there is no need to use more general equation of state.
All relative contributions in the energy balance equation (Equation (14)) defined by the relations in Equation (15) and (16) are shown in Figure 10a as functions of temperature for the radius of merging NBs nm. The energy balance is reached when the total normalized energy is equal to one. The temperature at which it happens is what we are looking for. As one can see, at low temperatures, heating of NDs dominates, but, at high temperatures approaching the critical point of water (C), the vapor contribution becomes more important. On the contrary, the terms related to the partial condensation/vaporization of NDs and to the pressure change are always small. It is worth mentioning that the normalized energies do not depend on the size of MB since all the entries in Equations (15) and (16) are proportional to .
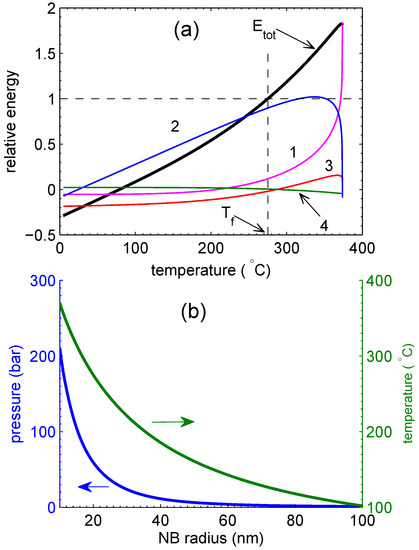
Figure 10.
(a) Normalized energies (each marked by the index i) as functions of temperature. The total energy is the sum of all the terms. The graphs are presented for the NB radius nm. Thin dashed lines show the solution of the energy balance equation. (b) Pressure in the final MB (left axis) and temperature (right axis) as functions of the radius of merging NBs.
Figure 10b shows the pressure and temperature in the final MB as functions of the size of merging NBs. The temperature is close to the critical value when the NB radius is equal to nm. For the NBs emerging in the experiment [10], we have found C and bar for nm and C and bar for nm.
We see that the temperature in the final MB can be significant at least on the timescale s, but it is still lower than the autoignition limit C of conventional combustion [41,42] when the chain branching reactions are started. Moreover, the autoignition can occur only at low pressure mPa that is not the case for the exploding bubble. It supports our initial guess that the combustion observed in MBs is the surface-assisted process similar to that in nanobubbles. Nevertheless, the pressure at is high enough to induce inflation of the bubble and explain the sound effect produced by the exploding MB.
4. Discussion
In the standard combustion theory, explosion of gases inside of a MB is not possible due to fast heat escape via the walls. The smallest volumes, where combustion of gases was observed, were underwater bubbles with a diameter of mm filled with oxygen and acetylene mixture [43]. Moreover, to ignite the reaction in these bubbles, one has to apply a significant energy. The process analyzed in this paper proceeds in much smaller bubbles and occurs spontaneously without the ignition. We attributed the combustion reaction between O and H gases to the surface-assisted reactions [24]. To be operative, this mechanism demands high surface-to-volume ratio m. This ratio is naturally high for NBs but not for MBs. In our model, high ratio in MBs is realized due to presence of nanodrops, which are the key element of the model. Thus, the surface-assisted reactions are able to explain both combustion in NBs and combustion in MBs formed by merging of NBs.
In general terms the surface-assisted mechanism assumes formation of free radicals on the gas–liquid interface. Generation of OH radicals was observed in water solutions from collapsing microbubbles filled with air, oxygen, or ozone in absence of external dynamic stimuli [44,45]. Generation of radicals was related to negative charges at the gas–liquid interface. It was proposed [24] that these surface charges play the role of active sites for dissociation of gas molecules. Dissociation of H molecules on the active sites triggers series of the reactions between H and O resulting in water formation. This series includes only barrierless or low-barrier reactions so that the combustion becomes possible at room temperature. This mechanism explains the experimental data on combustion of hydrogen–oxygen mixture in NBs including combustion in MBs considered in this paper. As shown above from simple energy conservation arguments, the temperature in the exploding MB does not reach the values to generate the radicals thermally. In this sense, we can say that the reaction follows the “cold combustion” path.
The nature of dissociation on the active sites is not well understood. Existence of negative charges on the gas–water interface is not disputed, but the nature of these charges is still debated [46,47] and the precise dissociation mechanism is an open question.
The energy balance described in Section 3.2 provides the initial state in the MB immediately after the reaction. It is important that the details of the reaction dynamics do not influence the pressure and temperature in the initial bubble. Knowledge of these characteristics is crucial in two aspects. First, it shows that the standard combustion cannot be responsible for the explosion. Second, it plays the role of the initial condition for the dynamics of expanding MB and shows that a high pressure in the bubble filled with steam and water nanodroplets is the reason for the sound generation and bubble expansion. The initial condition (temperature and pressure) can be used with the Rayleigh–Plesset equation in combination with the heat transfer equation. Solution of this system allows in principle to predict the dynamics of expanding bubble observed experimentally. However, due to complexity of the heat transfer process, the complete solution of this system is a separate problem that is not considered in this paper.
Exploding MBs present a significant practical interest. One of the promising applications is an actuation mechanism to drive microelectromechanical systems and specifically microfluidic systems. It was already demonstrated [26] that the explosion of a MB in a closed chamber covered with a flexible membrane gives the deflection of the membrane that is 20 times larger than the deflection produced in the same process without generation of the MBs. This is an attractive regime to drive micropumps. Moreover, if it were possible to realize the same mechanism of combustion for gases produced from external sources, this “cold combustion” mechanism would be a physical basis for a truly microscopic internal combustion engine.
5. Conclusions
We investigated formation and explosion of microbubbles generated in the alternating polarity water electrolysis. Development of the process in time is described by the current through the electrochemical cell. This dynamics is supported by the fast camera observations that demonstrate explosive growth of the microbubble that covers the electrodes and reduces the current. In s, the bubble reaches a maximum size of m and then starts to shrink in the same way as any cavitating bubble. The event produces a clicking sound, which was recorded and analyzed. The analysis shows that two sources separated in time generate the sound. The first sound comes from the exploding microbubble but s later the sound from the collapsing bubble is added. We refined a qualitative model proposed earlier [23] to explain this puzzling phenomenon. In the alternating polarity water electrolysis, a dense cloud of nanobubbles above the electrodes was observed previously with optical methods. This cloud can be so dense that nanobubbles start to merge and form a microbubble with an initial size of about m. This microbubble contains mixture of hydrogen and oxygen but also nanodrops as remnants from the merging process. Surface-to-volume ratio in such a microbubble is very large and is of the same order as for a separate nanobubble. High surface-to-volume ratio is a signature of the surface-assisted combustion that happens spontaneously at low temperature. This combustion explains the explosion of the microbubble. It was possible to predict the temperature and pressure in the microbubble immediately after the combustion using only the energy conservation law. The temperature in the final state C is indeed not sufficient to explain the process by standard combustion. On the other hand, the pressure in the microbubble reaches a value as high as bar, which is sufficient to generate audible sound accompanying the microbubble explosion with the following inflation of the bubble, as observed experimentally. The exploding microbubbles generate a high pressure increase that can be used as the driving principle for fast and strong microactuators.
Supplementary Materials
The following are available online at https://www.mdpi.com/1996-1073/13/1/20/s1, Figure S1: Damage of the substrate by cavitation, Video S1: Exploding bubbles: general view and sound; Video S2: Bubble growth (top view); Video S3: Bubble growth (side view); Video S4: Detailed dynamics of a bubble.
Author Contributions
All authors formulated the aim and scope of the paper. V.B.S. and G.P. did fast camera measurements with a significant technical support from A.V.P. (Alexander V. Postnikov) and I.V.U. Theoretical part of the paper was developed by A.V.P. (Alexander V. Prokazniko) and V.B.S. The samples were fabricated by I.V.U. and acoustic data were collected by A.V.P. (Alexander V. Postnikov). The paper was written by V.B.S. and reviewed by G.P. All authors have read and agreed to the published version of the manuscript.
Funding
This research was funded by NWO Domain Applied and Engineering Sciences grant 13595 and Russian Science Foundation grant 18-79-10038.
Conflicts of Interest
The authors declare no conflict of interest.
References
- Brandon, N.P.; Kelsall, G.H. Growth kinetics of bubbles electrogenerated at microelectrodes. J. Appl. Electrochem. 1985, 15, 475–484. [Google Scholar] [CrossRef]
- Matsushima, H.; Kiuchi, D.; Fukunaka, Y.; Kuribayashi, K. Single bubble growth during water electrolysis under microgravity. Electrochem. Commun. 2009, 11, 1721–1723. [Google Scholar] [CrossRef]
- Vogt, H.; Balzer, R. The bubble coverage of gas-evolving electrodes in stagnant electrolytes. Electrochem. Acta 2005, 50, 2073–2079. [Google Scholar] [CrossRef]
- Vogt, H. Interfacial supersaturation at gas evolving electrodes. J. Appl. Electrochem. 1993, 23, 1323–1325. [Google Scholar] [CrossRef]
- Hine, F.; Yasuda, M.; Nakamura, R.; Noda, T. Hydrodynamic Studies of Bubble Effects on the IR-Drops in a Vertical Rectangular Cell. J. Electrochem. Soc. 1975, 122, 1185–1190. [Google Scholar] [CrossRef]
- Vogt, H. The incremental ohmic resistance caused by bubbles adhering to an electrode. J. Appl. Electrochem. 1983, 13, 87–88. [Google Scholar] [CrossRef]
- Luo, L.; White, H.S. Electrogeneration of Single Nanobubbles at Sub-50-nm-Radius Platinum Nanodisk Electrodes. Langmuir 2013, 29, 11169–11175. [Google Scholar] [CrossRef]
- Svetovoy, V.B.; Sanders, R.G.P.; Elwenspoek, M.C. Transient nanobubbles in short-time electrolysis. J. Phys. Condens. Matter 2013, 25, 184002. [Google Scholar] [CrossRef]
- Svetovoy, V.B.; Sanders, R.G.P.; Lammerink, T.S.J.; Elwenspoek, M.C. Combustion of hydrogen-oxygen mixture in electrochemically generated nanobubbles. Phys. Rev. E 2011, 84, 035302. [Google Scholar] [CrossRef]
- Postnikov, A.V.; Uvarov, I.V.; Penkov, N.V.; Svetovoy, V.B. Collective behavior of bulk nanobubbles produced by alternating polarity electrolysis. Nanoscale 2018, 10, 428–435. [Google Scholar] [CrossRef]
- Seddon, J.R.T.; Lohse, D.; Ducker, W.A.; Craig, V.S.J. A Deliberation on Nanobubbles at Surfaces and in Bulk. Chem. Phys. Chem. 2012, 13, 2179–2187. [Google Scholar] [CrossRef] [PubMed]
- Lohse, D.; Zhang, X. Surface nanobubbles and nanodroplets. Rev. Mod. Phys. 2015, 87, 981–1035. [Google Scholar] [CrossRef]
- Alheshibri, M.; Qian, J.; Jehannin, M.; Craig, V.S.J. A History of Nanobubbles. Langmuir 2016, 32, 11086–11100. [Google Scholar] [CrossRef] [PubMed]
- Ohgaki, K.; Khanh, N.Q.; Joden, Y.; Tsuji, A.; Nakagawa, T. Physicochemical approach to nanobubble solutions. Chem. Eng. Sci. 2010, 65, 1296–1300. [Google Scholar] [CrossRef]
- Ushikubo, F.Y.; Furukawa, T.; Nakagawa, R.; Enari, M.; Makino, Y.; Kawagoe, Y.; Shiina, T.; Oshita, S. Evidence of the existence and the stability of nano-bubbles in water. Colloids Surf. A Physicochem. Eng. Asp. 2010, 361, 31–37. [Google Scholar] [CrossRef]
- Kikuchi, K.; Nagata, S.; Tanaka, Y.; Saihara, Y.; Ogumi, Z. Characteristics of hydrogen nanobubbles in solutions obtained with water electrolysis. J. Electroanal. Chem. 2007, 600, 303–310. [Google Scholar] [CrossRef]
- Jie, Q.; Zhenglei, Z.; Shuo, W.; Xingya, W.; Lei, W.; Yaming, D.; Hongwei, Z.; Lijuan, Z.; Jun, H. Formation and Stability of Bulk Nanobubbles Generated by Ethanol–Water Exchange. ChemPhysChem 2017, 18, 1345–1350. [Google Scholar] [CrossRef]
- Bunkin, N.F.; Shkirin, A.V.; Ignatiev, P.S.; Chaikov, L.L.; Burkhanov, I.S.; Starosvetskij, A.V. Nanobubble clusters of dissolved gas in aqueous solutions of electrolyte. I. Experimental proof. J. Chem. Phys. 2012, 137, 054706. [Google Scholar] [CrossRef]
- Zhu, J.; An, H.; Alheshibri, M.; Liu, L.; Terpstra, P.M.J.; Liu, G.; Craig, V.S.J. Cleaning with Bulk Nanobubbles. Langmuir 2016, 32, 11203–11211. [Google Scholar] [CrossRef]
- Yurchenko, S.O.; Shkirin, A.V.; Ninham, B.W.; Sychev, A.A.; Babenko, V.A.; Penkov, N.V.; Kryuchkov, N.P.; Bunkin, N.F. Ion-Specific and Thermal Effects in the Stabilization of the Gas Nanobubble Phase in Bulk Aqueous Electrolyte Solutions. Langmuir 2016, 32, 11245–11255. [Google Scholar] [CrossRef]
- Postnikov, A.V.; Uvarov, I.V.; Lokhanin, M.V.; Svetovoy, V.B. Electrically controlled cloud of bulk nanobubbles in water solutions. PLoS ONE 2017, 12, e0181727. [Google Scholar] [CrossRef] [PubMed]
- Postnikov, A.V.; Uvarov, I.V.; Lokhanin, M.V.; Svetovoy, V.B. High concentration of H2 and O2 nanobubbles in water electrolytes and their collective optical effect. AIP Conf. Proc. 2017, 1884, 030003. [Google Scholar] [CrossRef]
- Postnikov, A.V.; Uvarov, I.V.; Lokhanin, M.V.; Svetovoy, V.B. Highly energetic phenomena in water electrolysis. Sci. Rep. 2016, 6, 39381. [Google Scholar] [CrossRef] [PubMed]
- Prokaznikov, A.; Tas, N.; Svetovoy, V. Surface Assisted Combustion of Hydrogen-Oxygen Mixture in Nanobubbles Produced by Electrolysis. Energies 2017, 10, 178. [Google Scholar] [CrossRef]
- Jain, S.; Qiao, L. Understanding Combustion of H2/O2 Gases inside Nanobubbles Generated by Water Electrolysis Using Reactive Molecular Dynamic Simulations. J. Phys. Chem. A 2018, 122, 5261–5269. [Google Scholar] [CrossRef]
- Uvarov, I.V.; Lokhanin, M.V.; Postnikov, A.V.; Melenev, A.E.; Svetovoy, V.B. Electrochemical membrane microactuator with a millisecond response time. Sens. Actuator B Chem. 2018, 260, 12–20. [Google Scholar] [CrossRef]
- Veser, G. Experimental and theoretical investigation of H2 oxidation in a high-temperature catalytic microreactor. Chem. Eng. Sci. 2001, 56, 1265–1273. [Google Scholar] [CrossRef]
- Fernandez-Pello, A.C. Micropower generation using combustion: Issues and approaches. Proc. Combust. Inst. 2002, 29, 883–899. [Google Scholar] [CrossRef]
- Schäfer, H.; Chatenet, M. Steel: The Resurrection of a Forgotten Water-Splitting Catalyst. ACS Energy Lett. 2018, 3, 574–591. [Google Scholar] [CrossRef]
- Shlepakov, P.S.; Uvarov, I.V.; Naumov, V.V.; Mazaletskiy, L.A.; Svetovoy, V.B. Degradation of Titanium Electrodes in the Alternating Polarity Electrolysis. Int. J. Electrochem. Sci. 2019, 14, 5211–5225. [Google Scholar] [CrossRef]
- Ceccio, S.L.; Brennen, C.E. Observations of the dynamics and acoustics of travelling bubble cavitation. J. Fluid Mech. 1991, 233, 633–660. [Google Scholar] [CrossRef]
- Derjaguin, B.V.; Churaev, N.V.; Muller, V.M. Surface Forces; Plenum Publishing Corporation: New York, NY, USA, 1987. [Google Scholar]
- Brennen, C.E. Cavitation and Bubble Dynamics; Oxford University Press: Oxford, UK, 1995. [Google Scholar]
- Landau, L.D.; Lifshitz, E.M. Fluid Mechanics; Elsevier: Oxford, UK, 1987. [Google Scholar]
- Postnikov, A.V.; Uvarov, I.V.; Prokaznikov, A.V.; Svetovoy, V.B. Observation of spontaneous combustion of hydrogen and oxygen in microbubbles. Appl. Phys. Lett. 2016, 108, 121604. [Google Scholar] [CrossRef]
- Eddi, A.; Winkels, K.G.; Snoeijer, J.H. Short time dynamics of viscous drop spreading. Phys. Fluids 2013, 25, 013102. [Google Scholar] [CrossRef]
- Vargaftik, N.B.; Vinogradov, Y.R.; Yargin, V.S. Handbook of Physical Properties of Liquids and Gases: Pure Substances and Mixtures, 3rd ed.; Begell House: New York, NY, USA, 1996. [Google Scholar]
- Beaton, C.F.; Hewitt, G.F. Physical Property Data for the Design Engineer; CRC Press: New York, NY, USA, 1988. [Google Scholar]
- Peng, D.Y.; Robinson, D.B. A New Two-Constant Equation of State. Ind. Eng. Chem. Fund. 1976, 15, 59–64. [Google Scholar] [CrossRef]
- Pohl, S.; Jarczyk, M.; Pfitzner, M.; Rogg, B. Real gas CFD simulations of hydrogen/oxygen supercritical combustion. Prog. Propul. Phys. 2013, 4, 583–614. [Google Scholar]
- Azatyan, A.A.; Andrianova, Z.S.; Ivanova, A.N. Role of the HO2 radical in hydrogen oxidation at the third self-ignition limit. Kinet. Catal. 2010, 51, 337–347. [Google Scholar] [CrossRef]
- Wang, X.; Law, C.K. An analysis of the explosion limits of hydrogen-oxygen mixtures. J. Chem. Phys. 2013, 138, 134305. [Google Scholar] [CrossRef]
- Teslenko, V.S.; Manzhalei, V.I.; Medvedev, R.N.; Drozhzhin, A.P. Burning of Hydrocarbon Fuels Directly in a Water-Based Heat Carrier. Combust. Explos. Shock Waves 2010, 46, 486–489. [Google Scholar] [CrossRef]
- Takahashi, M.; Chiba, K.; Li, P. Free-Radical Generation from Collapsing Microbubbles in the Absence of a Dynamic Stimulus. J. Phys. Chem. B 2007, 111, 1343–1347. [Google Scholar] [CrossRef]
- Li, P.; Takahashi, M.; Chiba, K. Enhanced free-radical generation by shrinking microbubbles using a copper catalyst. Chemosphere 2009, 77, 1157–1160. [Google Scholar] [CrossRef]
- Beattie, J.K.; Djerdjev, A.M.; Warr, G.G. The surface of neat water is basic. Faraday Discuss. 2009, 141, 31–39. [Google Scholar] [CrossRef] [PubMed]
- Vácha, R.; Marsalek, O.; Willard, A.P.; Bonthuis, D.J.; Netz, R.R.; Jungwirth, P. Charge Transfer between Water Molecules As the Possible Origin of the Observed Charging at the Surface of Pure Water. J. Phys. Chem. Lett. 2012, 3, 107–111. [Google Scholar] [CrossRef]
© 2019 by the authors. Licensee MDPI, Basel, Switzerland. This article is an open access article distributed under the terms and conditions of the Creative Commons Attribution (CC BY) license (http://creativecommons.org/licenses/by/4.0/).