Abstract
The high penetration of distributed energy resources (DERs) in the distribution system brings new challenges related to voltage variations and reverse power flow. The sudden changes in electric power generation from the DERs due to climate conditions or their internal malfunction might cause high fluctuations in system voltage. To enhance the voltage stability when a disturbance occurs, this paper proposes a new reactive power management method to control each DER based on voltage sensitivity analysis. The voltage variation has the different features in both steady-state and transient conditions. In particular, its transient behavior depends on the type of DERs. Therefore, the particular optimal control for improving the dynamic response of voltage is difficult to apply for all types of DERs. In contrast, the voltage variation in steady-state can be controlled with the reactive power management by the sensitivity analysis between reactive power generation and system voltage. Even though this paper focuses on the reduction of voltage variation in steady-state, the relationship between the voltage variations in steady-state and transient conditions is also analyzed. The effectiveness of the proposed method is verified with several case studies on the practical distribution system in South Korea by using the time-domain simulation based on the PSCAD/EMTDC® software. The results show that the proposed reactive power management method can improve the dynamic voltage responses in both steady-state and transient conditions when the distribution system has the high penetration of renewables.
1. Introduction
Recently, to accommodate the large amount of distributed energy resources (DERs), the new transmission system of 70 kV is under construction in South Korea. With this new medium-voltage transmission system, much more wind and solar farms can be interconnected. Nevertheless, there still exist some challenges in distribution systems even though this system alleviates its congestion. In particular, many connections of DERs to a distribution system might cause several serious problems such as voltage rise [1], overloading of feeder [1,2], abnormal protective coordination [3], and frequent operation of on-load tap changer (OLTC) of transformers [4,5]. Among them, the voltage response is the most critical factor to increase the hosting capacity of DERs.
Many reactive power control methods for DERs to mitigate the voltage variation have been reported in the literature. The Q(V) droop control has been widely used for the reactive power management of DERs [6,7,8,9]. This method is characterized in that the required reactive power is determined by the voltage state at the point of common coupling (PCC). In particular, the Q(V) droop control can be easily implemented in the inverter controller, and it avoids the wide-area communication. However, it cannot be effectively applied to the DERs located close to a distribution transformer because the voltage measured in the point close to the transformer is subject to be in the relatively more stable condition than that in the location far from the transformer. To use all DERs in the distribution system, the combination of PF(P) control with the Q(V) control has been suggested [6,7]. The PF(P) method determines the power factor of DERs depending on the active power generation. Therefore, when the system has the high renewable penetration, the DERs might generate the more reactive power to enhance the system stabilization. Presently, the Q(V) droop control is further advanced with the advent of smart inverter (SI). Then, the SI function for Q(V) droop control is proposed in [9] to minimize the loss of system while optimizing the slope of Q(V) curve with the objective function of loss. However, when the weather conditions change rapidly, the conventional droop control cannot deal with the system changes [10]. For example, the rapid instantaneous voltage change can cause the large fluctuations in the distribution system while resulting in the serious degradation of regulators [11]. In South Korea, it must be kept within 3% of its nominal value. Subsequently, the method to mitigate the voltage variations from the DERs is required. In [12], the allowable reactive power capacity of photovoltaic (PV) inverter is considered to mitigate the voltage variations caused by cloud transients. In [13], multi-mode reactive power generation strategies of PV inverter are suggested for the diverse power fluctuation of DERs. However, these existing methods still have serious drawback in that their performance highly depends on the R/X ratio of grid. The distribution lines with smaller cross sections usually have the higher R/X ratio. Therefore, the suggested reactive power controls are not sufficient.
On the other hand, many studies have considered the installation of energy storage system (ESS) to make the DERs dispatchable [14,15,16,17,18,19]. With the compensation of power outputs from ESS, the voltage variation can also be reduced. To enhance the voltage stability of system, the optimal size and location of ESS are selected [14,15]. Also, the real-time coordination between DERs and ESS is introduced for the voltage regulation [16,17]. However, this real-time control requires both complex communication infrastructure and ESS installation while resulting in the high investment. For the increased efficiency of communication, the local controls of ESS are suggested in [18,19]. However, the minimization of voltage variations in severe conditions such as the disconnection of DERs is not considered.
In this paper, a new method to minimize the voltage variation is proposed when several DERs in the practical distribution system are simultaneously disconnected. To do so, the reactive power management is applied based on the voltage sensitivity analysis. The voltage sensitivity analysis enables the direct calculation of system voltage even though the DERs have various types and sizes. In particular, the proposed method can assign the optimal reactive powers to all DERs by using the voltage sensitivity matrix. Moreover, it is cost effective in that the high-bandwidth communication is not required to deal with the power fluctuations from DERs. Also, note that the generations and load variations can be measurable by the distribution energy management system (DEMS). When additional controllers to regulate system voltage are designed and installed, the system voltage can be effectively maintained after disturbances [20]. However, this paper focuses on systematically assigning the reactive power set-points to pre-installed DERs without a design of additional controllers. Finally, the performance of the proposed method is compared with those of conventional reactive power compensation methods.
This paper is organized as follows. Section 2 introduces the measurement of voltage variation in both the steady-state and transient conditions. Also, the proposed reactive power management method based on the voltage sensitivity analysis is explained. Then, Section 3 describes the systematic procedure for applying the proposed method to the practical distribution system in South Korea. Thereafter, the effectiveness of the proposed method is verified by the time-domain simulation with the electromagnetic transient program (EMTP) in Section 4. Finally, conclusions are given in Section 5.
2. Minimization of Voltage Variation by Voltage Sensitivity Analysis
The purpose of this section is to derive the equations for sensitivity analysis, which are used to minimize the voltage variations by the proposed method. First, Section 2.1 defines the measurement of voltage variation in steady-state and transient conditions. To minimize the value of voltage variation, indicators are defined in Section 2.1. The equations of the proposed method by using the voltage sensitivity analysis are derived in Section 2.2.
2.1. Measurement of Voltage Variation
When the power fluctuation occurs in the distribution system, two factors, and in Equations (1) and (2) can be used to measure the voltage variation in steady-state and transient conditions, respectively. They are calculated as
where and represent the steady-state voltages before and after the system disturbance, respectively. and are the maximum and minimum voltages during the transient period, respectively. is the rated voltage of distribution system, to which the DERs are connected. During the events such as the DER’s sudden re-connection or disconnection, this study aims to minimize the voltage variation of system. In particular, the instances when the power generation from DERs suddenly stops due to the rapid weather change are focused. This is because the re-connection of new DERs to the distribution system does not cause the serious voltage variations by their ramp-rate control, which limits the rate of change in the magnitude of active power.
2.2. Reactive Power Management Based on Voltage Sensitivity Analysis
The voltage sensitivity analysis has been used for preventing overvoltage in the lines [7] and determining the operation set-point of ESS [21,22,23,24]. In this study, the values of and in Equations (1) and (2) are minimized by using the voltage sensitivity analysis when the several DERs are disconnected simultaneously. In particular, the value of mainly depends on the type of DER because the transient phenomena are reflected [25]. Also, it is further increased as the difference between and become larger. Thus, the corresponding voltage variation can be minimized by the proper reactive power compensation of DERs to make and equal as
where and are the corresponding and at bus k, respectively. and are the voltage in the condition generating active power before and after the DER is disconnected at bus k, respectively. and are the voltage deviations provided by reactive power compensation before and after the DER is disconnected at bus k, respectively. Consequently, it is possible to equalize the and by compensating for the proper reactive power to each DER with the consideration of difference between and . Assume that the power factor of DERs at bus k is 1. Then, and can be calculated as
where and are the active and reactive powers at bus i. and are the voltage magnitudes at buses i and j, respectively. and are the voltage phase angles at buses i and j, respectively. is the admittance of line from bus i to bus j. To generate and , the relation between the reactive power output of DER and the voltage deviation must be defined. Then, the voltage sensitivity matrix () gives the quantitative expression for this relation, and it can be derived by solving the non-linear power flow in Equations (4) and (5) by using the Newton-Raphson method.
where and are the sensitivities of bus voltage magnitudes with respect to the active and reactive powers, respectively. and are the sensitivities of bus voltage angles (, , , ). Variables, n and k denote the number of entire buses and the bus, to which the DER is connected, respectively. Please note that the only information of () is required to implement the proposed reactive power management method. In other words, the angle information is not necessary. Furthermore, the can be separated into the generation and load deviations. Accordingly, the required voltage deviations at buses with DER connections can be obtained as
where is the required voltage deviations in the buses, where the DERs are connected. and are the additional active and reactive power generation at bus k. and are the real and reactive power variations of load at bus k, respectively. The matrices, () and () are the re-constructed matrices from , and they are expressed as
where and () are the submatrices of , which are the active and reactive power sensitivities with respect to the voltage, respectively. and () are the submatrices of , which are the sensitivities to the real and reactive power variation of load. Also, the subscripts express the element in each submatrix. In this paper, because is mainly associated with the reactive power output from DERs, the submatrix, is focused. Then, is re-arranged as
where () represents the reactive power generation of buses, to which the DERs are connected. In addition, the power factor of system is assumed to remain constant when the DER is disconnected in bus k. Then, it can be expressed as
where and are the active power generation at bus k, and and are the reactive power generation at bus k, before and after the DER is disconnected, respectively. By considering (10), the relation between and can be derived as
where A () is the diagonal matrix with diagonal component, ak, which is the ratio of active power generation at bus k. For example, if all DERs are disconnected at bus k, the value of ak becomes 0. and are the reactive power generation of buses, to which DERs are connected, before and after the DERs disconnection, respectively. Consequently, from Equations (3), (9), and (11), the reactive power compensation, and by the proposed method is finally calculated as
where and () represent . Also, and () are the bus voltages with DER in the condition generating active power before and after it is disconnected, respectively.
3. Implementation of the Proposed Method in Practical Distribution System
After deriving the equations for the proposed method in Section 2, the following sub-section shows how to implement the proposed method with two phases. Then, the distribution system is modeled to verify the effectiveness of the proposed method. In particular, the practical distribution system of South Korea is described in Section 3.2. Also, the PQ-diagram of generators is described in Section 3.3. Case studies, which will be carried out in Section 4, are described in Section 3.4.
3.1. Implementation of the Proposed Reactive Power Management Method
The procedure to implement the proposed reactive power management method based on the voltage sensitivity analysis is shown in Figure 1. It consists of two phases. In the first phase, the system configuration of distribution system, the type of DERs, and their locations are firstly investigated. Also, the climatic conditions of given distribution area are considered. Then, it is possible to make all cases for the disconnection of DERs because the power outputs from PV and wind turbine depend on these environmental conditions. In particular, assume that many DERs are connected to the specific distribution line. If the serious fault occurs at this distribution line, these DERs might be disconnected simultaneously. In case of abnormal conditions, all the required actions are taken by the second phase of the proposed method.
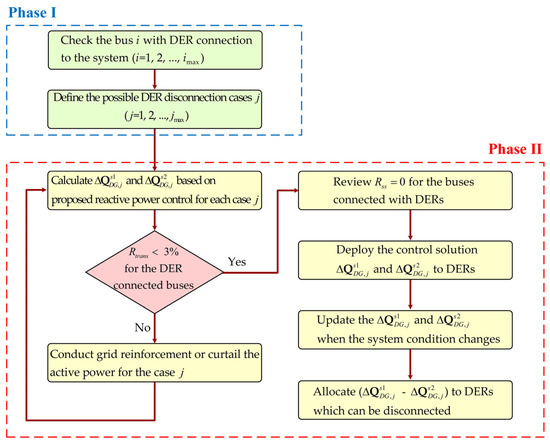
Figure 1.
Implementation of the proposed reactive power management method.
The second phase determines the proper reactive power generation for each DER by the voltage sensitivity analysis. It verifies all possible cases, and it calculates at the buses with DER in the distribution system. In South Korea, the technical regulation of DER interconnection to the distribution system requires to be less than 3% of its nominal value. If it exceeds 3%, the grid reinforcement or active power curtailment of each DER is unavoidable. After the proposed method checks whether satisfies this requirement, it commands the DERs to produce the reactive powers, and , by which the for the possible DERs disconnection is minimized. Then, when the system condition due to the disconnection of DERs is changed, the proposed method directly updates the matrices of and to minimize the voltage variations.
The details about the reactive power generations of DERs are given in Table 1. The proposed method commands the DERs, which can be disconnected, to produce the reactive powers as − . Other DERs, which can be remained, generate the reactive powers as . Then, the total reactive power generations are the same as . When the disconnection of DERs occurs, the remained DERs constantly generate the reactive powers as . The disconnected DERs do not generate the reactive powers. Therefore, the total reactive power generations are the same as .

Table 1.
Reactive power generations before and after disconnection.
Because values in and only mean the total reactive power generations at buses, DERs of each bus should share the reactive power generation. Therefore, the proposed method distributes the total reactive powers to each DER of the bus in proportion to capacity of each DER.
3.2. Distribution System with High Penetration Level of DER
The effectiveness of the proposed reactive power management method is verified by the several case studies on the practical “Y” distribution system in South Korea, as shown in Figure 2. The substation of 154/22.9 kV consists of two 45/60 MVA main transformers. There are two special lines (S1 and S2), which are used for the purpose of connecting DERs without load. In contrast, the general lines (G1 to G5) are used for both generation and load (L1 to L5) consumption. The power capacity of special lines and general lines are 20 MVA and 10 MVA, respectively. The PV generators (PV1 to PV5) are connected to the general lines while wind turbine generators (WT1 and WT2), which are doubly fed induction generators (DFIGs), are connected to the special lines.
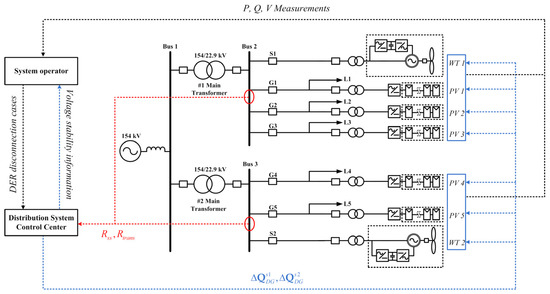
Figure 2.
Practical “Y” distribution system in South Korea with the PV and wind generators.
The specific parameters for “Y” substation are given in Table 2. For the purpose of simulating the high penetration of DERs, the capacity of PV generators and Type 3 wind turbine generators is modeled to be the same as the capacity of general lines and special lines. Also, the minimum load of the substation is selected to further increase the impact of DERs in voltage variations. The power factor of total load is assumed to be 0.99.
Table 2.
Generations, system parameters, and load of “Y” substation.
3.3. Maximum Reactive Power Generation of DER
The main contribution of the proposed method is to systematically assign the reactive power set-points to each controller of generators. Therefore, the dynamics of generators and the controller behavior are not mainly considered in this paper. The converter parameters and controller gains are given in the Appendix A. The maximum reactive power generation of DERs is limited by its rated apparent power and the amount of active power generation. Intermittent active power generation of DERs can influence the maximum reactive power generation. The maximum reactive power generation can be calculated as
where is the maximum reactive power generation, is the rated apparent power of inverter and is the active power generation of the DERs, respectively. is the maximum active power generation of DERs. In the paper, the capacity of inverter is set to 1.1 times the to maintain reliable reactive power generation. Also, it is noted that all DERs in “Y” substation generate the . The PQ-diagram of DERs is shown in Figure 3.
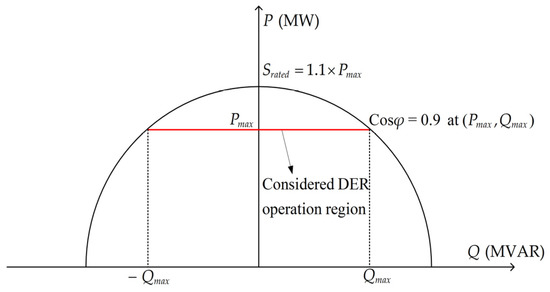
Figure 3.
The PQ-diagram of DERs by the proposed method.
3.4. Cases Studies
The cases for disconnection of DERs must be considered before the proposed method calculates the values of and for the “Y” substation. The possible cases for the application to this study are given in Table 3. They are selected to check the voltage stability of substation during transient period. For Cases 1 and 2, the DFIGs (WT1 and WT2) and PVs (PV1 to PV5) can be stopped or disconnected from the distribution system. In particular, Case 3 describes the simultaneous disconnection of both the DFIGs and PVs. Likewise, the system operator can determine the cases depending on the grid condition. It could be helpful to review the cases as many as possible.
Table 3.
DER disconnection cases for the “Y” substation.
4. Simulation Results
4.1. Case 1
When several DERs are disconnected at the same time, the simulation results are given to validate the proposed reactive power management method which minimizes the voltage variation. In detail, when the WT1 and WT2 are disconnected simultaneously at 1 s, the voltage variation in transient condition is shown in Figure 4 while the DERs do not generate reactive power. The values of and in bus 2 are 1.06% and 2.10%, and those in bus 3 are 0.97% and 1.99%, respectively. On the other hand, the proposed method calculates the values of reactive power compensations ( and ) by Equation (13). Then the proposed method also distributes the reactive power generations to DERs in each bus in proportion to the capacity of each DER by Table 1. In this case, total reactive power generations for each bus are 5.61 MVAR and 4.15 MVAR, respectively. After distributing the reactive power generations, the and can be significantly reduced as shown in Figure 5. The values of in buses 2 and 3 in Figure 2 are 0% and 0.01%, and the values of are 1.24% and 1.22%, respectively. The reason the values of for both buses are similar is because the identical type of DERs with the same capacity has disconnected. The results are summarized in Table 4.
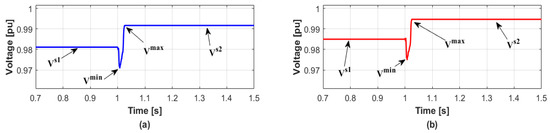
Figure 4.
Voltage responses without the reactive power compensation in Case 1. (a) Bus 2 (b) Bus 3.
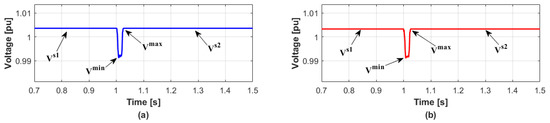
Figure 5.
Voltage responses with the proposed method in Case 1. (a) Bus 2 (b) Bus 3.
Table 4.
Comparison of voltage variations in Case 1.
To verify the validity of the proposed method, its performance is compared with those of the other three reactive power generation methods in Table 5. When WT1 and WT2 are disconnected at the same time, four methods generate the different reactive power outputs at buses 2 and 3. The Q(V) droop control (Method 2) determines the required reactive power according to the voltage state at the PCC, and its characteristic of the droop curve is depicted in [6]. The cos (P,V) method (Method 3) [7], which is the combination of the Q(V) control and PF(P) control, is also applied. Also, the constant power factor method (Method 4) is conducted, and its power factor is set to 1 to simulate the results without the reactive power compensation. As mentioned above, the proposed method determines the reactive power compensations at buses 2 and 3 as 5.61 MVAR and 4.15 MVAR. The Q(V) droop control determines the reactive power generations at buses 2 and 3 as 2.22 MVAR and 1.02 MVAR, respectively. Also, the cos (P,V) method outputs the reactive powers, at buses 2 and 3 as 7.12 MVAR and 5.70 MVAR, respectively. Finally, the constant power factor method outputs the zero reactive powers at buses 2 and 3.
Table 5.
Comparison of reactive power generation methods.
Total reactive power outputs from the DERs by four methods are shown in Figure 6a. Then, Figure 6b clearly shows the relationship between and , where the gets smaller as the value of goes to zero. In other words, both voltage variation can be minimized when is zero. Consequently, this result shows that the proposed method provides the very powerful solution to minimize the voltage variation for the severe contingency such as the sudden disconnection of DERs.
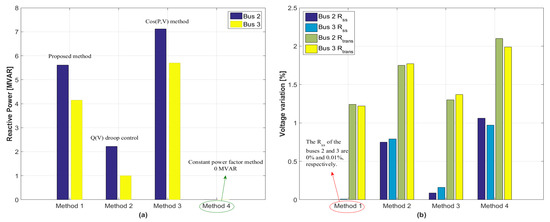
Figure 6.
Comparison results for minimization of voltage variation in Case 1. (a) Total reactive power generation at buses 2 and 3 (b) Voltage variation at buses 2 and 3.
4.2. Case 2
Likewise, in Case 1, the performance of the proposed method is evaluated when PV generators are disconnected for Case 2. The results are shown in Figure 7 and Figure 8, where entire PV generators in the “Y” substation are simultaneously disconnected at 1 s. Figure 7 shows the voltage variations in transient condition when the DERs do not generate reactive power. The values of and in bus 2 are 0.23% and 1.71%, and those in bus 3 are 0.16% and 1.44%, respectively.
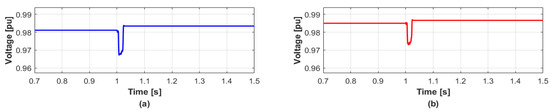
Figure 7.
Voltage responses without the reactive power compensation in Case 2. (a) Bus 2 (b) Bus 3.
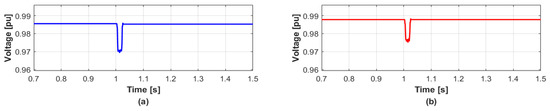
Figure 8.
Voltage responses with the proposed method in Case 2. (a) Bus 2 (b) Bus 3.
In the same manner, the proposed method calculates the reactive power generations to DERs by Equation (13) and Table 1. In this case, total reactive power generations for each bus are 1.02 MVAR and 0.47 MVAR, respectively. After distributing the reactive power generations, the and can be significantly reduced as shown in Figure 8. The values of in buses 2 and 3 are 0.02% and 0%, and the values of are 1.66% and 1.33%, respectively. The voltage variations in Figure 8 is not much different from that shown in Figure 7. The reason is that the of Figure 7 is close to zero without the reactive power compensation. Bus 2 has the higher rate of than that of bus 3 because the larger amount of DER is disconnected in bus 2. The results are summarized in Table 6.
Table 6.
Comparison of voltage variations in Case 2.
Like Case 1, four methods are simulated with different reactive power generations at buses 2 and 3, and the disconnection of PV generators occurs at the same time for each method. The proposed method determines the reactive power generations at buses 2 and 3 as 1.02 MVAR and 0.47 MVAR, respectively. The Q(V) droop control determines the reactive power generations at buses 2 and 3 as 2.22 MVAR and 1.02 MVAR, respectively. Also, the cos (P,V) method outputs the reactive powers, at buses 2 and 3 as 7.12 MVAR and 5.70 MVAR, respectively. Finally, the constant power factor method outputs the zero reactive powers at buses 2 and 3.
Total reactive power outputs from the DERs by four methods are shown in Figure 9a. Also, it is observed from the result of Figure 9b that the excessive reactive power compensation does not always contribute the voltage stability of the system. The method 3 of Figure 9b has the highest value of voltage variation even though the DERs generate the largest amount of reactive power. These results show that the proposed method yields the best voltage stability among four methods with the minimum reactive power generation. The validity of the proposed method is verified for the same type of the DERs disconnection in Cases 1 and 2.
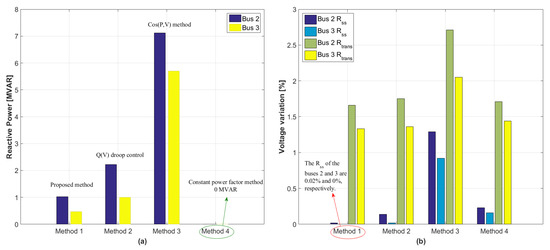
Figure 9.
Comparison results for minimization of voltage variation in Case 2. (a) Total reactive power generation at buses 2 and 3 (b) Voltage variation at buses 2 and 3.
4.3. Case 3
Finally, the proposed method is applied to the simultaneous disconnection of the DFIGs and PVs. The total disconnection capacity of the DERs is same with Case 1. On the other hand, and are unequal to the those of values in Case 1 because of the different voltage sensitivities of DFIGs and PVs relative to the main transformer. The results are shown in Figure 10 and Figure 11, where the PV1, PV2, and WT2 in the “Y” substation are disconnected simultaneously at 1 s. Figure 10 shows the voltage variations in transient condition when DERs do not generate reactive power. The values of and in bus 2 are 0.33% and 1.36%, and those in bus 3 are 0.87% and 1.89%, respectively. Also, similarly to Cases 1 and 2, total reactive power generations for each bus are 1.55 MVAR and 4.14 MVAR, respectively. After distributing the reactive power generations, the and can be significantly reduced as shown in Figure 11. The becomes zero, and the values of in buses 2 and 3 are successfully minimized by the proposed method. The results are summarized in Table 7.
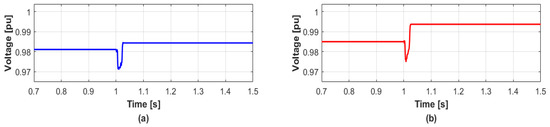
Figure 10.
Voltage responses without the reactive power compensation in Case 3. (a) Bus 2 (b) Bus 3.
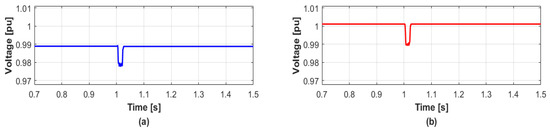
Figure 11.
Voltage responses with the proposed method in Case 3. (a) Bus 2 (b) Bus 3.
Table 7.
Comparison of voltage variations in Case 3.
Like Cases 1 and 2, four methods are simulated with different reactive power generations at buses 2 and 3. The proposed method generates the reactive power compensations at buses 2 and 3 as 1.55 MVAR and 4.14 MVAR, respectively. The Q(V) droop control determines the reactive power generation at buses 2 and 3 as 2.22 MVAR and 1.02 MVAR, respectively. Also, the cos (P,V) method outputs the reactive powers, at buses 2 and 3 as 7.12 MVAR and 5.70 MVAR, respectively. Finally, the constant power factor method outputs the zero reactive powers at buses 2 and 3.
The total reactive power outputs from the DERs by four methods are shown in Figure 12a. Also, it is observed from the result of Figure 12b that the proposed method guarantees the smallest values of and . In summary, the result of Case 3 shows that the proposed method is still valid to enhance the voltage stability even if different kinds of DERs are simultaneously disconnected. Consequently, the effectiveness of the proposed method is verified by all cases.
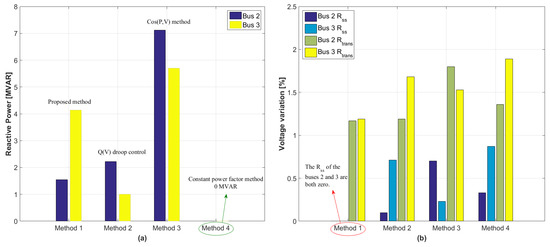
Figure 12.
Comparison results for minimization of voltage variation in Case 3. (a) Total reactive power generation at buses 2 and 3 (b) Voltage variation at buses 2 and 3.
4.4. Total Harmonic Distortion of System
As the penetration of power converter-based DERs increases, the total harmonic distortion (THD) of the system could be worsen. Therefore, the THD of the proposed method should be compared with the other methods in Table 5. It is noted that the harmonic current injection at the PCC shall not exceed the 5% of fundamental current [11]. The THD of injected current can be defined as
where h is the harmonic order, Ih is the harmonic current and I1 is the fundamental current. The THDI of the “Y” substation is calculated at bus 2, because it has a higher penetration of DERs than that of bus 3. The comparison results for all case studies are given in Table 8. The results show that the proposed method has the similar performance as other methods. Also, the THDI of the proposed method is within 5% for all cases.
Table 8.
Comparison of total harmonic distortion for each method.
4.5. Changes of Voltage Sensitivity of System
As mentioned before, numerous situations of DER disconnection were simulated to prove the performance of the proposed method. However, the voltage sensitivity of the “Y” substation with respect to the reactive power generation of DERs is not changed in the previous cases. To verify the effectiveness of the proposed method when voltage sensitivity varies with respect to reactive powers, several load changes are assumed in the “Y” substation, as shown in Figure 13. Total sum of initial real and reactive loads is set to 29 MW and 4.15 MVAR, respectively, as described in Table 2. First, the total load is increased to 38 MW and 5.41 MVAR at 1 s. Then, the load is decreased to 35 MW and 4.98 MVAR at 3 s, respectively. The disconnection of DERs occurs twice after each load change, as shown in Figure 13. PV2, PV3 and PV4 are disconnected at 2 s, and WT1 and WT2 are disconnected at 4 s. Please note that the transformer tap changer regulates the system voltage closer to 1 pu before the first disconnection occurs at 2 s. The proposed reactive management method recalculates voltage sensitivity when the load changes, and it determines proper reactive power outputs to each DER. It is clearly shown that the proposed method further minimizes the voltage variation than other methods, as shown in Figure 14. For example, for the disconnection of PV2, PV3 and PV4, the proposed method assigns the reactive power generations at buses 2 and 3 as 0.85 MVAR and 0.69 MVAR, respectively. Then, the values of in buses 2 and 3 become zero, and the values of are 0.94% and 0.56%, respectively. Likewise, for the disconnection of WT1 and WT2, the proposed method assigns the reactive power generations at buses 2 and 3 as 0.90 MVAR and 2.28 MVAR, respectively. Then, the values of in buses 2 and 3 also become zero, and the values of are 1.20% and 1.17%, respectively. Please note that the system voltage for all methods is changed after the first DERs disconnections, as shown in Figure 14a,b. Nonetheless, the proposed method can recalculate the appropriate reactive power generations of DERs by voltage sensitivity analysis and hence it guarantees the minimum voltage variations, as shown in Figure 14c,d. On the other hand, the performance of the other methods are inconsistent with respect to the different system condition. When the WT1 and WT2 are disconnected, the cos (P,V) method shows the best performance for minimizing voltage variations among three conventional methods. However, when the PV2, PV3 and PV4 are disconnected, the cos (P,V) method shows the worst performance for minimizing voltage variations. The results are summarized in Table 9 and Table 10.
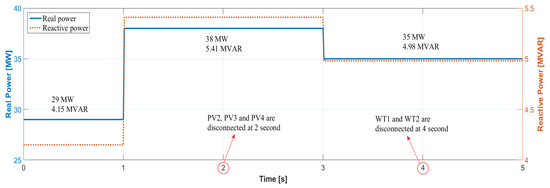
Figure 13.
Total load changes of the “Y” substation.
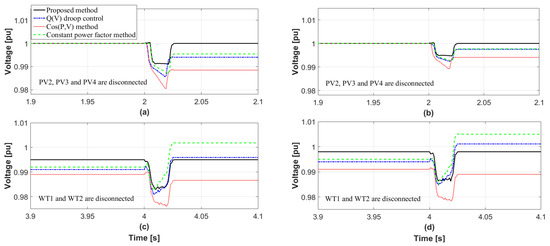
Figure 14.
Comparison results for voltage responses of buses 2 (a,c) and 3 (b,d).
Table 9.
Comparison of voltage variations when PV2, PV3 and PV4 are disconnected.
Table 10.
Comparison of voltage variations when WT1 and WT2 are disconnected.
4.6. Increase of Penetration of DERs with Proposed Method
In South Korea, the voltage variation by DERs disconnection is the critical factor when the system operator allows DERs interconnection. Please note that the Rtrans should be less than 3%. In [25], the DFIGs have higher value of Rtrans than that of PV generators with the same penetration level. The penetration level of DERs can be defined as.
The effectiveness of the proposed method is verified by increasing the penetration of DFIGs in the #1 Main Transformer of “Y” substation. The capacity of #1 Main Transformer is 60 MVA, and the Rtrans is calculated as the penetration level of DFIGs is increased up to 100%. The PV generators in #1 Main Transformer are replaced by the DFIGs to simulate the impact of penetration of DFIGs. The results are shown in Figure 15.
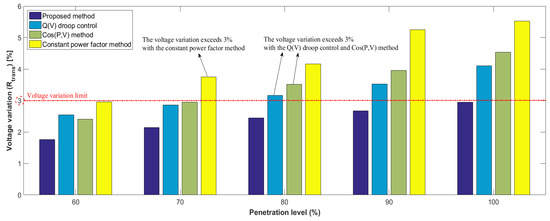
Figure 15.
Comparison results for voltage variations with the increasing penetration of DERs.
In the penetration level of 70%, the Rtrans of constant power factor method exceeds 3%. Furthermore, the Rtrans exceeds 3% at the 80% penetration level for all control methods except for the proposed method. The proposed method keeps the Rtrans within 3% even at the 100% penetration level.
5. Conclusions
This paper proposed the novel reactive power management method for minimizing voltage variation based on the voltage sensitivity analysis on the practical distribution system of South Korea. The proposed reactive power management method was implemented by calculating reactive power compensation of each distributed energy resource (DER) before and after the disconnection of DERs. With the appropriate reactive power compensation to the generators, the voltage variations in both steady-state and transient conditions could be minimized.
To verify the effectiveness of the proposed reactive power management method, several case studies were conducted with consideration for the type of the DERs by using the electromagnetic transient program (EMTP) simulation. The results showed that the proposed method effectively reduced the voltage variations when compared to the conventional reactive power control methods for all cases. Also, the performance of the proposed method was still effective even though the voltage sensitivity with respect to reactive powers was changed. Furthermore, the penetration of DERs increased by using the proposed method. It minimized the voltage variations even though the penetration of DERs in substation increased. However, the recent technology such as distribution energy manage system (DEMS) is required to measure the generations and load variations. The accuracy of the proposed method can be increased as the advanced metering infrastructure (AMI) is being installed. Therefore, it is expected that the proposed method based on the voltage sensitivity analysis could enable the high penetration of DERs to distribution systems by minimizing voltage variations due to the disconnection of DERs.
Author Contributions
The research was conducted in collaboration with all authors. S.K. wrote the paper; S.K. and J.K. performed the simulations; J.-W.P. and S.-M.B. supervised the paper. All authors have read and approved the manuscript.
Funding
This work was supported in part by Korea Electric Power Corporation (grant number: R18XA06-80) and in part by the Power Generation and Electricity Delivery Core Technology Program of the Korea Institute of Energy Technology Evaluation and Planning (KETEP) funded by the Ministry of Trade, Industry and Energy, Republic of Korea (grant number: 20171220100330).
Conflicts of Interest
The authors declare no conflict of interest.
Abbreviations
| AMI | advanced metering infrastructure |
| DER | distributed energy resource |
| DEMS | distribution energy management system |
| DFIG | doubly-fed induction generator |
| EMTP | electromagnetic transient program |
| ESS | energy storage system |
| OLTC | on-load tap changer |
| PCC | point of common coupling |
| PV | photovoltaic |
| SI | smart inverter |
| THD | total harmonic distortion |
Nomenclature
| Diagonal matrix with diagonal component ak | |
| Ratio of active power generation between and | |
| Deviation of active power generation at bus k | |
| Deviation of reactive power generation at bus k | |
| Active power variation of load at bus k | |
| Reactive power variation of load at bus k | |
| Reactive power generation at bus k, before the DER is disconnected | |
| Reactive power generation at bus k, after the DER is disconnected | |
| Reactive power generations of buses, to which the DERs are connected | |
| Reactive power generation of buses with DER connection, before the DER is disconnected | |
| Reactive power generation of buses with DER connection, after the DER is disconnected | |
| Voltage deviations at entire buses | |
| Voltage deviations at buses with DER connection | |
| Voltage deviation provided by reactive power compensation before the DER is disconnected | |
| Voltage deviation provided by reactive power compensation after the DER is disconnected | |
| Voltage phase angle at bus i | |
| Voltage phase angle at bus j | |
| Harmonic order | |
| Harmonic current of h th order | |
| Number of entire buses | |
| Active power generation of DERs | |
| Active powers at bus i | |
| Maximum active power generation of DERs | |
| Active power generation at bus k, before the DER is disconnected | |
| Active power generation at bus k, after the DER is disconnected | |
| Reactive powers at bus i | |
| Maximum reactive power generation | |
| Voltage variation in steady-state condition | |
| Voltage variation in transient condition | |
| Rated apparent power of the inverter | |
| Voltage sensitivity matrix | |
| Sensitivities of bus voltage magnitudes with respect to the active power | |
| Sensitivities of bus voltage magnitudes with respect to the reactive power | |
| Sensitivities of bus voltage angles with respect to the active power | |
| Sensitivities of bus voltage angles with respect to the reactive power | |
| Reconstructed matrix of S, which is voltage sensitivity matrix of DERs | |
| Reconstructed matrix of S, which is voltage sensitivity matrix of loads | |
| Submatrix of SDG, which is active power sensitivities with respect to the voltage | |
| Submatrix of SDG, which is reactive power sensitivities with respect to the voltage | |
| Submatrix of SLoad, which is active power sensitivities with respect to the voltage | |
| Submatrix of SLoad, which is reactive power sensitivities with respect to the voltage | |
| The before the DER is disconnected | |
| The after the DER is disconnected | |
| Voltage at bus i | |
| Voltage at bus j | |
| Steady state voltage before the occurrence of system disturbance | |
| Steady state voltage after the occurrence of system disturbance | |
| Maximum voltage during the transient period | |
| Minimum voltage during the transient period | |
| Rated voltage of the distribution system | |
| The at bus k | |
| The at bus k | |
| Voltage in the condition generating active power before the DER is disconnected | |
| Voltage in the condition generating active power after the DER is disconnected | |
| DER connected bus voltages in the condition of generating active power, before the specific DER is disconnected | |
| DER connected bus voltages in the condition of generating active power, after the specific DER is disconnected | |
| Admittance of line from bus i to j |
Appendix A
Table A1.
Converter parameters and controller gains for PV inverter.
Table A1.
Converter parameters and controller gains for PV inverter.
| Parameters of PV Inverter | |
|---|---|
| Frequency | 60 Hz |
| Step-up transformer | 22.9/0.38 kV, 100 MVA |
| L filter | 1 mH |
| DC source voltage | 40 V |
| DC-link capacitance | 1500 mF |
| Power controller proportional gain | 100 |
| Power controller integral gain | 10 |
| Reactive power controller proportional gain | 100 |
| Reactive power controller integral gain | 10 |
| d-axis current controller proportional gain | 10 |
| d-axis current controller integral gain | 1 |
| q-axis current controller proportional gain | 10 |
| q-axis current controller integral gain | 1 |
| Ls | 1.6 mH |
Table A2.
Converter parameters and controller gains for grid-side converter of DFIGs.
Table A2.
Converter parameters and controller gains for grid-side converter of DFIGs.
| Grid-Side Converter of DFIGs | |
|---|---|
| Rated AC voltage | 0.69 kV |
| Base DC voltage of DC bus | 1.45 kV |
| d-axis PI controller proportional gain | 2 |
| d-axis PI controller time constant | 0.01 |
| q-axis PI controller proportional gain | 2 |
| q-axis PI controller time constant | 0.01 |
| DC voltage PI controller proportional gain | 2 |
| DC voltage PI controller time constant | 0.01 |
| Grid side converter PLL integral gain | 500 |
| Grid side converter PLL proportional gain | 2000 |
Table A3.
Converter parameters and controller gains for rotor-side converter of DFIGs.
Table A3.
Converter parameters and controller gains for rotor-side converter of DFIGs.
| Rotor-Side Converter of DFIGs | |
|---|---|
| Rated AC voltage | 0.69 kV |
| d-axis PI controller proportional gain | 2 |
| d-axis PI controller time constant | 0.01 |
| q-axis PI controller proportional gain | 2 |
| q-axis PI controller time constant | 0.01 |
| Rotor side converter PLL integral gain | 200 |
| Rotor side converter PLL proportional gain | 2000 |
References
- Shayani, R.A.; Oliveira, M.A.G.D. Photovoltaic Generation Penetration Limits in Radial Distribution Systems. IEEE Trans. Power Syst. 2011, 26, 1625–1631. [Google Scholar] [CrossRef]
- Bank, J.; Mather, B.; Keller, J.; Coddington, M. High Penetration Photovoltaic Case Study Report. National Renewable Energy Lab (NREL). Available online: https://www.nrel.gov/docs/fy13osti/54742.pdf (accessed on 23 January 2019).
- Park, W.J.; Sung, B.C.; Song, K.-B.; Park, J.-W. Parameter Optimization of SFCL With Wind-Turbine Generation System Based on Its Protective Coordination. IEEE Trans. Appl. Supercond. 2011, 21, 2153–2156. [Google Scholar] [CrossRef]
- Long, C.; Ochoa, L.F. Voltage Control of PV-Rich LV networks: OLTC-Fitted Transformer and Capacitor Banks. IEEE Trans. Power Syst. 2016, 31, 4016–4025. [Google Scholar] [CrossRef]
- Varela, J.; Hatziargyriou, N.; Puglisi, L.J.; Rossi, M.; Abart, A.; Bletterie, B. The IGREENGrid Project: Increasing Hosting Capacity in Distribution Grids. IEEE Power Energy Mag. 2017, 15, 30–40. [Google Scholar] [CrossRef]
- Demirok, E.; González, P.C.; Frederiksen, K.H.B.; Sera, D.; Rodriguez, P.; Teodorescu, R. Local Reactive Power Control Methods for Overvoltage Prevention of Distributed Solar Inverters in Low-Voltage Grids. IEEE J. Photovolt. 2011, 1, 174–182. [Google Scholar] [CrossRef]
- Safayet, A.; Fajri, P.; Husain, I. Reactive Power Management for Overvoltage Prevention at High PV Penetration in a Low-Voltage Distribution System. IEEE Trans. Ind. Appl. 2017, 53, 5786–5794. [Google Scholar] [CrossRef]
- Vasquez, J.C.; Mastromauro, R.A.; Guerrero, J.M.; Liserre, M. Voltage Support Provided by a Droop-Controlled Multifunctional Inverter. IEEE Trans. Ind. Electron. 2009, 56, 4510–4519. [Google Scholar] [CrossRef]
- Kim, Y.-S.; Kim, G.-H.; Lee, J.-D.; Cho, C. New Requirements of the Voltage/VAR Function for Smart Inverter in Distributed Generation Control. Energies 2016, 9, 929. [Google Scholar] [CrossRef]
- Malekpour, A.R.; Pahwa, A. A Dynamic Operational Scheme for Residential PV Smart Inverters. IEEE Trans. Smart Grid 2017, 8, 2258–2267. [Google Scholar] [CrossRef]
- DeBlasio, R.; Photovoltaics, D.G.; Storage, E. IEEE Application Guide for IEEE Std 1547, IEEE Standard for Inter-connecting Distributed Resources with Electric Power Systems; IEEE Std 1574.2-2008; The Institute of Electrical and Electronics Engineers: New York, NY, USA, 2009. [Google Scholar]
- Trindade, F.C.L.; Ferreira, T.S.D.; Lopes, M.G.; Freitas, W. Mitigation of Fast Voltage Variations During Cloud Transients in Distribution Systems with PV Solar Farms. IEEE Trans. Power Deliv. 2017, 32, 921–932. [Google Scholar] [CrossRef]
- Alam, M.J.E.; Muttaqi, K.M.; Sutanto, D. A Multi-Mode Control Strategy for Var Support by Solar PV Inverters in Distribution Networks. IEEE Trans. Power Syst. 2015, 30, 1316–1326. [Google Scholar] [CrossRef]
- Giannitrapani, A.; Paoletti, S.; Vicino, A.; Zarrilli, D. Optimal Allocation of Energy Storage Systems for Voltage Control in LV Distribution Networks. IEEE Trans. Smart Grid 2017, 8, 2859–2870. [Google Scholar] [CrossRef]
- Jalali, A.; Aldeen, M. Risk-Based Stochastic Allocation of ESS to Ensure Voltage Stability Margin for Distribution Systems. IEEE Trans. Power Syst. 2019, 34, 1264–1277. [Google Scholar] [CrossRef]
- Wang, L.; Bai, F.; Yan, R.; Saha, T.K. Real-Time Coordinated Voltage Control of PV Inverters and Energy Storage for Weak Networks With High PV Penetration. IEEE Trans. Power Syst. 2018, 33, 3383–3395. [Google Scholar] [CrossRef]
- Zhao, H.; Hong, M.; Lin, W.; Loparo, K.A. Voltage and Frequency Regulation of Microgrid With Battery Energy Storage Systems. IEEE Trans. Smart Grid 2019, 10, 414–424. [Google Scholar] [CrossRef]
- Zeraati, M.; Golshan, M.E.H.; Guerrero, J.M. Distributed Control of Battery Energy Storage Systems for Voltage Regulation in Distribution Networks With High PV Penetration. IEEE Trans. Smart Grid 2018, 9, 3582–3593. [Google Scholar] [CrossRef]
- Bahramipanah, M.; Torregrossa, D.; Cherkaoui, R.; Paolone, M. A Decentralized Adaptive Model-Based Real-Time Control for Active Distribution Networks Using Battery Energy Storage Systems. IEEE Trans. Smart Grid 2018, 9, 3406–3418. [Google Scholar] [CrossRef]
- Mohammadi, F. Power Management Strategy in Multi-Terminal VSC-HVDC System. In Proceedings of the National Conference on Applied Research in Electrical, Mechanical, Computer and IT Engineering, Schiraz, Iran, 4 October 2018. [Google Scholar]
- Aghatehrani, R.; Kavasseri, R. Reactive Power Management of a DFIG Wind System in Microgrids Based on Voltage Sensitivity Analysis. IEEE Trans. Sustain. Energy 2011, 2, 451–458. [Google Scholar] [CrossRef]
- Wang, L.; Liang, D.H.; Crossland, A.F.; Taylor, P.C.; Jones, D.; Wade, N.S. Coordination of Multiple Energy Storage Units in a Low-Voltage Distribution Network. IEEE Trans. Smart Grid 2015, 6, 2906–2918. [Google Scholar] [CrossRef]
- Hashemi, S.; Østergaard, J. Efficient Control of Energy Storage for Increasing the PV Hosting Capacity of LV Grids. IEEE Trans. Smart Grid 2018, 9, 2295–2303. [Google Scholar]
- Wang, P.; Liang, D.H.; Yi, J.; Lyons, P.F.; Davison, P.J.; Taylor, P.C. Integrating Electrical Energy Storage Into Coordinated Voltage Control Schemes for Distribution Networks. IEEE Trans. Smart Grid 2014, 5, 1018–1032. [Google Scholar] [CrossRef]
- Kim, J.; Baek, S.-M.; Park, J.-W. Allowable Capacity Estimation of DGs for High Renewable Penetration to Distribution System. In Proceedings of the IEEE Ind. Appl. Soc. Annul. Meeting, Portland, OR, USA, 23–27 September 2018. [Google Scholar]
© 2019 by the authors. Licensee MDPI, Basel, Switzerland. This article is an open access article distributed under the terms and conditions of the Creative Commons Attribution (CC BY) license (http://creativecommons.org/licenses/by/4.0/).