Article

Reduction in Sunshine Duration and Related Factors over Mainland China during 1961–2016

1
Key Laboratory of Geomatics and Digital Technology of Shandong Province, Shandong University of Science and Technology, Qingdao 266590, China
2
College of Geomatics, Shandong University of Science and Technology, Qingdao 266590, China
3
Nuclear and Radiation Safety Center, Ministry of Ecology and Environment, Beijing 100082, China
*
Author to whom correspondence should be addressed.
Energies 2019, 12(24), 4718; https://doi.org/10.3390/en12244718
Submission received: 25 November 2019 / Revised: 5 December 2019 / Accepted: 9 December 2019 / Published: 11 December 2019
(This article belongs to the Section B: Energy and Environment)

Abstract

:
As a kind of renewable energy, the development and utilization of solar energy is valued by many countries. Sunshine duration (SD), as an important factor to measure solar energy, has also been widely discussed as relevant in terms of distribution and variation. The spatial patterns and variation trends in SD and related factors (wind speed, precipitation, relative humidity, mean temperature and elevation) over mainland China have been studied based on data from 569 meteorological stations during 1961–2016. The results indicated that annual SD decreased significantly at the rate of −40.7 h/10a over mainland China and the decline trend was the most pronounced in the 1980s. Seasonally, the decline rate in SD was the largest in summer (−16.8 h/10a), followed by winter (−9.9 h/10a), autumn (−9.5 h/10a) and spring (−4.5 h/10a), respectively. Spatially, the decline trend in SD was significantly higher in the eastern region than in the western region during 1961–2016, especially in North China. SD was positively correlated with wind speed (R = 0.76); however, it was negatively correlated with mean temperature (R = −0.60) and precipitation (R = −0.41). Moreover, altitude and population density may affect the values and variations of annual SD over mainland China. This study provides a new perspective for the reduction of SD in mainland of China. The drastic changes in SD, such as abrupt changes and sudden decreases, were closely related to volcanic eruptions. Among them, the mean mutation and sudden decrease of SD in the 1980s were due to the long-time weakening of the aerosol accumulated by multiple volcanic eruptions. After the volcanic eruptions in the early 1990s, volcanic aerosols were gradually dissipating, resulting in a small rebound in SD.

1. Introduction

Solar radiation that reaches the planet is the main energy source on the Earth’s surface, which affects the environment, hydrology and human activities significantly [1,2]. Recently, the whole energy sector has moved towards the use of low-carbon applications [3,4]. As a renewable clean energy source, photovoltaic (PV) energy can reduce the depletion of the ozone layer and climate change caused by power generation from conventional sources [5,6]. Photovoltaic electricity is growing rapidly and accounted for a steady increase in the proportion of total renewable energy production [4]. China’s photovoltaic installations accounts for almost 34% of the total world’s installed capacity with more than twice that of Japan (with the second largest PV installation capacity in the world) [5]. In order to ensure the stable development of PV in China, it is necessary to study the distribution and change of solar energy [7].
Since the 1950s, solar radiation reaching the surface of the Earth has been extremely unstable, showing a marked downward trend until the late 1980s (global dimming) [8,9]. Recent studies have indicated that there was no dimming in many parts of the world in the 1990s [8,9,10]. Additionally, abundant evidence has shown the transition “from dimming to brightening” [2,11]. In China, the variation trend of solar radiation is similar to that elsewhere in the world [9,12]. However, due to the high costs of installation and the difficulty in maintenance of the measuring instruments [13], solar radiation stations are less. The change of radiation stations from 1991 to 1993 has caused obvious instability in the time series recorded by solar radiation in China [14]. Therefore, only a few solar radiation stations are available in China. The limited data from these stations make it difficult to meet the needs of research, especially for the national solar radiation research.
Compared with solar radiation, sunshine duration (SD) is considered to be a good substitute for its wider spatial distribution and longer time spans [15]. SD is defined as the amount of time when the solar disk is above the horizon and is not obscured by natural obstacles (such as clouds and fog), which is one of the oldest types of radiation measurements [16,17]. SD is very sensitive to obstructions such as clouds, especially at sunrise and sunset or in winter [18]. The instrument for measuring SD has not been changed since 1954, and the material (light-sensitive paper) used to measure SD is replaced every day [14,15]. Therefore, this approach hardly suffers from the problem of instrument sensitivity drift [19].
Over the past half century, there was a general decline in SD in the United States [20,21], Japan [22], Europe [23,24] and China [25,26,27]. The decline has also occurred over much of China, especially in northern and southeastern China as well as the Yangtze River Delta [28]. SD decreases at the highest rate in summer, followed by winter, autumn and spring [15,29]. Moreover, an evident mutation in SD was detected around 1980 in the Wei River Basin [30] and Tibet Plateau [31].
A number of studies have discussed the possible factors related to the decline in SD [14,32]. Cloud cover and aerosols have significant effects on SD in weakening the incident sunlight [33,34]. In addition, the relationship between SD and various meteorological factors have been studied and good results have been obtained [20]. Wind speed (WS) showed a steady downward trend in the 1950s, which is consistent with the declining trend of SD [35]. There is also a significant positive correlation between SD and wind speed in the north and southwest of China [35]. SD is negatively correlated with mean temperature and precipitation. Relative humidity also shows a weak correlation with SD [36]. The changes in these meteorological factors have certain relationships with SD [37,38]. Recently, researchers have found that volcanic eruptions have a definite effect on SD [39,40]. Sun et al. find that China’s low-sunshine years coincided with the years of major volcanic eruptions [31]. So far, the study of SD in China has focused on the whole mainland China or specific regions. However, due to the large spatial differentiation in China, the correlation of influence of diverse factors on various regions is also different. Therefore, it is necessary to study the factors related to the SD in mainland China and each sub-region.
Therefore, the objectives of this present study are to address: (1) the changes of SD in mainland China and different climate regions, and (2) potential factors that have specific relationships with SD across different regions. To achieve these objectives, the spatial patterns and temporal tendencies (decadal, annual and seasonal) of SD are analyzed in mainland China. In addition, the relationships between SD and factors (wind speed, precipitation, relative humidity, mean temperature and elevation) are studied across mainland China and various climate regions. Finally, the abrupt changes of annual SD and the possible effects of volcanic eruptions on the rapid decline of SD in the 1980s are also discussed.

2. Materials and Methods
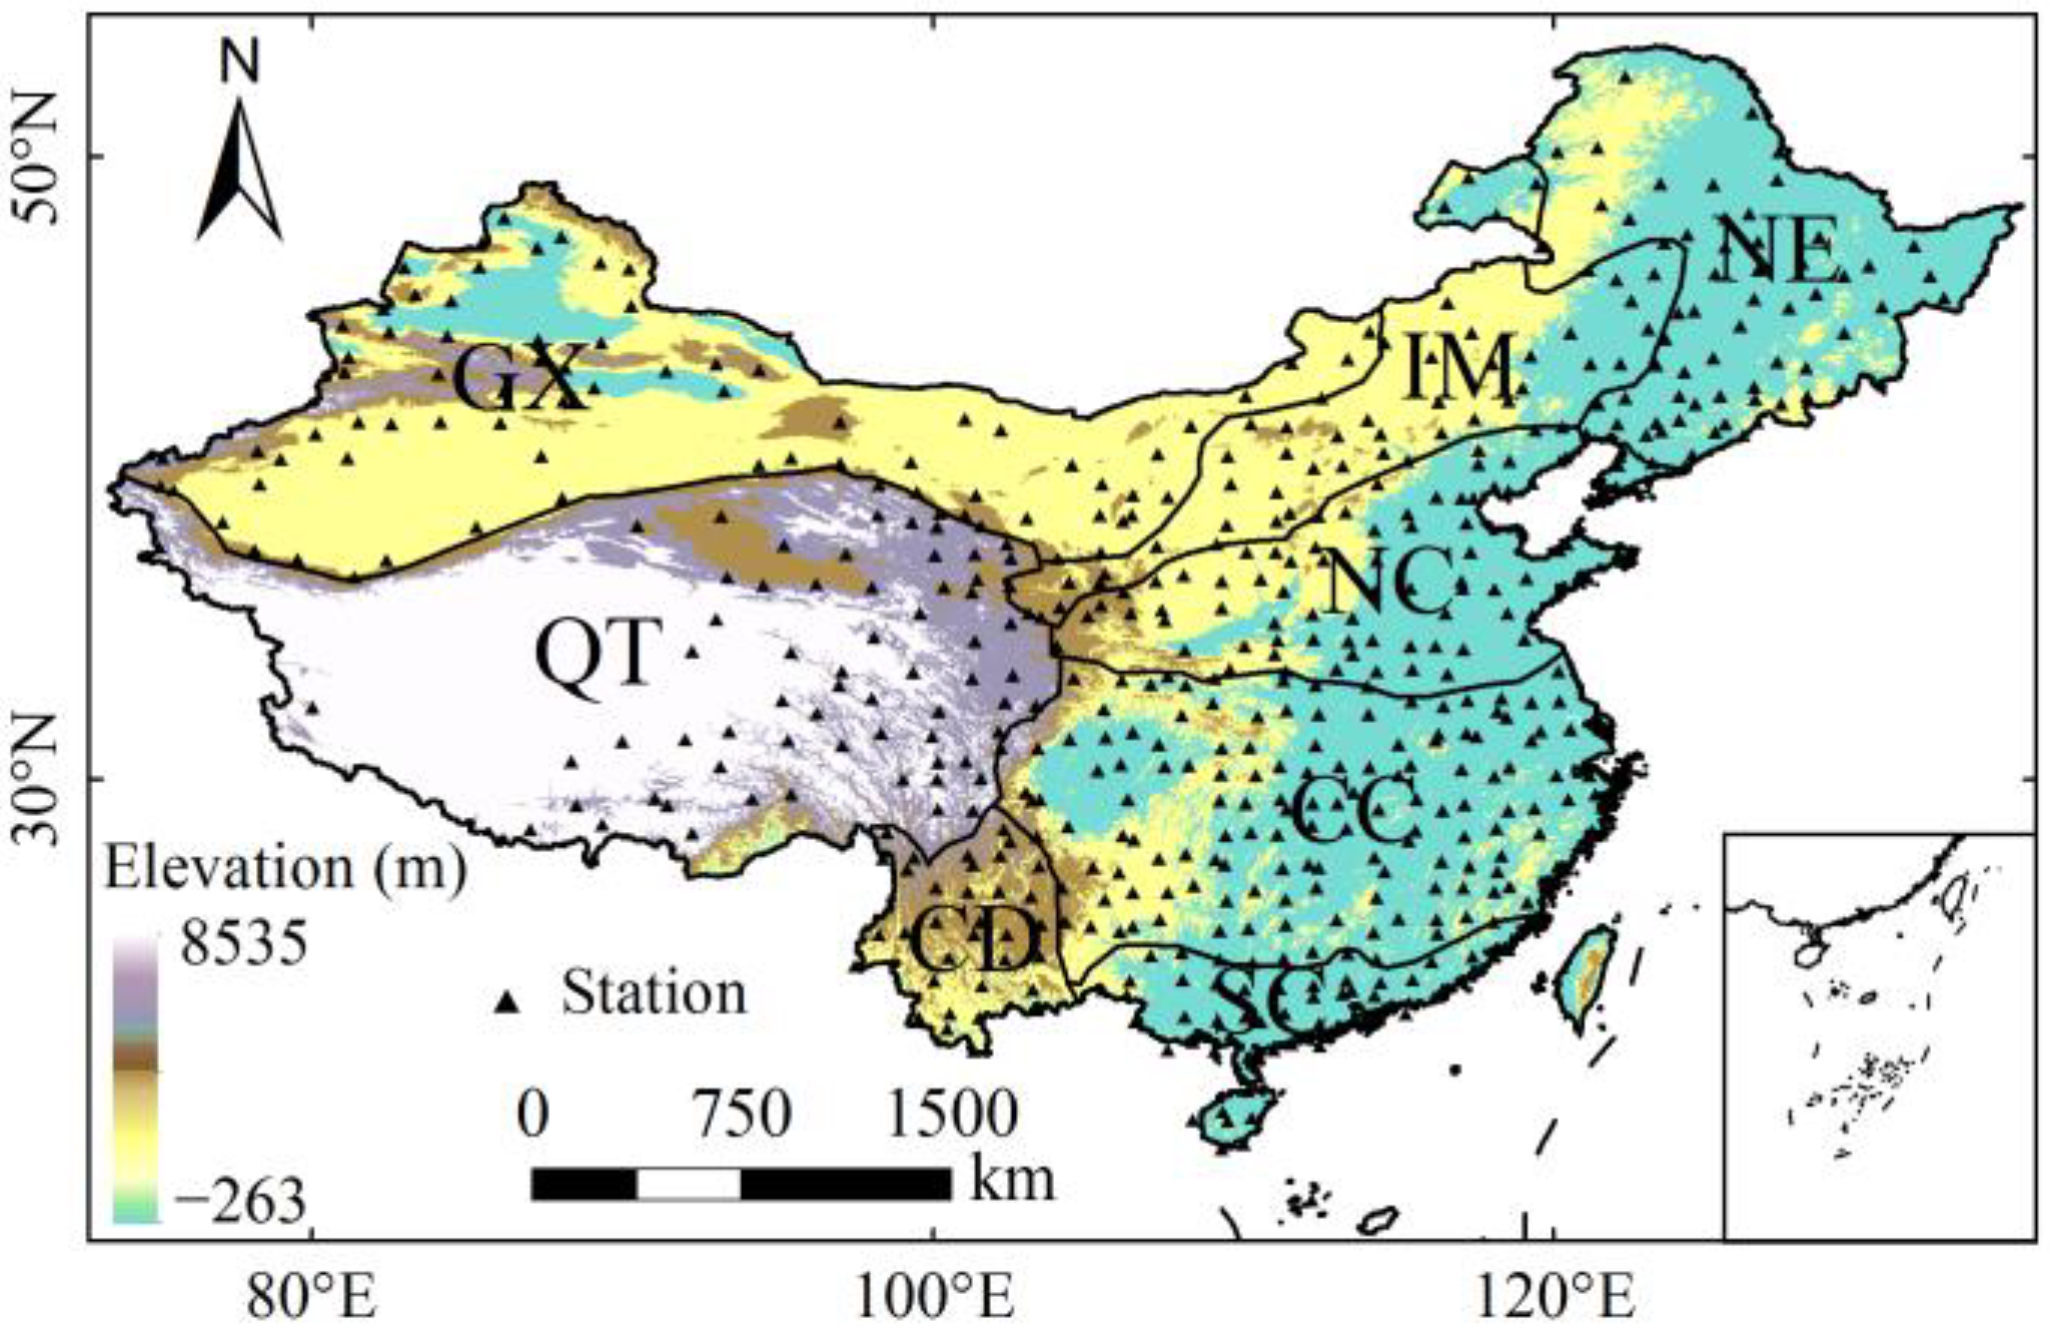
2.1. Study Area

This study is conducted over mainland China, located within 73°41′–135°02′ E and 18°10′–53°33′ N. The geography of mainland China is variable and the topography has obvious regional differences. The climate types of mainland China include monsoon climate, continental climate, alpine climate and so on [41].
The spatial distribution of annual precipitation is decreasing from the southeast coast to northwest inland China. Because of the large span between north and south and the influence of the Siberian cold current in winter, the severe cold in the north and the temperature difference between the north and the south is great. In summer, high temperature is common in China due to high latitudes in the north, with longer days and direct exposure to the sun in the south [41]. The spatial heterogeneity of geographical factors is greater due to the great difference in climate. Thus, taking the heat, moisture indicators and China’s major climatic regions into account, we divide mainland China into eight climate regions (Table 1). Figure 1 shows the geographical details of each partition.

2.2. Materials

Monthly SD, wind speed, precipitation, temperature and relative humidity data from 753 stations during January 1961 to December 2016 were provided by the National Meteorological Information Center of the China Meteorological Administration [42]. All observations provided by these stations were subject to strict quality control. Temporal consistency control using data length were conducted and 569 meteorological stations with relatively complete measurements selected. The majority of the meteorological stations were located in the eastern and central parts of mainland China (Figure 1), with only a sparse distribution over the western part, especially the western part of the Tibetan Plateau. To explore the influence of population distribution on the variation of SD, the population density data for the year 2015 at 1 km spatial resolution was obtained from Resource and Environmental Data Cloud Platform, Chinese Academy of Sciences [43]. In this study, seasons are defined as winter (December–February), spring (March–May), summer (June–August), and autumn (September–November).

2.3. Methods

In this study, the temporal trend was analyzed by using linear trend analysis, mutation test, and significance test. The spatial variation was analyzed by using Universal Kriging spatial interpolation method. The Mann–Kendall (M.-K.) non-parametric test is an effective and general measure to analyze the trend of time series [44,45]. In this study, the changing trend and tendency significance of SD in mainland China are presented by using M.-K. test. The Mann–Kendall rank statistics is one of the effective methods to test abrupt time series changes [46]. The intersection of UB and UF curves in M.-K. test is the time when mutation may occur. Because the mutation points detected by M.-K. method are uncertain, common methods are combined with the test results of various mutation methods [47]. Therefore, this study combines Bernaola–Galvan (B.-G.) segmentation algorithm [48], Ymamoto, Move-t and Lepage test methods to conduct mutation test on SD in mainland China, among which the latter three methods have been widely used. Therefore, the B.-G. segmentation algorithm is introduced in this present study.
The B.-G. segmentation algorithm can be used to test linear, stationary time series data, with a more desirable effect on non-linear, non-stationary time series data processing than other methods [48]. In addition, the scale of each sub-segment obtained by the B.-G. test is variable and not restricted by the method itself [49].
For a time series x(t) consisting of N points, the average values μ1(i) and μ2(i) and standard deviations s1(i) and s2(i) of the left and right parts of each point are calculated from left to right, and the combined deviation S(i) of point i is [48]:
S ( i ) = [ ( N 1 1 ) × s 1 ( i ) 2 + ( N 2 1 ) × s 2 ( i ) 2 N 1 + N 2 2 ] 1 2 × [ 1 N 1 + 1 N 2 ]
where N1 and N2 are the points of the left and right parts of the i point respectively. The statistical value T(i) of the t test to is used to quantify the difference between the mean values of the left and right parts of the i point [48]:
T ( i ) = | μ 1 ( i ) μ 2 ( i ) S ( i ) |
We repeat the above calculation process for each point in x(t) to obtain a test statistic value sequence T(t) corresponding to x(t) one by one. The larger T is, the larger the difference between the mean values of the left and right parts of the point is. Calculate the statistical significance P (Tmax) of the maximum value Tmax in T(t). In general, P (Tmax) can be approximately expressed as [48]:
P ( T max ) ( 1 I v / ( v + T max 2 ) ( δ v , δ ) ) η
From a Monte Carlo simulation, we can obtain η = 4.19lnN − 11.54, δ = 0.40, where N is the length of x(t), v = N − 2, and Ix (a,b) is incomplete β function. Set a critical value P0: if P (Tmax) ≥ P0, then x(t) is divided into two sub-sequences with different mean values, otherwise no segmentation. Repeat the above operation for the two newly obtained subsequences until the subsequence is not re-segmentable, the sequence length is less than or equal to l0. In general, the value of l0 is not less than 25, and P0 can be taken as 0.5–0.95. Due to the limitation of l0, the length of the time series is required to be ≥50. The segmentation point is the time point at which the mean mutation occurs. The corresponding time period of each sub-sequence of the original time series is defined as “mean segment”.

3. Results

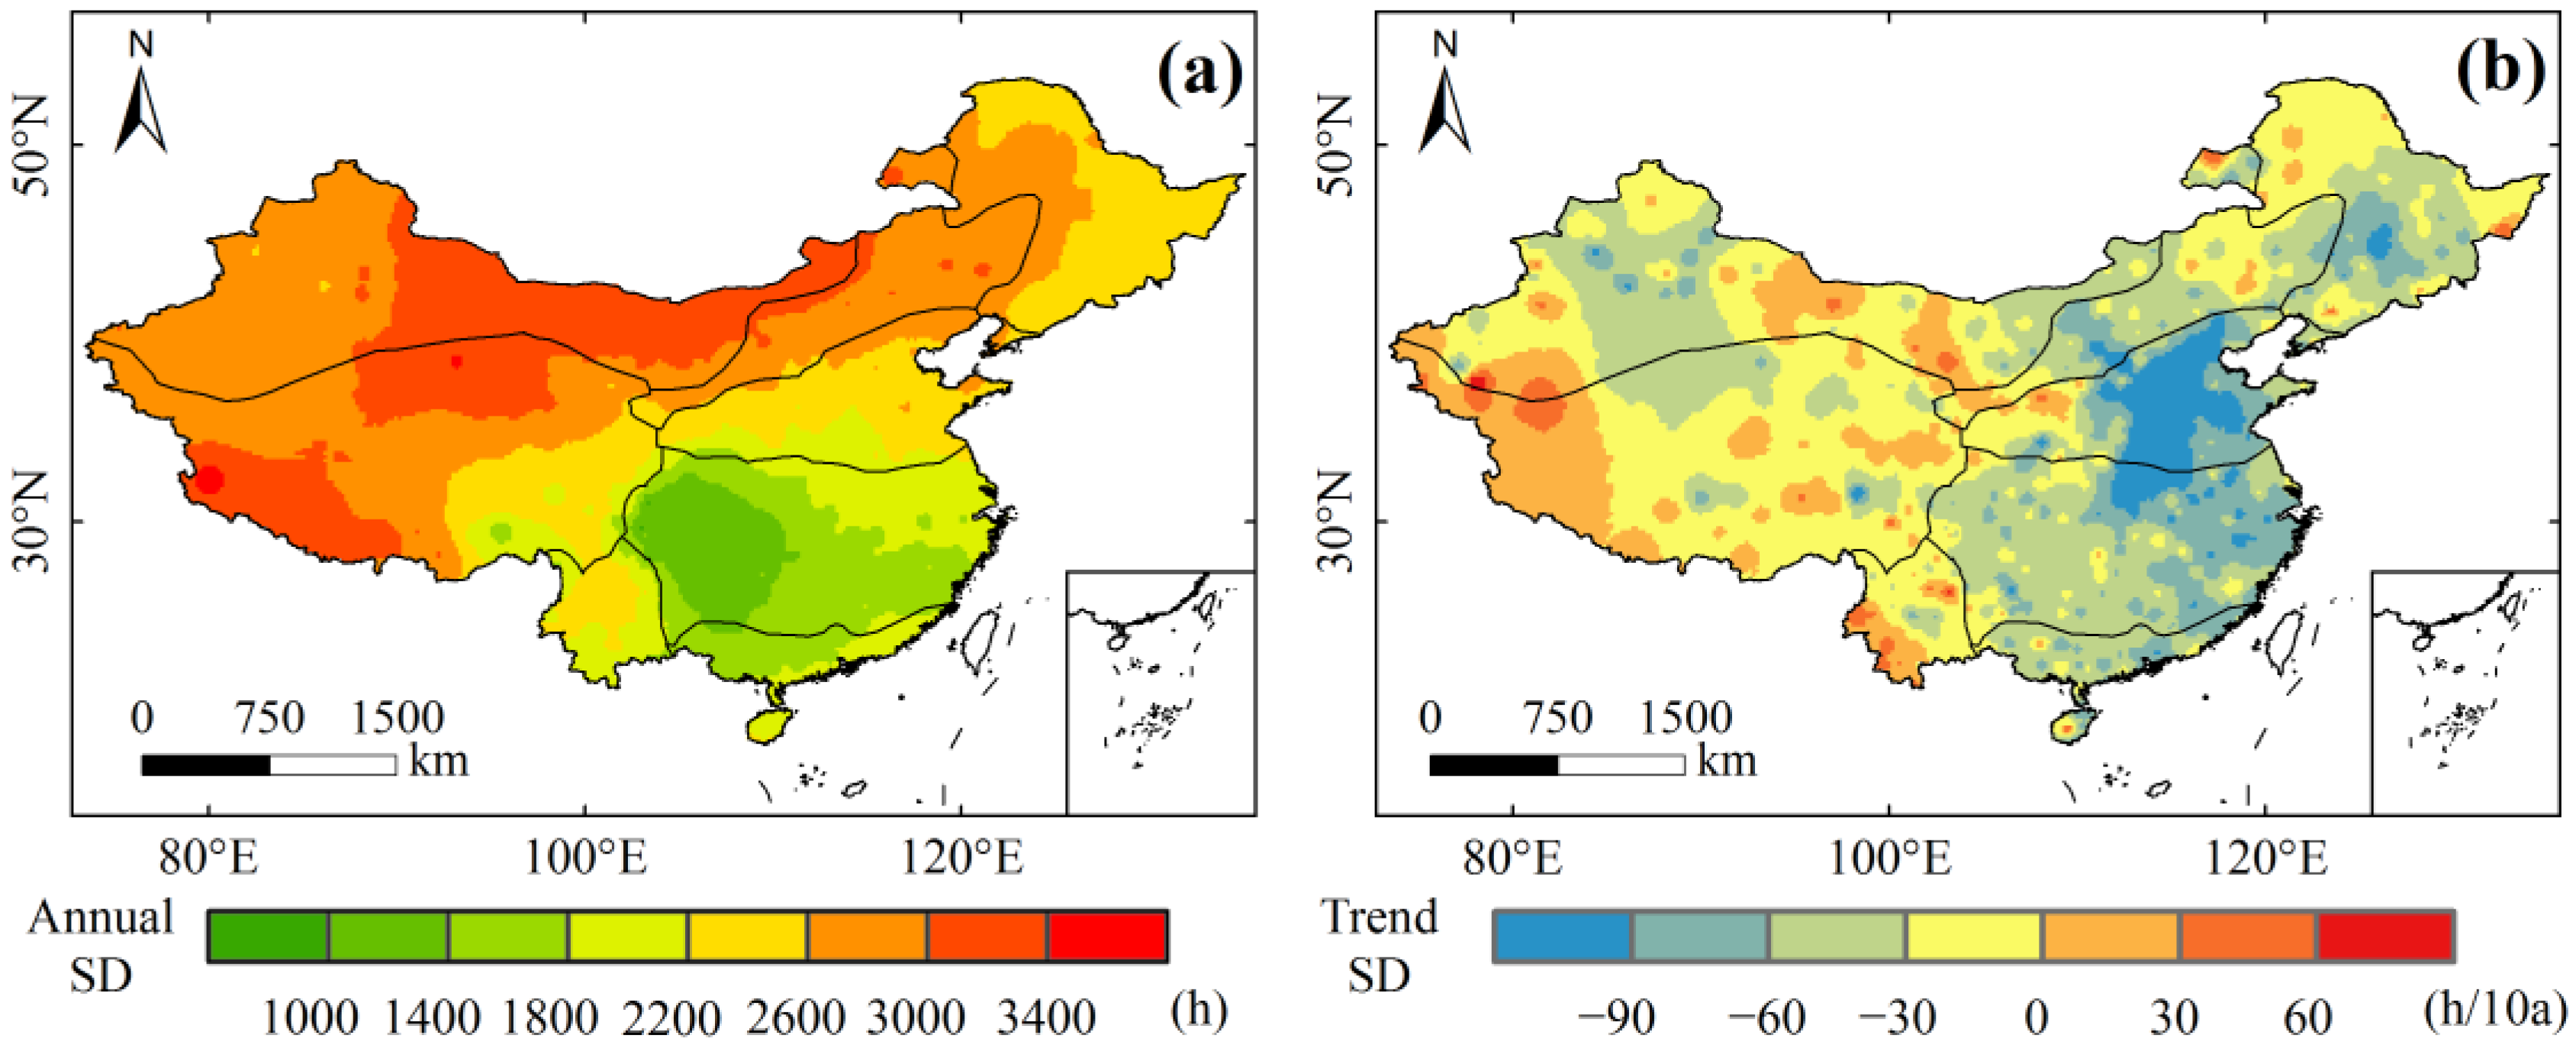
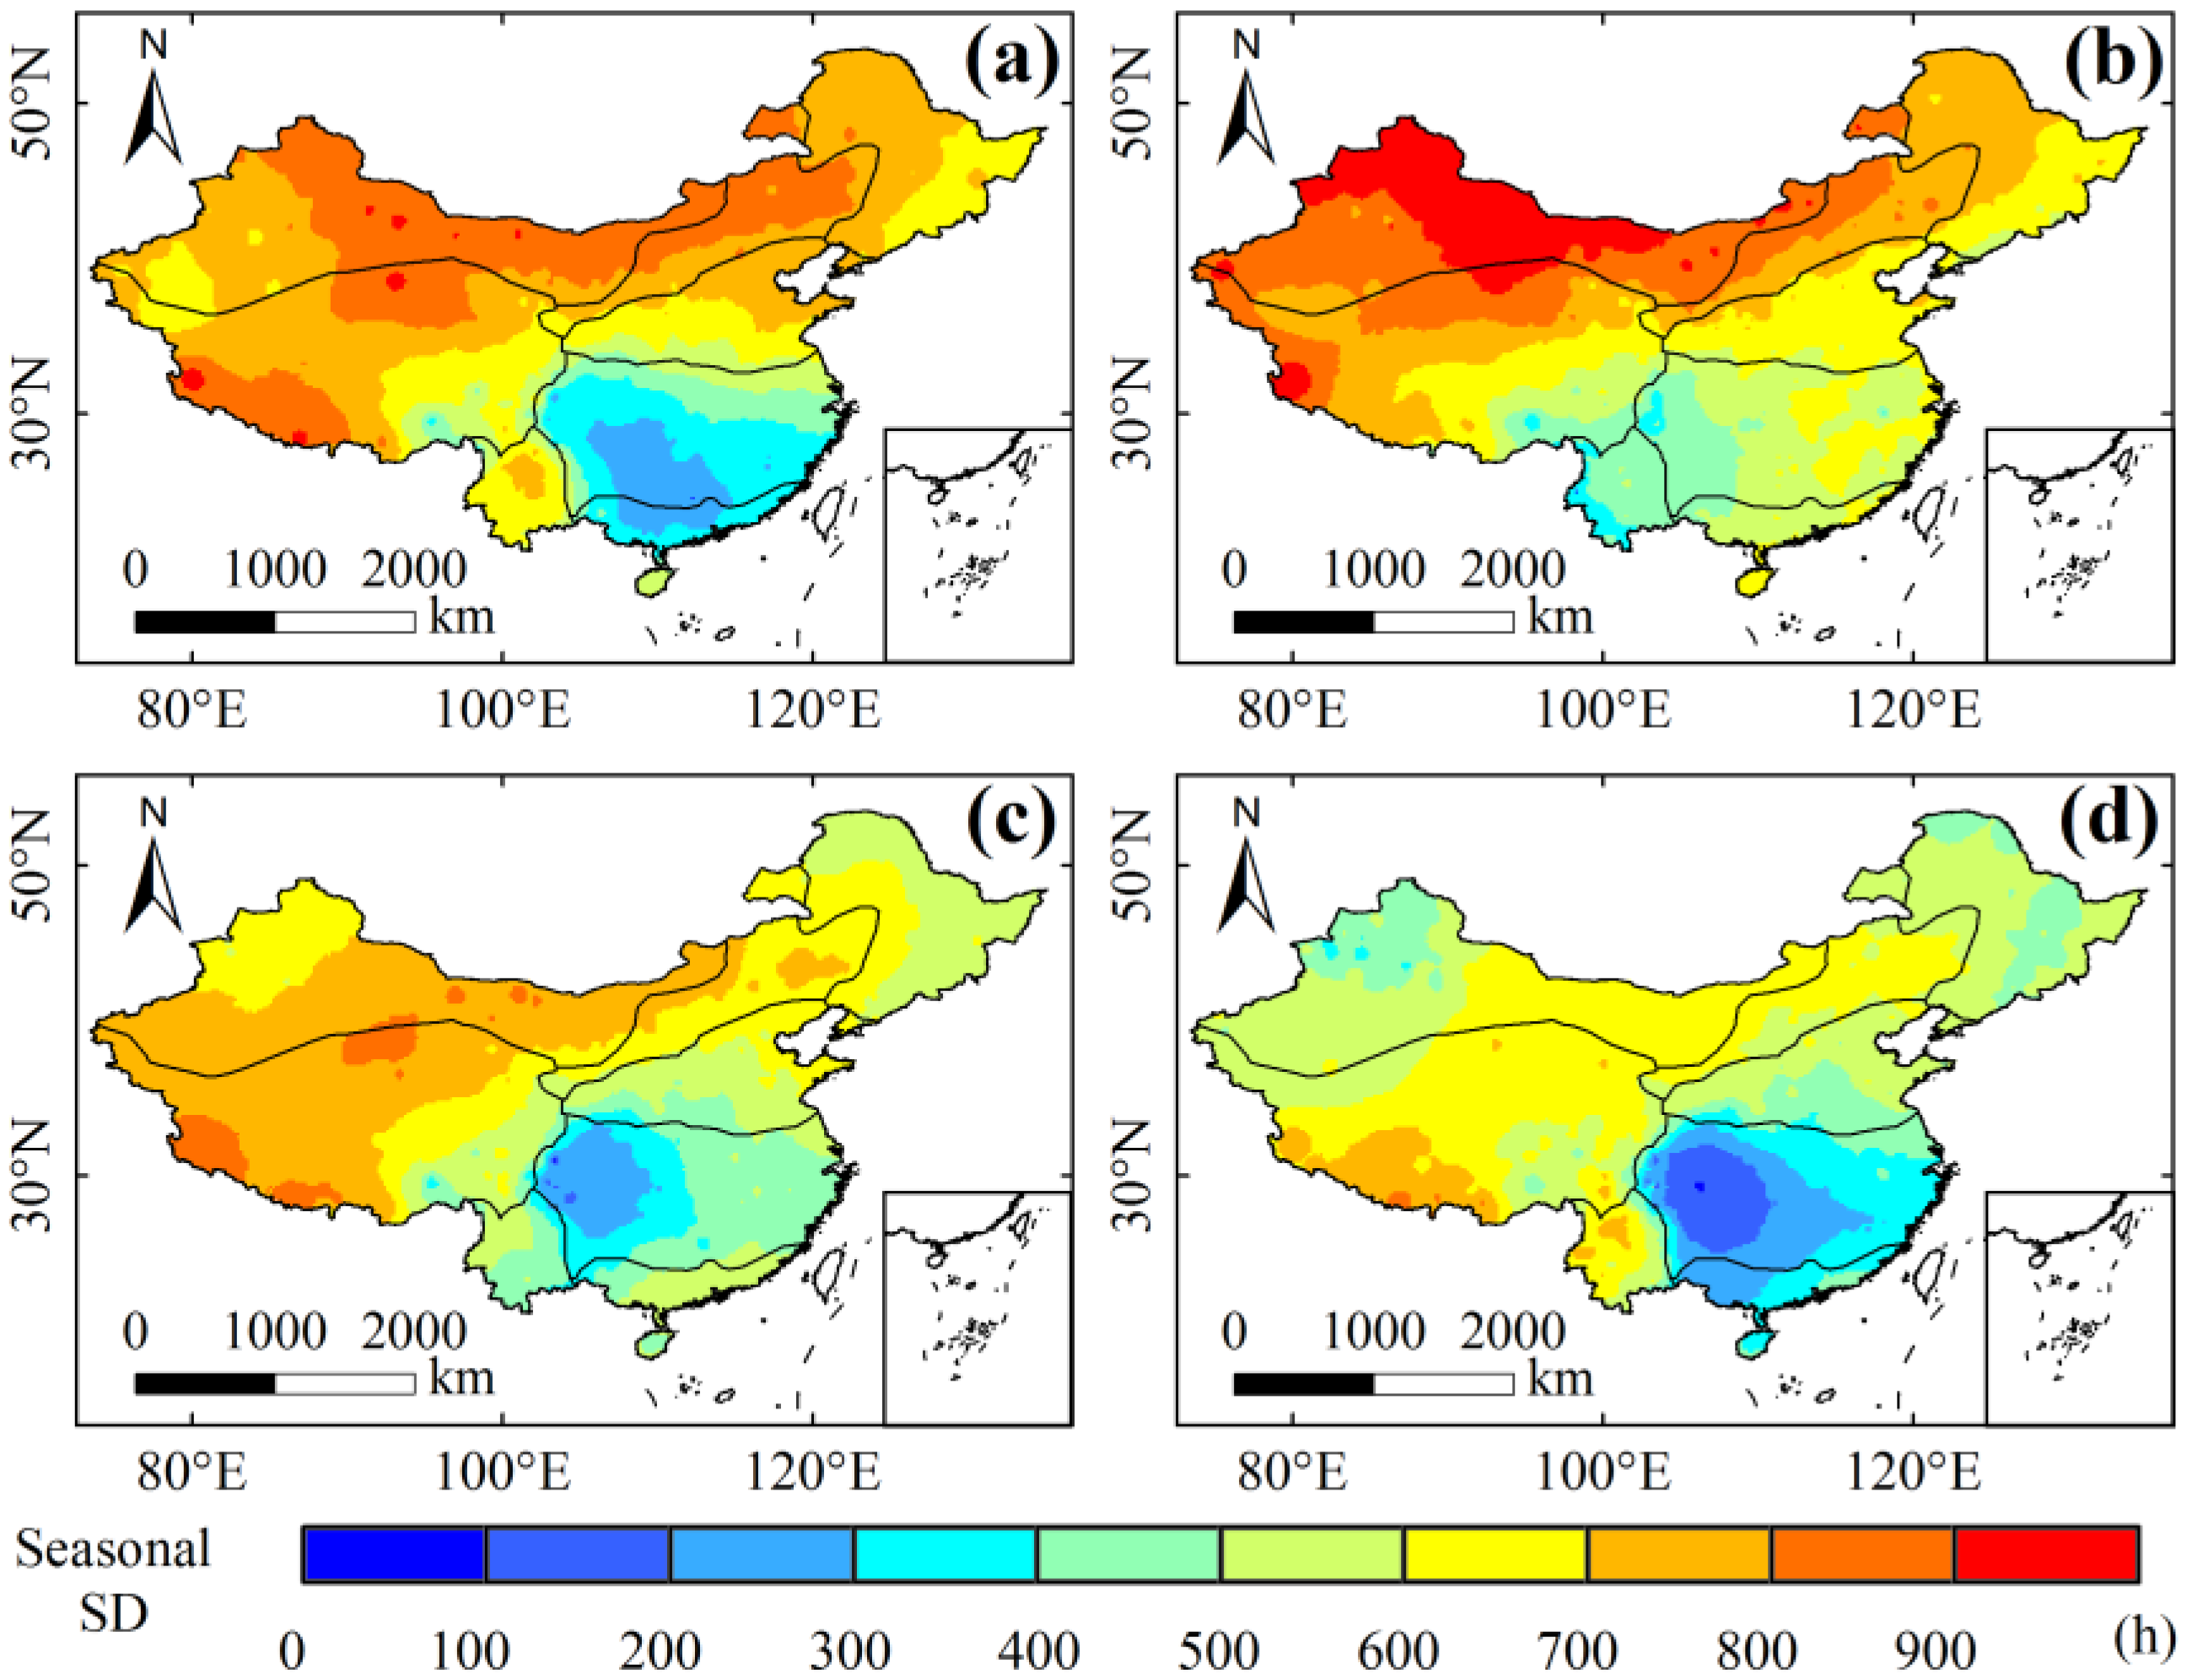
3.1. Spatial Variation of Sunshine Duration (SD)

Figure 2 shows the spatial distribution of annual SD and climate tendency rate over mainland China during 1961–2016. Obviously, annual SD decreased gradually from northwest to southeast China (Figure 2a). In general, annual SD was longer in regions located in higher altitude. The shortest annual SD was observed in the western part of Central China (CC), with the minimum value less than 1000 h, resulting from the compound effects of spatial location, topography and complex circulation patterns that led to its large amount of clouds, fog, and precipitation [50]. In contrast, the highest annual SD (3500 h) was in the Gan-Xin Area (GX) and the Qinghai-Tibet Area (QT) due to high elevation and low precipitation.
During 1961–2016, annual SD showed a downward trend in most parts of mainland China (Figure 2b). However, it is obvious to note that an increasing trend occurred in the west of QT, CD and southeastern GX. Most regions displaying stronger significant decreasing trend were located in NC, CC and Southern China (SC), especially in the middle part of NC, with the largest climate tendency rate of −120 h/10a. This widespread decline of annual SD may be related to the pollution caused by the rapid economic development in the past half century [35,51].
The spatial distribution of SD for each season is further depicted in Figure 3. SD was the largest in summer, followed by spring and autumn, and the lowest SD occurred in winter. The spatial patterns in spring, autumn and winter were similar to annual distribution, but with different magnitudes. The region with the lowest SD in summer was located around the Chuan-Dian Area (CD) affected by the monsoon. The longest SD occurred in GX in all seasons except in winter due to the high-elevation and low-precipitation, with the largest SD in summer of more than 890 h [52]. In winter, the highest SD was found in QT due to low latitude and the highest elevation; however, the lowest SD occurred in the west regions of CC.

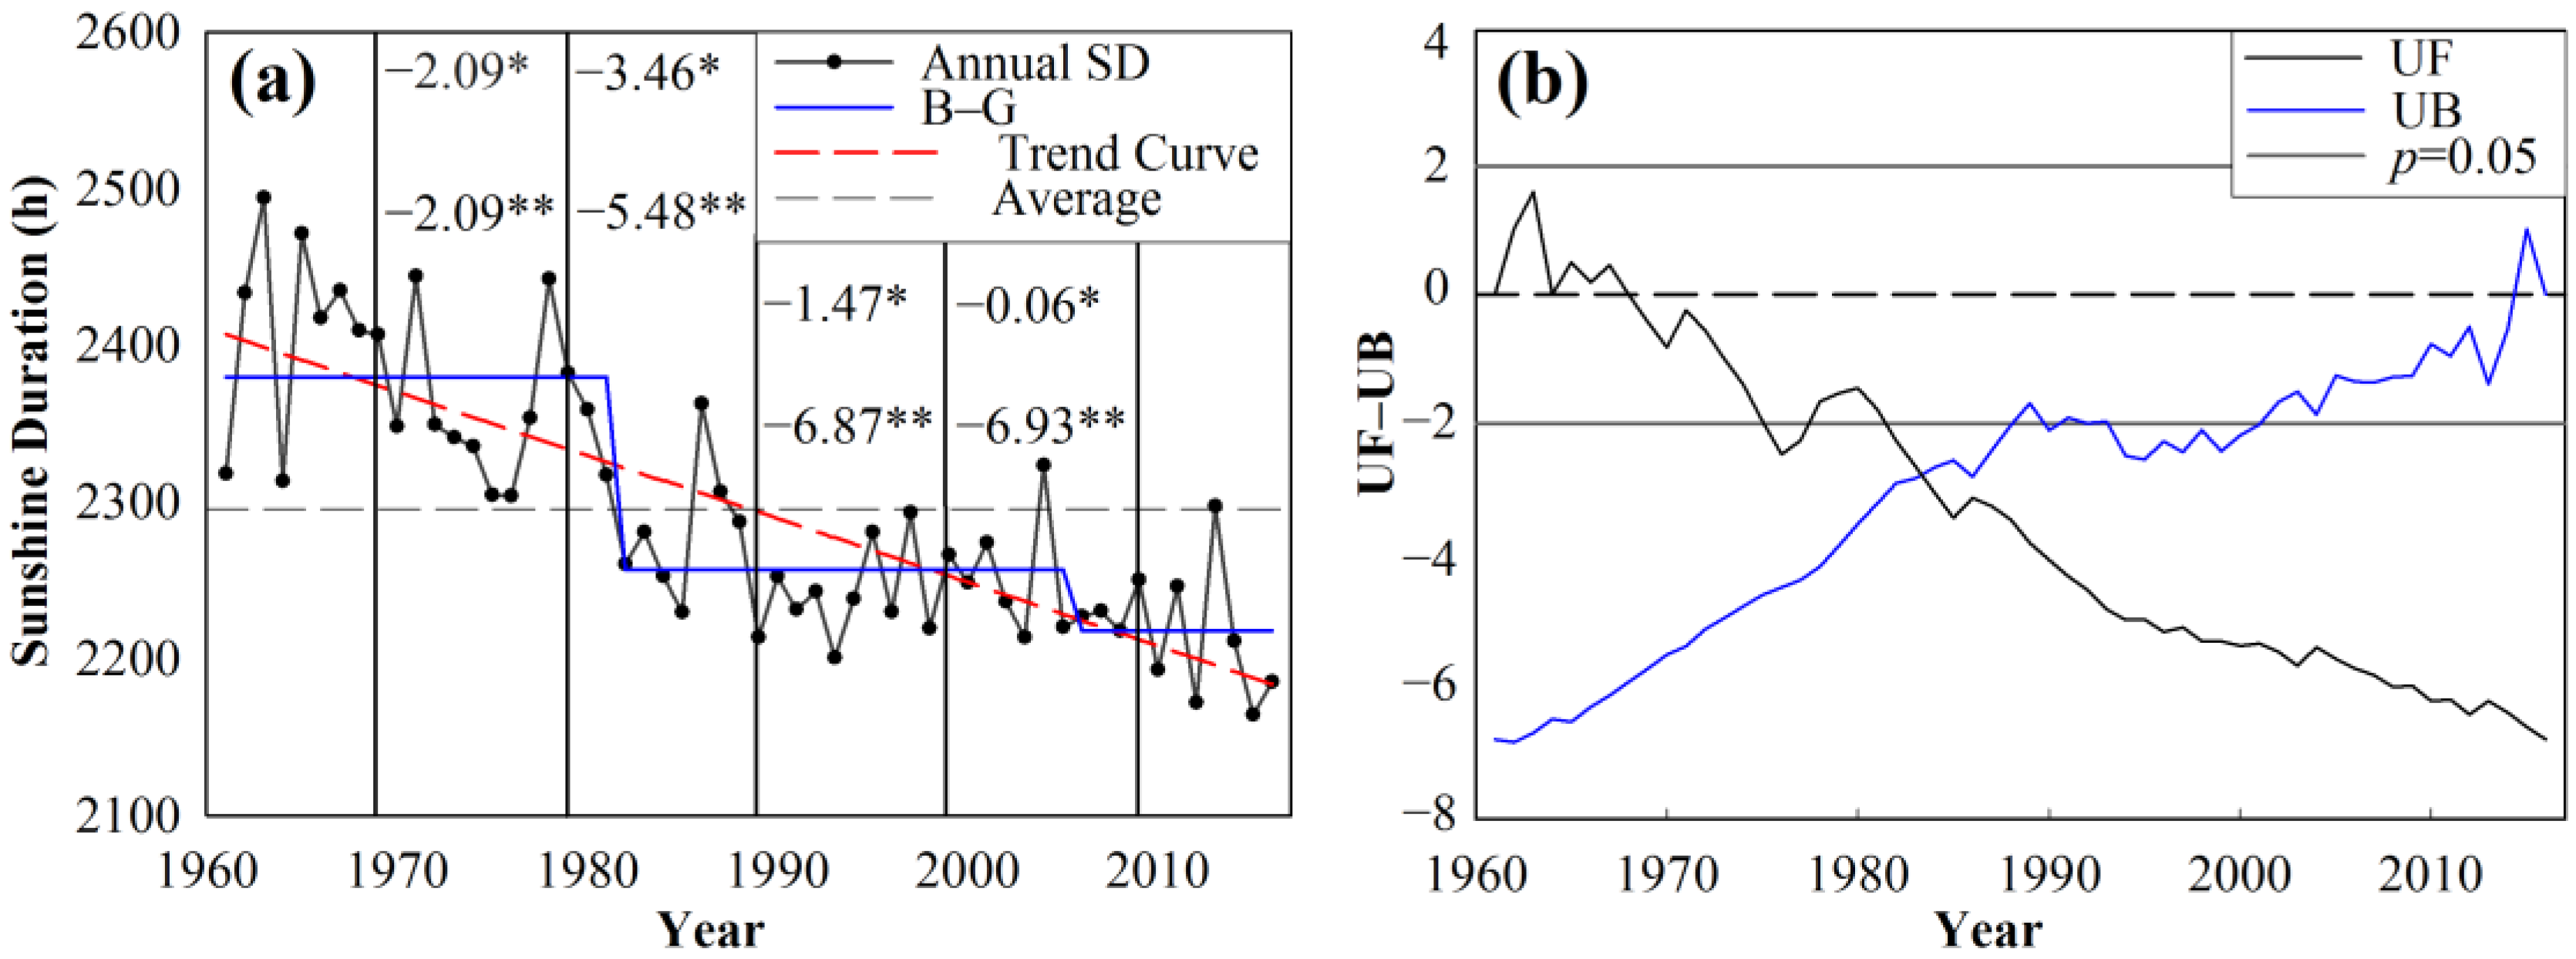
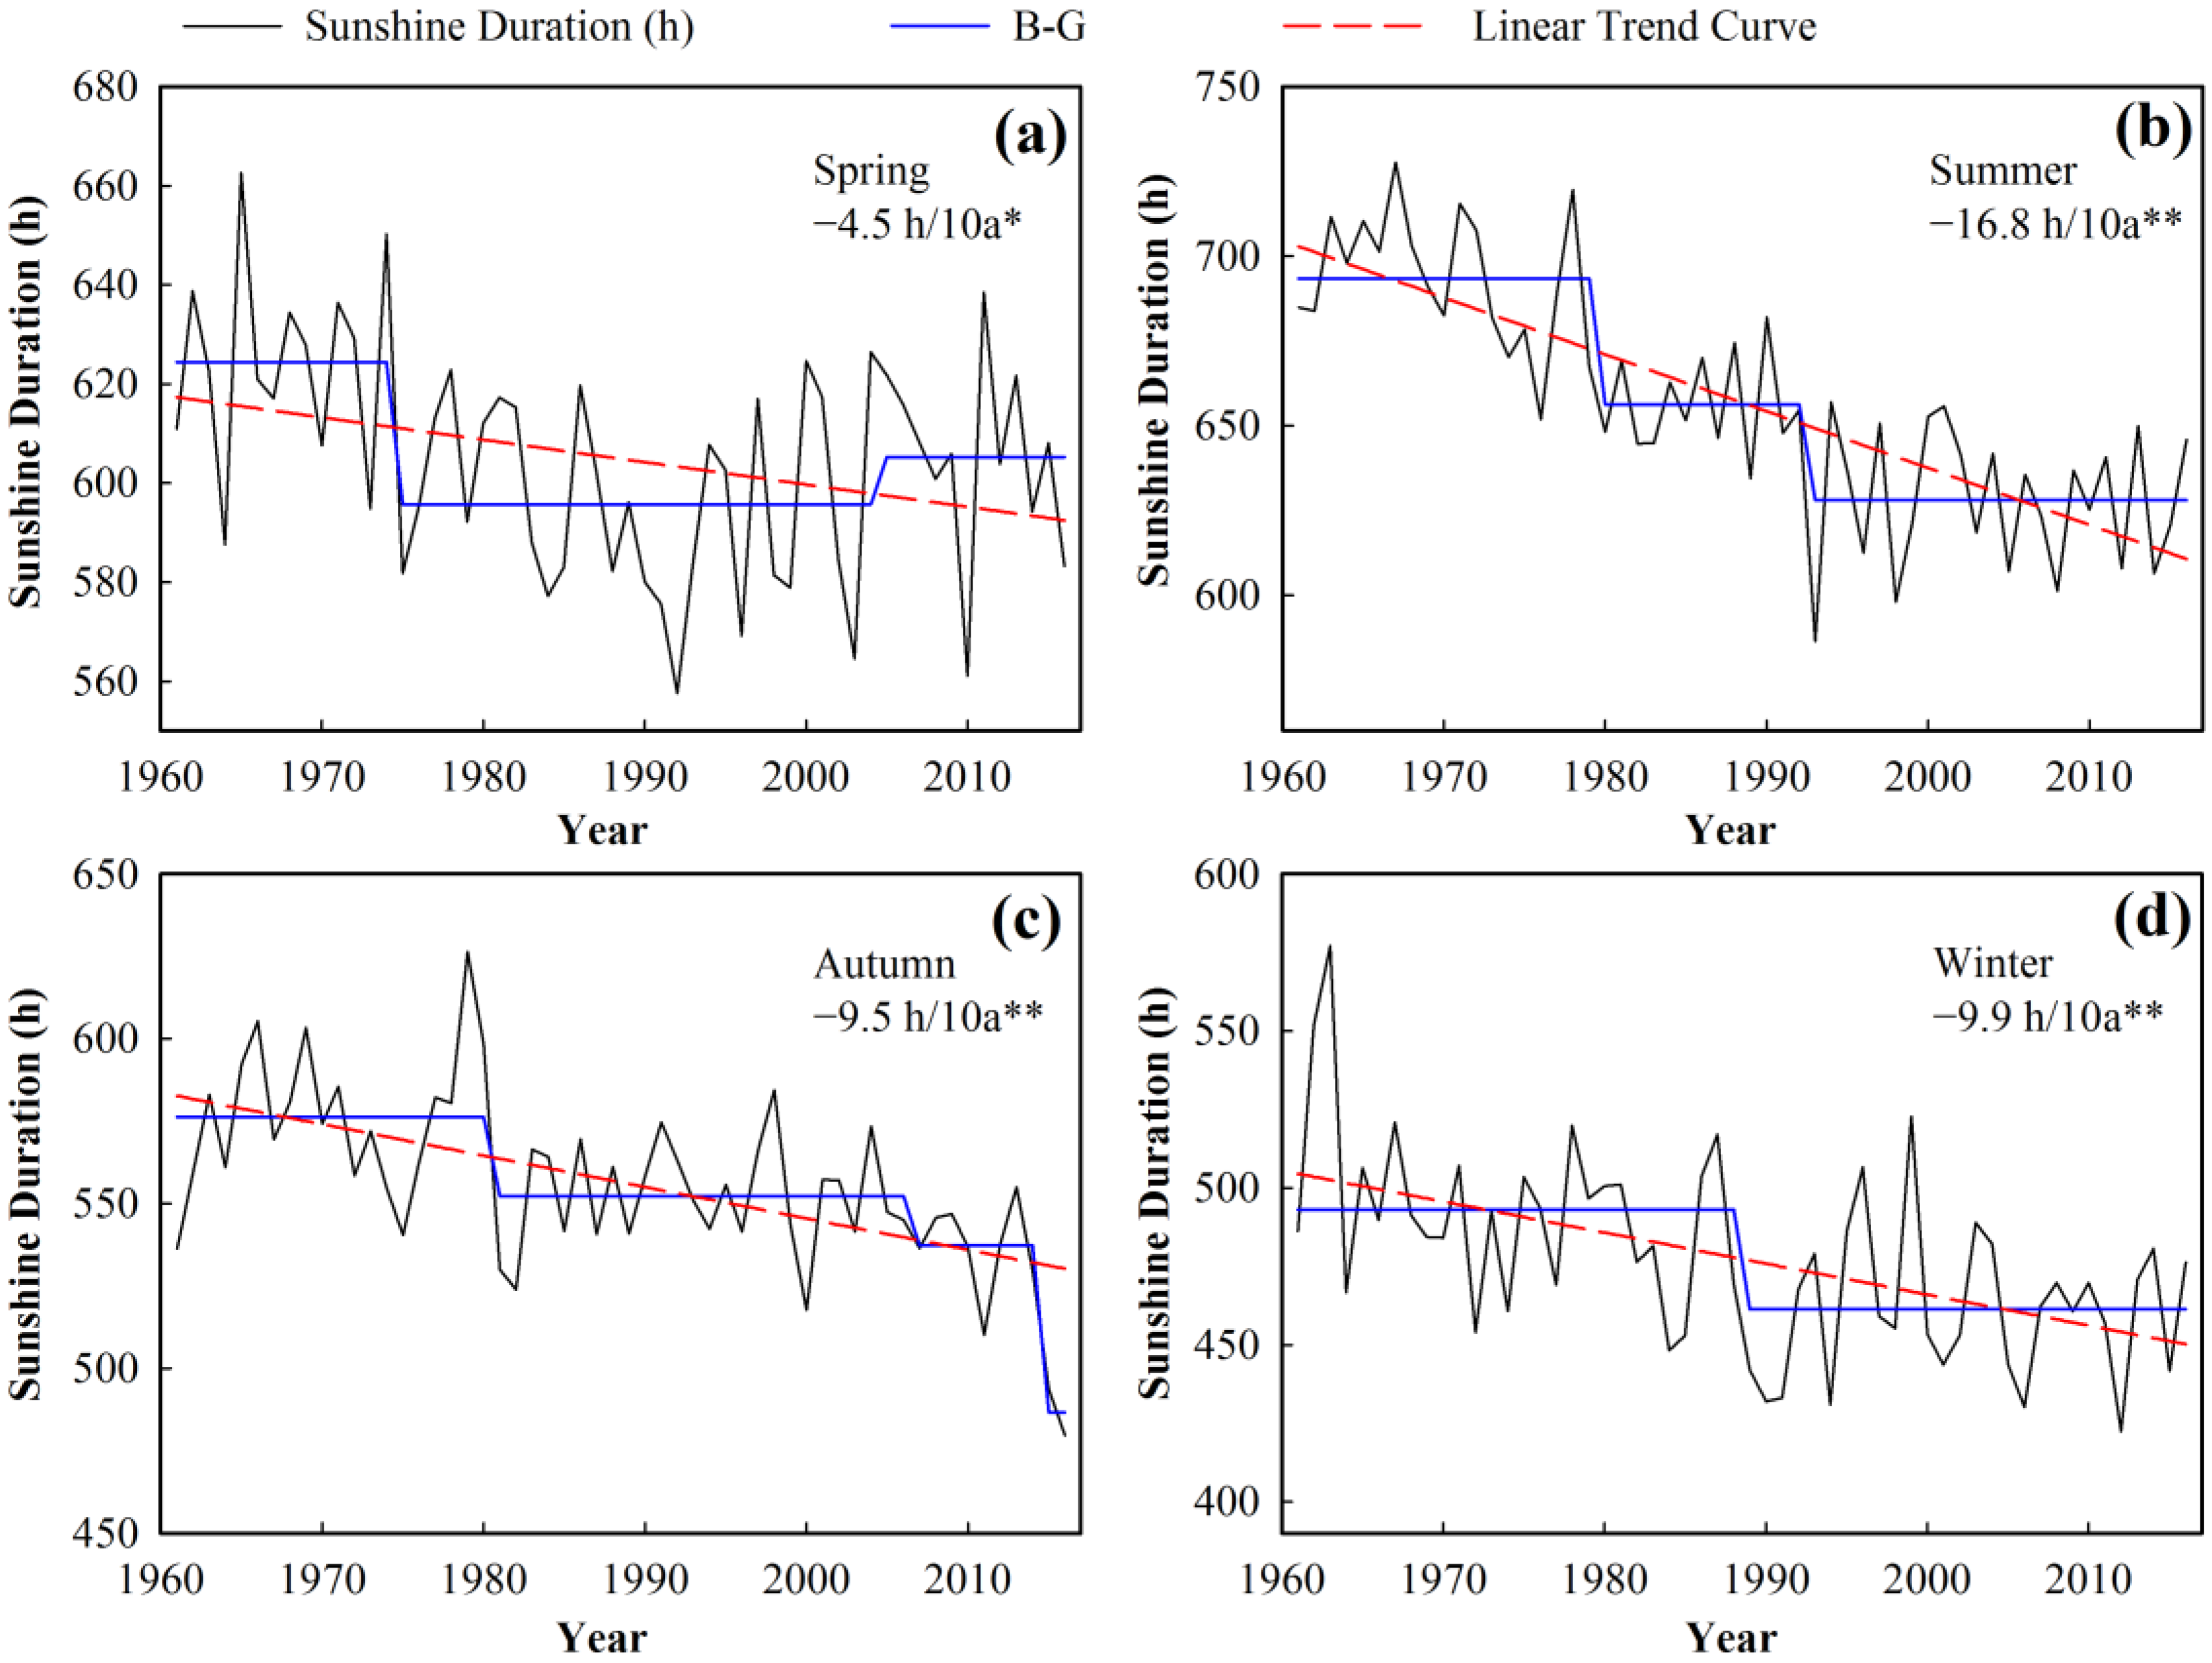
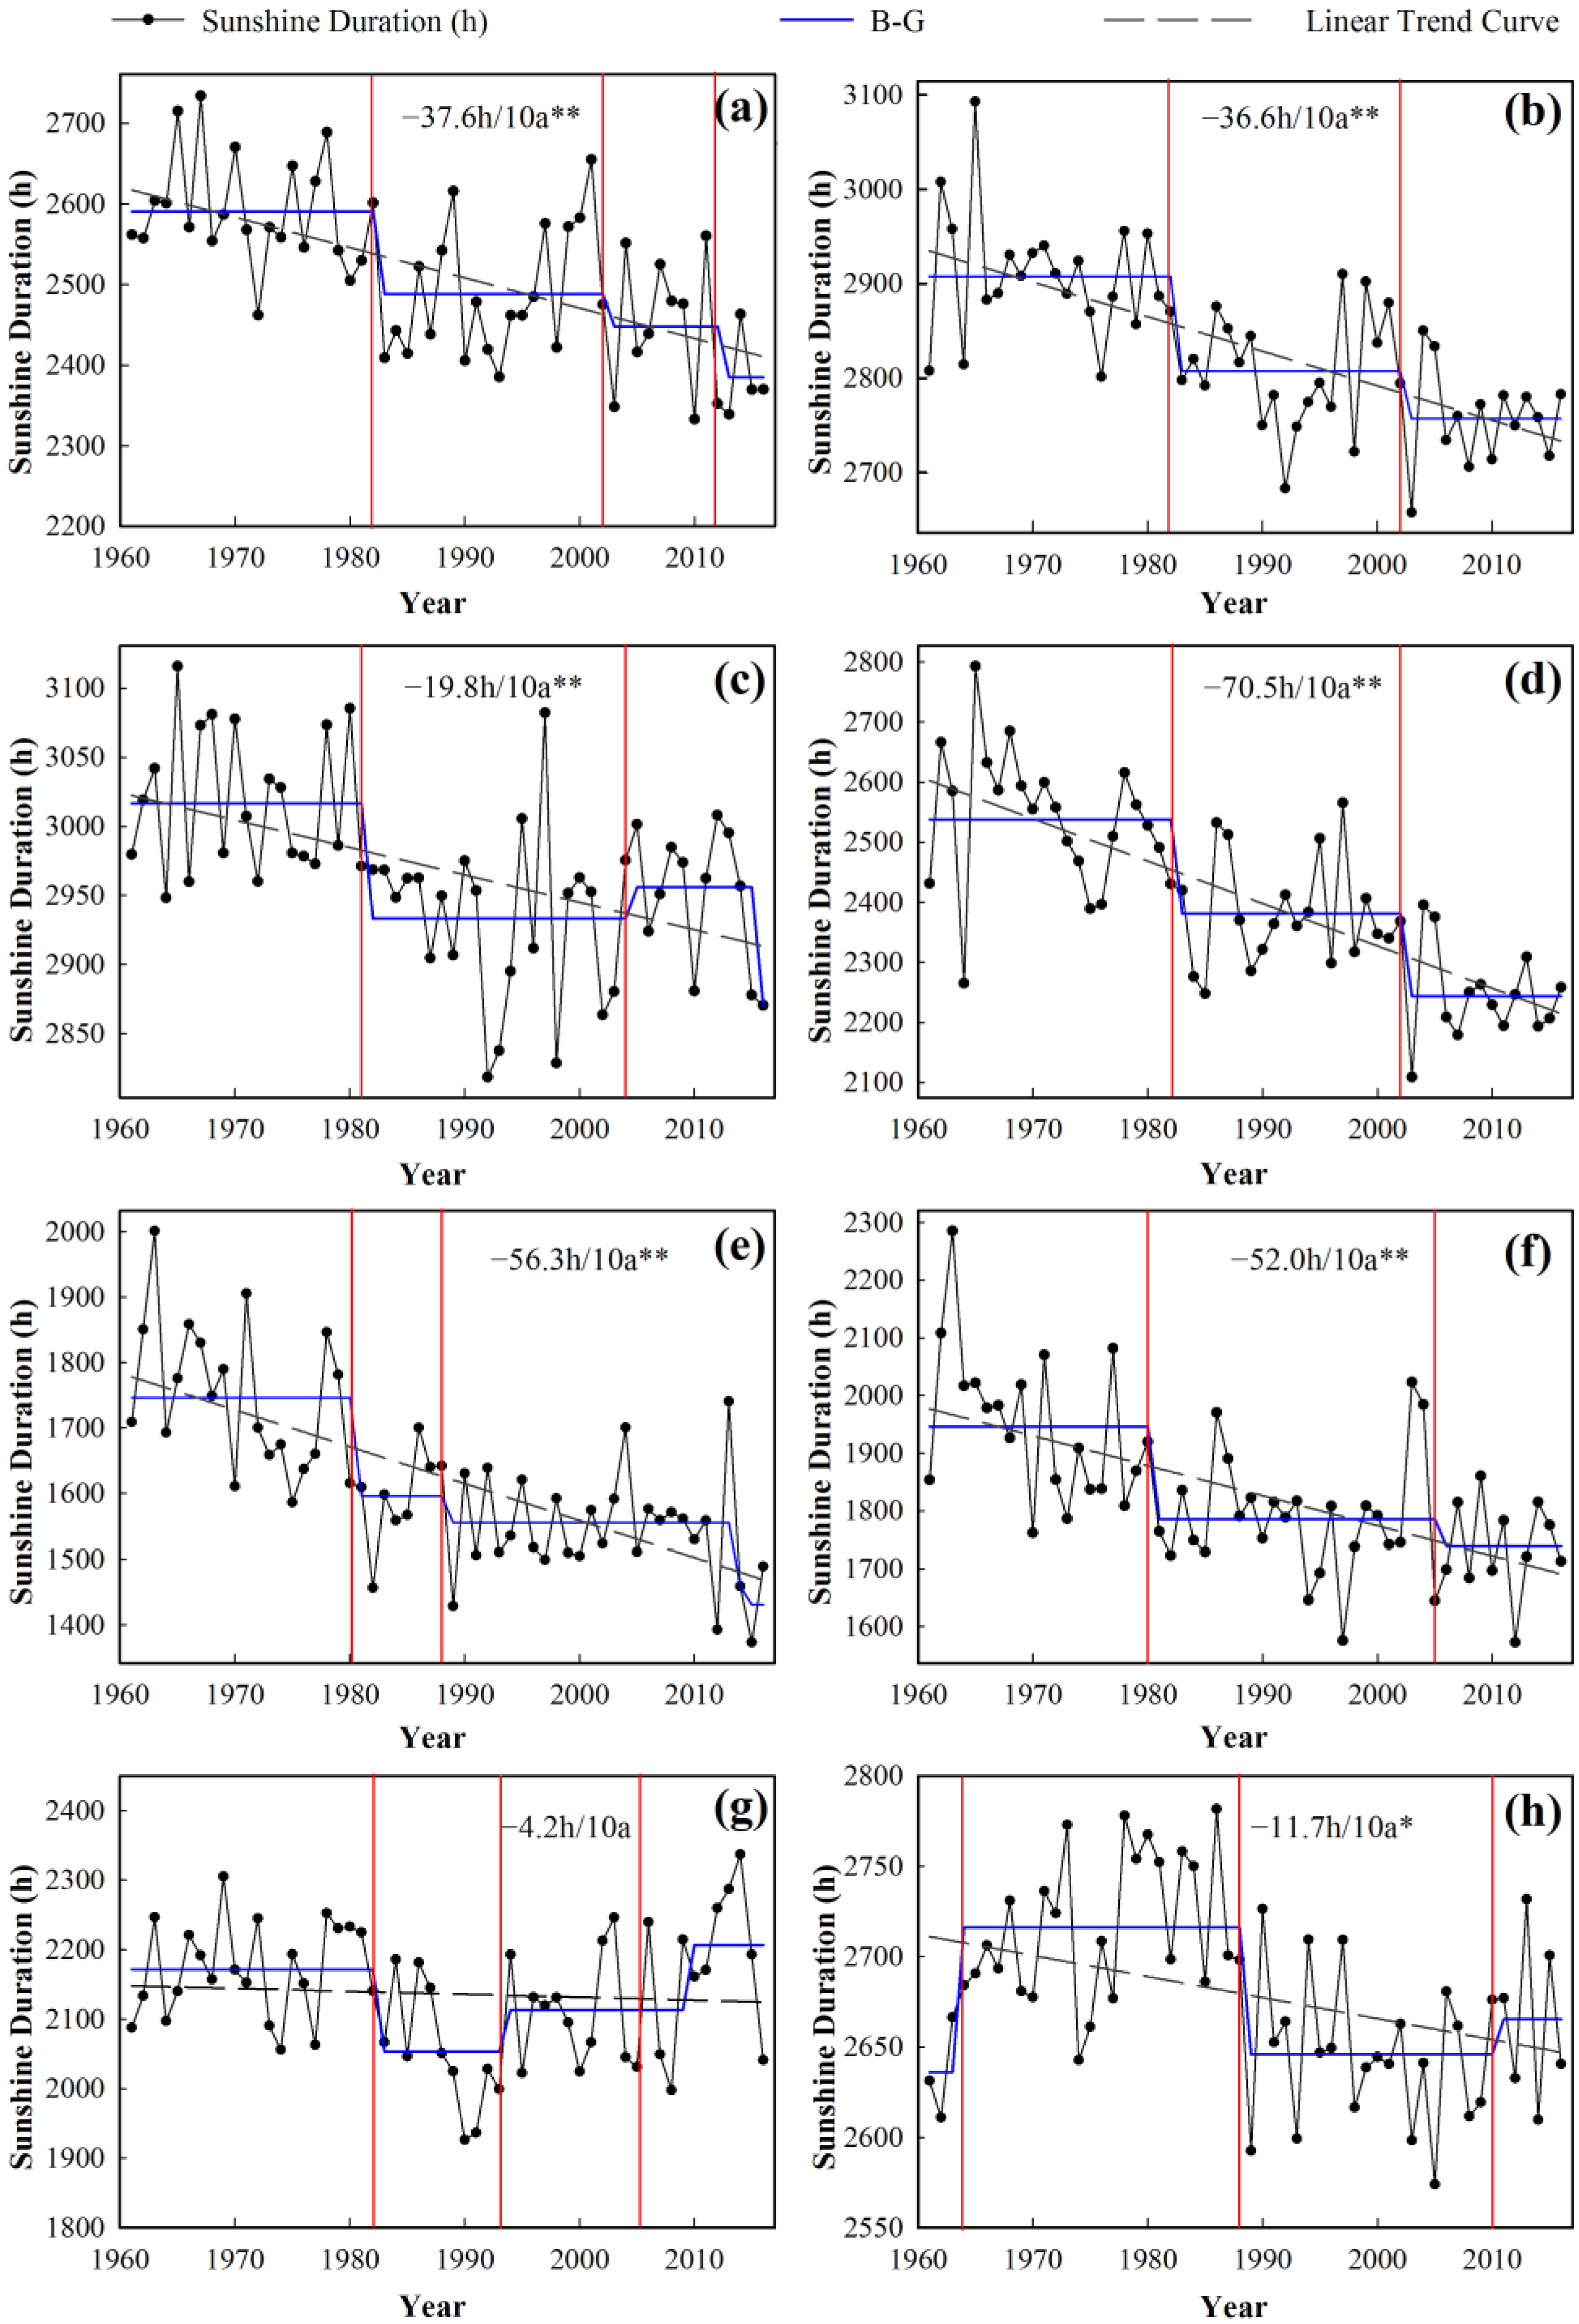
3.2. Trends of SD in Mainland China

3.2.1. Overall Trends of SD

The annual SD has decreased significantly in mainland China since 1961, with an overall downward trend of −40.7 h/10a (Figure 4a). The decline in annual SD was highest in the 1980s (3.46% lower than that in 1970s), followed by the 1970s (2.09%) and the 1990s (1.47%). Similar conclusions have been drawn by Wang et al. [28]. Annual SD decline hit the lowest point in the 2000s, decreased by 6.93% compared with that in the 1960s. M.-K. analysis results showed that the UF line was below 0 after 1968 and exceeded the p = 0.05 significance test line in 1980 (Figure 4b). The result indicates that annual SD began to decrease after 1968, and this tendency became significant after 1980. The UF and UB lines intersected in 1982, indicating a suspected mutation point in 1982, which was the same as the year of mutation detected by the B.-G. test. According to the results of B.-G. algorithm, annual SD was mutated in 1982 and 2005, respectively. The amplitude of the mutation in 1982 was extremely large, and the mean value after mutation was 5.21% lower than before. The mutation was also found in 1982 by using multiple mutation tests (Table 2).
Figure 5 shows the changes of seasonal SD in mainland China during 1961–2016. The seasonal SD decreased by 4.5–16.8 h/10a in the period of 1961–2016. The maximum decrease was observed in summer with a tendency rate of −16.8 h/10a, followed by that in winter, autumn and spring, with a tendency rate of −9.9 h/10a, −9.5 h/10a and −4.5 h/10a, respectively. Besides, the downward trend of SD for each season all passed the significance test (p < 0.05). It is worth noting that SD fluctuated greatly in spring, with a slight downward trend from 1961 to 2000, but increased by 3.68% after 2000. SD showed a steady downward trend in summer, and there was no recovery in SD in the last half a century. With the exception of the 1990s, SD showed a downward trend in autumn. In winter, SD declined on the whole, but fluctuated greatly between years, and increased during 1990–2000. The negative trend was significant during 2010–2016, surpassing that in the 1980s (−3.49%) and reaching −4.84%. An abrupt change in SD occurred near 1980 in summer and autumn, and slightly mutated near 1990 in summer and winter. The mutation of SD in spring occurred near 1973. In addition, the increase mutation in SD occurred only in spring (2002) in the four seasons.

3.2.2. Trends of Annual SD in Each Climate Region

Annual SD showed a downward trend in all climate regions of mainland China during 1961–2016 (Figure 6). The largest decline rate was located in NC (−70.5 h/10a), followed by that in CC (−56.3 h/10a) and SC (−52.0 h/10a). In addition, a significant reduction in annual SD was found in seven regions during 1961–1989. However, there was no obvious trend in QT region during the same period. Noticeably, the decline rate in annual SD was highest in the 1980s for each climate region and gradually stabilized after the early 1990s. Nevertheless, annual SD showed an obvious upward trend in CD in the 1990s. In contrast, there was no significant upward trend in the other seven regions. After entering the 21st century, annual SD still showed a downward trend in most regions of mainland China, which was detected by the B.-G. test. Additionally, the decreasing trend of annual SD for each climate region all passed the significant test except for CD.
Annual SD displayed an abrupt change in 1982 in almost all regions. This mutation was manifested in a variety of mutation testing methods (Table 2). This mutation signal was also put forward by Chen et al. (Northwest China in 1980) [53] and Li et al. (mainland China around 1981) [54]. In addition, mutational signals were also found in 1987 in multiple regions (Northeastern China (NE), Inner Mongolia Area (IM), North China (NC), CD and QT). After 2000, the abrupt change in annual SD was detected mainly in 2002 and 2005 in many regions.
Table 3 shows the changes of seasonal SD in each climate region during 1961–2016. It is apparent that almost all the seasonal SD showed a downward trend in various regions during the study period. SD changed slightly in spring for each climate region, while decreasing significantly only in two regions (NE and SC). In general, the decline rate of SD was larger in summer than in other seasons. The decline rate of SD for summer, autumn and winter was the largest in NC among all the climate regions, reaching −30.3 h/10a, −17.9 h/10a, and −17.7 h/10a, respectively. Overall, the decline rate was greater in the eastern region than that in the western region for each season, especially in the middle and low latitudes of the eastern region.

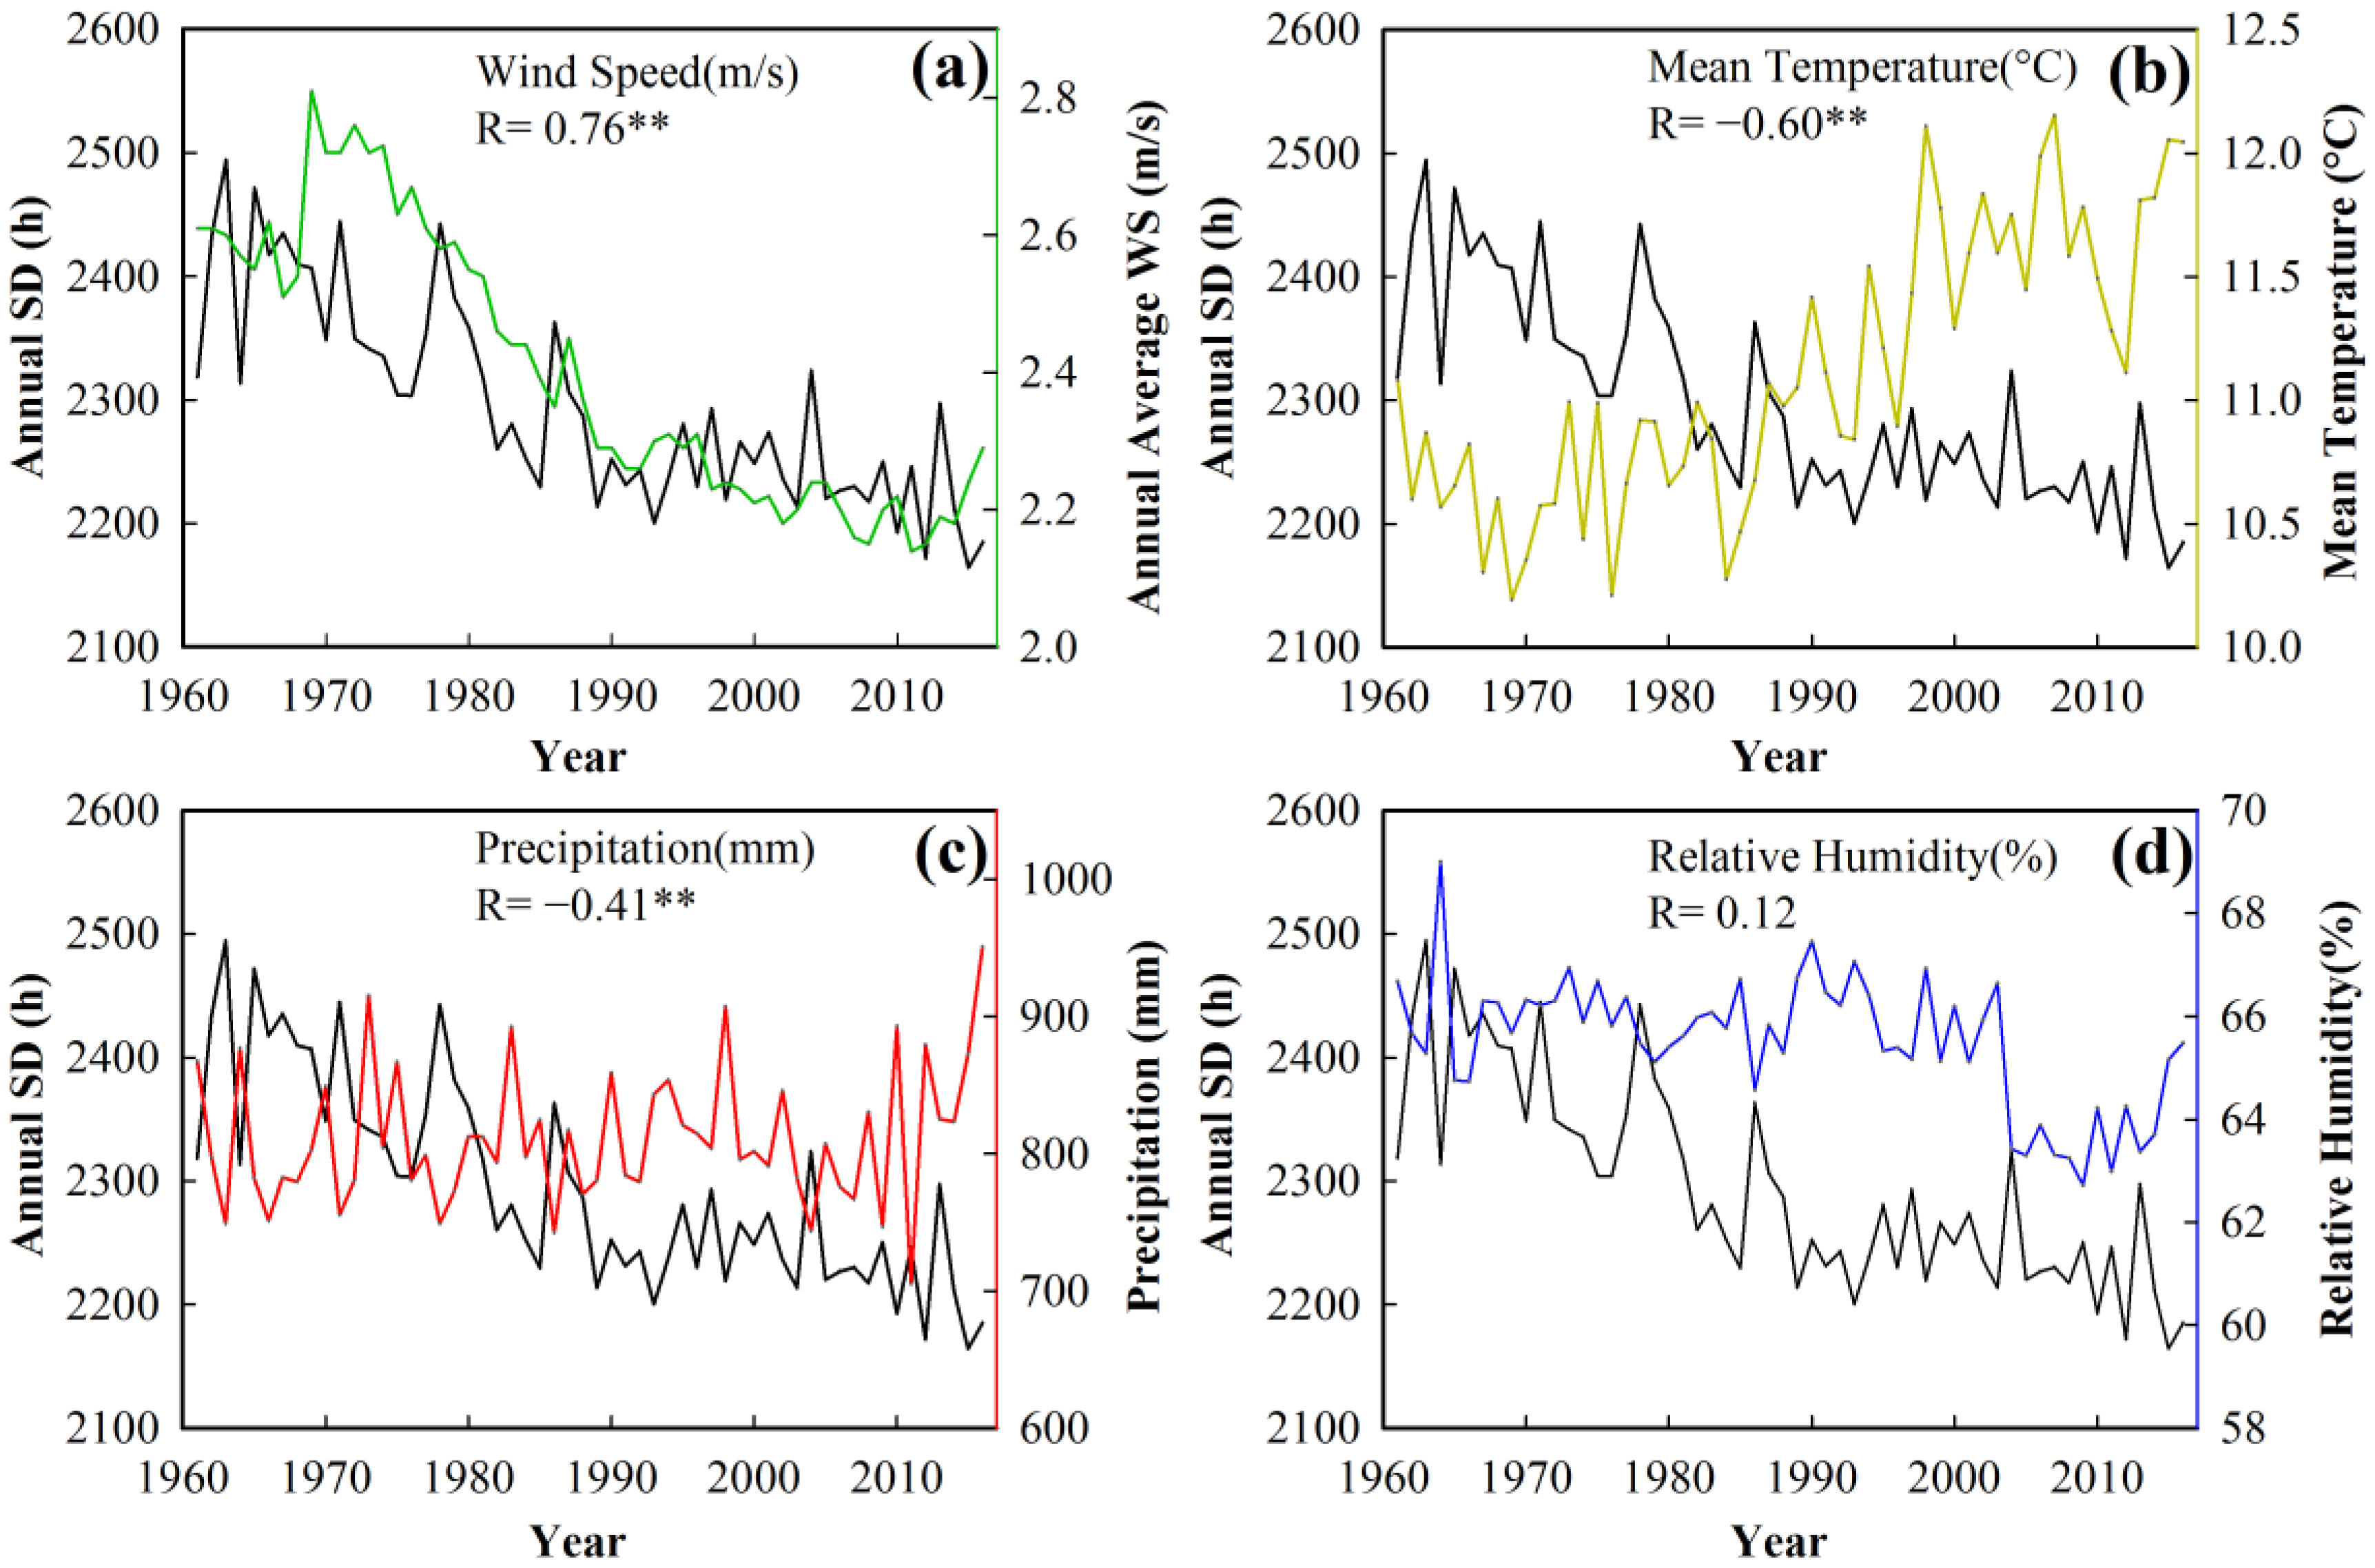
3.3. The Related Elements of Annual SD

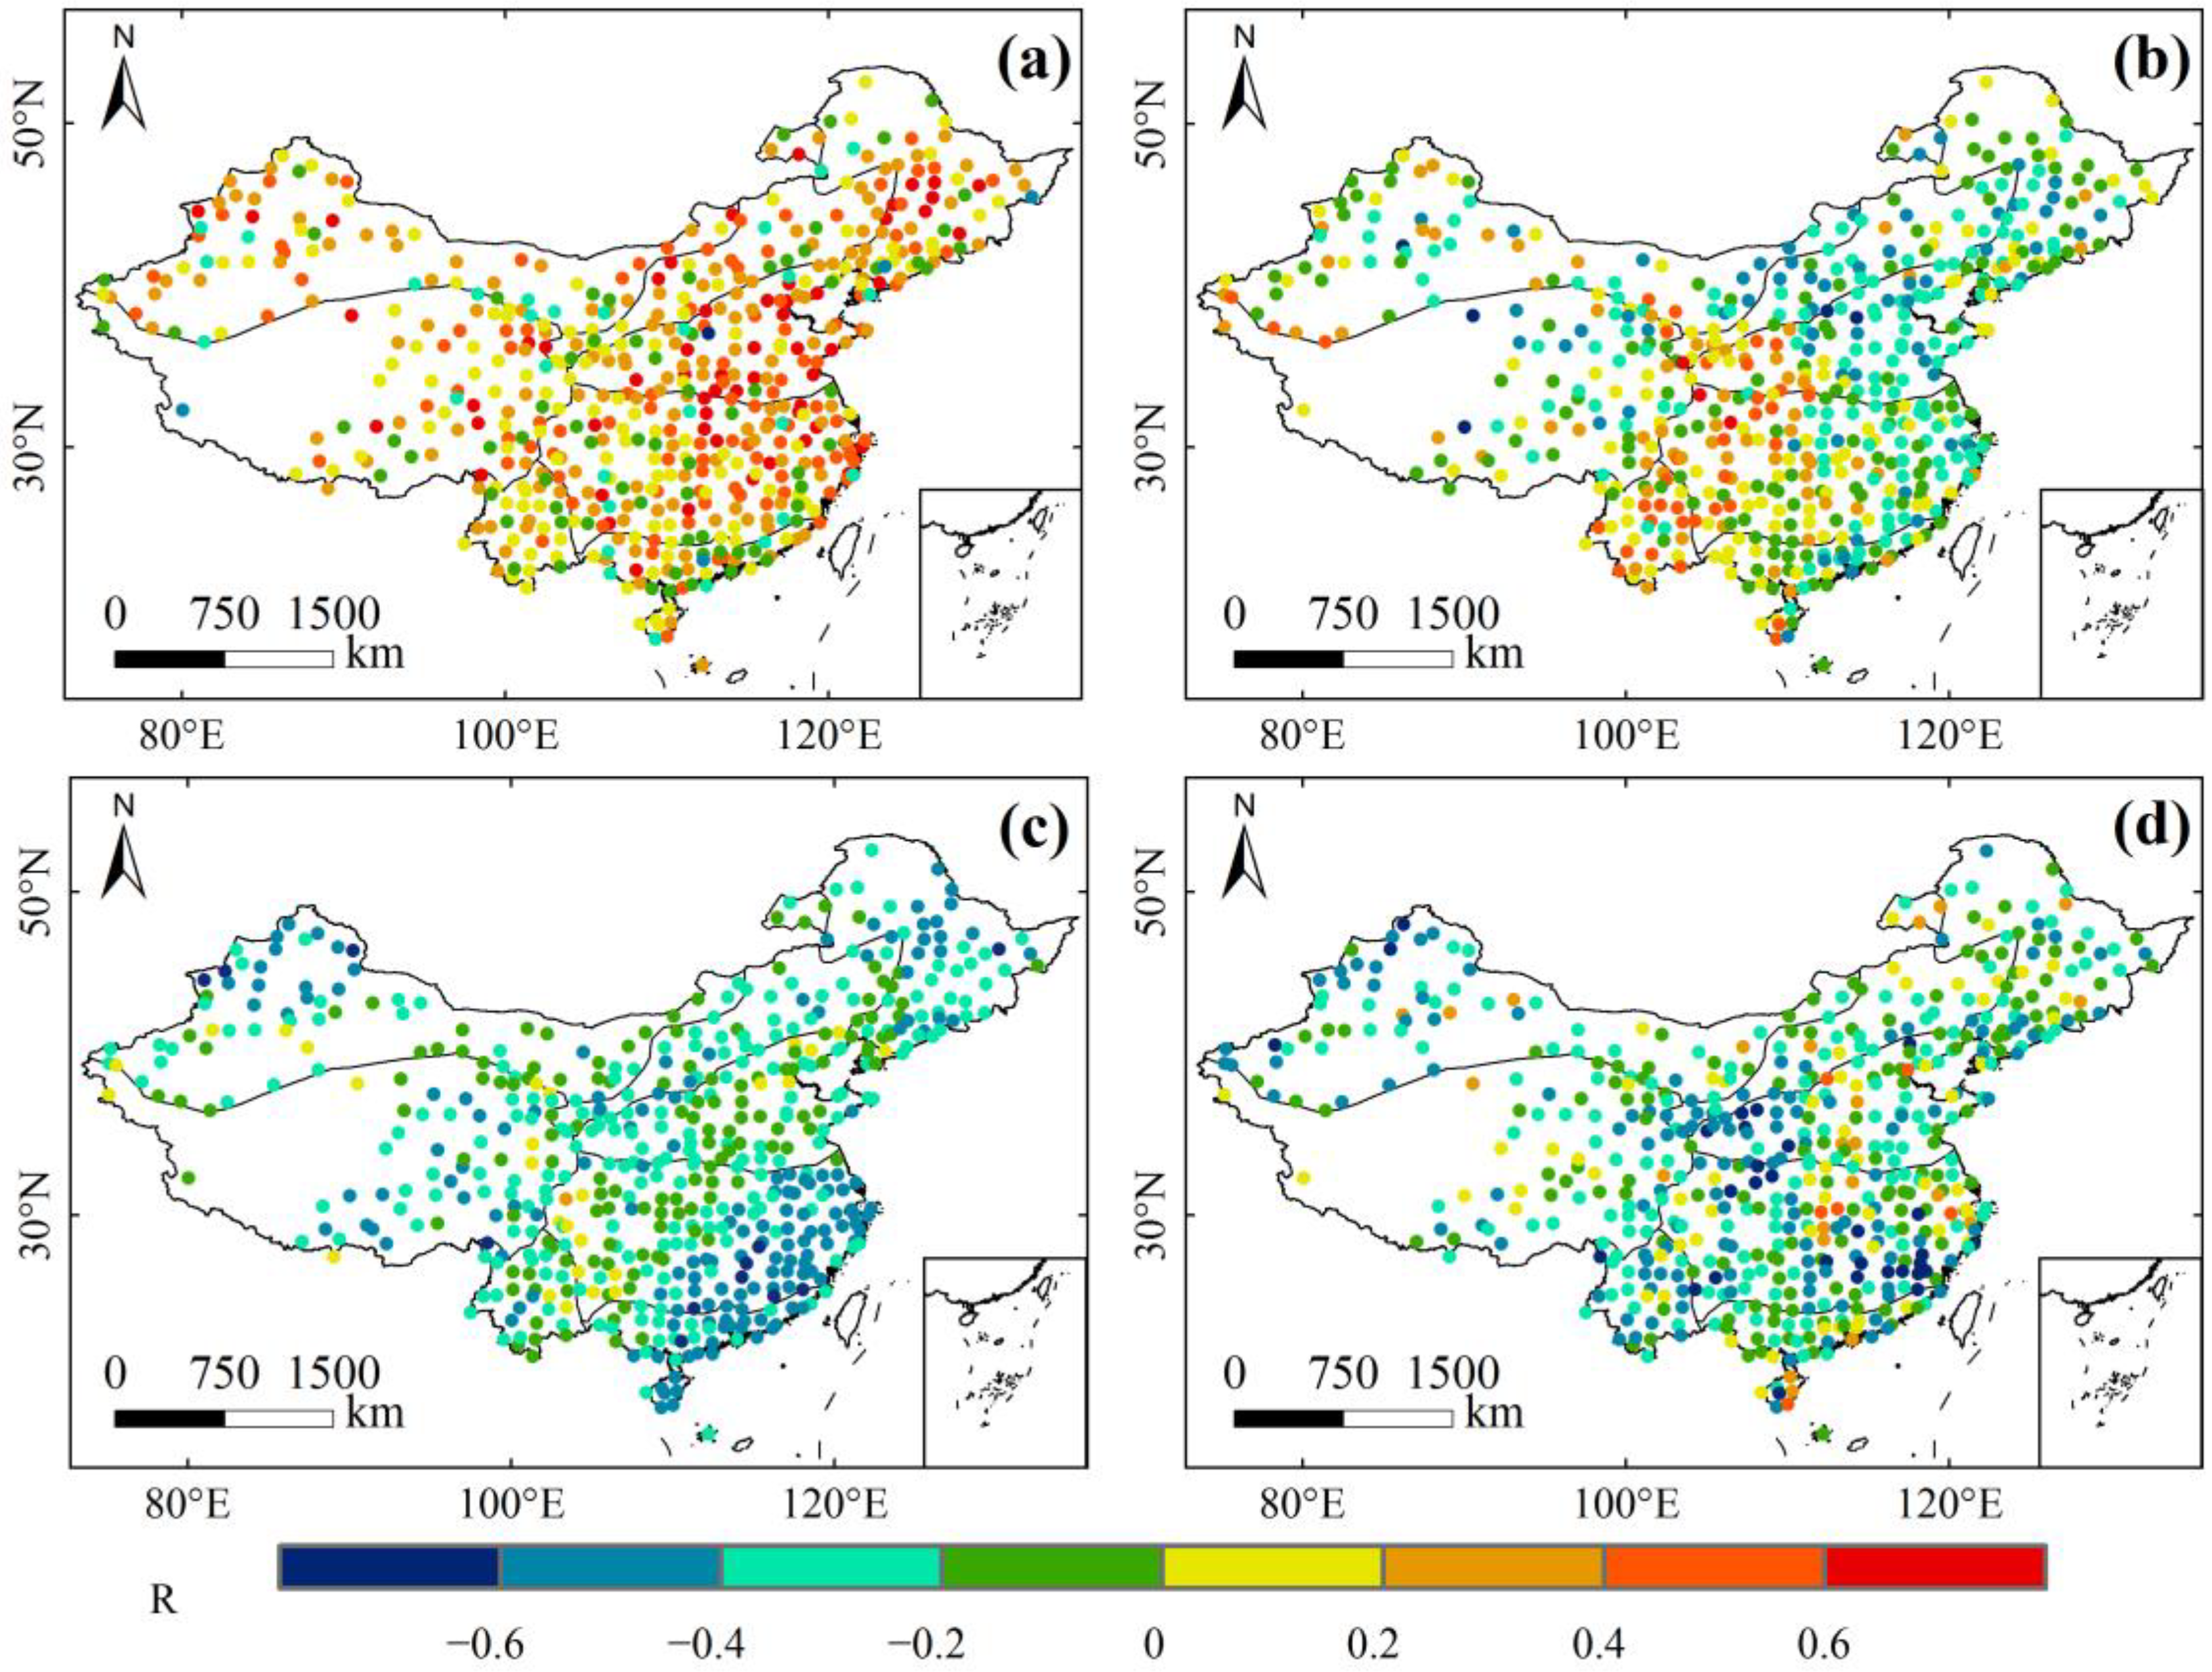
3.3.1. Relationship of Annual SD with Meteorological Factors

Figure 7 shows the relationship of annual SD with wind speed, mean temperature, precipitation and relative humidity. Wind speed presented a declining trend that may be due to the increased human buildings or global-scale warming [55,56], which was similar to that of annual SD, with a tendency rate of −0.11 m/s per decades. Annual SD showed a significantly positive correlation with wind speed (R = 0.76, p < 0.01). It is obvious that the annual average temperature displayed an upward trend, with the rate of 0.27 °C/10a, contrary to the variation of SD. Similar conclusions have been drawn by Ren et al. [57] and Yang et al. [58]. Therefore, annual SD was significantly negatively correlated with annual average temperature (R = −0.60, p < 0.01). In addition, annual SD decreased as precipitation increased with a trend rate of 4.41 mm/10a, and it was also significantly negatively correlated with precipitation (R = −0.41, p < 0.01). Relative humidity showed a slight decline trend (−0.43%/10a); however, there was no significantly positive correlation between annual SD and relative humidity (R = 0.12, p > 0.1).
Figure 8 shows the correlation between annual SD and the meteorological elements at each station. Stations with positive correlation between annual SD and wind speed accounted for a large proportion in all parts of China. Among them, the correlation between annual SD and wind speed was the most significant in the eastern region. In CD region, annual SD was positively correlated with temperature. Nevertheless, the negative correlation between them increased gradually from southeast to northwest. In addition, the negative correlation between annual SD and precipitation was the most obvious in southeastern China, exhibiting a high–low–high spatial pattern from southeast to northwest. Noticeably, the negative correlation between annual SD and relative humidity in Southwest China and Northwest China was the most obvious.

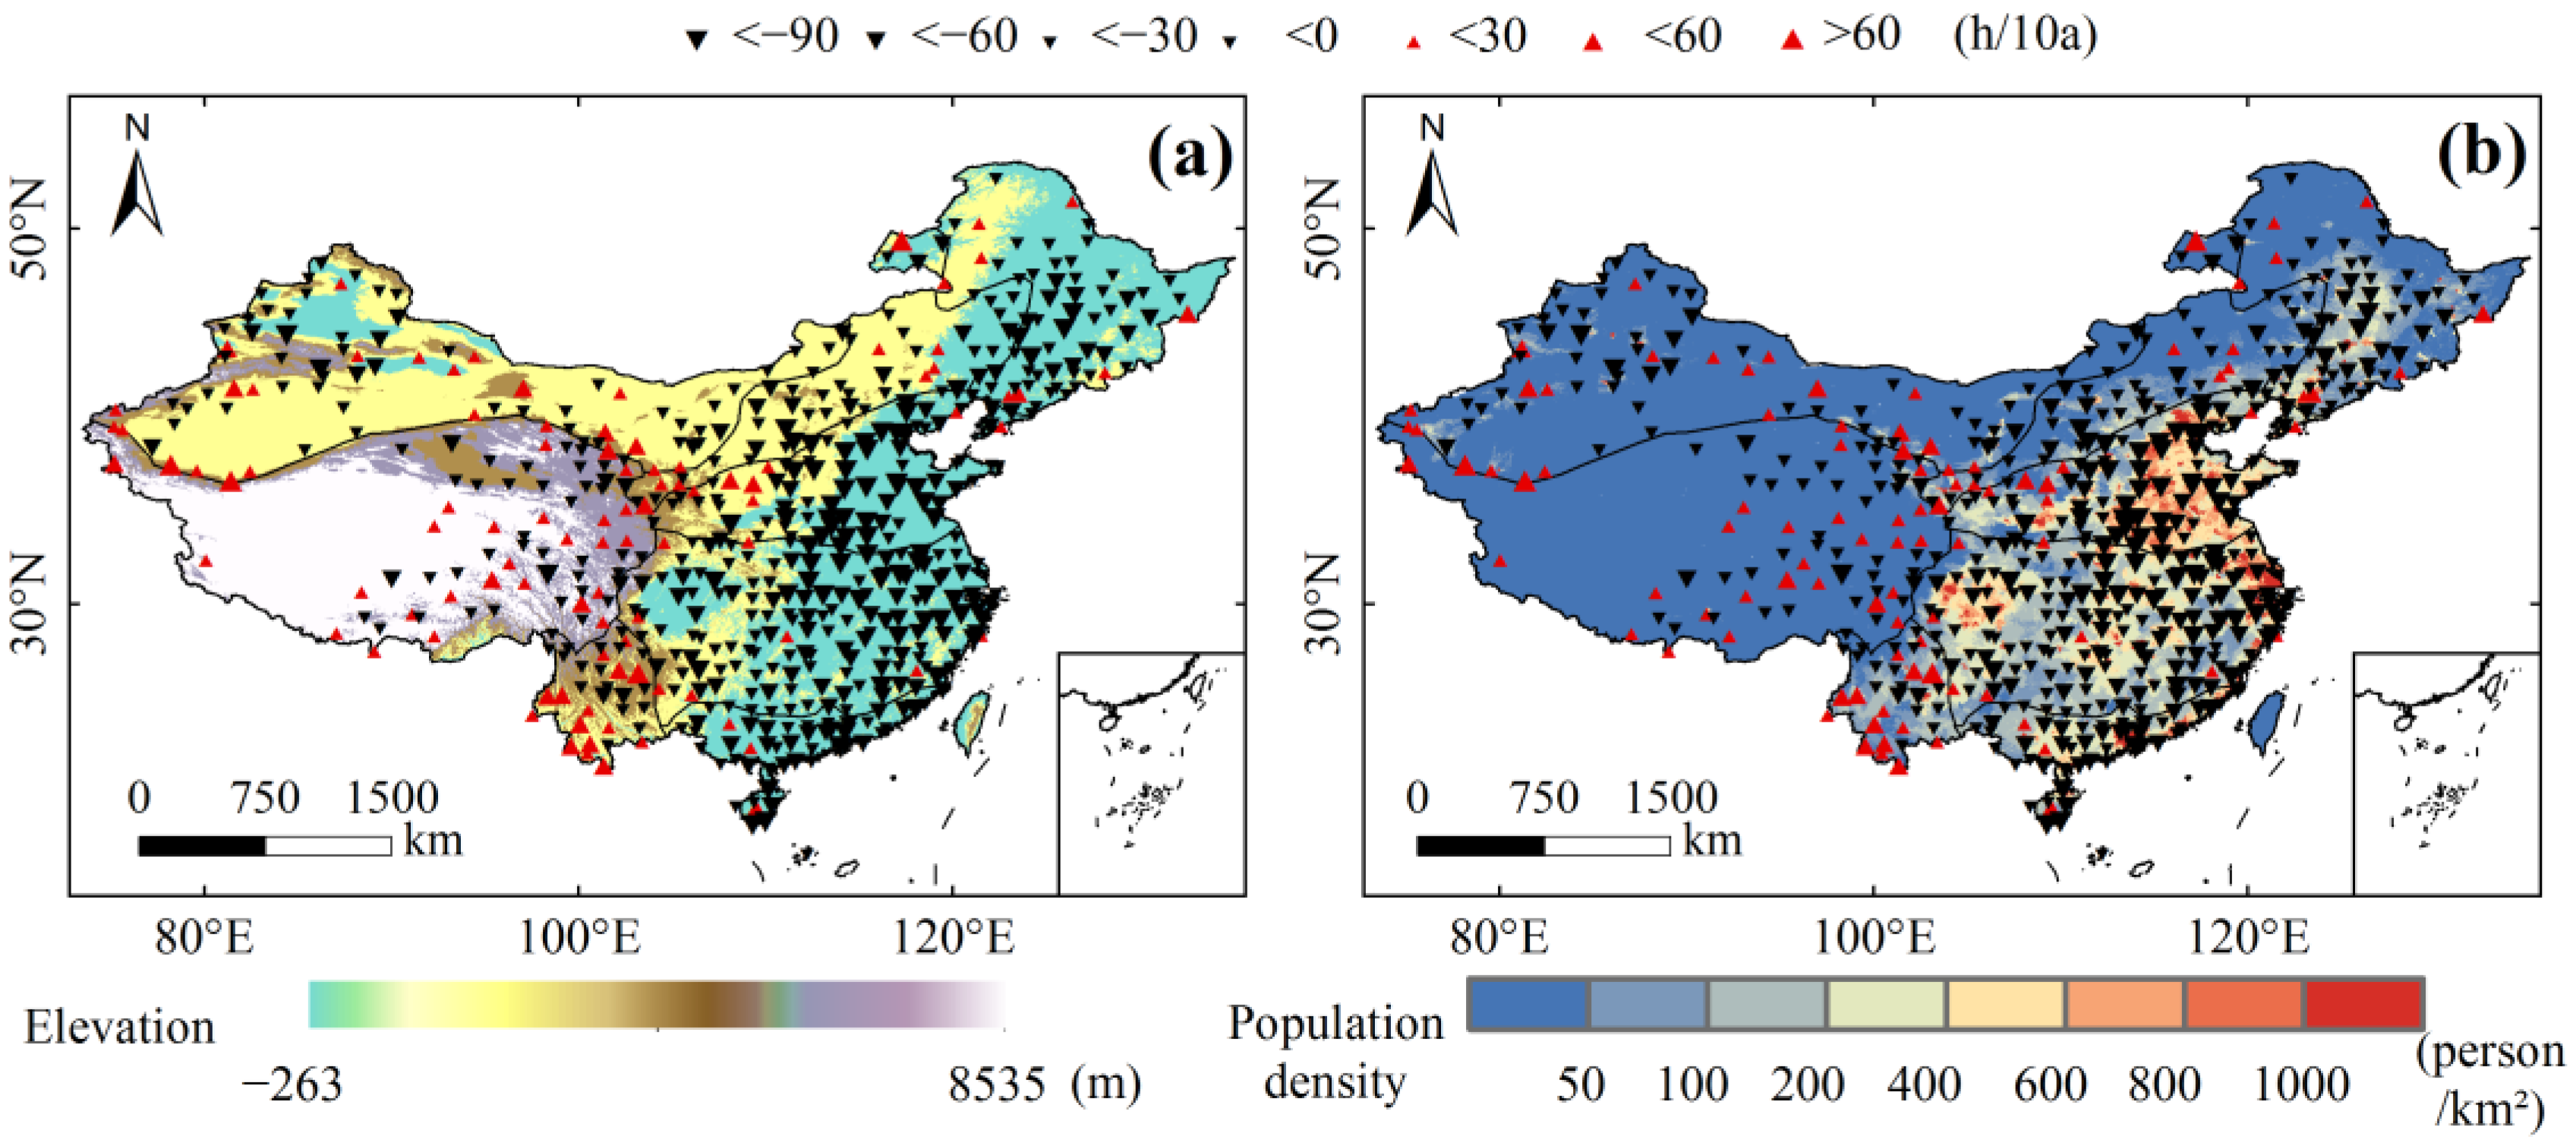
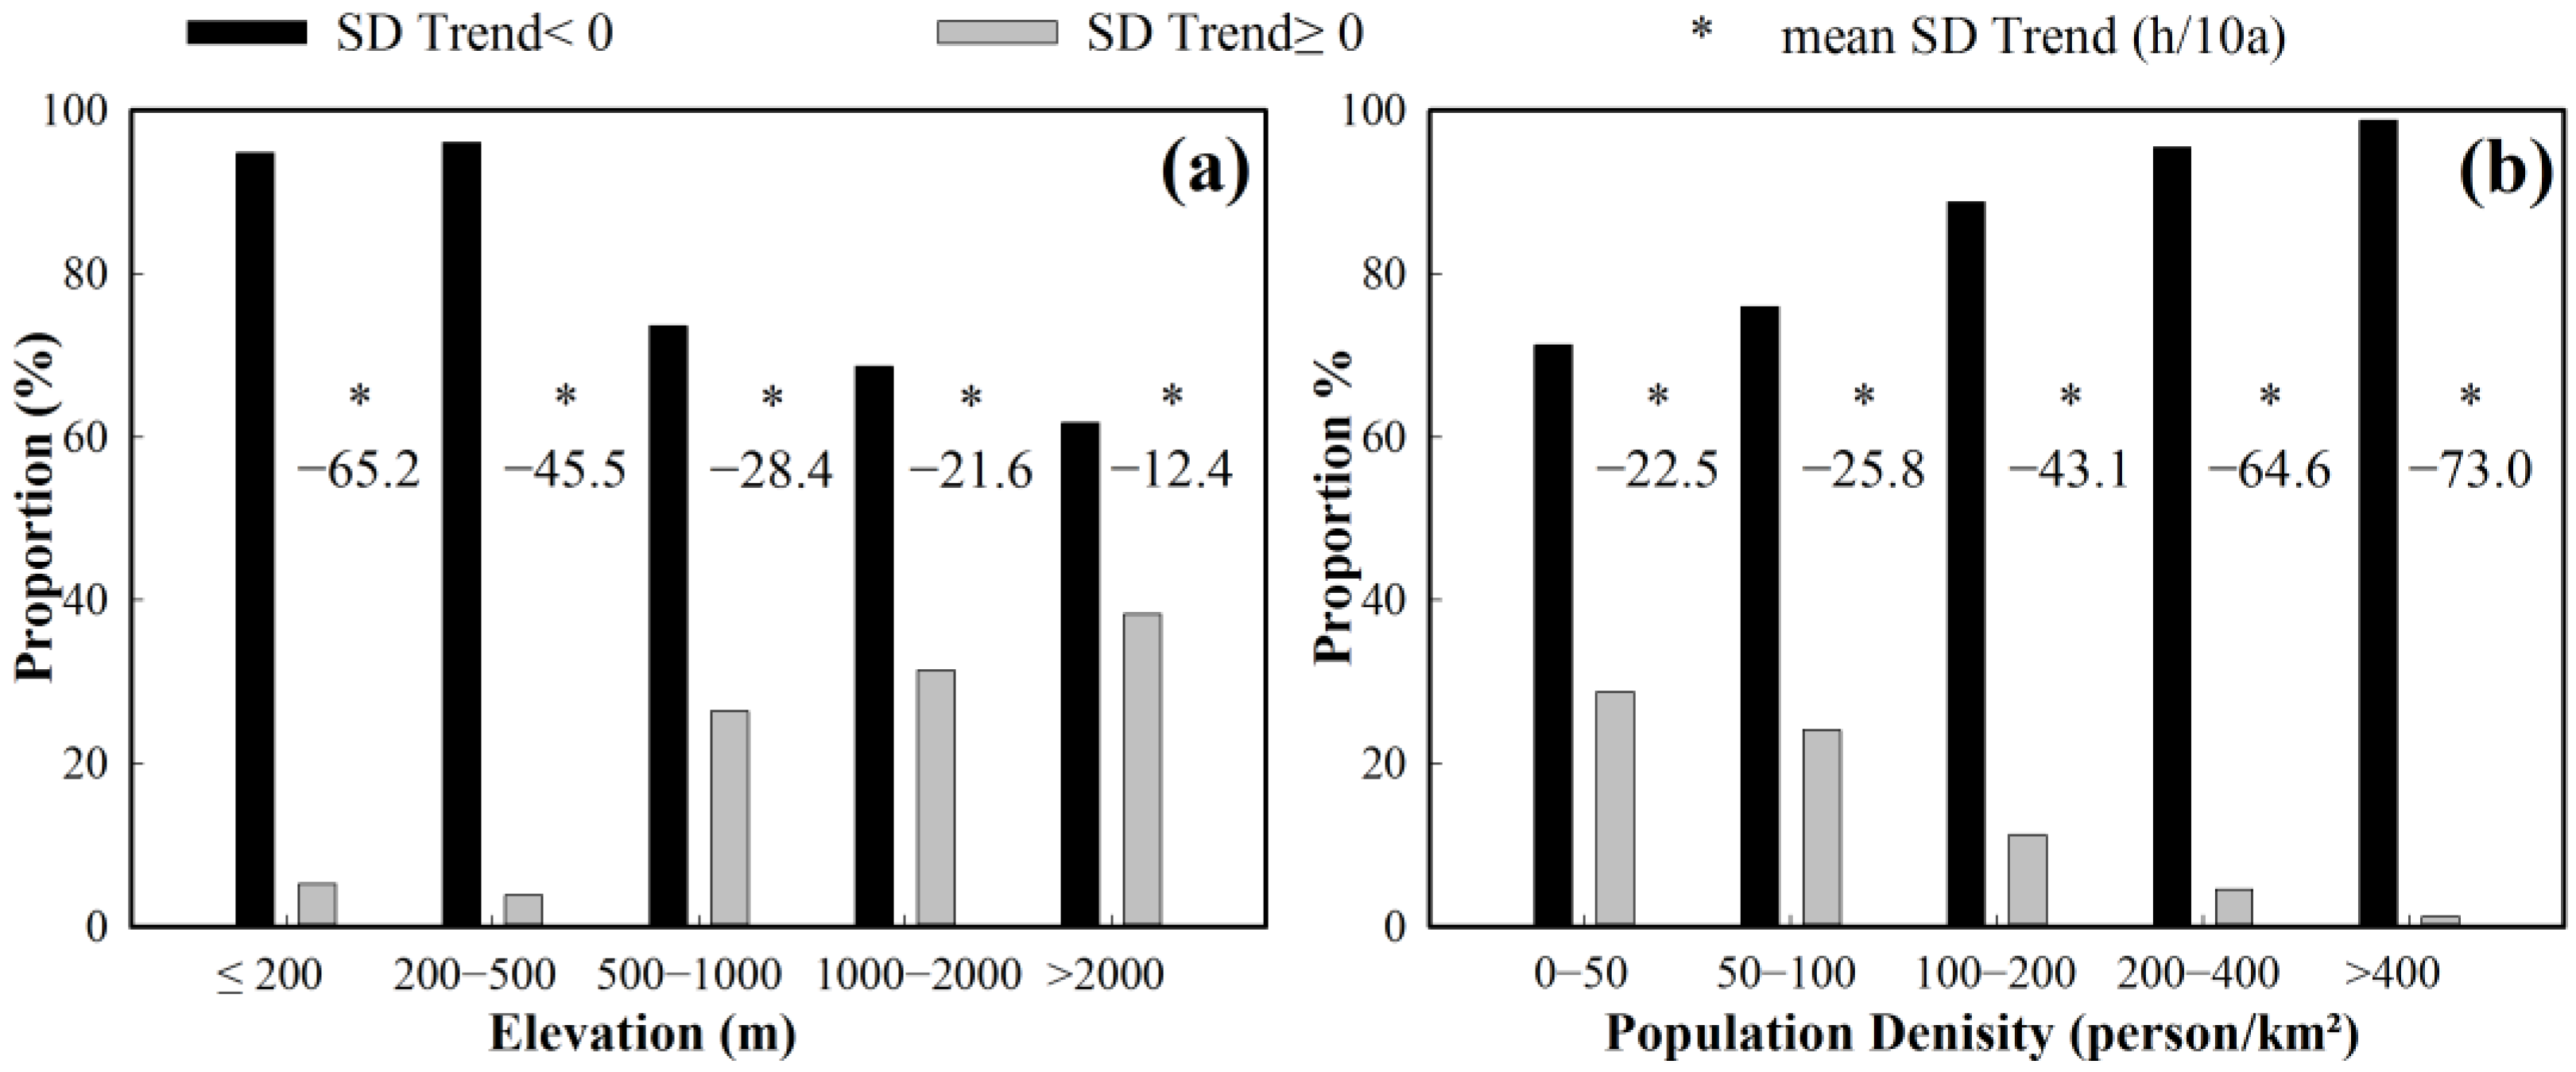
3.3.2. The Correlation between the Variation of Annual SD and Elevation

Elevation not only affects the distribution of SD in China, but also has an obvious influence on the change of SD (Figure 9a). The number of stations with an upward trend in annual SD was significantly larger in western and southwest China with higher terrain than that in the eastern region. To further explain this phenomenon, the variation in annual SD was compared with the population density of China in 2015 (Figure 9b). It is clear that larger decline in annual SD generally occurred in the eastern part of mainland China with lower altitude and higher population density. On the contrary, stations exhibiting increasing trends were usually found in higher altitude areas with lower population density. Similar conclusions have been drawn by Alpert et al. [59].
In order to further explore the influence of elevation and population density on the variation of annual SD, the variation of annual SD at different elevations and population densities were analyzed (Figure 10). Obviously, the proportion of stations exhibiting downward trends in annual SD decreased gradually and the average decline rate of annual SD slowed down with the rise of altitude (Figure 10a). The average decreasing rate was 65.2 h/10a in regions with an altitude of less than 200 m, while it was only −12.4 h/10a in regions with altitude of more than 2000 m. Figure 10b shows the relationship between variation of annual SD and population density. With the rise of population density, the proportion of stations presenting decreasing trends in annual SD increased steadily, and the average decline rate of annual SD tended to ascend significantly.

4. Discussion

Annual SD decreased significantly in mainland China (p < 0.05) during 1961 to 2016, with a tendency rate of −40.7 h/10a. The largest decline was in the 1980s, consistent with the findings of Wang et al. [28]. After reaching the lowest point in the early 1990s, the trend of annual SD gradually stabilized, which was also reported by Wild et al. [9]. In their update study, Wild et al. points to a downward trend after 2000 [1]. A similar decline in annual SD is also found in this present study. The regions with the largest decrease rate in annual SD were located in NC and CC, which has also been reported by Ren et al. [57]. Among the four seasons, the decline in SD was the strongest in summer (−16.8 h/10a), followed by winter (−9.9 h/10a), autumn (−9.5 h/10a) and spring (−4.5 h/10a). Similar conclusions have been drawn by Xia [15]. The decrease of SD in spring was weak in each climate region, and the downward rate for each season was greater in the eastern part than that in the western part.
The relationship between annual SD and four meteorological factors was also analyzed. It was found that annual SD is significantly positive correlated with wind speed in mainland China. Wind speed affects SD by adjusting the air pollution level for the regions with serious air pollution (mainly concentrated in the east), and the effect of this regulation becomes more obvious with the intensification of air pollution. This regulation mechanism has been put forward by Wang et al. [35] and Huang et al. [60]. In this study, the most obvious correlation between annual SD and wind speed is found in the polluted eastern region, which has further verified this theory. The correlation between annual SD and precipitation presents a high–low–high spatial pattern from southeast to northwest. The cause of this phenomenon should be related to the increasing number of rainy days. Although we have analyzed the relationship between annual SD and four meteorological elements, quantitative analysis is not conducted in this present study. We will carry out quantitative analysis for the specific four meteorological elements in a future study.
The change rate of annual SD is also found to be related to elevation. In contrast, the correlation of variation in annual SD and population density is higher. Alpert et al. [59] point out that the solar radiation decreases more in the areas with higher population density. Human activities increase the level of environmental pollution and greenhouse effect [16,32,61], and human buildings also have a certain weakening effect on wind speed [55,56]. Therefore, population density should be a more important factor than altitude.
In this study, a sudden change in annual SD was found around 1982, and reflected in all regions. The same mutation was also found in the Wei River Basin [30] and Tibet Plateau [31]. In addition, most regions also show a mutation signal in 1987. However, the four meteorological elements did not display mutation during the same period (Table 4). Sun et al. [31] point out that low sunshine years have a good correlation with the years of major volcanic eruptions. Power [39] directly proposes that volcanic eruptions in 1982 reduce global solar radiation to a certain extent. In the 1980s, there were three volcanoes (1980 St. Helens, UK, 1981 El Chichon, Mexico, 1986 Ōshima, Japan) with a wide range of impacts, which coincided with the abrupt changes in annual SD in the same period. Annual SD declined faster in the 1980s than that in the previous 20 years, which was probably due to the volcanic eruptions rather than meteorological factors. In general, the increase of precipitation would induce the decline of annual SD. A slight drop in the mutation in annual SD in 2005 and the abrupt rise in precipitation occurred in the same year. Consequently, the sudden rise in precipitation may be the cause of the reduced mutation of annual SD in 2005.
The drop in mutation signal in annual SD was detected in 1991 only at high latitudes (Figure 6), but no abrupt changes occurred on the whole. For most regions, although a sudden decrease in annual SD occurred around 1990, it gradually recovered to the pre-mutation values before 2000. In general, mutation test methods are mainly used to test the mean mutation in this study; however, they cannot accurately capture the jump in mutation. This jumping mutation is determined by the characteristics of volcanic aerosol. The aerosol of volcanic eruptions is usually retained in the stratosphere for about two years [62]. With the dissipation of volcanic aerosol, its effect on the reduction of SD would gradually disappear. However, several high-intensity volcanic eruptions occurred in the 1980s, with multiple volcanic eruptions of aerosols superimposed [62], which caused the volcanic aerosol to be difficult to dissipate. As a result, volcanic aerosols weakened the SD for a longer time, resulting in a mutation in the mean value.

5. Conclusions

In this study, the spatio-temporal variability of SD was examined, and the factors related to SD were also studied based on the data from 569 meteorological stations in mainland China and each climate region during 1961–2016. The results showed that annual and seasonal SD decreased in most parts of mainland China. The tendency rate of annual SD was −40.7 h/10a in mainland China during 1961–2016. In particular, the decline of SD was strongest in summer (−16.8 h/10a), followed by winter (−9.9 h/10a), autumn (−9.5 h/10a) and spring (−4.5 h/10a), respectively. NC exhibited the most significant decrease of annual SD, while the weakest decrease in trend appeared in the CD and QT regions. Annual SD was negatively correlated with temperature and precipitation; however, it was positively correlated with wind speed and relative humidity. Moreover, the altitude and population density may affect the values and variations of annual SD in mainland China. Two abrupt change points of annual SD were detected in 1982 and 1987 by using various mutation testing methods. In addition, a rapid decline in SD was observed in the 1980s, which was possibly due to the volcanic eruptions. However, the abrupt change of SD in 2005 may be affected by the increase of precipitation.

Author Contributions

Z.F., B.G., S.R., Y.L. carried out the calculation, result analysis and drafted the manuscript, which was revised by all authors. All authors gave their approval of the version submitted for publication.

Funding

This work is supported by the National Natural Science Foundation of China (41807170), Natural Science Foundation of Shandong Province (ZR2017BD021), SDUST Research Fund (2014TDJH101), Opening Fund of Key Laboratory of Geomatics and Digital Technology of Shandong Province and Guizhou Provincial Education Department Innovation Group Major Research Project (KY [2016] 055, 054).

Acknowledgments

We appreciate the editors and the reviewers for their constructive suggestions and insightful comments, which helped us greatly to improve this manuscript.

Conflicts of Interest

The authors declare no conflict of interest.

References

  1. Wild, M. Global dimming and brightening: A review. J. Geophys. Res. Atmos. 2009, 114. [Google Scholar] [CrossRef] [Green Version]
  2. Wild, M. Enlightening global dimming and brightening. Bull. Am. Meteorol. Soc. 2012, 93, 27–37. [Google Scholar] [CrossRef]
  3. D’Adamo, I. The profitability of residential photovoltaic systems. A new scheme of subsidies based on the price of CO2 in a developed PV market. Soc. Sci. 2018, 7, 148. [Google Scholar] [CrossRef] [Green Version]
  4. Osseweijer, F.J.; van den Hurk, L.B.; Teunissen, E.J.; van Sark, W.G. A comparative review of building integrated photovoltaics ecosystems in selected European countries. Renew. Sustain. Energy Rev. 2018, 90, 1027–1040. [Google Scholar] [CrossRef]
  5. Olowu, T.O.; Sundararajan, A.; Moghaddami, M.; Sarwat, A.I. Future challenges and mitigation methods for high photovoltaic penetration: A survey. Energies 2018, 11, 1782. [Google Scholar] [CrossRef] [Green Version]
  6. Barragán-Escandón, A.; Zalamea-León, E.; Terrados-Cepeda, J. Incidence of photovoltaics in cities based on indicators of occupancy and urban sustainability. Energies 2019, 12, 810. [Google Scholar] [CrossRef] [Green Version]
  7. Kazaz, A.; Adiguzel Istil, S. A comparative analysis of sunshine duration effects in terms of renewable energy production rates on the LEED BD + C projects in Turkey. Energies 2019, 12, 1116. [Google Scholar] [CrossRef] [Green Version]
  8. Stanhill, G.; Cohen, S. Global dimming: A review of the evidence for a widespread and significant reduction in global radiation with discussion of its probable causes and possible agricultural consequences. Agric. For. Meteorol. 2001, 107, 255–278. [Google Scholar] [CrossRef]
  9. Wild, M.; Gilgen, H.; Roesch, A.; Ohmura, A.; Long, C.N.; Dutton, E.G.; Forgan, B.; Kallis, A.; Russak, V.; Tsvetkov, A. From dimming to brightening: Decadal changes in solar radiation at Earth’s surface. Science 2005, 308, 847–850. [Google Scholar] [CrossRef] [Green Version]
  10. Pinker, R.; Zhang, B.; Dutton, E. Do satellites detect trends in surface solar radiation? Science 2005, 308, 850–854. [Google Scholar] [CrossRef] [Green Version]
  11. Augustine, J.A.; Dutton, E.G. Variability of the surface radiation budget over the United States from 1996 through 2011 from high-quality measurements. J. Geophys. Res. Atmos. 2013, 118, 43–53. [Google Scholar] [CrossRef] [Green Version]
  12. Wang, Y.J.; Huang, Y.; Zhang, W. Changes in surface solar radiation in mainland China over the period from 1961 to 2003. Clim. Environ. Res. 2009, 14, 405–413. [Google Scholar]
  13. Fan, J.; Wu, L.; Zhang, F.; Cai, H.; Zeng, W.; Wang, X.; Zou, H. Empirical and machine learning models for predicting daily global solar radiation from sunshine duration: A review and case study in China. Renew. Sustain. Energy Rev. 2019, 100, 186–212. [Google Scholar] [CrossRef]
  14. He, Y.Y.; Wang, K.; Zhou, C.; Wild, M. A revisit of global dimming and brightening based on the sunshine duration. Geophys. Res. Lett. 2018, 45, 4281–4289. [Google Scholar] [CrossRef]
  15. Xia, X.G. Spatiotemporal changes in sunshine duration and cloud amount as well as their relationship in China during 1954–2005. J. Geophys. Res. Atmos. 2010, 115. [Google Scholar] [CrossRef] [Green Version]
  16. Kaiser, D.P.; Qian, Y. Decreasing trends in sunshine duration over China for 1954–1998: Indication of increased haze pollution? Geophys. Res. Lett. 2002, 29, 38. [Google Scholar] [CrossRef]
  17. Wild, M.; Trüssel, B.; Ohmura, A.; Long, C.N.; König-Langlo, G.; Dutton, E.G.; Tsvetkov, A. Global dimming and brightening: An update beyond 2000. J. Geophys. Res. Atmos. 2009, 114, D10. [Google Scholar] [CrossRef] [Green Version]
  18. Sanchez-Lorenzo, A.; Brunetti, M.; Calbó, J.; Martin-Vide, J. Recent spatial and temporal variability and trends of sunshine duration over the Iberian Peninsula from a homogenized data set. J. Geophys. Res. Atmos. 2007, 112, D20. [Google Scholar] [CrossRef] [Green Version]
  19. Sanchez-Lorenzo, A.; Wild, M. Decadal variations in estimated surface solar radiation over Switzerland since the late 19th century. Atmos. Chem. Phys. 2012, 12, 8635–8644. [Google Scholar] [CrossRef] [Green Version]
  20. Angell, J.K. Variation in United States cloudiness and sunshine duration between 1950 and the drought year of 1988. J. Clim. 1990, 3, 296–308. [Google Scholar] [CrossRef] [Green Version]
  21. Stanhill, G. Global dimming: A new aspect of climate change. Weather 2005, 60, 11–14. [Google Scholar] [CrossRef]
  22. Inoue, T.; Matsumoto, J. Seasonal and secular variations of sunshine duration and natural seasons in Japan. Int. J. Climatol. 2003, 23, 1219–1234. [Google Scholar] [CrossRef]
  23. Power, H. Trends in solar radiation over Germany and an assessment of the role of aerosols and sunshine duration. Theor. Appl. Climatol. 2003, 76, 47–63. [Google Scholar] [CrossRef]
  24. Wild, M.; Ohmura, A.; Schär, C.; Müller, G.; Folini, D.; Schwarz, M.; Hakuba, M.Z. The Global Energy Balance Archive (GEBA) version 2017: A database for worldwide measured surface energy fluxes. Earth Syst. Sci. Data 2017, 9, 601–613. [Google Scholar] [CrossRef] [Green Version]
  25. Che, H.Z.; Shi, G.; Zhang, X.; Arimoto, R.; Zhao, J.; Xu, L.; Wang, B.; Chen, Z. Analysis of 40 years of solar radiation data from China, 1961–2000. Geophys. Res. Lett. 2005, 32. [Google Scholar] [CrossRef]
  26. Wang, Y.W.; Wild, M. A new look at solar dimming and brightening in China. Geophys. Res. Lett. 2016, 43. [Google Scholar] [CrossRef]
  27. Jiang, L.; Zhang, J.; Fang, Y. Time-scaling properties of sunshine duration based on detrended fluctuation analysis over China. Atmosphere 2019, 10, 83. [Google Scholar] [CrossRef] [Green Version]
  28. Wang, Y.W.; Yang, Y.; Zhao, N.; Liu, C.; Wang, Q. The magnitude of the effect of air pollution on sunshine hours in China. J. Geophys. Res. Atmos. 2012, 117, D21. [Google Scholar] [CrossRef]
  29. Wang, Y.W.; Yang, Y. China’s dimming and brightening: Evidence, causes and hydrological implications. Ann. Geophys. 2014, 32, 41–55. [Google Scholar] [CrossRef] [Green Version]
  30. Jiang, C.; Wang, F.; Zhang, R.H.; Mu, X.M.; Li, R. Variation characteristics of sunshine duration and wind speed in the last 52 years in Wei River Basin. Agric. Res. Arid Areas 2012, 30, 228–234. [Google Scholar]
  31. Sun, C.; Liu, Y.; Song, H.; Cai, Q.; Li, Q.; Wang, L.; Mei, R.; Fang, C. Sunshine duration reconstruction in the southeastern Tibetan Plateau based on tree-ring width and its relationship to volcanic eruptions. Sci. Total Environ. 2018, 628, 707–714. [Google Scholar] [CrossRef] [PubMed]
  32. Song, Z.; Chen, L.; Wang, Y.; Liu, X.; Lin, L.; Luo, M. Effects of urbanization on the decrease in sunshine duration over eastern China. Urban Clim. 2019, 28, 100471. [Google Scholar] [CrossRef]
  33. Xia, X.G.; Chen, H.; Li, Z.; Wang, P.; Wang, J. Significant reduction of surface solar irradiance induced by aerosols in a suburban region in Northeastern China. J. Geophys. Res. Atmos. 2007, 112, D22. [Google Scholar] [CrossRef] [Green Version]
  34. Wang, Y.W.; Yang, Y.; Han, S.; Wang, Q.; Zhang, J. Sunshine dimming and brightening in Chinese cities (1955–2011) was driven by air pollution rather than clouds. Clim. Res. 2013, 56, 11–20. [Google Scholar] [CrossRef] [Green Version]
  35. Wang, Y.W.; Yang, Y.; Zhou, X.; Zhao, N.; Zhang, J. Air pollution is pushing wind speed into a regulator of surface solar irradiance in China. Environ. Res. Lett. 2014, 9, 054004. [Google Scholar] [CrossRef]
  36. Yang, Y.H.; Zhao, N.; Hao, X.H.; Li, C.Q. Decreasing trend of sunshine hours and related driving forces in North China. Theor. Appl. Climatol. 2009, 97, 91–98. [Google Scholar] [CrossRef]
  37. You, Q.L.; Kang, S.; Flügel, W.-A.; Sanchez-Lorenzo, A.; Yan, Y.; Huang, J.; Martin-Vide, J. From brightening to dimming in sunshine duration over the eastern and central Tibetan Plateau (1961–2005). Theor. Appl. Climatol. 2010, 101, 445–457. [Google Scholar] [CrossRef]
  38. Ren, J.; Lei, X.; Zhang, Y.; Wang, M.; Xiang, L. Sunshine duration variability in Haihe River Basin, China, during 1966–2015. Water 2017, 9, 770. [Google Scholar] [CrossRef] [Green Version]
  39. Power, H.; Mills, D. Solar radiation climate change over Southern Africa and an assessment of the radiative impact of volcanic eruptions. Int. J. Climatol. 2005, 25, 295–318. [Google Scholar] [CrossRef]
  40. Stanhill, G.; Cohen, S. Solar radiation changes in the United States during the twentieth century: Evidence from sunshine duration measurements. J. Clim. 2005, 18, 1503–1512. [Google Scholar] [CrossRef]
  41. Chinese Government Network. Available online: http://www.gov.cn/guoqing/2005-09/13/content_2582628.htm (accessed on 10 December 2019).
  42. National Meteorological Information Center of the China Meteorological Administration. Available online: http://data.cma.cn/ (accessed on 10 December 2019).
  43. Xu, X.L. Grid Data Set of Spatial Distribution Kilometers of Population in China. Data Registration and Publishing System of Resource and Environment Science Data Center of Chinese Academy of Sciences. Available online: http://www.resdc.cn/doi (accessed on 10 December 2019).
  44. Mann, H.B. Nonparametric tests tgainst trend. Econometrica 1945, 13, 245–259. [Google Scholar] [CrossRef]
  45. Sang, Y.F.; Wang, Z.G.; Liu, C.M. Comparison of the MK test and EMD method for trend identification in hydrological time series. J. Hydrol. 2014, 510, 293–298. [Google Scholar] [CrossRef]
  46. Burn, D.H.; Elnur, M.A.H. Detection of hydrologic trends and variability. J. Hydrol. 2002, 255, 107–122. [Google Scholar] [CrossRef]
  47. Yin, Y.H.; Wu, S.H.; Chen, G. Regional difference of climate trend and abrupt climate change in China during 1961–2006. J. Nat. Resour. 2009, 24, 2147–2157. [Google Scholar]
  48. Bernaola-Galván, P.; Grosse, I.; Carpena, P.; Oliver, J.L.; Román-Roldán, R.; Stanley, H.E. Finding borders between coding and noncoding DNA regions by an entropic segmentation method. Phys. Rev. Lett. 2000, 85, 1342. [Google Scholar] [CrossRef] [PubMed] [Green Version]
  49. Feng, G.-L.; Gong, Z.-Q.; Dong, W.-J.; Li, J.-P. Abrupt climate change detection based on heuristic segmentation algorithm. Acta Phys. Sin. 2005, 54, 5494–5499. [Google Scholar]
  50. Lu, R.; Ye, H. Decreasing trend in summer precipitation over the western Sichuan Basin since the 1950s. Atmos. Ocean. Sci. Lett. 2011, 4, 114–117. [Google Scholar]
  51. Li, J.; Liu, R.; Liu, S.C.; Shiu, C.J.; Wang, J.; Zhang, Y. Trends in aerosol optical depth in northern China retrieved from sunshine duration data. Geophys. Res. Lett. 2016, 43, 431–439. [Google Scholar] [CrossRef] [Green Version]
  52. Yan, X.; Ping, H.; Feng, G.H. Change trend of the precipitation and air temperature in Xinjiang since recent 50 years. Arid Zone Res. 2003, 20, 127–130. [Google Scholar]
  53. Chen, S.-Y.; Zhang, K.-L.; Xing, X.-B.; Dong, A.-X. Climatic change of sunshine duration in Northwest China during the last 47 years. J. Nat. Resour. 2010, 25, 1142–1152. [Google Scholar]
  54. Li, H.; Fu, Z.; Wen, X. Characteristic analysis of sunshine duration change in China during the last 50 years. Clim. Environ. Res. 2013, 18, 203–209. [Google Scholar]
  55. Xu, M.; Chang, C.-P.; Fu, C.; Qi, Y.; Robock, A.; Robinson, D.; Zhang, H.-M. Steady decline of east Asian monsoon winds, 1969–2000: Evidence from direct ground measurements of wind speed. J. Geophys. Res. Atmos. 2006, 111. [Google Scholar] [CrossRef] [Green Version]
  56. Ren, G.; Zhou, Y.; Chu, Z.; Zhou, J.; Zhang, A.; Guo, J.; Liu, X. Urbanization effects on observed surface air temperature trends in North China. J. Clim. 2008, 21, 1333–1348. [Google Scholar] [CrossRef] [Green Version]
  57. Ren, G.; Guo, J.; Xu, M.; Chu, Z.; Li, Z.; Zou, X.; Li, Q.; Liu, X. Climate changes of China’s mainland over the past half century. Acta Meteorol. Sin. 2005, 63, 942–956. [Google Scholar]
  58. Yang, T.; Sun, F.; Liu, W.; Wang, H.; Wang, T.; Liu, C. Using Geo-detector to attribute spatio-temporal variation of pan evaporation across China in 1961–2001. Int. J. Climatol. 2019, 39, 2833–2840. [Google Scholar] [CrossRef]
  59. Alpert, P.; Kishcha, P.; Kaufman, Y.J.; Schwarzbard, R. Global dimming or local dimming?: Effect of urbanization on sunlight availability. Geophys. Res. Lett. 2005, 32. [Google Scholar] [CrossRef] [Green Version]
  60. Huang, X.Y.; Zhang, M.J.; Wang, S.J.; Xin, H.; He, J.Y. Characteristics of variation in sunshine duration and wind speed in the last 50 years in northwest China. J. Nat. Resour. 2011, 26, 825–835. [Google Scholar]
  61. Hu, Z.Z.; Yang, S.; Wu, R. Long-term climate variations in China and global warming signals. J. Geophys. Res. Atmos. 2003, 108, D19. [Google Scholar] [CrossRef]
  62. Lorius, C.; Jouzel, J.; Ritz, C.; Merlivat, L.; Barkov, N.I.; Korotkevich, Y.S.; Kotlyakov, V.M. A 150,000-year climatic record from Antarctic ice. Nature 1985, 316, 591–596. [Google Scholar] [CrossRef]
Figure 1. Digital elevation model (DEM) and locations of the meteorological stations and eight climate regions in mainland China.
Energies 12 04718 g001
Figure 2. Spatial distribution of (a) annual SD and (b) climate tendency rate in mainland China during 1961–2016.
Energies 12 04718 g002
Figure 3. Spatial distribution of sunshine duration (SD) for (a) spring, (b) summer, (c) autumn, and (d) winter in mainland China during 1961–2016.
Energies 12 04718 g003
Figure 4. (a) Variation of annual SD and (b) the result of the Mann–Kendall test in mainland China during 1961–2016 (* refers to percent changes in annual SD from the preceding to the succeeding decade, and ** pronounces percent changes in annual SD from the 1960s to the respective decade).
Energies 12 04718 g004
Figure 5. Variations of SD for (a) spring, (b) summer, (c) autumn, and (d) winter in mainland China during 1961–2016 (* and ** refer to passed p < 0.05 and p < 0.01 significance test, respectively).
Energies 12 04718 g005
Figure 6. Variations of annual SD in (a) NE, (b) IM, (c) GX, (d) NC, (e) CC, (f) SC, (g) CD, and (h) QT (* and ** refer to passed p < 0.05 and p < 0.01 significance test, respectively).
Energies 12 04718 g006
Figure 7. Relationship of annual SD (black line) with (a) wind speed, (b) temperature, (c) precipitation and (d) relative humidity (* and ** refer to passed p < 0.05 and p < 0.01 significance test, respectively).
Energies 12 04718 g007
Figure 8. The correlation between annual SD and (a) wind speed, (b) temperature, (c) precipitation, and (d) relative humidity at each station.
Energies 12 04718 g008
Figure 9. Relationship between variation trend of annual SD and (a) elevations; (b) population density.
Energies 12 04718 g009
Figure 10. Variation of annual SD at different (a) elevations and (b) population density.
Energies 12 04718 g010
Table 1. Climate regions of mainland China in this study.
Climate Region Climate Type
Northeastern China(NE)Cold temperate monsoon climate, monsoon climate of medium latitudes
Inner Mongolia Area(IM)Monsoon climate of medium latitudes, cold temperate monsoon climate
Gan-Xin Area(GX)Cold temperate, temperate, warm temperate climate
North China(NC)Warm temperate monsoon climate
Central China(CC)Subtropical monsoon climate
Southern China(SC)Subtropical, tropical monsoon climate, equatorial monsoon climate
Chuan-Dian Area(CD)Plateau monsoon climate
Qinghai-Tibet Area(QT)Plateau climate
Table 2. Multi-mode mutation test of abrupt change signal (# indicates no mutation point passed the p = 0.05 significance test).
RegionMann-KendallYamamotoMove-tLepage
China1982198219811982
NE1982198219821982
IM1984198219821982
GX1981198119811982
NC#198119811982
CC1980197919801980
SC#19811981#
CD#198719861986
QT1993198719861987
Table 3. Climate tendency rate of SD for each season in eight climate regions (* and ** refer to passed p < 0.05 and p < 0.01 significance test, respectively).
RegionSpring (h/10a)Summer (h/10a)Autumn (h/10a)Winter (h/10a)
NE−11.82 **−10.71 **−8.50 **−6.55 **
IM−5.44−11.70 **−10.52 **−8.94 **
GX−4.59−6.12 **−6.33 **−10.51 **
NC−3.88−30.32 **−17.90 **−17.72 **
CC−3.88−28.47 **−11.30 **−12.62 *
SC−13.50 *−12.67 **−13.10 **−12.71 *
CD−2.46−4.911.531.60
QT−1.52−5.99−2.69−1.44
Table 4. Mutation status of four meteorological elements.
Meteorological ElementWind SpeedPrecipitationRelative HumidityAverage Temperature
MutationNo signal200520031997

