Abstract
The loss of vacuum in the parabolic trough receivers is one of the most common problems in the parabolic trough solar power plants. The vacuum level and gas species in the annulus of the receiver determine the heat loss and have an important influence on the thermal efficient of the solar system. If hydrogen is inside the annulus, it can cause heat losses to be almost four times that of a receiver with good vacuum. However, it is hard to non-destructively measure the gas species and partial pressure in the annulus of the receiver. In this paper, a novel non-destructive method was presented to evaluate the vacuum performance by using combined dielectric barrier discharge and the spectral analysis technology. The discharge characteristics and spectrometric properties of four kinds of gases, which are the most likely gases to be found in the receivers, were studied in the experiments. The test results of the non-destructive vacuum evaluation method agree well with the results of the residual gas analysis. The feasibility and accuracy of the non-destructive test method was verified. The relationship between the vacuum performance of receiver and the spectral characteristics of dielectric barrier discharge were obtained by a series of experiments.
1. Introduction
Concentrating solar power (CSP) is renewable energy technology and offers important advantages as it has the ability of thermal storage. In CSP systems, parabolic trough technology is the most mature and widely used solar thermal power technologies worldwide [1,2]. Parabolic trough receiver tubes are the core components, which convert solar energy into thermal energy. As shown in Figure 1, the tubes are comprised of glass envelope coated in a layer of anti-reflective coating, and absorber tubes covered in a solar selective coating. The glass envelope and the metal tube are connected on both ends by a glass-metal seal and a metal bellows to achieve the necessary vacuum-tight annulus space and to accommodate for thermal expansion difference between the absorber tube and the glass envelope [3,4]. The annulus space must be in a vacuum state to significantly reduce the gas heat convection or conduction and to prevent the solar selective coating oxidizing in high temperatures, which can lead to heat losses from the parabolic trough receiver tubes. A getter is also emplaced within the annulus space to absorb hydrogen and other gases to maintain its vacuum state [5,6].
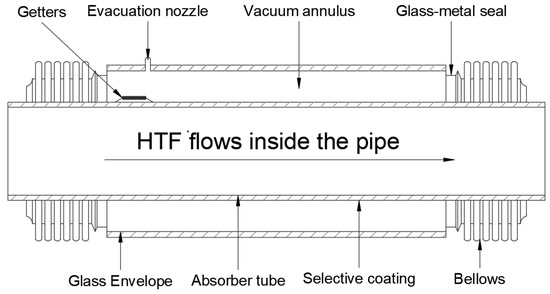
Figure 1.
Typical parabolic trough receiver.
The failures of the receiver tubes have been a problem in parabolic trough solar power plants. The data on the Solar Energy Generating Systems (SEGS) plants that have been operating for a number of years show that receiver tubes have an accumulated failure rate of over 4% [7]. Survey by the U.S. National Renewable Energy Laboratory (NREL) found that the most recent data for the Solar Energy Generating Systems (SEGS) plants indicated that receiver tube failures had decreased to 3.37% of the total field receivers per year [8]. Failures involved vacuum loss, hydrogen infiltration, glass envelope breakage, and degradation of the coating. Of these failures, 55% were reported to involve broken glass and 29% involved loss of vacuum [7,8]. Changes in vacuum performance within the annulus space are inevitable, factors contributing towards the loss of vacuum include materials outgassing, gases permeation, vacuum leakage at seals and welds, getter failure, or saturation [9,10]. Liu et al. [11] determined experimentally that there were H2O, CO2, H2, N2, Ar, and He in the annulus space. Moens [10] presented that the long-term exposure of the heat transfer fluid (diphenyl oxide/biphenyl) to 400 °C temperatures could lead to hydrogen pressures that exceed the gas-absorbing capacity of the hydrogen getters, thereby causing the significant heat losses that were currently observed in several solar trough plants.
The vacuum performance of receiver tubes affects the efficiency and operating economy of the whole solar power system. The heat losses mainly result from the radiation between the solar selective coating and the glass envelope and the convection in the annulus space. In particular, once the annulus space in receiver tubes experiences a loss of vacuum, its heat losses would significantly increase, and its solar selective coating would also become less efficient due to oxidation in high temperatures, significantly reducing the thermal efficiency of the trough solar thermal power plants. In recent years, it has been discovered that hydrogen from degradation of heat transfer oils could permeate through the absorber tube into the vacuum annulus in many parabolic trough stations, which caused the increasing glass temperature and showed the so-called “hot tube phenomena” [12]. Especially, if the partial pressure of hydrogen is more than 10 Pa in the annulus, the heat loss at the level is approximately a factor of 4 higher than the loss for a receiver with good vacuum [3]. The annual plant revenue can then be reduced by as much as 20% by receivers infiltrated with hydrogen [12,13]. Meanwhile, vacuum life is the main factor that decides the life of parabolic trough receiver tubes. It is not only the key index that the manufacturers of receiver tubes focus on, but also the index that power plants operators and maintenance teams care most about. Therefore, it is necessary to identify the vacuum failure among all receiver tubes installed in a large solar field in order to maintain a higher level of thermal efficiency of the system. However, how to non-destructively test and evaluate the vacuum performance of the receiver installed in the solar filed is a technical problem at present.
Price et al. [3] used an infrared camera to measure the surface temperature of the parabolic trough receiver in the solar field. This method makes it possible to roughly judge the heat loss according to the surface temperature of the receiver tube, but can not identify whether the heat loss is caused by vacuum failure or the solar selective coating degradation. It is also hard to judge the type of residual gas and its partial pressure. Pagola et al. [14] developed a fluorescence sensor based on a single fiber measurement system that can monitor degradation of heat transfer fluid (HTF) and fluorescent substances generated by H2 generation, and proposed a method to detect hydrogen molecules in heat transfer fluid as the hydrogen in residual gases comes from permeation of hydrogen in HTF. This method is helpful to define the quantity of hydrogen in the HTF and analyze how much hydrogen can permeate into the vacuum according to the hydrogen forming mechanism in the annulus. To analyze residual gases, Ren et al. [15] presented a residual gas analysis (RGA) method for parabolic trough receiver tubes. The RGA system comprised of a receiver tube opening device, a high vacuum system and a quadrupole mass spectrometer (QMS), which is able to analyze the components and the partial pressure of the residual gases in the annulus space. The RGA method is destructive and needs to be tested indoor. Espinosa-Rueda et al. [16] presented a procedure to evaluate the annulus gas of receivers in the solar field based on the plasma generation and spectral analysis in the annulus space. The method can be used in limits of working pressure range from 1 to 1000 Pa for some gases and mixtures. Setien et al. [17] presented a surface temperature method to determine partial vacuum pressure of receiver tubes not completely damaged by a portable IR camera. It can distinguish partial vacuum pressure among 10−2–105 Pa when the temperature of the receiver is higher than 300 °C and there should be air in the annulus. It does require accurate and careful measurement.
In this paper, a nondestructive testing method is developed to evaluate the vacuum performance of parabolic trough receiver tubes based on the principles of dielectric barrier discharge and spectrometric analysis. A novel test device, including two elements: a gas ionization system and a spectrometric analysis system, was developed to identify the gas composition and partial pressure and evaluate the state of vacuum in the annulus space. The feasibility and accuracy of the testing method were verified by using the RGA system [15]. The different types of gases and partial pressures in the annulus space have been analyzed by using the novel device for the receivers in a series of experiments.
2. Methodology and Test Device
The non-destructive vacuum evaluation of the receiver tubes is based on the principles of dielectric barrier discharge and spectrometric analysis.
2.1. Principle of Dielectric Barrier Discharge
The dielectric barrier discharge (DBD) is a form of electrical discharge in low-pressure and atmospheric pressure. By placing an insulating dielectric barrier between two electrodes, plasma is generated between the electrodes. This is a typical form of high voltage alternating current discharge. Usually, DBD takes three forms according to the working pressure (P) and the discharge gap (D): (1) filamentous discharge; (2) dispersion of discharge; and (3) glow discharge [18,19]. For the given particular annulus space of the receiver tube, the plasma generation depends on the pressure and gas composition.
For filamentous discharge, the current in DBD is formed by the movement of charge in the micro-discharge channel. As the PD value is large, the breakdown process in DBD filamentous discharge belongs to the streamer breakdown. The generation process of discharge is the process from electron to initial electron avalanche and then to secondary electron avalanche, and finally produces discharge channel and forms self-sustaining discharge [20]. Figure 2 shows the filamentous discharge in the annulus space of the receiver tube.
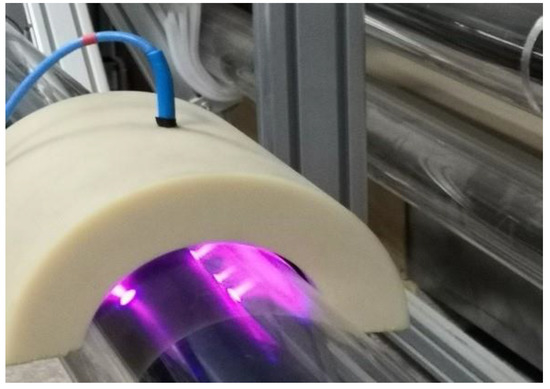
Figure 2.
Emission image of air filamentous discharge at 7000 Pa.
For diffuse discharge, it is an intermediate transition stage between filamentous discharge and glow discharge. It is known as a spot pattern discharge, which is a type of macro-structure displaying certain patterns in both time and space and is a typical non-linear spontaneous phenomenon. Figure 3 shows the emission image of air diffuse discharge in the experiment.
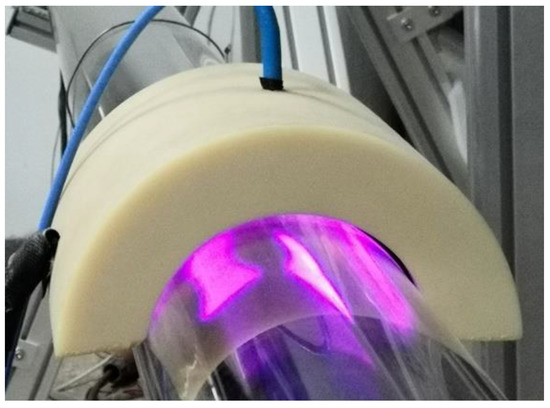
Figure 3.
Emission image of air diffuse discharge at 700 Pa.
For glow discharge, the breakdown process of DBD glow discharge belongs to Townsend breakdown as the PD value is small. Under the condition of low PD value, the positive ion is accelerated by the electric field and bombards the cathode, thus emitting secondary electrons. Then the electron avalanche is generated by the movement of the secondary electrons and the continuous collision of ionized atoms and molecules. Many electron avalanches generated by cathode emission overlap and influence each other in the discharge space, thus forming uniform discharge in the discharge space. Figure 4 shows a luminescent image of DBD glow discharge of helium gas in the experiment.
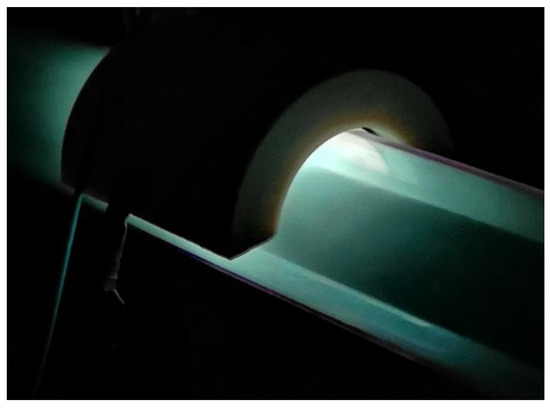
Figure 4.
Emission image of glow discharge of helium gas in the receiver.
2.2. Principles of Spectrometric Analysis
Light spectral emission is a spectrum formed by a large number of photons released by plasma gases from a high energy state to a low energy state. Under the action of electric energy, the outer electrons of atoms and molecules will get a certain amount of energy, causing them to be excited from the lower energy level E1 to the higher energy level E2. At this time, the atoms or molecules are in the excited state. Atoms gain energy ΔE = E2 − E1 referred to as the excitation energy. An electron moving in a high energy state is in an unstable state. When it directly returns to its original energy state, it emits light at a characteristic wavelength of the atom composing the plasma [21]:
where c is the speed of light; h represents Planck’s constant; and E1 and E2 represents the energy of an electron in a lower-level state and a higher-level state, respectively.
An electron in an excited state may also pass through several intermediate energy levels before it returns to its original energy level. At this time, light of several different wavelengths will be generated, forming several spectral lines in the spectrum, with wavelengths of respectively
where, Ea, Eb, Ec, ···En−1 are the energies of the intermediate stages.
Through the measurement and analysis of the profile spectrums, the type of gas compositions in the discharge channel formed during gas discharge can be obtained. Generally, the characteristic wavelengths of the light emitted by plasma are in the range from 200 to 1100 nm.
2.3. Test Method and Device
A non-destructive test method and device were developed for the non-destructive evaluation of the vacuum state and gas compositions in the annular space of the receiver tube in this study. The method included the dielectric barrier discharge to generate plasma and the spectrometric analysis to obtain the characteristic wavelength and the spectrum intensity of the light spectral emission. Meanwhile, when the dielectric barrier discharge cannot happen in the annulus space of the receiver tube, the voltage between the two electrodes depends on the pressure of the annulus space that can be measured. Thus, the pressure of the annulus space could be obtained through the relationship between the pressure and the voltage built by experiments. The flow chart of the test method is shown in Figure 5.
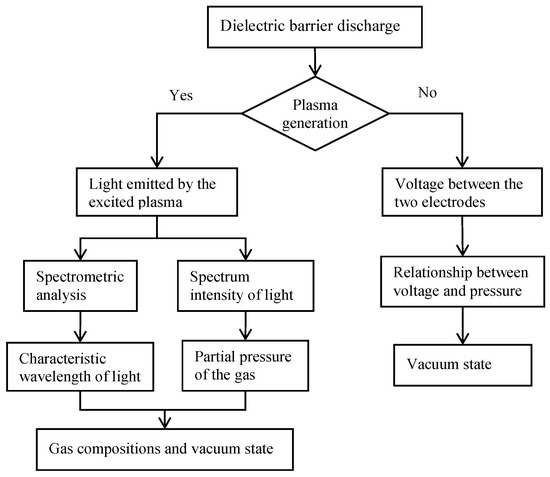
Figure 5.
The flow chart of the test method.
The test device included two elements: a dielectric barrier discharge system and a spectral measurement system. The schematic of the test device is as shown in Figure 6. The dielectric barrier discharge system included an HMV-1 high frequency power source (HFPS), which was made by Yuantuo technology Co. Ltd and a semicircular gas discharge applicator composed of an insulated fixture and a copper electrode and covered on the outer surface of the glass envelope. The HFPS with high voltage had one end connected to the copper electrode and the other end connected to the absorber tube (as the other electrode) of the parabolic trough receiver. The field of the dielectric barrier discharge was formed between the copper electrode covered on the glass envelope and the absorber tube so that the gas in the annular space could realize the dielectric barrier discharge and generate plasma. The absorber tube must be connected to the ground (GND) for safety. The HFPS had a constant current and working frequency mode so that it had the ability to measure the voltage between the two electrodes.
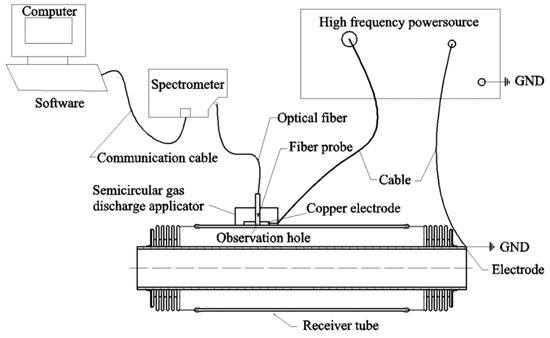
Figure 6.
Schematic of the test device for vacuum evaluation.
The spectral measurement system included a Maya-Pro spectrometer (trademark of Ocean optics), optical fiber and analysis software used to control the measurement and record the emission spectra of 200–1100 nm. One end of the optical fiber was connected to the spectrometer, and the other end was the fiber probe, which was inserted into the observation hole of the fixture. The fiber probe was fixed and kept the same place in the hole for each measurement. The fiber probe transmitted the light emitted in the annulus space to the spectrometer, and then the optical signal was converted into an electrical signal. Finally, the characteristic wavelength and the spectrum intensity could be analyzed through the Ocean View software (1.6.7, Ocean Optics, Florida, America).
For the solar field test, the device was easy to carry and convenient to operate. The semicircular gas discharge applicator must be fixed on the outer surface of the receiver. Then the copper electrode and the other electrode should connect to the HFPS. The absorber tube must be connected to the GND. In order to avoid the device from burning by the solar flux, the test should be taken when the parabolic trough collectors were temporarily defocused. Finally, the spectrometer could obtain and analyze the test data.
2.4. Experimental Design
In order to explore the relationship between the vacuum performance of receiver tubes and the spectral characteristics of dielectric barrier discharge, a series of experiments including pure argon, nitrogen, helium, and air under various pressures, which are the main gases in annulus space of the receiver, were carried out firstly. Table 1 shows the types and the pressure range of the gases in the experiments. After filling various gases at different pressure into the annular space, the corresponding light spectral emissions of various gases at different pressure were recorded. Through these the light spectral emission, the corresponding characteristic spectral lines of each gas can be obtained. Then the non-destructive vacuum evaluation method was compared with the method by using the RGA system. Finally, the feasibility and accuracy of the non-destructive method were proved.

Table 1.
Types and the pressure range of the gases in the experiments.
When the dielectric barrier charge reaches uniform discharge, the spectrometric measurement should be finished in 10 s to avoid the thermal effect of copper electrode.
The dimensions and materials of the parabolic trough receiver used in the experiment were shown in Table 2.
Table 2.
Dimensions and materials of the parabolic trough receiver.
3. Results and Discussions
3.1. Spectral Characteristics of Gases Discharge
Four kinds of gases, which are the most likely gases to be found in the receivers, were filled into the annulus space under various pressures [12,16]. The experiments of the dielectric barrier discharge of gases were carried out. The spectral measurement system was used to define the relationship between the vacuum performance of receiver tubes and the spectral characteristics of the gases. The non-destructive vacuum evaluation system is shown in Figure 7.
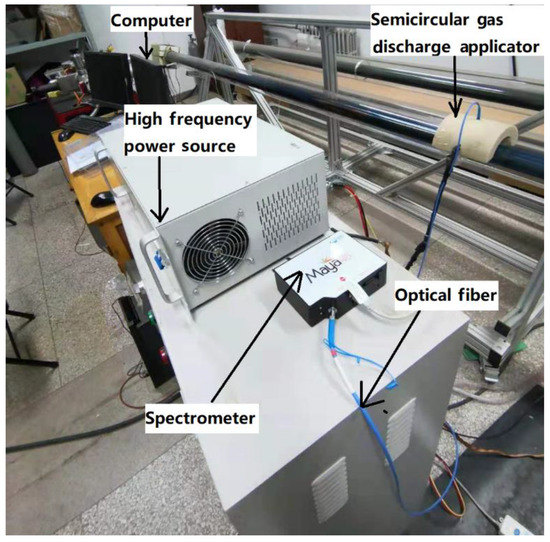
Figure 7.
Non-destructive vacuum evaluation system.
For each gas, 15–25 sets of data were tested within its discharge range of pressure. Electrical parameters and spectra of different gas types and pressure were obtained in the experiment. Among them, the characteristic wavelengths of each gas were obtained. Each group of data was measured for several times, and each spectrum had good repeatability. When it was out of the discharge range for each gas, the relationship of the voltage between the copper electrode and the absorber tube and the pressure in the annulus space were obtained.
3.1.1. Argon Analysis
The working pressure range of argon discharge was 2–900 Pa in the experiments. The discharge mode was glow discharge with purple color when the pressure was 2–80 Pa. The axial length of the glow discharge decreased with the pressure increase in the annulus space, as shown in Figure 8a, which shows a large range discharge in the axial direction along the receiver tube while the pressure was 2 Pa. Figure 8b shows that the discharge happened only near the semicircular gas discharge applicator and was circumferentially distributed. The intensity of the light emitted by argon also decreased with the pressure increase.
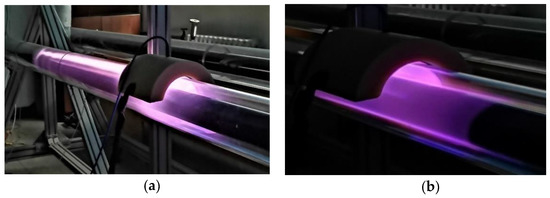
Figure 8.
(a) Argon glow discharge at 2 Pa and (b) argon glow discharge at 80 Pa.
When the pressure range was between 80 and 500 pa, the discharge mode gradually changed from glow discharge to diffusion discharge, which distributed only near the semicircular gas discharge applicator. As the pressure increased, the color gradually changed from purple to fuchsia and the patterns in the center of the discharge slowly appeared and increased, as shown in Figure 9a,b. At 500–900 Pa, the discharge mode gradually changed from diffusion discharge to filamentous discharge, as shown in Figure 9c. The discharge was filamentous and ran through the annular space. With the increase of argon pressure, the color of plasma changes from purple to bright purple, and several filamentous discharge channels gradually formed in the annular space, and the number of discharge channels gradually decreased.
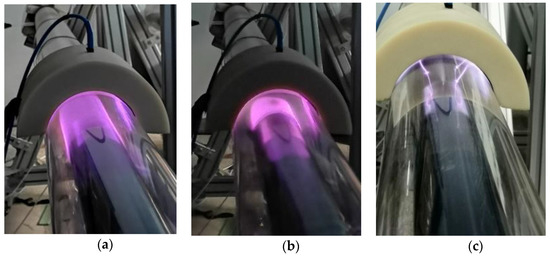
Figure 9.
(a) Argon diffusion charge at 160 Pa; (b) argon diffusion charge at 500 Pa; and (c) argon filamentous charge at 900 Pa.
Emission spectra of the tested argon under different pressure are shown in Figure 10. The characteristic spectral lines at the wavelength of 750 nm, 763 nm, 810 nm, 841 nm, and 911 nm were obtained for argon gas. The wavelength of the spectral line with the highest intensity measured in the experiment was 810 nm, indicating that there were many argon ions involved in this electron transition in the argon discharge. The second higher intensity measured was the wave peak of 763 nm, which the electron transition was also easily generated and was also the characteristic wave peak for argon discharge. When the pressure increased from 2–700 Pa, more electrons participated in the transition, which caused the increase of both the photon quantity and the intensity of the spectral peak, as shown in Figure 10.
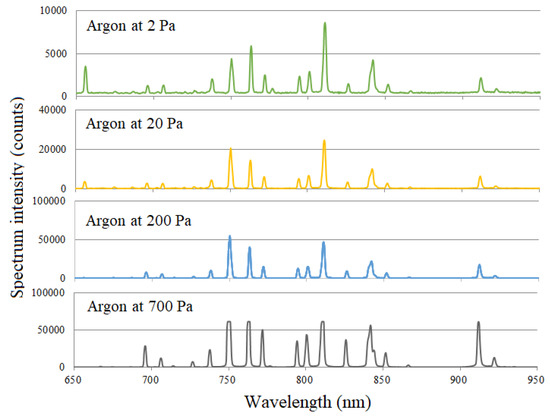
Figure 10.
Emission spectra of the argon under different pressure.
In order to distinguish the argon discharge, the characteristic peaks of 763 nm and 810 nm were selected, and the intensity ratio of the spectral peaks at 763 nm and 810 nm (I763/I810) was used in the vacuum evaluation. Figure 11 shows the curves of the intensity of the characteristic spectral peaks and ratio of I763/I810 with the pressure. The fitted function of intensity ratio of (I763/I810) and the pressure was obtained to analyze the partial pressure of the argon in the receiver:
where Iar is I763/I810 of argon and P is the argon partial pressure.
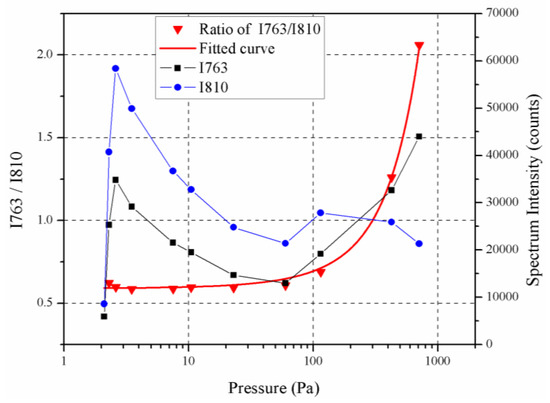
Figure 11.
Intensity of the characteristic spectral peaks and ratio of I763/I810 with the pressure.
It can be seen that the fitting curve was in good agreement with the experimental data and the intensity ratio changed roughly in a quadric curve with the pressure.
3.1.2. Helium Analysis
The working pressure range of helium discharge was from 7 to 100000 Pa in the experiments. The glow discharge mode happened in a long range of the pressure, which was from 7–40000 Pa. When the pressure was less than 300 Pa, the discharge was cylindrical and distributed in annular space, as shown in Figure 12a. The color of plasma slowly changed from green to light yellow with the increase of pressure. It gradually changed to pink in the range of 300–40000 Pa. At the range of 40000–80000 Pa, the discharge mode was diffusion discharge, which indicated the stability of the helium discharge, as shown in Figure 12b. The discharge was curved and distributed on the surface of the absorber tube and the glass envelope. The center of the discharge gradually formed several patterns and the number of patterns increased with the pressure increase. The discharge mode was filamentous discharge as the pressure was above 80000 Pa, as shown in Figure 12c. It can be seen that the color of plasma changed from pink to bright red with the increase of helium pressure and a large number of filamentous discharge channels were gradually formed in the annulus space.
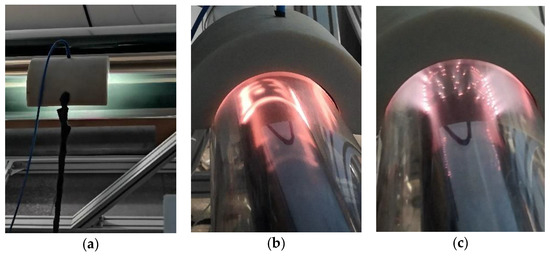
Figure 12.
(a) Helium glow discharge at 7 Pa; (b) helium diffusion discharge at 80000 Pa; and (c) helium filamentous discharge at 100000 Pa.
The emission spectra of tested helium gas at different pressures are shown in Figure 13. The characteristic spectral peaks at the wavelength of 501 nm, 587 nm, 667 nm, and 727 nm were obtained for helium gas. From Figure 13, it can be seen that the intensity of the spectral peak at 501 nm was relatively the highest at 7 Pa and then the spectral peak at 667 nm was the highest with the pressure increase for the helium discharge. The intensity of the spectral line remarkably increased in the helium pressure range of 7–300 Pa, and then slightly increased with the pressure increase.
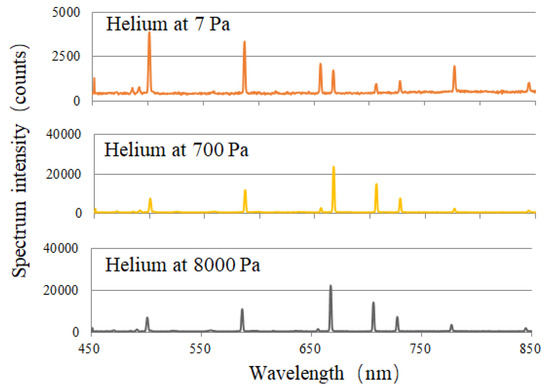
Figure 13.
Emission spectra of the helium under different pressure.
The characteristic peaks of 501 nm and 667 nm were selected to distinguish the helium discharge. The intensity ratio of the spectral peaks at 667 nm and 501 nm (I667/I501) was used in the vacuum evaluation. Figure 14 shows the curves of the intensity of the characteristic spectral peaks and ratio of I667/I501 with the pressure. The fitted function of intensity ratio of (I667/I501) and the pressure was obtained to analyze the partial pressure of the helium in the receiver:
where, Ihe is I667/I501 of helium.
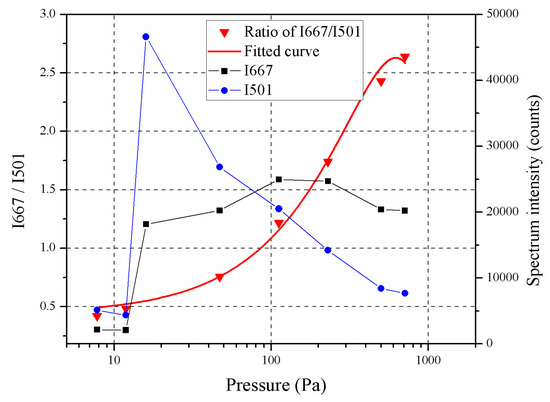
Figure 14.
Intensity of the characteristic spectral peaks and ratio of I667/I501 with the pressure.
3.1.3. Nitrogen Analysis
For the nitrogen, the glow discharge mode happened in the range of 3–180 Pa, as shown in Figure 15a,b. The discharge was cylindrical and distributed in the whole annulus space and its color gradually changed from fuchsia to purple with the pressure increase. When the range of pressure was from 180 to 600 Pa, the discharge mode changed to diffusion discharge, which was a curved shape and distributed on the surface of the absorber tube and glass envelope. Several patterns were formed between the two electrodes and the number of patterns increased with the pressure increase. When the pressure was above 600 Pa, the discharge mode was filamentous discharge as shown in Figure 15c. With the increase of nitrogen pressure, the color of plasma in the annular space changed from pink to red and yellow, and filamentous discharge channels began to form in the annular space as shown in Figure 15d.
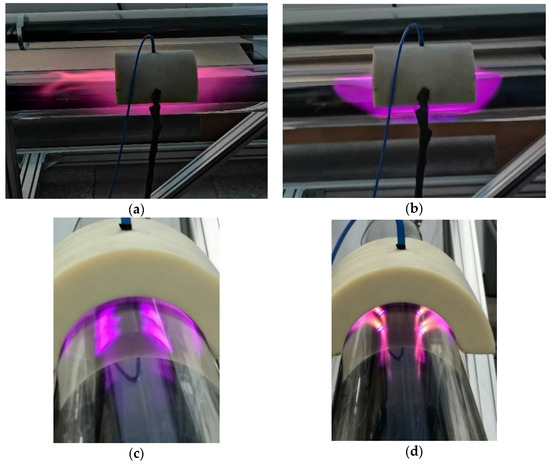
Figure 15.
(a) Nitrogen glow discharge at 3 Pa; (b) nitrogen glow discharge at 180 Pa; (c) nitrogen diffusion discharge at 600 Pa; and (d) nitrogen filamentous discharge at 3000 Pa.
The corresponding characteristic spectral lines of nitrogen at different pressure were obtained. There were characteristic spectral peaks at 336 nm, 356 nm, 390 nm, 451 nm, 656 nm, and 777 nm for nitrogen, as shown in Figure 16. The intensity of the spectral peak at 390 nm was the highest in the range of 3–100 Pa, indicating that more nitrogen ions participating in the transition. The intensity of the spectral line remarkably increased with the pressure increase, which resulted in an increase in photon quantity. While the highest intensity of the spectral peak was at 336 nm as the pressure was higher than 100 Pa, as shown in Figure 16. The intensity of the peak at 390 nm was relatively lower than that at lower pressure, indicating that there were relatively few nitrogen ions involved in the transition. The intensity of the spectral line slowly increased when the pressure was higher than 100 Pa.
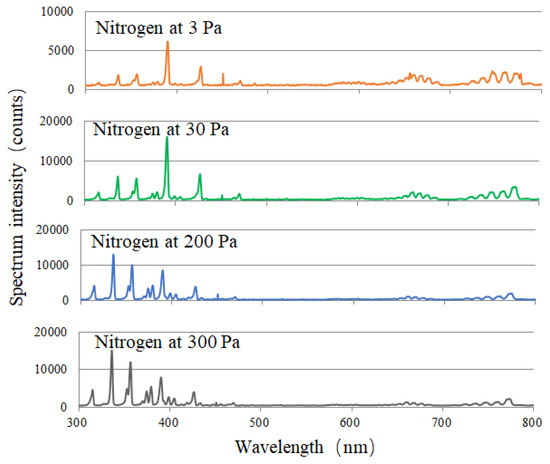
Figure 16.
Emission spectra of the nitrogen under different pressure.
For nitrogen, the characteristic peaks of 336 nm and 390 nm were chosen to determine the nitrogen gas. The intensity ratio of the spectral lines at 336 nm and 390 nm was calculated (I336/I390). Figure 17 shows the curves of the intensity of the characteristic spectral peaks and ratio of (I336/I390) with the pressure. The fitted function of intensity ratio of (I336/I390) and the pressure was obtained to analyze the partial pressure of the nitrogen in the receiver:
where, In is I336/I390 of nitrogen.
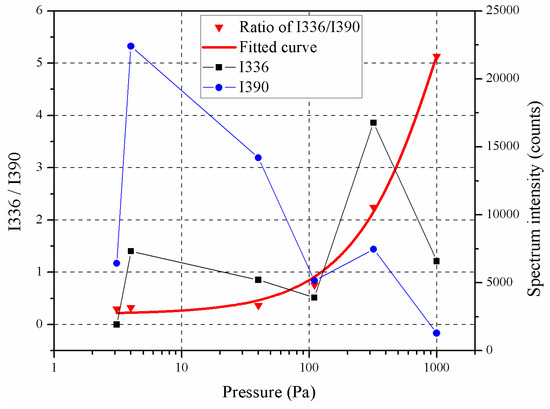
Figure 17.
Intensity of characteristic spectral lines and their ratio (I336/I390) at different air pressure for nitrogen.
3.1.4. Air Analysis
The pressure range of the air in the annulus space of the receiver was from 3 to 80000 Pa in the experiment. When the pressure was between 3 and 200 Pa, the air discharge mode was glow discharge, as shown in Figure 18a,b. The discharge was cylindrical and distributed in whole annular space. The color of the discharge was purple. When the pressure was from 200 to 700 Pa, the discharge mode was diffusion discharge. The discharge distributed on the surface of absorber tube and glass envelope and the patterns appeared in the annulus space, as shown in Figure 3. With the increase of air pressure, the patterns became larger and more between the glass envelope and the absorber tube. The filamentous discharge mode happened in the annulus space when the air pressure was in the range of 700–80000 Pa, as shown in Figure 2. With the increase of air pressure, the number of filamentous discharge channels increased.
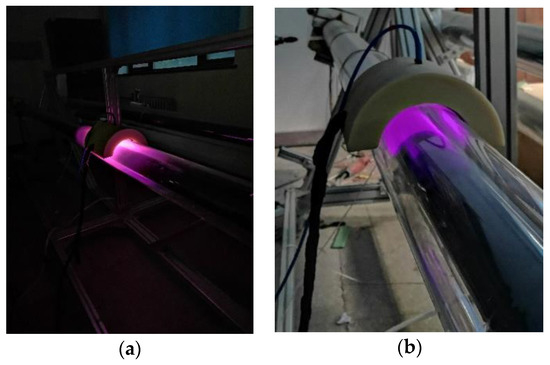
Figure 18.
(a) Air glow discharge at 7 Pa and (b) air glow discharge at 70 Pa.
The discharge spectra of the tested air at different pressure were shown in Figure 19. The comparison between the discharge spectra of air and nitrogen at the same pressure showed that the intensity of the characteristic spectral line of air is lower than that of nitrogen. It is reasonable because the percentage of the nitrogen in the air at a certain pressure was lower than that of nitrogen at the same pressure. However, the spectral peaks at 451 nm, 655 nm, and 776 nm in the air spectrum were stronger than those of nitrogen at the same pressure, indicating that these spectral peaks were superimposed by the spectral peaks formed by the transition of other gases in the air, as shown in Figure 19.
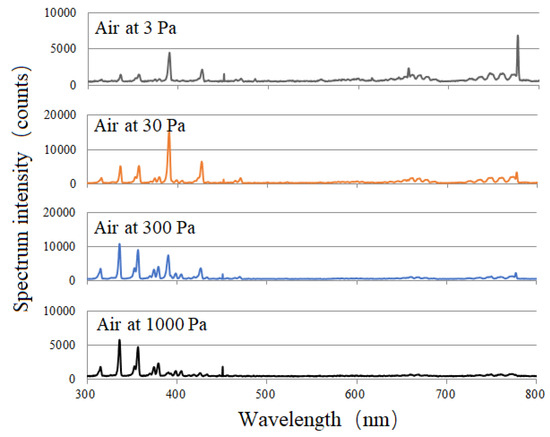
Figure 19.
Emission spectra of air under different pressure.
The characteristic peaks of 336 nm and 390 nm were chosen to analyze the air discharge. The intensity ratio of the spectral lines at 336 nm and 390 nm (I336/I390) was obtained. Figure 20 shows the curves of the intensity of the characteristic spectral peaks and ratio of (I336/I390) with the pressure. The fitted function of intensity ratio of (I336/I390) and the pressure was obtained to analyze the partial pressure of the air in the annulus:
where, Iair is I336/I390 of air.
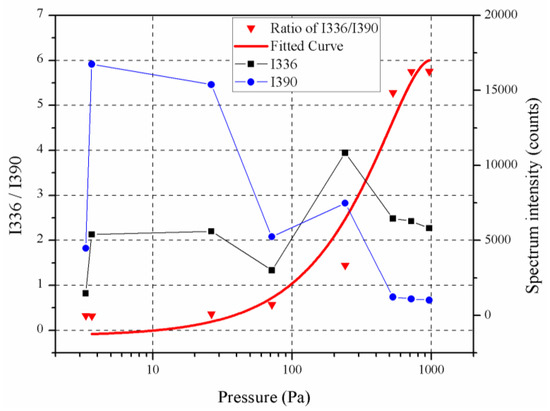
Figure 20.
Intensity of characteristic spectral lines and their ratio (I336/I390).
3.2. Verification
In order to verify the accuracy and feasibility of the nondestructive testing method for the vacuum performance of receiver tubes, an RGA system was used to analyze the components and the partial pressure of the gases in the annulus space. The RGA system introduced in Ref. [15] comprises of a receiver tube opening device, a high vacuum system, a mass flow controller system, and a quadrupole mass spectrometer (QMS), as shown in Figure 21. For the RGA system, the QMS can directly analyze the gas composition and the gas partial pressure with a high accuracy. The mass flow controller system can accurately control the quantity of various gases into the annulus space of the receiver. The non-destructive test device and the RGA system can simultaneously measure the vacuum performance for the same receiver tube.
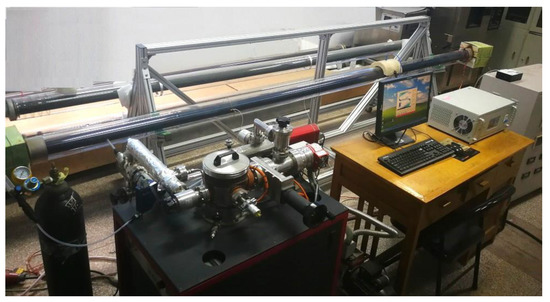
Figure 21.
Residual gas analysis (RGA) system of the receiver.
The comparative experiments were carried out by using argon, nitrogen, and helium, respectively. According to the RGA test results, the annular space was pure argon at 7.5 Pa, pure helium at 11.3 Pa, and pure nitrogen at 39 Pa. For the nondestructive test method, the pressure value was obtained by the fitted function of the intensity ratio of the two characteristic peaks. The non-destructive test device showed that the characteristic spectral lines were consistent with the pure argon, pure helium, and pure nitrogen, respectively. Among them, the ratio of (I762/I810), (I667/I501) and (I336/I390) was 0.59, 0.48, and 0.33, respectively. According to Equations (3)–(5), the compared results between the RGA test and the non-destructive test were shown in Figure 22. It shows that the test results of the non-destructive vacuum evaluation method proposed were in good agreement with the RGA test results. The test error was ±10 Pa, which verified the feasibility and accuracy of this method. Therefore, the non-destructive test method combining DBD and spectrometric analysis could obtain ideal results for vacuum performance of the parabolic trough receiver.
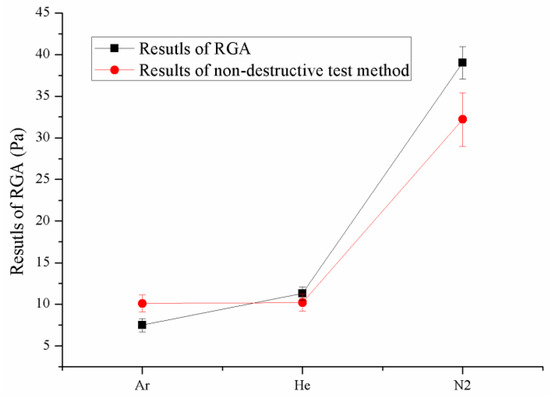
Figure 22.
Compared results between the RGA test and the non-destructive test.
4. Conclusions and Future Work
This paper proposed a non-destructive test method to evaluate the vacuum performance of the parabolic trough receiver by combining the DBD method and spectrometric analysis. The non-destructive test device including a gas ionization system and a spectrometric analysis system was developed. The discharge characteristics and spectrometric properties of four kinds of gases, which are the most likely gases to be found in the receivers, were studied in the experiments. The test results of the non-destructive vacuum evaluation method proposed were in good agreement with the RGA test results, which verified the feasibility and accuracy of this non-destructive test method. The relationship between the vacuum performance of receiver and the spectral characteristics of dielectric barrier discharge were obtained by a series of experiments. Through this study, the following conclusions could be obtained:
- The working pressure range of each gas discharge was obtained by the experiments, which was 2–900 Pa for argon, 7–100000 Pa for helium, 3–80000 Pa for nitrogen, and 3–80000 Pa for air. The discharge characteristics of each gas were studied. The common features of each gas discharge were: when the gas pressure increase in the annulus space, the gas discharge mode was glow discharge and the discharge was circumferential distribution near the semicircular gas discharge applicator. Then the discharge mode turned to diffuse discharge, and the distribution of the discharge was only on the surfaces of the glass envelope and the absorber tube near the semicircular gas discharge applicator, and the patterns appeared. Finally, the gas discharge mode turned to filamentous discharge.
- The emission spectra and characteristic peaks of each gas under different pressure were obtained to distinguish the gas composition in the receiver. According to the fitted function of the intensity ratio of two characteristic peaks and the pressure proposed in the paper, the intensity ratio of (I763/I810), (I667/I501), (I336/I390), and (I336/I390) were used to distinguish the partial pressure of argon, helium, nitrogen, and air, respectively.
Through experiment, the relationship between the vacuum performance of the receiver and the spectral characteristics of dielectric barrier discharge were obtained. This information is of great importance for the vacuum evaluation of the parabolic trough receivers. In the future, the hydrogen discharge characteristics and spectrometric properties will be tested when the safety of hydrogen discharge can be solved in the experiments. In addition, the on-site measurement of the vacuum performance of the receivers will be carried out in the solar field.
Author Contributions
Conceptualization, F.Y. and D.L.; methodology, D.L. and F.Y.; software, F.Y.; validation, F.Y.; formal analysis, F.Y.; investigation, F.Y., P.Y., and Y.H.; resources, D.L. and K.Y.; data curation, F.Y. and P.Y.; writing—original draft preparation, F.Y.; writing—review and editing, D.L.; visualization, F.Y. and Y.H.; supervision, Z.W. and K.Y.; project administration, D.L. and F.X.; funding acquisition, D.L. and Q.H.
Funding
This research was funded by the National Key Research and Development Project (No. 2019YFE010237) and the National Natural Science Foundation of China (Grant No. 51476165).
Conflicts of Interest
We declare that we have no financial and personal relationships with other people or organizations that can inappropriately influence our work; there is no professional or other personal interest of any nature or kind in any product, service and company that could be construed as influencing the position presented in, or the review of, the manuscript entitled.
References
- Yılmaz, İ.H.; Mwesigye, A. Modeling, simulation and performance analysis of parabolic trough solar collectors: A comprehensive review. Appl. Energy 2018, 225, 135–174. [Google Scholar] [CrossRef]
- Ma, L.; Wang, Z.; Lei, D.; Xu, L. Establishment, Validation, and Application of a Comprehensive Thermal Hydraulic Model for a Parabolic Trough Solar Field. Energies 2019, 12, 3161. [Google Scholar] [CrossRef]
- Price, H.; Forristall, R.; Wendelin, T.; Lewandowski, A.; Moss, T.; Gummo, C. Field survey of parabolic trough receiver thermal performance. In Proceedings of the ISEC2006: ASME International Solar Energy Conference, Denver, CO, USA, 8–13 July 2006. [Google Scholar]
- Lei, D.; Fu, X.; Ren, Y.; Yao, F.; Wang, Z. Temperature and thermal stress analysis of parabolic trough receivers. Renew. Energy 2019, 136, 403–413. [Google Scholar] [CrossRef]
- Wang, J.; Huang, X.; Gong, G.; Hao, M.; Yin, F. A systematic study of the residual gas effect on vacuum solar receiver. Energy Convers. Manag. 2011, 52, 2367–2372. [Google Scholar] [CrossRef]
- Tang, Z.; Zhao, X.-P.; Li, Z.-Y.; Tao, W.-Q. Multi-scale numerical analysis of flow and heat transfer for a parabolic trough collector. Int. J. Heat Mass Transf. 2017, 106, 526–538. [Google Scholar] [CrossRef]
- Wu, Z.; Lei, D.; Yuan, G.; Shao, J.; Zhang, Y.; Wang, Z. Structural reliability analysis of parabolic trough receivers. Appl. Energy 2014, 123, 232–241. [Google Scholar] [CrossRef]
- Kutscher, C.; Mehos, M.; Turchi, C.; Glatzmaier, G.; Moss, T. Line-Focus Solar Power Plant Cost Reduction Plan; National Renewable Energy Laboratory NREL/TP-5500-48175; National Renewable Energy Lab. (NREL): Golden, CO, USA, 2010.
- Li, J.; Wang, Z.; Li, J.; Lei, D. Vacuum reliability analysis of parabolic trough receiver. Sol. Energy Mater. Sol. Cells 2012, 105, 302–308. [Google Scholar] [CrossRef]
- Moens, L.; Blake, D.M. Mechanism of Hydrogen Formation in Solar Parabolic Trough Receivers. J. Sol. Energy Eng. 2010, 132, 031006. [Google Scholar] [CrossRef]
- Liu, J.; Lei, D.; Li, Q. Vacuum lifetime and residual gas analysis of parabolic trough receiver. Renew. Energy 2016, 86, 949–954. [Google Scholar] [CrossRef]
- Möllenhoff, M.; Albert, C.; Werner, M.; Sohr, O.; Kuckelkorn, T. A new approach for lifetime extension of parabolic trough receivers. In Proceedings of the SolarPACES 2011, Granada, Spain, 20–23 September 2011; pp. 1–6. [Google Scholar]
- Burkholder, F.; Brandemuehl, M.; Kutscher, C.; Wolfrum, E. Heat conduction of inert gas-hydrogen mixtures in parabolic trough receivers. In Proceedings of the Energy Sustainability 2008, Jacksonville, FL, USA, 10–14 August 2008; Volume 2, pp. 449–458. [Google Scholar]
- Pagola, I.; Funcia, I.; Sánchez, M.; Gil, J.; González-Vallejo, V.; Bedoya, M.; Orellana, G. On-line monitoring of H2 generation and the HTF degradation in parabolic trough solar thermal power plants: Development of an optical sensor based on an innovative approach. In AIP Conference Proceedings; AIP Publishing: Melville, NY, USA, 2017; Volume 1850, pp. 1–8. [Google Scholar]
- Ren, Y.; Lei, D.; Wang, Z. Experimental Analysis of Residual Gas of Vacuum Annulus in Parabolic Trough Solar Receivers. In AIP Conference Proceedings; AIP Publishing: Melville, NY, USA, 2019; Volume 2126, pp. 1–10. [Google Scholar]
- Espinosa-Rueda, G.; Navarro Hermoso, J.L.; Martínez-Sanz, N.; Gallas-Torreira, M. Vacuum evaluation of parabolic trough receiver tubes in a 50MW concentrated solar power plant. Sol. Energy 2016, 139, 36–46. [Google Scholar] [CrossRef]
- Setien, E.; López-Martín, R.; Valenzuela, L. Methodology for partial vacuum pressure and heat losses analysis of parabolic troughs receivers by infrared radiometry. Infrared Phys. Technol. 2019, 98, 341–353. [Google Scholar] [CrossRef]
- Kogelschatz, U. Filamentary, Patterned and Diffuse Barrier Discharges. IEEE Trans. Plasma Sci. 2002, 30, 1400–1410. [Google Scholar] [CrossRef]
- Brandt, S.; Schütz, A.; Klute, F.; Kratzer, J.; Franzke, J. Dielectric barrier discharges applied for optical spectrometry. Spectrochim. Acta Part B At. Spectrosc. 2016, 123, 6–32. [Google Scholar] [CrossRef]
- Li, M.; Han, C.; Liu, W. Influence of gas pressure on plasma parameters in a dielectric barrier discharge plasma actuator. Optik 2017, 145, 672–677. [Google Scholar] [CrossRef]
- Xin, R. Plasma Atomic Emission Spectrometry, 3rd ed.; Chemical Industry Press: Beijing, China, 2018; pp. 114–119. [Google Scholar]
© 2019 by the authors. Licensee MDPI, Basel, Switzerland. This article is an open access article distributed under the terms and conditions of the Creative Commons Attribution (CC BY) license (http://creativecommons.org/licenses/by/4.0/).