Abstract
Apartments built in Sweden during the record years 1961–1975 with the aim to remedy the housing shortage and abolish poor standards, were designed for a normal-sized family of 2–4 persons. The mechanical ventilation system, if existing, was primarily designed to ensure an air exchange in the apartment according to Swedish building regulations. During the last few years, the number of overcrowded apartments has increased due to housing shortage in general but also due to migration. Another aspect is that the ventilation in many apartments built during the record years is already insufficient at normal occupant load. The question is how doubling or tripling the number of occupants and thus, the moisture load will affect the risk of bad air quality and moisture damage. To find out, simulations were made to estimate whether it is possible to obtain sufficient air quality and low risk of moisture damage by only increasing the ventilation rates in existing systems or introducing new ventilation systems with and without heat recovery and what the consequence would be in terms of the additional energy demand. Measurements from earlier studies of CO2 and moisture supply in Swedish apartment buildings were used as input data.
1. Introduction
1.1. Housing Shortage Results in Overcrowded Apartments
The National Board of Housing, Building and Planning in Sweden has estimated a need for 600,000 new apartments by the year 2025 [1]. Shortage of housing and divergence in supply in relation to demand, together with an increasing population, has led to high-occupancy-density housing in many areas. The percentage of persons living in a dwelling with more than one person per bedroom, which is defined as “overcrowded” according to norm 3 [2], has increased from 15 to 17 percent from 2008 to 2018. Norm 3 defines overcrowding as less than one room for each occupant or two partners, except for kitchen, bathroom and living room. Among people born abroad the number is 38 percent in 2018 [3]. Many Swedish municipalities have major challenges to offer housing to both Swedes and migrants. The law states that migrants have the right to arrange their own accommodation with friends or relatives which, in some neighborhoods, has led to overcrowding in some residential areas. The average occupancy level in rental apartments in Sweden is 33 m2 per person [4], which corresponds to 0.03 person/m2.
1.2. Effects of High Occupancy Density on Indoor Quality and Demand for Ventilation
The buildings, where high occupancy density is common, were built during the “record years” (1961–1975), which means that the design, construction and heating-and ventilation technology are not adapted to the high occupancy density. These buildings, if not recently renovated, are in need of renovation since most materials and components are promptly approaching their technical end of life. Almost 70% of the houses from this era are heated by waterborne radiators connected to district heating and ventilated by natural ventilation (45%), exhaust ventilation (22%) or supply and exhaust ventilation (8%) [5]. A well-functioning ventilation system in buildings is a prerequisite both for achieving good indoor air quality and thermal comfort. However, in order to save energy, the ventilation rates are often decreased to the lowest possible levels, which, in some cases, has led to the risk of CO2 concentrations exceeding the maximum National permissible level and formaldehyde concentrations close to the value recommended by World Health Organization (WHO) [6]. In addition, risk of mold growth in the building’s envelope, which may cause indoor environment problems must be avoided. At the same time, the energy demand of the building depends on the building envelope and ventilation system. Former studies have shown that the users have great influence on the indoor environment, energy use and moisture safety in homes, while a recent study showed that the variation in the users’ behavior is large, [7,8,9]. Overcrowding, in the form of high personal load and related activities such as cooking, washing and shower affect the building’s constructions, materials and systems. If, for example, furniture or textiles are placed against poorly insulated external walls, the inside surface of the wall becomes cold, and in combination with high moisture load, this may result in high levels of relative humidity, condensation and risk of microbial growth. In this case, a higher ventilation rate limits the moisture load on the building’s structural parts and avoids high concentrations of indoor pollutants. Even though more people are contributing to an internal heating load, an increased ventilation rate without heat recovery will result in higher energy demand. To force the ventilation to higher levels than the system is designed for is probably possible with existing fans, but it would probably cause noise and draft indoors. According to the Swedish Building regulations, the exhaust air flow should at least equal 0.35 liter per second per square meter of living space. It is allowed to reduce the exhaust air flow to a minimum of 0.10 liter per second and square meters of living space when no one is home, to save energy. The air in the home must not cause unpleasant odors or adverse health effects. To achieve this, a higher outdoor air flow is sometimes required than the lowest permissible [10]. The building owner must also carry out an Obligatory Ventilation Control, OVK, in all buildings on a regular basis. Its purpose is to show that the indoor climate is good and that the ventilation systems are functioning [10]. The control must be carried out by a certified inspector. The controller must also provide suggestions on how to reduce energy consumption for ventilation without this giving rise to a worse indoor environment [11]. The Swedish Building Regulations (BBR) regulate the design of building in terms of function and technical systems but do not regulate the number of people using it. Since 1974, the Swedish norm (norm 3) for apartments is one room per person or couple, except for kitchen, bathroom and living room [12].
1.3. Effects of High Occupancy Density on General Wellbeing
International research studies on overcrowding in housing show that children living in such conditions more often have problems associated with mental and physical health. Overcrowded housing also has higher demands on ventilation and hygiene, as respiratory diseases and gastric disease otherwise spread more easily. Research has also shown that the relationship between parents and children is often subjected to strains when the number of residents per room increases—with conflicts as well as lack of personal integrity and peace as a result [13,14]. Not enough beds in the apartment and no room for storage of mattresses, makes it difficult to keep the apartment clean, which affects the indoor air quality and may cause respiratory diseases. Kitchens and bathrooms are exposed to high moisture loads, which can lead to moisture problems, fungi and mold. An extensive relocation of furniture, for example, to making temporary beds, also lead to wear of surface layers, floors, lining and sockets. Overall, high occupancy levels result in higher consumptions of water and energy [15].
1.4. The Effect of Occupancy Density on Energy Use
It can be noted that the use of energy for heating, electricity and water is unreasonably high in some apartments compared to the average household, which could be due to high occupancy, [16]. On the other hand, comparing the use per person, the numbers are more reasonable as when many people live in the same apartment it is obvious that they consume more electricity and water than an apartment with less occupants. Johansson [16] compared energy use per resident to the energy use in kWh/m2 (heated floor area) and showed that energy use per capita is almost the same for different building types. Even though the multifamily buildings often have poor energy performance with a high total energy use, the energy use per capita is not so high since the floor area per capita is lower for multifamily buildings than for 1–2 family buildings [16]. The proportionally lower energy use per person in apartments with high occupancy level is probably because the occupants contributes to internal heat load and that activities such as cooking are done simultaneously for the entire household. A Finnish study has showed similar results, measuring an increase in energy use in school buildings when intensifying the use of facilities, and suggests that alternative indicators such as energy use adjusted for occupancy or energy use adjusted for usage and space efficiency, should be used when evaluating energy efficiency in buildings [17].
1.5. The Effect of Occupancy Density on Indoor Environment and Moisture supply
Previously, in 1993, Markus et al. stated that overcrowding and inadequate ventilation increase interior moisture load [18]. Moisture supply, defined as the difference in absolute vapor content indoors and outdoors, is the result of moisture-generating activities, which are typically related to the occupants of the building. Examples of such activities are cooking, showering and watering of plants but also, moisture produced by the human body. The relation between moisture supply and occupancy is important to understand in order to make appropriate predictions on ventilation need to assure a good indoor air and to assure the moisture safety of the building. Unfortunately, there are few studies based on measured detailed data during longer periods of time of those two parameters. Møller and de Place Hansen [19] analyzed the influence of occupancy on moisture supply in Danish single-family houses and found a slight indication of increased moisture supply for low-social-status areas and increased moisture supply for households with high occupancies in terms of number of square meters per occupant and total hours spent at home. Moisture supply, however, decreases somewhat with increasing average age, which could be due to less moisture producing activities such as cooking and showering. Moisture supply varied for different types of rooms; bathrooms had the highest moisture supply, followed by basements and living rooms [19].
1.6. Aim of the Study
There is a lack of research dealing with the effects of overcrowding in apartments, and also, how to design and manage apartments as a function of occupant density. The hypothesis is that a higher occupancy level results in a higher moisture supply that needs to be reduced by increased ventilation to avoid the negative effects on indoor air quality and mold growth. The increased demand for ventilation will, in turn, affect the energy use, depending on the type of ventilation system and degree of heat recovery. As a starting point, this study aims to describe the problem with increased occupancy density and overcrowded apartments, estimating the relation between occupancy and moisture supply based on theoretical assumptions and measurements, and use this relation to show the effect of occupancy level on energy demand for heating and ventilation due to the need of increased ventilation airflow.
2. Materials and Methods
2.1. General Outline of the Methods Used
The analyses of the relationship between occupancy and moisture supply is based on measurements in apartments carried out in previous studies. The analyses of the energy demand for ventilation to assure to not exceed a certain moisture supply is made by simulations for different occupancy levels, climatic conditions, building envelope and ventilation systems. Moisture supply, vms, is the difference between the indoor vapor content and the outdoor vapor content. The moisture supply is the potential that drives the moisture transport, for example, through an exterior wall, and is, therefore, a crucial parameter, which is used in this initial study for determining the effect of moisture on ventilation and energy demand. The relationship between moisture supply and occupancy was determined with a top-down approach from estimations of occupancy level, based on measurements of CO2, and the moisture supply, to describe the relationship between the two parameters using statistical analysis of the measured data. The alternative approach would have been a bottom-up approach describing every persons’ activities in the household, and how they relate to generate vapor. There are numerous types of activities, all more or less difficult to describe, and there are more or less unknown relationships between the activities and the people performing them, meaning that estimating moisture supply based on occupancy activity schedules introduces many uncertainties. Therefore, the top-down approach was used as a first step since it gives the actual input data of interest directly and will be based on actual measurements. To be able to maintain a certain allowable moisture supply, the ventilation rate must be adjusted, which will influence the energy use of the building. For a given occupancy level, and the generated moisture supply, based on the given relationship estimated from measurement, the needed ventilation airflow and thus, the annual energy demand was determined from simulations of a certain building in a certain outdoor climate. The assumption is that no windows are opened, which is the worst-case scenario, but valid for approximately 30% of the apartments in Swedish multifamily houses [5].
2.2. Measurements of Carbon Dioxide, Temperature and Moisture Supply
In a former study, moisture supply and occupancy have been measured at the building level during more than one and a half years in four multi-family buildings, located in the south of Sweden, latitude N55°34′ comprising a total of 72 apartments and an apartment floor area of 4920 m2. The buildings used mechanical-exhaust-air ventilation with an air flow of 0.35 l/(s·m2floor). Exhaust air was taken out from bathrooms, kitchens, and fresh outdoor air from inlets located in bedrooms and living rooms. Measurement equipment was placed outdoors, and in each buildings’ central exhaust air duct. In this way, the measurements covered a number of apartments that were included at a reasonable cost, compared to measuring in each individual apartment. On the other hand, it is not possible to find distributions between apartments inside a certain building or distributions between different rooms in an apartment. The measured parameters were temperatures, Onset, specified error ±0.35 °C, relative humidity, Onset, specified error ±2.5% absolutely, and carbon dioxide, SenseAir, specified error ±30 ppm ±3% of reading with a repeatability error of ±20 ppm ±1% of reading. Measurements were performed with readings every 30 min to make it possible to obtain daily and weekly time distributions. Moisture supply was calculated based on these parameters [7].
2.3. Calculations of Occupancy Level based on CO2 Measurements
Occupancy levels were calculated based on the measured CO2 concentrations, indoors and outdoors, and the ventilation airflow. The ventilation airflow was assumed to be constant and the ventilation rate was obtained from measurements made by the operation team during commissioning of the building. The production of carbon dioxide can be described by Equation (1), where Cp is the carbon dioxide production in l/s, Cin is the carbon dioxide volume concentration in the exhaust air, and Cout is the carbon dioxide volume concentration in the outdoor air and q is the ventilation airflow of the building in l/s including leakage. It is assumed that there is no buffering of CO2. The effect of buffering and time lags will be a matter for future analysis. If a single person produces a concentration of cp l/s carbon dioxide indoors, Equation (2) gives the equivalent number of persons, n, in the building. Cp can be corrected for considering other producing or reducing sources in the building, using the constant q. This gives the equilibrium state of occupancy, as there is a transient build up and a transient decay time. Due to the linearity, the average will be described by Equation (2).
The metabolic rate varies with activity level, age, sex and weight, and, therefore, an average cp must be determined. Reference values are presented in the literature [20] as values per body weight for adults at the different activity levels sleeping, 0.17 l/(h·kg), sitting, 0.26 l/(h·kg) and standing, 0.30 l/(h·kg). Regarding children, the carbon dioxide generation was analyzed by [21] based on reference values from [22], where children produce 1.74 times as much CO2 as adults per kg body mass. If it is assumed that there are equal numbers of men and women, the average weight of adult Swedes is 74.5 kg according to Statistics Sweden. In this study, it was assumed that 8 h were spent sleeping, 4.5 h sitting and 1.5 h standing. Children were assumed to weigh, on average, half as much as adults, and 60% of the population were assumed to be adults. Taking all the above into account, the average cp became 0.00417 l/s. Swedes are assumed to spend 14 h a day in their homes according to [23], while those measurements gave actual numbers. Equation (3) gives the occupancy, O, as used in this paper, where Afloor is the apartment floor area.
2.4. Relation between Occupancy and Moisture Supply
Linear regression analysis was carried out to describe the moisture supply as a function of occupancy level according to Equation (4), where A and B are constants and O the occupancy in persons/m2. Figure 1 shows that the lower the time resolution is, the higher the coefficient of determination, R2, becomes. Time resolution is the monitoring interval of the measurements. This is expected since fewer data will vary less. It is also shown that the influence on the coefficient of performance from time offset and reasonably higher resolution is rather low, indicating that the correlation is more dependent on the average occupancy than time lag aspects of it. Figure 2 and Figure 3 show the moisture supply over time and as function of O, respectively. Negative moisture supply occurs when outdoor climate changed.
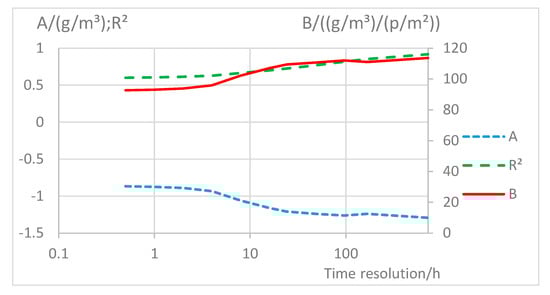
Figure 1.
The resulting correlation parameters according to Equation (4) as a function of time resolution for measured data.
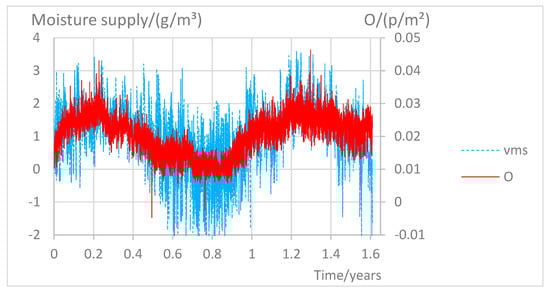
Figure 2.
The yearly variation of measured moisture supply (vms) and occupancy level (O), estimated from CO2 measurements in exhaust ventilation from apartment buildings.
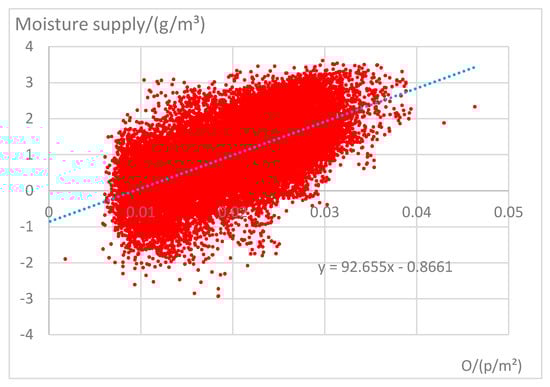
Figure 3.
The linear regression curve describing the relation between moisture supply and occupancy level.
2.5. Calculations of Energy Demand for Heating and Ventilation
Based on the linear regression, the relation between occupancy levels and moisture supply is estimated. In the calculation, the ventilation airflow is varied in order to keep the moisture supply constant if the occupancy level deviates. The annual heating energy demand including the heating of the ventilation airflow is calculated. A power-balance model according to Equation (5) was developed in Visual Basic for Application based on the size of the measured building, taking into account, heat transmission of the building envelope, air leakage, ventilation and internal heat gains that were assumed to be constant over time. Pheat is the heating power, or hourly heating energy, which must be supplied by the heating system, per floor area and q is the ventilation airflow per floor area. A heat loss factor of the building is, for the purpose of this study, defined as heat loss as a result of transmission and leakage calculated per envelope area and per temperature difference. Equation (6) describes the heat loss factor, Q, with U as the heat transmission coefficient, qleak the average leakage flow, ρ the density of air (1.2 kg/m3) and c the specific heat capacity of air (1000 J/(kg·K)) and Aenv the total envelope area.
The calculation was carried out with three different heat loss factors, (Q = 0.2, 0.6 and 1 W/(m2floor·K), respectively, and a nominal airflow, q, according to the Swedish building code [2] of 0.35 l/(s·m2) at the average occupancy level in the measured cases of 0.0204 persons/m2floor. The simulation was performed for every hour over one year. The annual energy use is the sum of each hour’s energy use. The temperature efficiency of the heat recovery, η, of the ventilation air handling unit was either zero, representing no heat recovery, or 0.75, representing a typical heat recovery unit during operation. Equation (7) gives the temperature after the heat recovery, thr. A heat gain, Pgain, of 100 W/person together with a heat gain of 3.4 W/m2floor from household electricity heating [24] was assumed. The outdoor climate data, tout, was retrieved from Meteonorm (Meteotest, 2016) for the cities of Malmö, south Sweden, latitude N55°36′ and Kiruna, latitude N67°51′. The floor area, Afloor, of the simulated and measured building was 4920 m2, and the building envelope area, Aenv, was 4788 m2. The indoor temperature, tin was assumed to be 22 °C.
3. Results
The energy demand for space heating and ventilation air heating were calculated for two fictive buildings with Malmö and Kiruna outdoor climates, respectively, see Figure 4 and Figure 5. This was based on the value of a measurement resolution of 24 h according to Figure 1, which means that A = 109, B = 1.21 and coefficient of determination = R2 = 0.72. It is shown that the energy demand for heating increases when occupancy levels increase if the ventilation airflow is adjusted to assure the same moisture content in the air. Of course, a more insulated envelope with lower Q also decreases the energy demand. It can also be seen that the benefits from a better insulated envelope are less at high occupancy levels because the internal heat loads decrease the number of heating degree hours. In Figure 6, heating for the ventilation air is shown. If the ventilation airflow is not increased, the energy used for heating is lower with higher occupancy due to more internal heat gains. On the other hand, this would result in more need for cooling or risk of overheating indoors.
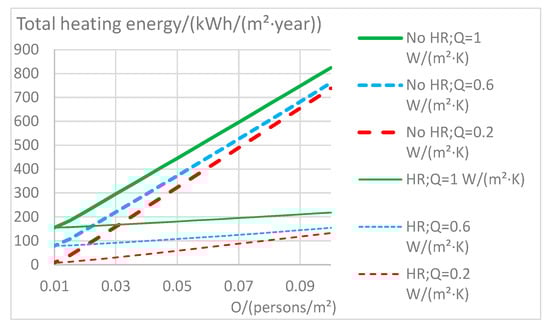
Figure 4.
Calculated total heating demand as a function of average occupancy level, O, and heat loss factor, Q, for the building with outdoor climate from Kiruna. ‘HR’ means heat recovery in the ventilation system.
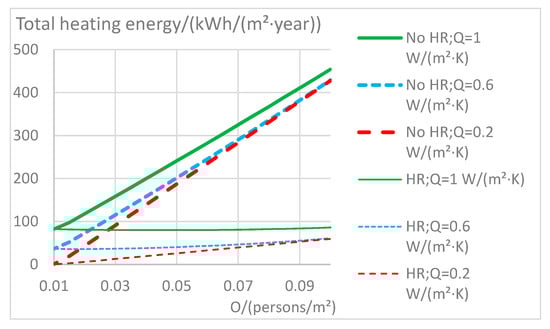
Figure 5.
Calculated total heating demand as a function of average occupancy level, O, and heat loss factor, Q, for the building with outdoor climate from Malmö. ‘HR’ means heat recovery.
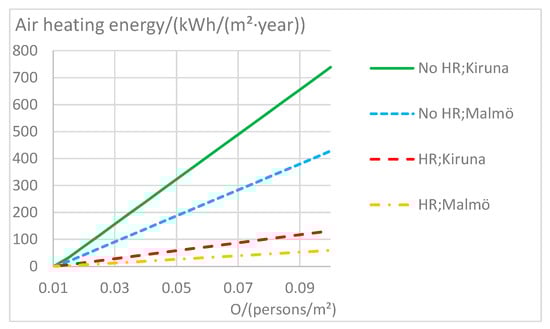
Figure 6.
Calculated heating demand for the ventilation air flow as a function of average occupancy level, O, with outdoor climate from Kiruna and Malmö with and without heat recovery (HR). The heat-loss factor is 0.1 W/(m2·K).
4. Discussion
In this study, the occupancy level was estimated based on measured concentration of CO2 because the concentration is relatively proportional to the number of people staying in the building. The moisture supply, on the other hand, depends on the number of people but also, on which activities are carried out, especially cooking and showering, which generate water vapor. It would, of course, be interesting to know how many people are staying in the apartment to be able to directly see correlation with moisture supply but there is a lack of such measurements. In the data which forms the basis of this study, there is a time lag based on the fact that the measurements were made on exhaust air. This air has been transported a certain distance and time after being in the rooms, but both parameters (CO2 concentration and moisture content) were measured in the same way and, therefore, have the same time lag, and the linear relationships between the parameters mean that the average over many hours is still correct. The moderate coefficient of determination between moisture supply and occupancy, 0.72 in the simulated case, confirms that there are many aspects of the occupants’ behavior that influence the moisture supply and the relationship between the number of occupants and moisture supply is, therefore, quite weak. This relationship should be studied more carefully in the future since it will be crucial for designing proper ventilation in apartments with high occupancy. It was also assumed that the level of presence in apartments was the same over the year, which can be overestimated for the summertime, since people are spending more time outdoors during summer. Generally, in Sweden, the society has the responsibility to ensure a sound and healthy housing market not based on overcrowding parts of the housing stock. However, the current situation with housing shortage cannot be solved in a quick way, and high occupancy levels will be a fact in parts of the housing stock during many years to come. Therefore, it is important to increase knowledge about measures to assure an acceptable indoor environment for the occupants and minimal risk of damage to the buildings in the concerned areas. The impact of high moisture content in the indoor air involves an increased risk for condensation at windowpanes, mold growth on cold indoor surfaces, moisture transfer and condensation in colder parts of the building envelop, etc. This must be studied more carefully, and measures have to be taken in exposed buildings. A possible measure could be to install exhaust and supply air ventilation with capability to force ventilation or even demand controlled ventilation, with heat recovery, especially for cold climates. A recent project in Sweden reported an approximate investment cost of 20,000 €/apartment for installing such a system in a residential building with eight apartments [25]. The cost per apartment should decrease if the same central air handling unit can serve more apartments. These efforts should be compared in relation to the consequences of not doing anything, which would involve risk for negative effects on occupants’ health and for damages of the buildings in the form of mold growth, etc. It is obviously much more cost effective to replace the ventilation system and allow a higher occupancy level than to build more new homes. However, it must be borne in mind that there are more negative consequences of high occupancy density than just poor air quality and the risk of moisture damage, namely the difficulty in keeping the dwelling clean as well as providing a silent and suitable environment for children to do their homework and avoiding conflicts in the household.
This study is a first attempt to elaborate on the possibilities of increasing ventilation rate in order to improve the indoor environment in apartments with high occupancy. The relation between moisture supply and occupancy calculated with consideration of CO2 concentrations is evaluated from measurements in apartments with normal occupancy rates and extrapolated to high occupancy rates, which might be a weakness since some activities generating moisture supply such as cooking, washing, laundry, plants, etc., might not be proportional to the number of occupants. The theoretical ventilation rates that are needed to keep the moisture supply down to acceptable levels were calculated using a simplified model of the building, which is a limitation. Based on the required ventilation rates, the total heating demand, as well as the total air heating demand, were estimated. Even though the results are not precise, they clearly reflect the increased demand of ventilation and consequently, an increased heating demand at increased occupancy levels, in order to provide a decent indoor environment.
5. Conclusions
This study has shown that increased occupancy density leads to an increased moisture supply, depending on the number of people staying in the apartment. To ensure good air quality and to keep the moisture supply at levels not exceeding levels involving a risk of damage to the building in the form of condensation and mold growth with negative consequences on the residents’ health, the building must be ventilated with a certain exchange of air. It is possible to increase the airflow in apartments with high occupancy density so that the moisture supply does not exceed the critical levels to risk moisture damage. Simulations were made to estimate whether it is possible to obtain sufficiently good air quality and low risk of moisture damage by only increasing the ventilation rates in existing systems or introducing new ventilation systems with and without heat recovery. However, there will be an increased energy demand for heating of the air due to increased airflow, but the energy demand can be limited if heat-recovery is installed. As an example, the energy demand for heating of the ventilation airflow in an apartment of 70 m2 will be almost twice as high, approximately, 370 to 700 kWh/m2 per year for the Kiruna climate and 200 to 400 kWh/m2 per year for the Malmö climate, if the occupancy level increases from three to six persons. However, the energy demand can be limited to about 50 KWh/m2 per year for Kiruna and even less for Malmö, if a ventilation system with heat recovery on the exhaust air is installed.
Author Contributions
Conceptualization, K.M., D.J. and H.B.; methodology, K.M., D.J. and H.B.; software, D.J.; validation, D.J. and H.B.; formal analysis, D.J.; investigation, K.M., D.J. and H.B.; resources, K.M., D.J. and H.B.; data curation, D.J. and H.B.; writing—original draft preparation, K.M., D.J. and H.B.; writing—review and editing, K.M. and D.J.; visualization, D.J.; project administration, K.M. and H.B.; funding acquisition, K.M. and H.B.
Funding
This research was funded by Swedish Research Council Formas grant 2013-1804 SIRen national research environment on sustainable integrated renovation and by the Swedish Energy Agency, program E2B2 grant 41819-1, NOVA.
Conflicts of Interest
The authors declare no conflict of interest.
References
- Boverket, Swedish Board of Housing Building and Planning. Calculation of the Need of Housing Until 2025; Swedish Board of Housing Building and Planning: Karlskrona, Sweden, 2017. [Google Scholar]
- Boverket. Trångboddheten i Storstadsregionerna; Report 2016:28; Boverket: Karlskrona, Sweden, 2016; ISBN 978-91-7563-419-7. [Google Scholar]
- SCB Statistics. Undersökningarna av Levnadsförhållanden (ULF), Statistics Sweden, Stockholm. Available online: http://www.scb.se (accessed on 13 September 2019).
- Swedish Tenant Association. 2018. Available online: https://hurvibor.se/hur-vi-bor/bostadsyta/ (accessed on 21 November 2019).
- Boverket. BETSI Study—Buildings’ Energy Use, Technical Status and Indoor Environment; Boverket: Karlskrona, Sweden, 2009. [Google Scholar]
- Dovjak, M.; Slobodnik, J.; Krainer, A. Deteriorated Indoor Environmental Quality as a Collateral Damage of Present Day Extensive Renovations. Strojniški vestnik. J. Mech. Eng. 2019, 65, 31–40. [Google Scholar] [CrossRef]
- Bagge, H. Building Performance—Methods for Improved Prediction and Verification of Energy Use and Indoor Climate, Building Physics LTH; Lund University: Lund, Sweden, 2011. [Google Scholar]
- Bagge, H.; Johansson, D.; Lindstrii, L. Measured indoor hygrothermal conditions and occupancy levels in an arctic Swedish multi-family building. HVAC R Res. J. 2014, 20, 376–383. [Google Scholar] [CrossRef]
- Fransson, V.; Bagge, H.; Johansson, D. Impact of variations in residential use of household electricity on the energy and power demand for space heating—Variations from measurements in 1000 apartment. Appl. Energy 2019, 254, 113599. [Google Scholar] [CrossRef]
- Boverket. Boverket’s Building Regulations. Available online: https://www.boverket.se/en/start/building-in-sweden/swedish-market/laws-and-regulations/national-regulations/building-regulations/ (accessed on 17 November 2019).
- Boverket. OVK Obligatory Ventilation Control. Available online: https://www.boverket.se/en/start/building-in-sweden/swedish-market/laws-and-regulations/national-regulations/obligatory-ventilation-control/ (accessed on 17 November 2019).
- SCB Statistics. Available online: https://www.scb.se/hitta-statistik/artiklar/var-femte-person-fodd-utanfor-europa-ar-trangbodd/ (accessed on 13 September 2019).
- Krieger, J.; Higgings, D.L. Housing and Health: Time Again for Public Health Action. Am. J. Public Health 2002, 92, 758–768. [Google Scholar] [CrossRef] [PubMed]
- Bornehag, C.G.; Blomquist, G.; Gyntelberg, F.; Järvholm, B.; Malmberg, P.; Nordvall, L.; Sundell, J.; Pershagen, G.; Nielsen, A. Dampness in buildings and Health. Nordic interdisciplinary review of te scientific evidence on associations between exposure to “dampness” and health effects. Indoor Air 2001, 11, 72–86. [Google Scholar] [CrossRef] [PubMed]
- Evidens. Trångboddhet i Sverige—Beskrivning av Nuläget och Diskussion om Effekter, Stockholm i december 2016. Available online: http://www.mynewsdesk.com/se/hsb_riksforbund/documents/traangboddhet-i-sverige-beskrivning-av-nulaeget-och-diskussion-om-effekter-64435 (accessed on 21 November 2019).
- Johansson, T. Performance Visualization of Urban Systems. Ph.D. Thesis, Luleå University of Technology, Luleå, Sweden, 2017. [Google Scholar]
- Sekki, T. Evaluation of Energy Efficiency in Educational Buildings. Ph.D. Thesis, Aalto University, Helsinki, Finland, 2017. [Google Scholar]
- Markus, T.A. Cold, condensation and housing poverty. In Unhealthy Housing Research Remedies and Reform; Burrage, R., Ormandy, D., Eds.; Spon Press: New York, NY, USA, 1993; pp. 141–167. [Google Scholar]
- Møller, E.B.; de Place Hansen, E. Moisture Supply in Danish single-family houses—The influence of occupant behavior and type of room. Proceeding of the 11th Nordic Symposium on Building Physics, NSB2017, Trondheim, Norway, 11–14 June 2017. [Google Scholar]
- Swegon. Technical Documentation on Ventilation Systems; Swegon: Tomelilla, Sweden, 2006. [Google Scholar]
- Coley, D.A.; Beisteiner, A. Carbon dioxide levels and Ventilation Rates in Schools. Int. J. Vent. 2003, 1, 45–52. [Google Scholar] [CrossRef]
- Ruch, T.C.; Patton, H.D. Physiology and Biophysics; W B Saunders Company: Philadelphia, PA, USA, 1965. [Google Scholar]
- Levin, P. Anvisningar för val av Brukarindata för Beräkningar av specifik Energianvändning i Bostäder, Final Report 2009-01-20. Available online: http://www.sbuf.se (accessed on 21 November 2019).
- Bagge, H.; Lindstrii, L.; Johansson, D. Brukarrelaterad Energianvändning. Resultat från Mätningar i 1300 Lägenheter; FoU-Väst Rapport 1240; Sveriges Byggindustrier: Stockholm, Sweden, 2012. [Google Scholar]
- Kristoffersson, J.; Bagge, H.; Abdul Hamid, A.; Johansson, D.; Almgren, M.; Persson, M.-L. Användning av Värmeåtervinning i Miljonprogrammet; Report 2017:17; Swedish Energy Agency: Frösön, Sweden, 2017. [Google Scholar]
© 2019 by the authors. Licensee MDPI, Basel, Switzerland. This article is an open access article distributed under the terms and conditions of the Creative Commons Attribution (CC BY) license (http://creativecommons.org/licenses/by/4.0/).