Abstract
As a critical component of a high-voltage direct current (HVDC) transmission system, resin impregnated paper (RIP) wall bushing has become a weak point because of its surface charge accumulation. This paper studies a model RIP wall bushing core designed by the equal capacitance method. The stationary resistive field along the gas–solid interface of the RIP wall bushing core is investigated theoretically by a gas model, which considers the non-linearly field-dependent volume conductivity. The results show that the gas conductivity along the core surface tends to be an arched distribution from the high-voltage conductor to the end shielding screen. The surface charge mainly accumulates at the turning point of the radius, which may threaten the core’s insulation. Then, the surface charge is obtained through a measurement system, where the experimental results are highly consistent with the simulation results. Considering the time constant of charge dissipation is nearly 15 min, it would be better to measure the surface charge on one axial direction of RIP wall bushing core after each voltage application. The simulation and experimental results of this paper can guide the design of a RIP wall bushing core.
1. Introduction
In the high-voltage direct current (HVDC) converter station, resin impregnated paper (RIP) wall bushings are major components in connecting converter valves and DC buses [1], as shown in Figure 1. Indeed, the operation safety of the AC/DC hybrid power grid strongly depends on the RIP wall bushings [2]. However, operation experiences show that RIP wall bushings with voltage grades higher than 400 kV currently have a high failure rate (five year average failure rate is about 1.2%), resulting in single-pole lockout at the HVDC converter stations, which has a large negative impact on the AC-DC transmission system [3,4]. A typical surface discharge accident of a +400 kV RIP wall bushing is shown in Figure 2. Due to the partial discharge at the edge of the end shielding screen, the solid insulation near the end shielding screen is easily damaged. Then, the surface discharge begins to develop toward the high-voltage conductor, resulting in flashover along the core surface. When flashing along the core surface, the large current makes the lead between the end shielding screen and the grounding flange disconnected, and then the grounding flange becomes the channel for current conduction, resulting in a more obvious flashover trace from the grounding flange to the high-voltage conductor. One of the important causes of the accident is that the electric field distribution under DC voltage is different from that under AC voltage [5]. Under AC voltage, the electric field distribution depends on the permittivity. While under DC voltage, the electric field distribution depends on the conductivity, which results in surface charge accumulation on the RIP wall bushing core’s surface [6]. The presence of the surface charge may reduce the insulation performance of the gas–solid interface [7,8].
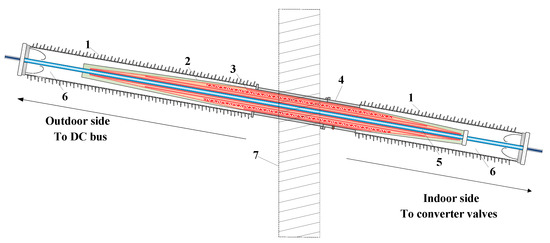
Figure 1.
Structure of a resin impregnated paper (RIP) wall bushing. (1: Insulator sheath, 2: RIP core, 3: Shielding screens, 4: Grounding flange, 5: Conductor, 6: Hexafluoride (SF6); 7: Wall of valve hall).
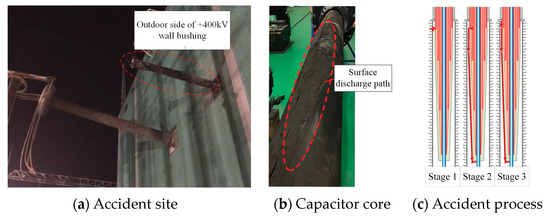
Figure 2.
Photography of a failed +400 kV RIP wall bushing.
The surface charge phenomenon has been widely studied. It is acknowledged that charge will gradually accumulate on the interface with the increase of time, which is known as a relaxation process [9]. The boundary element method was first adopted to simulate the surface charge accumulation of the basin insulator [10]. Considering the nonlinear gas conductivity of Hexafluoride (SF6), numerical simulation models were created to simulate surface charge accumulation of post insulators and basin insulators [11,12,13]. In addition to those simulation studies, researchers also used manipulating devices (including active and passive probes) to measure the surface charge of the basin insulator and the post insulator [13,14]. However, the RIP wall bushing core is made of RIP material, significantly different from the epoxy/Al2O3 material. More importantly, the electric field equalizing structure made up of multi-layer screens in the RIP wall bushing core causes a strong, vertical electric field component [15]. It is more complicated than the basin insulator or the post insulator [3,16], and how to apply the classic accumulation models related to bulk, surface, and gas conduction needs further research. Therefore, it is urgent to solve the lack of related studies on surface charge accumulation of the RIP wall bushing core and its influence on insulation.
In this paper, a surface charge accumulation model of a scaled RIP wall bushing core was established based on nonlinear gas conductivity under positive DC voltage. The distribution characteristics of positive and negative ion density, gas conductivity, and surface charge on the RIP core were studied under positive DC voltage. A surface charge measuring system for the RIP wall bushing core was also realized. The surface charge of the RIP core under positive DC voltage was then measured. The main purpose of this work is to confirm the surface charge accumulation pattern on the RIP wall bushing core under positive DC voltage and to provide guidance for its design.
2. Charge Accumulation Model of the Resin Impregnated Paper (RIP) Wall Bushing Core
2.1. RIP Wall Bushing Core
The RIP wall bushing core used in this paper is a ±30 kV wall bushing core, which is designed by the Shenyang Hexin company, using the equal capacitance method [17,18]. The photography and schematic of this core are shown in Figure 3.
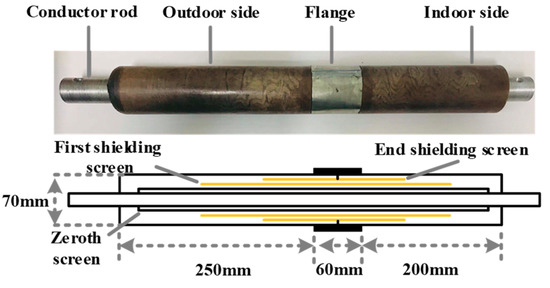
Figure 3.
Photography and schematic of a ±30 kV RIP wall bushing core model.
The model contains three shielding screens: the zeroth screen, the first screen, and the second screen (end shielding screen). The parameters of each screen are shown in Table 1.

Table 1.
Capacitance screens parameters of the ±30 kV resin impregnated paper (RIP) wall bushing core.
Under 30 kV AC voltage, the radial potential and radial electric field distribution of the bushing core are shown in Figure 4a,b, respectively. Two capacitor layers of this core have equal capacitances, which meets the requirements of the equal capacitance design method.
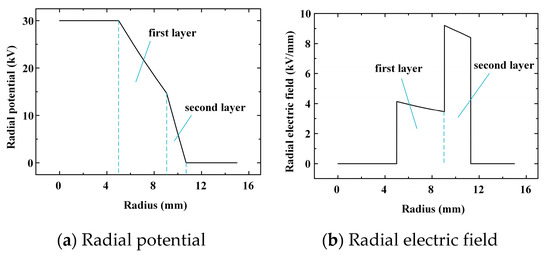
Figure 4.
Radial potential and radial electric field distribution of the ±30 kV wall bushing core.
Considering the follow-up measurements, only the indoor side with shorter length are modeled. Simulations are carried out on a rotationally symmetrical arrangement, as shown in Figure 5.
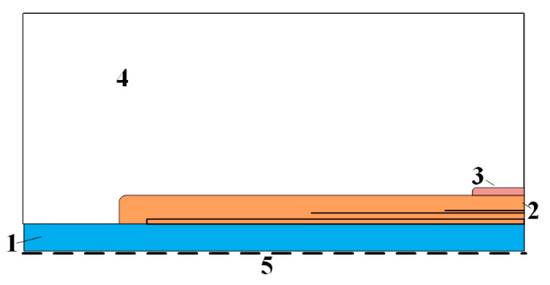
Figure 5.
Schematic of simulation region of the indoor section of a ±30 kV RIP wall bushing core. (1: High-voltage conductor, 2: RIP wall bushing core, 3: Grounding flange, 4: SF6, 5: Symmetry axis.).
2.2. Non-Linearly Volume Conductivity of Hexafluoride (SF6)
Since the conductivity of SF6 is closely related to the number of ions within it [11,12], the physical processes such as generation, coincidence, migration, and diffusion of ions need to be comprehensively considered when studying the current density of the SF6. The constraint equations of positive and negative ion densities in SF6 are as follows:
where is the ion pair generate rate, D+ and D− are the diffusion coefficients for positive and negative ions respectively, n+ and n− are the densities for positive and negative ions respectively, b+ and b− are the mobility ratios for positive and negative ions respectively, and kr is the positive and negative ion recombination coefficient.
The diffusion coefficients of positive and negative ions in insulating gas can be expressed by the Einstein equation as follows:
where kB is the Boltzmann constant, Tg is the gas temperature, and e is the elementary charge.
In this model, the bulk current density of the insulating gas is the sum of the displacement current and the conduction current:
where is the electrical displacement of the gas side.
As the pressure of SF6 around the RIP wall bushing core is 0.3 MPa (absolute pressure), the selected gas transport parameters [11] are shown in Table 2.
Table 2.
Gas transport parameters of 0.3 MPa SF6.
2.3. Surface Current of RIP Wall Bushing Core
The charge density on the RIP wall bushing core can be considered as the surface charge density of a thin layer, which can be expressed by:
where is the normal current density of the core side, is the normal current density of the gas side, is the surface charge density, is the tangential electric field strength, and is the surface conductivity.
The surface conductivity of the RIP material is first measured as 2.3 × 10⁻¹⁴ S. A thin layer with a thickness of 0.1 mm is selected as the surface conduction layer on the surface of the RIP wall bushing core. The volume conductivity of the thin layer satisfies the following equation:
2.4. Boundary Conditions
To solve the nonlinear differential equations, suitable boundary conditions must be defined on the electrodes and the gas–solid interface. The electric potential on the high-voltage electrode and zero screen φH and the ground electrode and end shielding capacitance screen φG is assigned as a Dirichlet-condition:
where U is the applied DC voltage.
The electric potential on the first shielding screen (φ1) is assigned as floating, and the boundary conditions for the charge carrier densities are assigned depending on the current flow.
For the boundary of current outflow, the boundary conditions for positive and negative ions are as follows:
For the boundary of current inflow, the boundary conditions for positive and negative ions are as follows:
where is the normal direction from solid to gas.
3. Simulation Results
3.1. Ions in SF6 Surrounding the RIP Wall Bushing Core
The distributions of ions in SF6 under different amplitudes of positive DC voltages are shown in Figure 6 and Figure 7. It indicates that the distributions of positive and negative ions are completely opposite. There is a relatively high concentration of positive ions near the end shielding screen and it gradually decreases in the direction from the end shielding screen to the high-voltage conductor. On the contrary, the negative ions mainly concentrate on the surface of the high-voltage conductor, which gradually decreases in the direction from the high-voltage conductor to the end shielding screen. Besides, within the simulated voltage range, the magnitude of the ion concentration is almost independent of the magnitudes of applied voltage. This is because, as the voltage increases, the migration of positive and negative ions is enhanced, but at the same time, the recombination of positive and negative ions also increases, resulting in a small change in ion concentration.
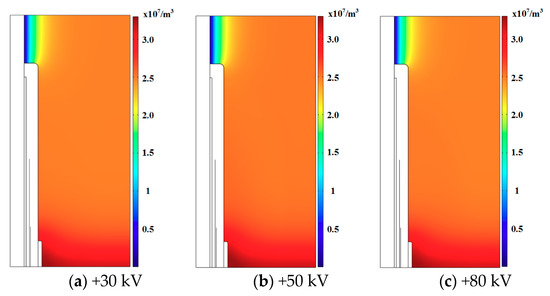
Figure 6.
Positive ions in SF6 surrounding the wall bushing core under different amplitudes of positive DC voltage.
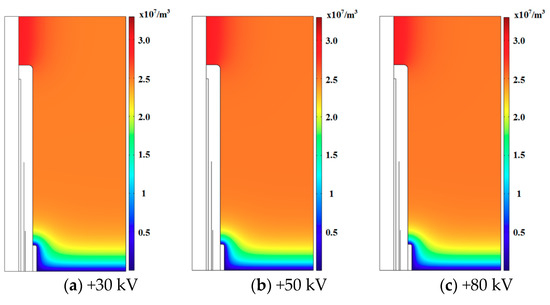
Figure 7.
Negative ions in SF6 surrounding the wall bushing core under different amplitudes of positive DC voltage.
3.2. Ions and Gas Conductivity Along the Surface of the RIP Wall Bushing Core
The state of gas conductivity and surface conductivity of RIP material near the core surface have great influence on surface charge accumulation [6]. The positive and negative ions along the core surface under different amplitudes of voltages are shown in Figure 8. It indicates that the ion concentration along the core surface is nearly independent of the magnitudes of the applied voltage. The positive and negative ion concentrations exhibit a completely opposite distribution along the core surface. From the high-voltage conductor to the end shielding screen, the positive ions rise rapidly from a lower value to the plateaus, followed by a slight rise near the end shielding screen. However, the negative ions drop slightly from a higher value to the plateaus and then fall rapidly.
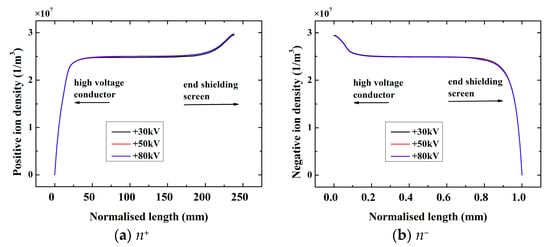
Figure 8.
Positive and negative ion density in SF6 along the RIP wall bushing core surface under different amplitudes of positive DC voltage.
The values of gas conductivity along the RIP wall bushing core surface under different amplitudes of positive DC voltage are shown in Figure 9. It indicates that the gas conductivity tends to be an arched distribution from the high-voltage conductor to the end shielding screen, i.e., the gas conductivity is high in the middle about 7.2 × 10⁻¹⁷ S/m and low at the two ends about 4.2 × 10⁻¹⁷ S/m along the core surface.
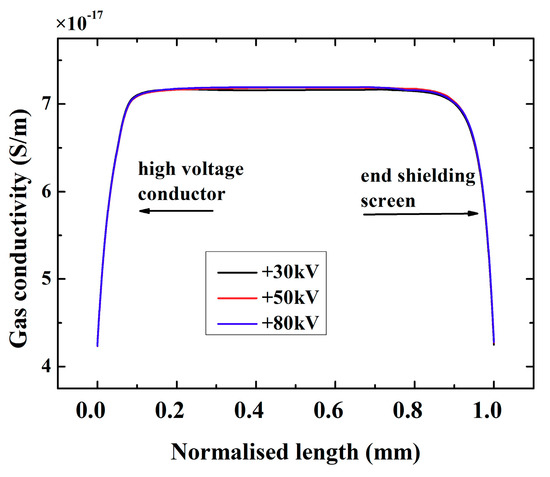
Figure 9.
Gas conductivity along the RIP wall bushing core surface under different amplitudes of positive DC voltage.
3.3. Surface Charge and Electric Field along the RIP Wall Bushing Core Surface
The surface charge along the RIP wall bushing core surface under different amplitudes of positive DC voltage is as shown in Figure 10. It indicates that under positive voltage, the RIP wall bushing core surface mainly accumulates positive charge. Moreover, there is a significant accumulated charge peak at the turning point of the radius, and the accumulated charge near the end shielding screen is small because of the shielding effect of the end shielding screen.
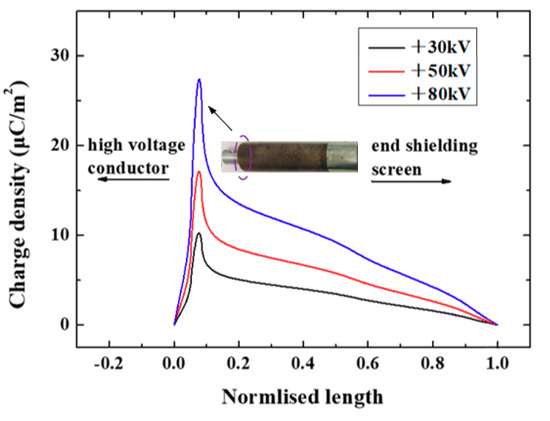
Figure 10.
Surface charge along the RIP wall bushing core surface under different amplitudes of positive DC voltage.
The tangential and the normal electric field distribution along the surface of the RIP wall bushing core is shown in Figure 11. There is a minimum tangential electric field at the turning point of the radius, while a maximum tangential electric field exists near the end shielding screen. The normal electric field along the surface is consistent with the trend of surface charge distribution, and there is a maximum normal electric field at the turning point of the radius, which may become the weak point of insulation.
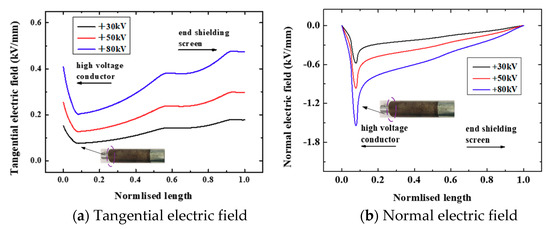
Figure 11.
Tangential and normal electric field along the surface of the RIP wall bushing core.
4. Measurement Conditions
4.1. Surface Charge Measurement System
The electrostatic probe method is used in this paper for surface charge measurement. The probe mainly includes a central inductive probe made of red copper with a diameter of 1.5 mm, an outer shielding made of stainless steel, an insulating support made of polytetrafluoroethylene (PTFE), and a bayonet nut connector (BNC) connector for signal transmission to charge the amplifier (Figure 12). All components are cleaned with anhydrous ethanol and dried at 25 °C for over 12 h. The charge amplifier used is Kistler 5018 A. The charge induced on the probe can be directly read and exported as a 0–5 V analog signal. Its charge measurement sensitivity of 0.1 pC and quick response satisfies the request for surface charge measurement. Before measurement, the probe is calibrated as per the method mentioned in Reference [19].
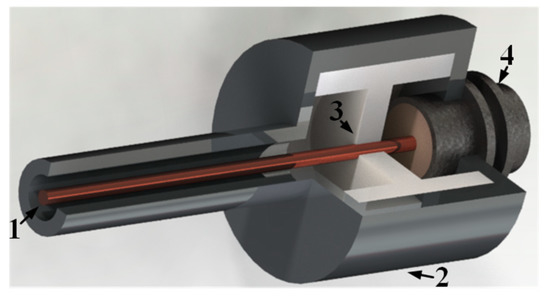
Figure 12.
Structural schematic diagram of an electrostatic capacitive probe. (1: Probe, 2: Shielding Cover, 3: Polytetrafluoroethylene (PTFE) insulation support, 4: Bayonet nut connector (BNC) joint).
The experiment setup is shown in Figure 13. Positive DC voltage is applied on the RIP wall bushing core through a gas insulated substation (GIS) bushing and a GIS transfer unit. The surface charge measurement device is connected after the basin-type insulator, which is filled with SF6 gas of 0.3 MPa (absolute pressure). The RIP wall bushing core surface is cleaned with ethyl alcohol and dried for over 6 h. It was scanned before test to ensure there is no charge accumulated on the core. The temperature and humidity inside the experiment tank are measured by an online monitoring system. Tests are done between 21.4 °C and 24.8 °C, and the moisture content in the SF6 is below a 150 ppm volume fraction.
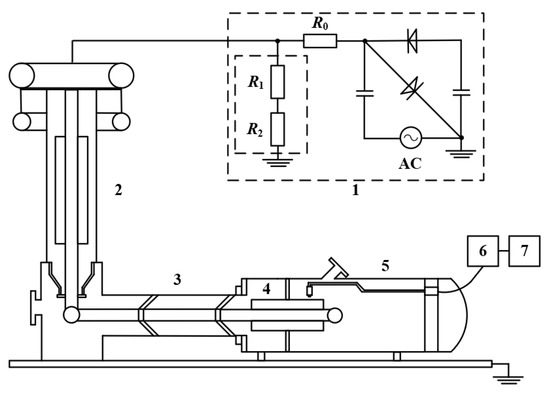
Figure 13.
Experiment setup for surface charge measurement of the RIP wall bushing core. (1: High-voltage direct current (HVDC) generator, 2: Gas insulated substation (GIS) bushing, 3: GIS transfer unit, 4: RIP wall bushing core, 5: Surface charge measurement device, 6: Charge amplifier, 7: Data acquisition card).
4.2. Experimental Procedure
The experimental procedures are as follows: pre-treatment of RIP wall bushing core, adjustment of centering device, vacuuming, inflation of SF6 gas (wait for over 6 h), HVDC voltage application for different time durations, and then immediate surface charge measurement (the distance between the probe and the core surface is 2 mm).
The trajectory of the probe on the RIP wall bushing core’s surface can be expressed by Figure 13a. Follow-up experiments find that the surface charge decay time constant is only several minutes. Therefore, a time interval of 0.5 min is chosen to measure the surface charge between the high-voltage conductor and the end shielding screen. There are 18 rounds for the probe to scan, each with a sampling frequency of 100 Hz. The voltage is applied for 20 min at a time. The probe finishes one axial route to measure, then it moves to another circumferential position. At the start of each route for measurement, the mechanic system sends a signal to the data acquisition system to measure the output of the probe. At the end of each route for measurement, the mechanic system sends another signal to stop data acquisition. Figure 14b shows the probe scanning the RIP wall bushing core’s surface with the control of the mechanical device.
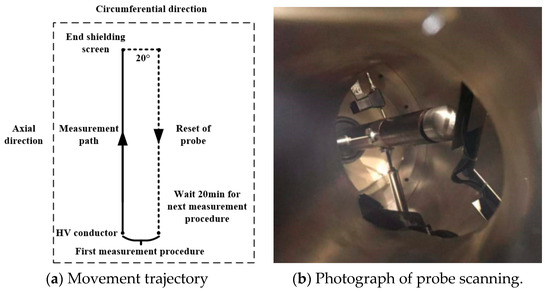
Figure 14.
Movement trajectory and photograph of the probe.
5. Measurement Results
5.1. Charge Decay Characteristics
After a +80 kV DC voltage is applied to the RIP wall bushing core for 20 min, the surface charge distribution of the RIP wall bushing core is measured within 60 min. Figure 15 shows the decay process of the average charge density over time. The fitting results show that the average charge density of the entire measuring surface decreases exponentially with time, and its decay time constant is about 15 min.
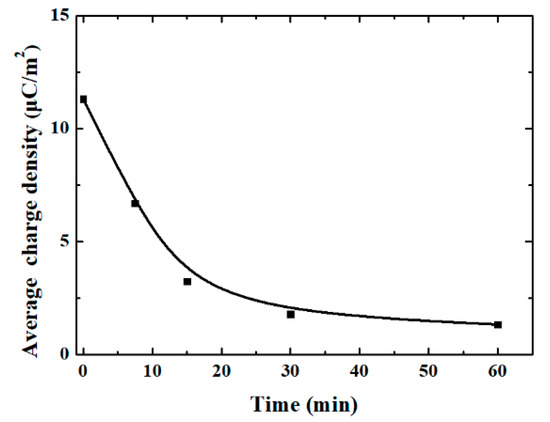
Figure 15.
Charge decays with time. Surface charge decreases rapidly within 20 min, then it begins to stabilize.
5.2. Charge Distribution Under Positive DC Voltage
Figure 16 shows the surface charge distribution of the RIP wall bushing core at different applied voltage times. The surface charge gradually accumulates to saturation state as time increases. Under the +80 kV DC voltage, the surface of the RIP wall bushing core accumulates a positive charge, and during the accumulation process, the charge distribution pattern and concentrated distribution area are determined within 15 min, which shows that only positive charges accumulate on the surface of the RIP wall bushing core. In addition, only positive charges accumulate on the surface with the increase of DC voltage amplitude, probably because there is not obvious micro-discharge near the surface.
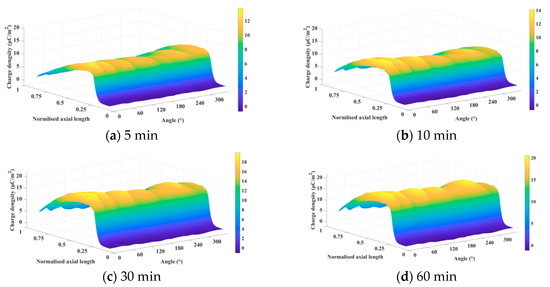
Figure 16.
Surface charge distribution of the RIP wall bushing core under different applied voltage time (+80 kV).
Figure 17 shows the average charge density of the entire measuring surface under different applied voltage times. With the applied voltage time increases, the charge accumulation reaches a saturated state at about 20 min, and the time constant of charge accumulation is about 5 min.
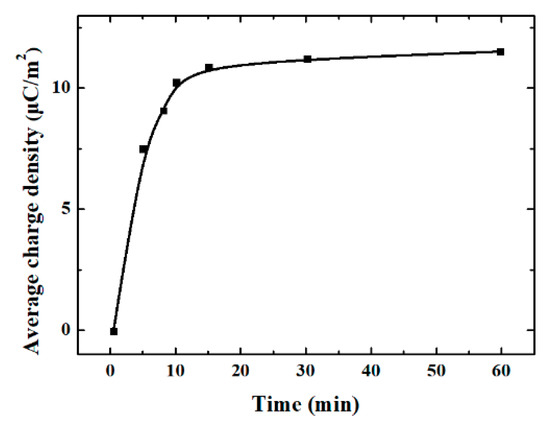
Figure 17.
Average charge density under different applied voltage times. Surface charge increases rapidly within 10 min, then gradually saturates.
Figure 18 shows the axial surface charge distribution under the +80 kV DC voltage. The charges accumulate mainly at the turning point near the high-voltage conductor. The closer to the end shielding screen, the lower the charge amplitude.
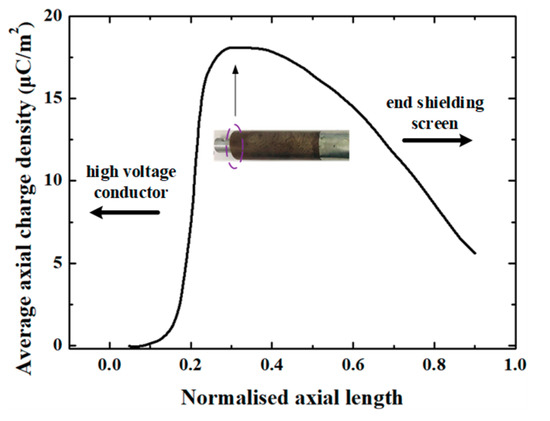
Figure 18.
Average axial surface charge distribution of the RIP wall bushing core under +80 kV.
5.3. Discussions
The surface charge accumulation model of a wall bushing core is shown in Figure 19. There is no accumulation of charge inside a uniform dielectric. However, due to the differences in conductivity and relative dielectric constant between core and SF6 gas, surface charge is bound to occur at the interface between core and SF6 gas.
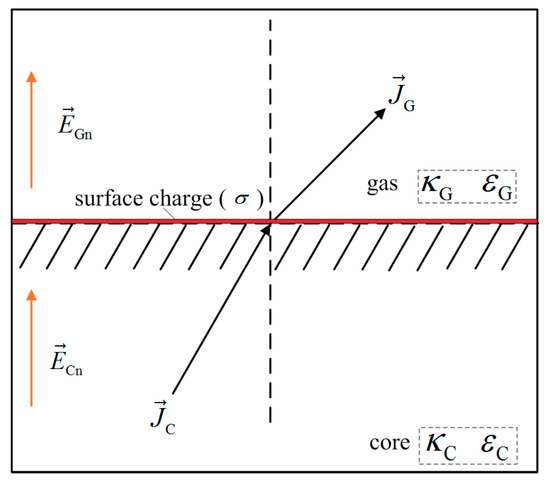
Figure 19.
The surface charge accumulation model of a wall bushing core. ( and are the volume conductivity and relative dielectric constant of the core, respectively. and are the volume conductivity and relative dielectric constant of the SF6 gas, respectively. and are the volume current densities on the core side and the SF6 gas side, respectively. and are the normal electric field on the core side and the SF6 gas side, respectively).
The accumulated charge on the interface is derived from the conductive current of a constant electric field. The electrical displacement vector and current density on both sides of the interface satisfy:
According to the constitutive relation of the electric field, the relationship between the electric field components near the interface and the surface charge can be further obtained:
Then, we can get the surface charge of the core in a steady state, as shown in Equation (14). According to the above simulation results, the gas conductivity along the core surface is about 10−17 order of magnitude, while the conductivity of RIP material is about 10−12 order of magnitude, much smaller than the gas conductivity. In this case, σ = −εGEGn can be obtained, and the surface charge is mainly determined by the normal electric field component of the gas side. Since the normal electric field component of the gas side is negative (from gas side to core side), positive charge is deposited on the RIP surface, which corresponds to the above simulation and experimental results. Therefore, some measures should be taken to reduce the normal electric field component, such as adding a shielding ring at the front part of the high-voltage conductor.
6. Conclusions
In this paper, simulation and experimental studies on the surface charge accumulation of a model RIP wall bushing core under different amplitudes of positive DC voltage were carried out. The following conclusions can be addressed:
- (1)
- The distributions of positive and negative ions are completely opposite, which are almost independent of the amplitudes of applied voltage. The gas conductivity tends to be an arched distribution from the high-voltage conductor to the end shielding screen, i.e., the gas conductivity is high in the middle, about 7.2 × 10⁻¹⁷ S/m, and low at the two ends about, 4.2 × 10⁻¹⁷ S/m along the core surface.
- (2)
- The time constant of charge dissipation of the RIP wall bushing core is about 15 min. For this reason, the method of measuring the entire circumference of the RIP wall bushing core surface after voltage application is not suitable. It would be better to measure the surface charge on one axial direction of the RIP wall bushing core after each voltage application.
- (3)
- Under positive DC voltage, the surface of the RIP wall bushing core is positively charged, which is mainly determined by the normal electric field component of the gas side. The peak of surface charge and normal electric field is located at the turning point of the radius, which may become the weak point of insulation. Thus, some shielding methods should be taken to improve the electric field distribution near the turning point of the radius for the RIP wall bushing core.
Author Contributions
M.C. contributed to the simulation and experiment of the study. X.L. contributed to the concept of the study and wrote the manuscript. C.L. and Y.Z. helped construct the simulation and experiment platforms. H.T. made the model wall bushing cores.
Funding
This research was funded by the National Key Research and Development Plan of China (2016YFB0900804).
Conflicts of Interest
The authors declare no conflict of interest.
References
- Muzzammel, R. Traveling Waves-Based Method for Fault Estimation in HVDC Transmission System. Energies 2019, 12, 3614. [Google Scholar] [CrossRef]
- Zhang, L.; Zhang, L.; Li, Q.; Zou, L.; Yu, C. Electric field computation of ±1000 kV DC wall bushing with consideration of space charge effects. Int. Trans. Electr. Energy Syst. 2014, 24, 297–304. [Google Scholar]
- Zhang, S.; Peng, Z.; Liu, P.; Li, N. Design and dielectric characteristics of the ±1100 kV UHVDC wall bushing in china. IEEE Trans. Dielectr. Electr. Insul. 2015, 22, 409–419. [Google Scholar] [CrossRef]
- Tian, H.; Liu, P.; Zhou, S.; Wang, Q.; Wu, Z.; Zhang, J.; Peng, Z. Research on the deterioration process of electrical contact structure inside the ±500 kV converter transformer RIP bushings and its prediction strategy. IET Gener. Transm. Distrib. 2019, 13, 2391–2400. [Google Scholar] [CrossRef]
- Hung, I.; Bhattacharjee, R. Effect of Photoanode Design on the Photoelectrochemical Performance of Dye-Sensitized Solar Cells Based on SnO2 Nanocomposite. Energies 2016, 9, 641. [Google Scholar] [CrossRef]
- Li, C.; Hu, J.; Lin, C.; Zhang, B.; Zhang, G.; He, J. Surface charge migration and DC surface flashover of surface-modified epoxy-based insulators. J. Phys. D Appl. Phys. 2017, 50, 1–12. [Google Scholar] [CrossRef]
- Ma, J.; Zhang, Q.; You, H.; Wu, Z.; Wen, T.; Guo, C.; Wang, G.; Gao, C. Study on insulation characteristics of GIS under combined voltage of DC and lightning impulse. IEEE Trans. Dielectr. Electr. Insul. 2017, 24, 893–900. [Google Scholar] [CrossRef]
- Du, B.; Huang, P.; Xing, Y. Surface charge and flashover characteristics of fluorinated PP under pulse voltage. IET Sci. Meas. Technol. 2017, 11, 18–24. [Google Scholar] [CrossRef]
- Li, C.; Lin, C.; Zhang, B.; Li, Q.; Liu, W.; Hu, J.; He, J. Understanding surface charge accumulation and surface flashover on spacers in compressed gas insulation. IEEE Trans. Dielectr. Electr. Insul. 2018, 25, 1152–1166. [Google Scholar] [CrossRef]
- Vandam, J.; Paulides, J.; Robertson, W.; Dhaens, S.; Lomonova, E. Analytical surface charge method for rotated permanent magnets: Boundary element method comparison and experimental validation. IEEE Trans. Magn. 2016, 52, 1–4. [Google Scholar] [CrossRef]
- Ma, G.; Zhou, H.; Lu, S.; Wang, Y.; Liu, S.; Li, C.; Tu, Y. Effect of material volume conductivity on surface charges accumulation on spacers under DC electro-thermal coupling stress. IEEE Trans. Dielectr. Electr. Insul. 2018, 25, 1211–1220. [Google Scholar] [CrossRef]
- Winter, A.; Kindersberger, J. Transient Field Distribution in Gas-Solid Insulation Systems under DC voltages. IEEE Trans. Dielectr. Electr. Insul. 2014, 21, 116–128. [Google Scholar] [CrossRef]
- Winter, A.; Kindersberger, J. Stationary resistive field distribution along epoxy resin insulators in air under DC voltage. IEEE Trans. Dielectr. Electr. Insul. 2012, 19, 1732–1739. [Google Scholar] [CrossRef]
- Xue, J.; Wang, H.; Liu, Y.; Li, K.; Liu, X.; Fan, X.; Deng, J.; Zhang, G.; Guo, B. Surface charge distribution patterns of a truncated cone-type spacer for high-voltage direct current gas-insulated metal-enclosed transmission line/gas-insulated metal-enclosed switchgear. IET Sci. Meas. Technol. 2018, 12, 436–442. [Google Scholar] [CrossRef]
- Zhu, M.; Wang, L.; Yin, F.; Farzaneh, M.; Mei, H.; Wen, L. The effect of a vertical electric field on the surface flashover characteristics of a bushing model. Energies 2018, 11, 1607. [Google Scholar] [CrossRef]
- Tang, H.; Wu, G.; Chen, M.; Deng, J.; Li, X. Analysis and disposal of typical breakdown failure for resin impregnated paper bushing in the valve side of HVDC converter transformer. Energies 2019, 12, 4303. [Google Scholar] [CrossRef]
- Wang, Q.; Yang, X.; Tian, H.; Liu, P.; Peng, Z. A novel dissipating heat structure of converter transformer RIP wall bushings based on 3-D electromagnetic-fluid-thermal analysis. IEEE Trans. Dielectr. Electr. Insul. 2017, 24, 1938–1946. [Google Scholar] [CrossRef]
- Shen, W.; Ke, C.; Wang, H.; Zhu, W.; Cao, W.; Wu, K. Muti-parameter diagnosis of HVDC bushing. High Volt. Eng. 2012, 38, 616–622. (In Chinese) [Google Scholar]
- Du, Q.; Zhang, Q.; Wu, Z.; Ma, J.; Zhao, J. Surface charge distribution on DC basin-type insulator. IEEE Trans. Dielectr. Electr. Insul. 2019, 26, 17–25. [Google Scholar] [CrossRef]
© 2019 by the authors. Licensee MDPI, Basel, Switzerland. This article is an open access article distributed under the terms and conditions of the Creative Commons Attribution (CC BY) license (http://creativecommons.org/licenses/by/4.0/).