Abstract
Population growth, increasing droughts, and high irrigation needs are all factors that create freshwater shortage problems on islands. The pressing needs of remote islands usually call for water transport from the mainland or other neighboring islands, at a high cost. This study evaluates the design and economic viability of an alternative, sustainable water supply network on the Mediterranean island of Skyros in Greece. The proposed water supply system provides the island with potable water from desalination units, as well as water for agricultural use from a wastewater treatment plant. The total investment cost of the project is found to be €9.8 million, accounting for the cost of transportation of the water between the different settlements (installation, operations, and maintenance), as well as for the required energy of the involved methods. It is found that 44% of the expenses are related to the transport of potable and residual water, and 52% of the cost corresponds to the production of the required desalinated water. As part of a sustainable water and energy network, all energy needs of water generation are assumed to be covered by a renewable power plant. The total cost of water generation on the island with the proposed system is estimated at 2.49 €/m3, constituting a competitive and more sustainable solution, when compared to current practices.
1. Introduction
Freshwater shortage is an important challenge that society will face in the near future. This problem will be even more accentuated in remote areas (e.g., geographical islands), where already limited local water resources increase the cost of water [1]. In this kind of geographically isolated areas with increasing water demand, there are only a few existing alternatives for water management. These options are usually reduced down to desalination, wastewater treatment, and transportation of water from the mainland.
With most of the water available around us being saline, desalination technologies offer a way to convert this seawater and make it appropriate for human consumption. However, desalination is, nevertheless, an energy-intensive process [2]. Currently, the energy requirements of most desalination plants are met with fossil fuels, while only around 1% of the water generation from desalination in the world is based on renewable energies [2]. Two environmental impacts usually associated with desalination processes are, first, the generation of greenhouse gas emissions from the use of fossil fuels and, second, the discharge of generated brine. Thus, it is of essential importance that engineers and experts scout alternative procedures that are more efficient or use renewable energy to support the generation of desalinated water. Furthermore, in order to promote water reuse and decrease the environmental impacts of desalination, wastewater processes must also be accordingly incorporated into sustainable water supply plans. Since 2011, several Greek towns were equipped with wastewater reuse systems due to the introduced "Urban Wastewater Treatment Directive" (271/91) [3]. However, there remain numerous populations in the state that can still benefit from this type of onsite treatment systems [3]. Although there is currently no water reuse on Aegean islands, this technology can play a very important role in the development of sustainable water strategies for the wider region.
This work includes the study of the water self-reliance of the Mediterranean island Skyros. Skyros belongs to the prefecture of Euboea and is in the region of central Greece (right panel, Figure 1). The island is located in the southernmost part of the group of the Sporades islands of the Aegean Sea [4], and it is the largest island (208,594 km2) of the region. The climate on the island is Mediterranean, with dry summers and mild winters. Although there is frequent presence of clouds, rains are quite scarce throughout the year, which aggravates drought situations [5]. According to the latest available census, Skyros has 2994 inhabitants distributed in 19 different settlements [6].
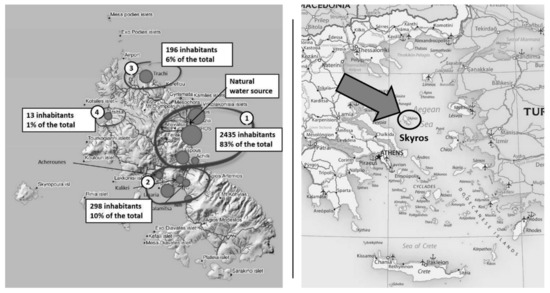
Figure 1.
Defined water zones of the island of Skyros.
Presently, most of the water supply of the island comes from a local source called Anavalsa, located at the northeast part of Skyros. The source provides a flow of 2400–2600 m3/day [4]. Although the amount of water on Skyros is sufficient, its quality in most of the settlements of the island is considered relatively low. When the water demand cannot be satisfied with available water resources, it is covered by water transported from the mainland or neighboring islands, at high cost [7]. Increasing water demand is expected to further aggravate water availability issues in the future [2]. The proposed sustainable water network in this work was designed to generate the full amount of future water demand on the island. The economic feasibility of the project was examined through a detailed economic analysis. All energy requirements for the water network were assumed to be covered by renewable resources (theoretical study presented in [8]).
The importance of this work lies on the fact that it provides an example for how to deal with limited freshwater accessibility in remote places using sustainable methods. Remote communities often apply conventional approaches that accentuate their dependency on the importation of expensive resources. A sustainable, locally-based, and self-reliant water generation system, like the one proposed here, can constitute a valuable social and economic resource to overcome this problem. In order to propose a water network, easily transferrable to other islands without local water resources, the proposed design of the new water supply for Skyros does not account for any existing water sources on the island.
2. Methods
The proposed water supply network generates the necessary water in desalination and wastewater treatment plants. The study followed the latest European policies and standards concerning water resource quality [9,10,11]. The island was divided into four water zones based on conditions of proximity and topographic characteristics. The four defined water zones and the island location in the country can be seen in Figure 1.
The increase in the population and water demand was extrapolated using literature data. The demand was estimated for the next 20 years, called design period [12,13], and the population growth was calculated according to the law of the decreasing rate of increase [12,14]. This law states that every population saturates to a constant population, and its growth rate is thus a function of the population deficit. Nevertheless, when calculating future water demand, one should also consider the increase of the per capita demand, along with population increase. Combining the decreasing rate of population increase with an exponential expression [12] of the water demand due to population increase, the future water demand was estimated, as shown in Figure 2.
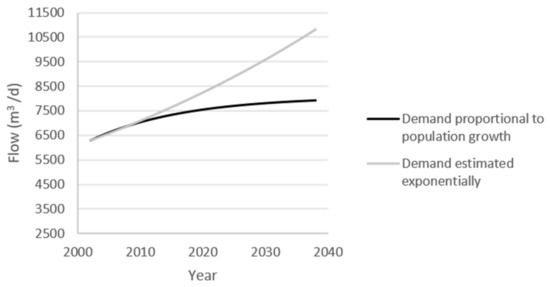
Figure 2.
Estimated demand.
2.1. Water Network Design
The water network on the island includes water transport over long distances in pipelines. There are two types of water transmission lines: (a) pumping main, if the flow of a transmission line is maintained by creating a pressure height by pumping, and (b) gravity main, if the flow is maintained through the elevation difference between two points. Pumping systems can be designed for any topographic configuration, while gravity systems are only feasible if the input point is at a higher elevation than all of the withdrawal points. If the elevation difference is too small, the system may not be economically feasible since the required diameters of pipelines are too large [12].
In the case of Skyros, in configurations with a height difference greater than 60 meters, gravity systems were chosen. In all other cases, pumping mains were used. The placement of the different components constituting the water system (pipes, wastewater treatment plants, and desalination plants) was carefully chosen to avoid any environmentally important areas on the island [4].
2.2. Desalination Plants
Four different desalination technologies were evaluated using the desalination economic evaluation program (DEEP) developed for the IAEA (International Atomic Energy Agency). This software allows designers and decision makers to compare the performance and cost estimates of different energy and desalination configurations. The desalination technologies included in the analysis here were multi-stage flash distillation (MSF), multiple effect distillation (MED), thermal-vapor compression (TVC), and reverse osmosis (RO) [15].
2.3. Wastewater Treatment Plants
There are numerous applications for which reclaimed water can be used. Wastewater treatment systems have to be tailored according to their final use. Since the industrial activity on islands is usually very low (considered zero in the present study), most of the reclaimed water is generated to be used in agricultural applications. Previous projects on reclaimed water realized for case studies in Greece were used as references [3]. The minimum and maximum treatment requirements were determined according to the final use of the water and water quality regulations. The different water quality requirements used in this work are shown in Table 1.

Table 1.
Provisions of the Joint Ministerial Decree for wastewater reuse [18,19].
Wastewater on the island comes from relatively small communities. The infrastructure considered includes vacuum collection systems, treatment facilities [16] (bar screen, grift chamber, clarification, activated sludge, depth filtration, chlorination), and advanced facilities for water regeneration and storage [17]. Currently, wastewater collection on Aegean islands is based on conventional gravity sewers. Unfortunately, these old systems are susceptible to infiltration and exfiltration, mainly due to poor construction and problematic connections. In this work, systems with vacuum collection (Figure 3) are used, since the topography of the island matches the requirements of the system perfectly (mainly flat surface) [17].
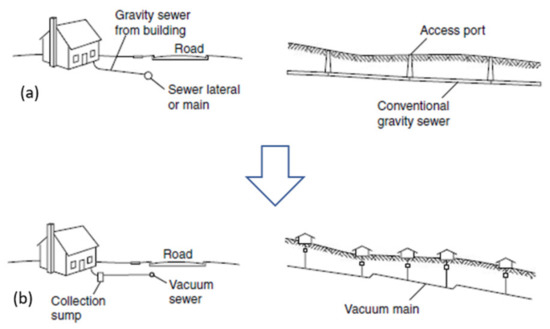
Figure 3.
Wastewater collection systems: (a) conventional gravity flow system; (b) vacuum collection [17].
2.4. Economic Analysis
An economic analysis was realized for all of the different technologies involved in the study and it was based on assumptions related to experimental data, as presented in Table 2.
Table 2.
General assumptions for cost estimations.
To estimate the cost of water transport on the island, a series of cost functions were used. First, a distinction is made between pumping and gravity mains [12,20]. For the first case, the cost function, expressed by Equation (1), depends only on the optimal diameter (D in meters) and the length of the pipe. In this equation, ε is the roughness height of the pipe wall (assumed 0.25 mm for ductile iron), ν is the kinematic viscosity of fluid, L is the pipe length, Q is the discharge, and hf is the head loss due to surface resistance. The final cost function for a gravity main is given by Equation (2), where Cm is the total cost in euro.
In the case of gravity mains, Equation (3) was used. This equation relates the diameter of the pipes with the pumping power needed to find the optimal ratio (by iteration). In this equation, km represents the pipe cost coefficient, m is a pipe cost exponent, is the density of the fluid, is a Lagrange multiplier, z0 and zL is the nodal elevation at input and supply points, respectively, and H is the minimum prescribed terminal head. Partially differentiating Equation (3) with respect to the pumping head (h0) and simplifying it, one obtains the equation for finding the optimal diameter in pumping mains. This is expressed by Equation (4), where R is the Reynolds number. Assuming an arbitrary value of the friction factor f, the optimal diameter is calculated. Knowing the diameter, an improved value of f is obtained with Equation (5). Using this value of f and repeating this process until two successive values of D are very close (with an error of 1 cm), the final optimal diameter and the corresponding friction factor are obtained.
The investment costs of the studied desalination processes (MSF, MED, TVC, RO) were estimated using the DEEP [15]. The energy costs of the processes were determined through the simulation of the necessary desalination plants for each water zone. It was found that the most economically-viable solutions for the two main water zones are an RO plant for Zone 1 and an MED plant for Zone 2, as shown in Figure 4. All data related with these calculations can be found in Appendix A.
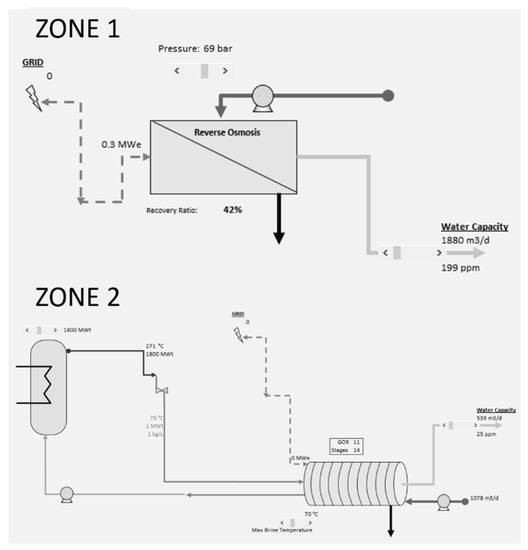
Figure 4.
Water desalination flow diagrams.
To propose an overall sustainable energy–water network, the energy needs of the desalination plants are covered by a renewable hybrid power plant. The most suitable plant was selected among the three different alternatives analyzed in the theoretical study presented in [8]. The capacity of the renewable power plants in [8] was expanded to generate a surplus of thermal energy equal to that required for the desalination by distillation. Among the alternatives of [8], the plant that combines wind turbines with a photovoltaic (PV) system was chosen because it was found to provide the cheapest energy price (Appendix A). The initial cost of electricity [8] was calculated through a detailed economic analysis, accounting for all investment and operational and maintenance costs for the generation of the required electricity. The final price of electricity was calculated including the expansion costs of the power plants and the price of the required thermal energy. These calculations are presented in Table 3.
Table 3.
Electricity and thermal energy cost data.
The economic analysis of the wastewater systems was based on [7], where the cost of the systems is expressed in units per volume of water. As in many industrial processes, the cost per unit of volume is a negative function of the size of the process. Three ranges of plant capacity are accounted for (100–1000, 1000–2500, and 2500–5000 m3/day), each of which is associated with a different cost per volume unit. The investment costs of pumps, buildings, reservoirs, desalination plants, pipes, and treatment parts are costs that take place at the time of construction, while energy and maintenance costs take place every year. To add these two types of costs, the annuity method, which converts fixed investment costs into recurring costs, was used [12,21,22].
3. Results and Discussion
3.1. Water Networks Proposed
3.1.1. Zones 1 and 2
In Zones 1 and 2, the central core of the system that supplies drinking water to the towns is based on desalination plants. Secondary water demand is covered by a wastewater network. The suggested arrangement for the transport of desalinated water is presented on the left panel of Figure 5. The connections between the towns are carried out by conditions of proximity. The pipes used are unidirectional, while the water system includes water storage in each town, necessary to rectify any system failures. Wastewater collection systems consist of lines that start from the towns that are furthest away and end at the treatment plant. This system can be seen on the right panel of Figure 5. Like in the case of the desalination system, the wastewater system also includes unidirectional pipes. The costs of both water systems (Zones 1 and 2), as well as the costs of the generation of desalinated water and wastewater treatment, are shown in Table 4. All related calculations can be found in Appendix B of the paper.
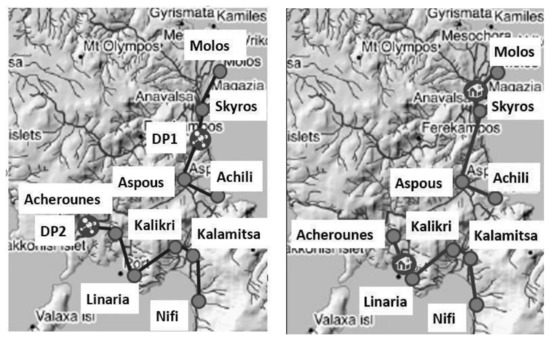
Figure 5.
Desalinated water supply system (left panel) and wastewater collection system (right panel) on the island of Skyros.
Table 4.
Cost of the water supply system.
3.1.2. Zones 3 and 4
As an initial design, it was proposed to transport water to Zones 3 and 4 from Zones 1 or 2. However, due to the great distances and the small water volume that needs to be transported, this alternative was found to be economically unattractive. Thus, it was decided to install a stand-alone desalination plant based on reverse osmosis in Zone 3. However, the great distance between this zone and the renewable power plant increases the cost of the available thermal energy. The cost for this desalination plant is calculated to be 747.27k€ per year (investment cost: 1000k€), including operational and maintenance expenses. For Zone 4, which includes only 13 inhabitants, simple alternatives were proposed and presented in Figure 6. Information related to the current stage of development and typical treatment capacities are also shown. Two options were finally studied: solar multi-effect humidification and reverse osmosis with solar PV. The production per unit of volume of the first option is 3.5€/m3, while that of the second option is 10€/m3 [23]. This pricing difference led to the use of a solar multi-effect humidification plant that results in an annual cost of €61,000.
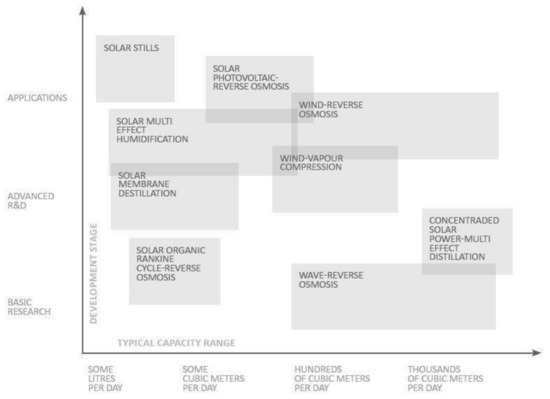
Figure 6.
Renewable desalination technologies [23].
The final estimated cost for the entire water network of the island was found to be €9.8 million. This cost includes the fixed and operational costs of pumps, desalination plants, wastewater treatment, and all other relevant costs during the 20 years of the assumed economic period of the system. After that, the cost is reduced to operational and maintenance expenses.
About 44% of the total costs correspond to water transport and collection (Figure 7). Thus, almost half of the annual cost of the system is due to the logistics required in the small-sized communities and the long distances that separate them. These two factors play a very important role in the final cost of water per volume unit on the island. The other half of the cost corresponds to the production of desalinated water with costs of 2.05, 1.59, 5.63, and 3.5€/m3 in Zones 1, 2, 3, and 4, respectively. These high costs show that there is a need for improvement in the field of desalination technologies, especially for small-scale applications and isolated areas. On the other hand, the advances made in wastewater treatment plants are reflected on their costs, which were found to be 0.2 and 0.4€/m3. It is seen, thus, that these systems can play an essential role in making water supply systems of remote regions economically feasible and sustainable.
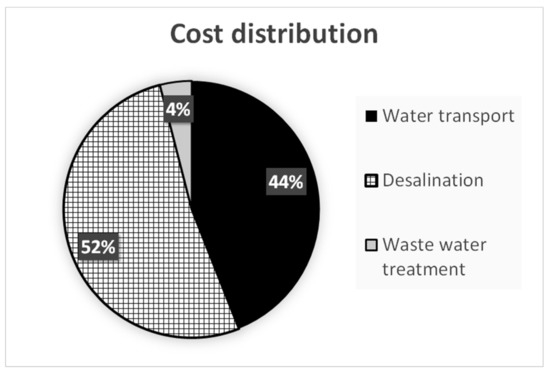
Figure 7.
Cost distribution of the proposed water network on Skyros.
The methodology used to design the proposed water network can be applied to other remote regions and geographical islands with similar climatic and geomorphological characteristics. For example, most of the islands in the region suffer from limited or close-to-zero availability and low quality of local water resources, thus facing the same challenge. The system proposed here was designed to cover the total water demand of the island without considering local water resources, constituting results more easily relatable to other case studies with similar characteristics. Furthermore, in order to obtain a better idea of the economic feasibility of the proposed project, the annual monetary volumes were linked to the annual water demand of the island and the water price per unit volume was calculated. The water price was estimated at 2.49€/m3, a price considerably lower than prices of about 3.5€/m3, reported in previous water production projects on Greek islands with RES (renewable energy source) desalination technologies [1]. Overall, it is expected that projects related to the development of robust and sustainable water and energy networks will drive policy measures that support the use of local resources and, through that, the social prosperity of smaller, isolated communities.
3.1.3. Comparison with Current Situation
Currently, the island uses water from the local source Anavalsa, the unique natural water resource in the island. However, due to the inadequate water quality, large amounts of water are imported from the mainland. To estimate the volume of water imported to Skyros, the Greek island Symi, with 2590 inhabitants, was used as reference. About 120,000 m3 are shipped to the island every year at a cost sometimes exceeding the value of 7€/m3 [1]. It is expected that this trend will grow with increasing population since imported water is the only solution available to islands with limited natural resources. In addition, although Skyros is a relatively unexploited island today, it is expected to further develop its tourism activities (like other surrounding islands). The increase of tourism could further aggravate water shortage problems on the island. Additionally, water transportation involves the consumption of fossil fuels, associated with a considerable carbon footprint. Therefore, renewable, long-term, and economically attractive alternatives, like the one proposed in this work, are expected to highly benefit the island, which is currently served by unsustainable, short-term solutions.
4. Conclusions
Water demand on the Mediterranean islands has been steadily increasing in the last decade, as a result of population growth, new holiday homes, and the increase of living standards. These factors lead to the destabilization of past practices for obtaining water. However, the construction of specific, local projects for each remote island is usually avoided due to the relatively high initial investment cost.
In this work, we proposed a water generation and distribution system to cover the potable and agricultural water needs of the island of Skyros in Greece. Potable water was generated using desalination units, while water for agricultural needs was provided by a wastewater treatment plant. The total investment cost of the project was found to be €9.8 million. It is seen that approximately 44% of the expenses are related to the transport of potable and residual water, and 52% of the cost corresponds to the production of the required desalinated water. This result emphasizes the need for improvement of desalination processes, especially of low-flow and isolated plants. The total cost of water generation of the water supply system was found to be 2.49€/m3, which is significantly lower than the current cost of imported water. Furthermore, many improvements of the involved technologies are expected in the future, especially in the areas of desalination and water transport. This kind of project therefore holds promise for converting water-deprived islands into self-sufficient remote regions by providing long-term solutions to an evidently prominent problem.
Author Contributions
Conceptualization, F.P.; methodology, G.F.-G. and F.P.; investigation, G.F.-G.; writing—original draft preparation, G.F.-G. and F.P.; writing—review and editing, F.P.; supervision, F.P.
Funding
Fontina Petrakopoulou is funded by the Ramón y Cajal Programme of the Spanish Ministry of Science, Innovation and Universities (Grant no. RYC-2016-20971).
Conflicts of Interest
The authors declare no conflict of interest.
Appendix A
This appendix shows the costs of electricity and thermal energy produced by the renewable power plants studied in [8] after their enlargement to cover the energy input of the desalination units on the island. The thermal power required for desalination is 6 MW or 2 MWel when converted using an efficiency of 33 percent.
Scenario 1 [8] consists of the hybridization of a concentrated solar power plant (CSP) including thermal energy storage with wind turbines supported by electrical storage. Scenario 2 proposes the hybridization of a photovoltaic plant (PV) with wind turbines, supported by electric energy storage and hydrogen generation. Scenario 3 consists of the same combination of plants as in scenario 2 but with a hydroelectric pumping station. In all these cases, the expansion of the plant is made in the part corresponding to solar energy (CSP or PV).
The following tables show the economic results provided by the plants before (left part) and after their extension (right part). In the last two tables, it can be seen that the most economically viable configuration is the second option.
Table A1.
Results of economic analyses.
Table A1.
Results of economic analyses.
| Scenario 1 | |||||
|---|---|---|---|---|---|
| Current plant | Concentrated solar power plant (CSP) | Plant after the enlargement | |||
| PFI* | 41,449,819 | € | PFI | 50,957,419 | € |
| Price/kW | 5282 | €/kW | Price/kW | 5282 | €/kW |
| Power | 7.847 | MW | Power | 9.647 | MW |
| Terrain cost | 916,000 | € | Terrain cost | 1,126,108.556 | € |
| Terrain | 183,200 | m2 | Terrain | 225,221.7111 | m2 |
| Hybrid plant | Hybrid plant | ||||
| Rest of the plants (cost) | 15,568,922 | € | Rest of the plants (cost) | 15,568,922 | € |
| Total PFI | 57,018,741 | € | Total PFI | 66,526,341 | € |
| TRR* | 10,168,125 | €/year | TRR | 11,565,249 | €/year |
| Energy supplied | 25,000 | MWh/year | Energy supplied | 25,000 | MWh/year |
| Terrain cost total | 1,519,255 | € | Terrain cost total | 1,729,363.556 | € |
| Price of electricity | 406.725 | €/MWh | Price of electricity | 462.609 | €/MWh |
| Scenario 2 | |||||
| Current plant | PV | Plant after the enlargement | |||
| PFI | 17,915,100 | € | PFI | 20,985,900 | € |
| Price/kW | 1706 | €/kW | Price/kW | 1706 | €/kW |
| Power | 10.501 | MW | Power | 12.301 | MW |
| Terrain cost | 617,645 | € | Terrain cost | 723,514.588 | € |
| Terrain | 123,529 | m2 | Terrain | 144,702.917 | m2 |
| Hybrid plant | Hybrid plant | ||||
| Rest of the plants (cost) | 37,534,371 | € | Rest of the plants (cost) | 37,534,371 | € |
| Total PFI | 55,449,471 | € | Total PFI | 58,520,271 | € |
| TRR | 9,610,162 | €/year | TRR | 10,066,939 | €/year |
| Energy supplied | 25,000 | MWh/year | Energy supplied | 25,000 | MWh/year |
| Terrain cost total | 1,807,940 | € | Terrain cost total | 1,913,809.589 | € |
| Price of electricity | 384.406 | €/MWh | Price of electricity | 402.677 | €/MWh |
| Scenario 3 | |||||
| Current plant | PV | Plant after the enlargement | |||
| PFI | 17,915,100 | € | PFI | 20,985,900 | € |
| Price/kW | 1706 | €/kW | Price/kW | 1706 | €/kW |
| Power | 10.501 | MW | Power | 12.301 | MW |
| Terrain cost | 617,645 | € | Terrain cost | 723,514.5886 | € |
| Terrain | 123,529 | m2 | Terrain | 144,702.9177 | m2 |
| Hybrid plant | Hybrid plant | ||||
| Rest of the plants (cost) | 40,709,396 | € | Rest of the plants (cost) | 40,709,396 | € |
| Total PFI | 58,624,496 | € | Total PFI | 61,695,296 | € |
| TRR | 9,805,051 | €/year | TRR | 10,261,706 | €/year |
| Energy supplied | 25,000 | MWh/year | Energy supplied | 25,000 | MWh/year |
| Terrain cost total | 1,989,785 | € | Terrain cost total | 2,095,654.589 | € |
| Price of electricity | 392.202 | €/MWh | Price of electricity | 410.46824 | €/MWh |
* PFI: Plant-facilities investment, TRR: Total revenue requirement.
Table A2.
Final energy cost.
Table A2.
Final energy cost.
| Cost of Electricity | Thermal Energy Cost | ||||
|---|---|---|---|---|---|
| Scenario 1 | 462.609 | €/MWh | Scenario 1 | 55.884 | €/MWh |
| Scenario 2 | 402.677 | €/MWh | Scenario 2 | 18.271 | €/MWh |
| Scenario 3 | 410.464 | €/MWh | Scenario 3 | 18.266 | €/MWh |
In the following tables, electricity and thermal energy prices for the different combinations are presented. MED = multiple effect distillation; TVC = thermal-vapor compression; RO = reverse osmosis.
Table A3.
Price of electricity (€/MWh).
Table A3.
Price of electricity (€/MWh).
| Zone 1 | ||||
|---|---|---|---|---|
| Header | Technology | MED | TVC | RO |
| Zone 2 | MED | 421.25 | 404.50 | 387.75 |
| TVC | 421.25 | 404.50 | 387.75 | |
| RO | 417.90 | 401.15 | 384.41 | |
Table A4.
Thermal energy price (€/MWh).
Table A4.
Thermal energy price (€/MWh).
| Zone 1 | ||||
|---|---|---|---|---|
| Technology | MED | TVC | RO | |
| Zone 2 | MED | 36.84 | 20.09 | 3.35 |
| TVC | 36.84 | 20.09 | 3.35 | |
| RO | 33.49 | 16.74 | N/A | |
Table A5.
Cost breakdown.
Table A5.
Cost breakdown.
| Technology | Electric Power(MWe) | Thermal Power (MWt) | Total Investment (M€) | Annual Maintenance cost (M€) | Annual Thermal Energy (MWh) | Annual Electric Energy (MWh) | Annualized Investment Cost (M€) | Total Annualized Cost (k€) |
|---|---|---|---|---|---|---|---|---|
| MED-MED | 0.1 | 6 | 4 | 0.44 | 52,560 | 876 | 0.373 | 2224.072 |
| MED-TVC | 0.2 | 6 | 4 | 0.44 | 52,560 | 1752 | 0.373 | 2578.415 |
| MED-RO | 0.2 | 5 | 4 | 0.55 | 43,800 | 1752 | 0.373 | 2359.918 |
| TVC-MED | 0.3 | 3 | 4 | 0.44 | 26,280 | 2628 | 0.373 | 2114.227 |
| TVC-TVC | 0.4 | 3 | 4 | 0.44 | 26,280 | 3504 | 0.373 | 2459.768 |
| TVC-RO | 0.4 | 2 | 4 | 0.55 | 17,520 | 3504 | 0.373 | 2411.382 |
| RO-MED | 0.3 | 1 | 4 | 0.54 | 8760 | 2628 | 0.373 | 1961.894 |
| RO-TVC | 0.4 | 1 | 4 | 0.54 | 8760 | 3504 | 0.373 | 2301.567 |
| RO-RO | 0.4 | 0 | 4 | 0.65 | 0 | 3504 | 0.373 | 2370.513 |
Appendix B
In this appendix all the calculations related with the water transport can be seen. The data is organized in four different configurations.
The following symbols are used in the tables:
Table A6.
Symbols used in tables.
Table A6.
Symbols used in tables.
| Symbol | Meaning |
|---|---|
| F1 | Friction factor guessed |
| F’ | Friction factor after iteration |
| D | Pipeline diameter |
| hg | Pump head (height difference) |
| h0 | Pump head (given by friction) |
| Q | Water flow |
| Z0 | Height initial point |
| Zl | Height final point |
Table A7.
Configuration of the network for drinking water.
Table A7.
Configuration of the network for drinking water.
| Connection Aspous–Achilli | Connection Kalamitsa–Nifi | ||||
|---|---|---|---|---|---|
| Initial data | Initial data | ||||
| Distance | 1392.84 | m | Distance | 1216.55 | m |
| Q | 0.02 | m3/s | Q | 0.01 | m3/s |
| Z0 | 0.00 | m | Z0 | 0.00 | m |
| Zl | 0.00 | m | Zl | 0.00 | m |
| Values after iteration | Values after iteration | ||||
| F1 | D | F’ | F1 | D | F’ |
| 0.02 | 0.187 | 0.023 | 0.025 | 0.148 | 0.024 |
| Final values | Final values | ||||
| Diameter | 0.19 | m | Diameter | 0.15 | m |
| F | 0.03 | F | 0.03 | ||
| Velocity | 0.82 | m/s | Velocity | 0.77 | m/s |
| Reynolds | 149,801.27 | Reynolds | 110,968.08 | ||
| hg | 0.00 | m | hg | 0.00 | m |
| h0 | 6.37 | m | h0 | 6.20 | m |
| Economic results | Economic results | ||||
| Pipelines cost | 445,530.76 | € | Pipelines cost | 307,884.23 | € |
| Power | 1.69 | kW | Power | 0.96 | kW |
| Pumps cost | 8138.54 | € | Pumps cost | 5416.92 | € |
| Pumping cost/year | 5753.46 | €/year | Pumping cost/year | 3276.42 | €/year |
| Annualized total cost | 43,094.08 | € | Annualized total cost | 29,063.62 | € |
| Connection Ferekampos–Aspous | Connection Ferekampos–Skyros | ||||
| Initial data | Initial data | ||||
| Distance | 1878.83 | m | Distance | 3001.67 | m |
| Q | 0.07 | m3/s | Q | 0.91 | m3/s |
| Z0 | 80.00 | m | Z0 | 80.00 | m |
| Zl | 0.00 | m | Zl | 60.00 | m |
| Final values | Final values | ||||
| Diameter | 0.19 | m | Diameter | 0.75 | m |
| Velocity | 2.51 | m/s | Velocity | 2.07 | m/s |
| Reynolds | 455,545.09 | Reynolds | 1,515,001.74 | ||
| Economic results | Economic results | ||||
| Pipelines cost | 596,058.55 | € | Pipelines cost | 8,613,660.26 | € |
| Annualized total cost | 49,060.40 | € | Annualized total cost | 708,973.29 | € |
| Connection Skyros–Molos | Connection Reservoir 2–Linaria | ||||
| Initial data | Initial data | ||||
| Distance | 1456.02 | m | Distance | 776.21 | m |
| Q | 0.26 | m3/s | Q | 0.04 | m3/s |
| Z0 | 60.00 | m | Z0 | 200.00 | m |
| Zl | 0.00 | m | Zl | 0.00 | m |
| Final values | Final values | ||||
| Diameter | 0.31 | m | Diameter | 0.11 | m |
| Velocity | 3.43 | m/s | Velocity | 4.47 | m/s |
| Reynolds | 1,046,659.81 | Reynolds | 482,413.44 | ||
| Economic results | Economic results | ||||
| Pipelines cost | 992,625.04 | € | Pipelines cost | 152,259.78 | € |
| Annualized total cost | 81,701.00 | € | Annualized total cost | 12,532.20 | € |
| Connection Reservoir 2–Acherounes | Connection Reservoir 2–Kalikri | ||||
| Initial data | Initial data | ||||
| Distance | 1025.91 | m | Distance | 1520.69 | m |
| Q | 0.03 | m3/s | Q | 0.05 | m3/s |
| Z0 | 200.00 | m | Z0 | 200.00 | m |
| Zl | 100.00 | m | Zl | 100.00 | m |
| Final values | Final values | ||||
| Diameter | 0.11 | m | Diameter | 0.15 | m |
| Velocity | 2.77 | m/s | Velocity | 2.75 | m/s |
| Reynolds | 305,196.42 | Reynolds | 407,636.35 | ||
| Economic results | Economic results | ||||
| Pipelines cost | 204,485.00 | € | Pipelines cost | 394,452.13 | € |
| Annualized total cost | 16,830.75 | € | Annualized total cost | 32,466.57 | € |
| Connection Kalikri–Kalamitsa | |||||
| Initial data | |||||
| Distance | 282.84 | m | |||
| Q | 0.03 | m3/s | |||
| Z0 | 100.00 | m | |||
| Zl | 0.00 | m | |||
| Final values | |||||
| Diameter | 0.09 | m | |||
| Velocity | 4.68 | m/s | |||
| Reynolds | 422,834.90 | ||||
| Economic results | |||||
| Pipelines cost | 47,548.43 | € | |||
| Annualized total cost | 3913.62 | € | |||
Table A8.
Configuration of the network for wastewater transport.
Table A8.
Configuration of the network for wastewater transport.
| Connection Achilli–Aspous | Connection Aspous–Skyros | ||||
|---|---|---|---|---|---|
| Initial data | Initial data | ||||
| Distance | 1392.84 | m | Distance | 2469.82 | m |
| Q | 0.01 | m3/s | Q | 0.02 | m3/s |
| Z0 | 0.00 | m | Z0 | 0.00 | m |
| Zl | 0.00 | m | Zl | 60.00 | m |
| Values after iteration | Values after iteration | ||||
| F1 | D | F’ | F1 | D | F’ |
| 0.025 | 0.098 | 0.027 | 0.025 | 0.172 | 0.023 |
| Final values | Final values | ||||
| Diameter | 0.10 | m | Diameter | 0.17 | m |
| F | 0.03 | F | 0.03 | ||
| Velocity | 0.78 | m/s | Velocity | 0.76 | m/s |
| Reynolds | 74,794.91 | Reynolds | 128,325.64 | ||
| hg | 0.00 | m | hg | 60.00 | m |
| h0 | 11.13 | m | h0 | 70.67 | m |
| Economic results | Economic results | ||||
| Pipelines cost | 245,520.38 | € | Pipelines cost | 722,095.67 | € |
| Power | 0.77 | kW | Power | 14.80 | kW |
| Pumps cost | 4612.72 | € | Pumps cost | 39,014.17 | € |
| Pumping cost/year | 2623.40 | €/year | Pumping cost/year | 50,279.28 | €/year |
| Annualized total cost | 23,211.36 | € | Annualized total cost | 112,924.72 | € |
| Connection Aspous–Skyros | Connection Molos–WWTP1 | ||||
| Initial ddata | Initial data | ||||
| Distance | 860.23 | m | Distance | 2469.82 | m |
| Q | 0.07 | m3/s | Q | 0.02 | m3/s |
| Z0 | 0.00 | m | Z0 | 0.00 | m |
| Zl | 0.00 | m | Zl | 60.00 | m |
| Values after iteration | Values after iteration | ||||
| F1 | D | F’ | F1 | D | F’ |
| 0.02 | 0.33 | 0.02 | 0.025 | 0.172 | 0.023 |
| Final values | Final values | ||||
| Diameter | 0.33 | m | Diameter | 0.17 | m |
| F | 0.03 | F | 0.03 | ||
| Velocity | 0.80 | m/s | Velocity | 0.76 | m/s |
| Reynolds | 257,967.65 | Reynolds | 128,325.64 | ||
| hg | 0.00 | m | hg | 60.00 | m |
| h0 | 2.12 | m | h0 | 70.67 | m |
| Economic results | Economic results | ||||
| Pipelines cost | 643,484.49 | € | Pipelines cost | 722,095.67 | € |
| Power | 1.71 | kW | Power | 14.80 | kW |
| Pumps cost | 8202.35 | € | Pumps cost | 39,014.17 | € |
| Pumping cost/year | 5815.94 | €/year | Pumping cost/year | 50,279.28 | €/year |
| Annualized total cost | 59,454.99 | € | Annualized total cost | 112,924.72 | € |
| Connection Kalamitsa–Kalikri | Connection Nifi–Kalamitsa | ||||
| Initial data | Initial data | ||||
| Distance | 282.84 | m | Distance | 1216.55 | m |
| Q | 0.01 | m3/s | Q | 0.003 | m3/s |
| Z0 | 0.00 | m | Z0 | 0 | m |
| Zl | 100.00 | m | Zl | 0 | m |
| Values after iteration | Values after iteration | ||||
| F1 | D | F’ | F1 | D | F’ |
| 0.025 | 0.116 | 0.026 | 0.03 | 0.077 | 0.029 |
| Final values | Final values | ||||
| Diameter | 0.12 | m | Diameter | 0.08 | m |
| F | 0.03 | F | 0.025 | ||
| Velocity | 0.78 | m/s | Velocity | 0.7449946 | m/s |
| Reynolds | 88,042.89 | Reynolds | 5.58 x 10⁴ | ||
| hg | 100.00 | m | hg | 0 | m |
| h0 | 101.88 | m | h0 | 11.220727 | m |
| Economic results | Economic results | ||||
| Pipelines cost | 57,819.37 | € | Pipelines cost | 173,708.5 | € |
| Power | 9.87 | kW | Power | 0.5 | kW |
| Pumps cost | 29,104.60 | € | Pumps cost | 3148.4 | € |
| Pumping cost/year | 33,525.19 | €/year | Pumping cost/year | 1546.8 | €/year |
| Annualized total cost | 40,679.73 | € | Annualized total cost | 16,103.6 | € |
| Connection Linaria–WWTP2 | |||||
| Initial data | |||||
| Distance | 707.11 | m | |||
| Q | 0.03 | m3/s | |||
| Z0 | 0.00 | m | |||
| Zl | 0.00 | m | |||
| Values after iteration | |||||
| F1 | D | F’ | |||
| 0.03 | 0.215 | 0.022 | |||
| Final values | |||||
| Diameter | 0.22 | m | |||
| F | 0.03 | ||||
| Velocity | 0.71 | m/s | |||
| Reynolds | 149,475.02 | ||||
| hg | 0.00 | m | |||
| h0 | 2.12 | m | |||
| Economic results | |||||
| Pipelines cost | 269,538.41 | € | |||
| Power | 0.65 | kW | |||
| Pumps cost | 4057.13 | € | |||
| Pumping cost/year | 2196.70 | €/year | |||
| Annualized total cost | 24,715.81 | € | |||
| Connection Skyros–WWTP1 | Connection Kalikri–Linaria | ||||
| Initial data | Initial data | ||||
| Distance | 707.11 | m | Distance | 1772.00 | m |
| Q | 0.20 | m3/s | Q | 0.01 | m3/s |
| Z0 | 60.00 | m | Z0 | 100.00 | m |
| Zl | 0.00 | m | Zl | 0.00 | m |
| Final values | Final values | ||||
| Diameter | 0.25 | m | Diameter | 0.09 | m |
| Velocity | 4.24 | m/s | Velocity | 1.88 | m/s |
| Reynolds | 1,019,093.94 | Reynolds | 172,043.01 | ||
| Economic results | Economic results | ||||
| Pipelines cost | 328,755.22 | € | Pipelines cost | 301,424.13 | € |
| Annualized total cost | 27,059.19 | € | Annualized total cost | 24,809.62 | € |
| Connection Acherounes–WWTP2 | |||||
| Initial data | |||||
| Distance | 1000.00 | m | |||
| Q | 0.01 | m3/s | |||
| Z0 | 100.00 | m | |||
| Zl | 0.00 | m | |||
| Final values | |||||
| Diameter | 0.08 | m | |||
| Velocity | 1.81 | m/s | |||
| Reynolds | 125,804.38 | ||||
| Economic results | |||||
| Pipelines cost | 134,076.10 | € | |||
| Annualized total cost | 11,035.54 | € | |||
Table A9.
Connection desalination plants—reservoirs.
Table A9.
Connection desalination plants—reservoirs.
| Connection DP1–Ferekampos | Connection DP2–Reservoir 2 | ||||
|---|---|---|---|---|---|
| Initial data | Initial data | ||||
| Distance | 2624.88 | m | Distance | 1530.52 | m |
| Q | 0.02 | m3/s | Q | 0.01 | m3/s |
| Z0 | 0.00 | m | Z0 | 0.00 | m |
| Zl | 80.00 | m | Zl | 200.00 | m |
| Values after iteration | Values after iteration | ||||
| F1 | D | F’ | F1 | D | F’ |
| 0.02 | 0.184 | 0.023 | 0.025 | 0.101 | 0.027 |
| Final values | Final values | ||||
| Diameter | 0.18 | m | Diameter | 0.10 | m |
| F | 0.03 | F | 0.03 | ||
| Velocity | 0.82 | m/s | Velocity | 0.78 | m/s |
| Reynolds | 147,229.92 | Reynolds | 76,990.52 | ||
| hg | 80.00 | m | hg | 200.00 | m |
| h0 | 92.24 | m | h0 | 211.83 | m |
| Economic results | Economic results | ||||
| Pipelines cost | 822,782.58 | € | Pipelines cost | 276,967.11 | € |
| Power | 23.68 | kW | Power | 15.60 | kW |
| Pumps cost | 54,796.98 | € | Pumps cost | 40,514.39 | € |
| Pumping cost/year | 80,435.44 | €/year | Pumping cost/year | 52,972.94 | €/year |
| Annualized total cost | 152,667.27 | € | Annualized total cost | 79,104.21 | € |
References
- Kaldellis, J.K.; Kondili, E.M. The water shortage problem in the Aegean archipelago islands: Cost-effective desalination prospects. Desalination 2007, 216, 123–138. [Google Scholar] [CrossRef]
- Ghaffour, N.; Mujtaba, I.M. Desalination using renewable energy. Desalination 2018, 435, 1–2. [Google Scholar] [CrossRef]
- Ilias, A.; Panoras, A.; Angelakis, A. Wastewater recycling in Greece: The case of Thessaloniki. Sustainability 2014, 6, 2876–2892. [Google Scholar] [CrossRef]
- Demographics, Geography, Economy and Energy Statistics of Skyros. Technical Report. Available online: http://www.genergis.eu/deliverables (accessed on 5 November 2019).
- Hellenic National Meteorological Service. HNMS Climatology Skyros; Hellenic National Meteorological Service: Athens, Greece, 2018.
- Hellenic National Meteorological Service. ELSTAT Censo Población Skyros; Hellenic National Meteorological Service: Athens, Greece, 2011.
- Gikas, P.; Tchobanoglous, G. Sustainable use of water in the Aegean Islands. J. Environ. Manag. 2009, 90, 2601–2611. [Google Scholar] [CrossRef]
- Petrakopoulou, F.; Loizidou, M. Scenarios for the Sustainable Development of Energy Autonomy of Skyros. Technical Report. Available online: http://www.genergis.eu/deliverables (accessed on 05 November 2019).
- The Council of the European Union. Council Directive 98/83/EC; The Council of the European Union: Brussels, Belgium, 2008. [Google Scholar]
- Energy, Legislative and Institutional Issues for Energy & Water Greece, Italy, Spain, Portugal. 2010. Available online: https://www.prodes-project.org/fileadmin/Files/Deliverable_6_1.pdf (accessed on 5 November 2019).
- Hellenic Ministry for the Environment. Establishment of Measures, Conditions and Procedures for the Re-Use of Treated Waste Water and Other Provisions; Hellenic Ministry for the Environment: Athens, Greece, 2011.
- Swamee, P.K.; Sharma, A.K. Design of Water Supply Pipe Networks; John Wiley & Sons: Hoboken, NJ, USA, 2008; ISBN 9780874216561. [Google Scholar]
- Davis, M.L. Water and Wastewater Engineering: Design Principles and Practice; McGraw-Hill: New York, NY, USA, 2011; ISBN 9780071713856. [Google Scholar]
- Mekonnen, Y. Population Forecasting for Design of Water Supply System in Injibara Town, Amhara Region, Ethiopia. IISTE 2018, 10, 54–65. [Google Scholar]
- International Atomic Energy Agency. DEEP 5 User Manual; International Atomic Energy Agency: Vienna, Austria, 2013. [Google Scholar]
- Kampragou, E.; Grigoropoulou, H.; Assimacopoulos, D. Treated wastewater reuse potential: Mitigating water. Water Resour. 2014, 53, 3272–3282. [Google Scholar]
- Bakir, H.A. Sustainable wastewater management for small communities in the Middle East and North Africa. J. Environ. Manag. 2001, 61, 319–328. [Google Scholar] [CrossRef] [PubMed]
- Chartzoulakis, K.; Paranychianakis, N.; Angelakis, A. Water resources management in the Island of Crete, Greece, with emphasis on the agricultural use. Water Policy 2001, 3, 193–205. [Google Scholar] [CrossRef]
- Tsagarakis, K.P.; Dialynas, G.E.; Angelakis, A.N. Water resources management in Crete (Greece) including water recycling and reuse and proposed quality criteria. Agric. Water Manag. 2004, 66, 35–47. [Google Scholar] [CrossRef]
- Water Transmission. Available online: https://www.samsamwater.com/library/TP40_20_Water_transmission.pdf (accessed on 5 November 2019).
- Bixio, D.; Thoeye, C.; De Koning, J.; Joksimovic, D.; Savic, D.; Wintgens, T.; Melin, T. Wastewater reuse in Europe. Desalination 2006, 187, 89–101. [Google Scholar] [CrossRef]
- Voutchkov, N. Desalination Engineering, Planing and Design; McGraw-Hill: New York, NY, USA, 2013; ISBN L9780071777162. [Google Scholar]
- Asano, T.; Burton, F.L.; Engineer, C.; Altos, L.; Leverenz, H.L.; Tsuchihashi, R.; Specialist, T.; Tchobanoglous, G. Water Reuse, Issues, Technologies and Applications; McGraw-Hill: New York, NY, USA, 2007; ISBN 9780071459273. [Google Scholar]
© 2019 by the authors. Licensee MDPI, Basel, Switzerland. This article is an open access article distributed under the terms and conditions of the Creative Commons Attribution (CC BY) license (http://creativecommons.org/licenses/by/4.0/).