Abstract
Urban metabolism assessments enable the quantification of resource flows, which is useful for finding intervention points for sustainability. At a household level, energy metabolism assessments can reveal intervention points to reshape household energy consumption and inform decision-makers about a more sustainable urban energy system. However, a gap in the current urban metabolism research reveals that existing household energy consumption studies focus on outflows in the form of greenhouse gas emissions, and have been mostly undertaken at the city or national level. To address this gap, this study developed a method to assess household energy metabolism focusing on direct energy inflows in the form of carriers, and through-flows in the form of services, to identify intervention points for sustainability. Then, this method was applied to assess the energy metabolism of different households in Cape Town, South Africa, as categorized by income groups. The study argued that the developed method is useful for undertaking bottom–up household energy metabolic assessments in both formal and informal city settings in which more than one energy carrier is used. In cities where only national or city-level data exists, it provides a method for understanding how different households consume different energy carriers differently.
1. Introduction
Energy is an integral part of human well-being, and is one of the basic services that humans require in order to thrive. It provides the means to cook, to heat, to cool, to light up homes, to charge mobile phones, and to operate other electronic devices. The modern energy system causes significant environmental impacts. Most (60–80%) of the global final energy consumption is in urban areas, and is responsible for between 71–86% of greenhouse gas emissions [1,2], making it a large contributor to climate change. Given the central role that cities play as energy consumers, it is crucial to understand the different energy consumption patterns therein so as to identify intervention points for reshaping energy flows toward a more sustainable energy system.
Cities can be examined at different levels, of which the household is the smallest structural level [3]. As a sector, the household is crucial driver of energy consumption in cities [4,5,6,7]. Despite technical innovation in the form of energy efficiency and renewable energy technologies, household energy consumption continues to rise [8,9]. Therefore, households are a critical point of intervention.
Many households in the Global South lack access to high-quality energy services [10]. In particular, inadequate electricity access results in these households consuming alternative energy carriers that are often inefficient or physically harmful. These households are expected to experience an increase in energy consumption, which means increased greenhouse gas emissions [11]. Hence, the focus in the Global South should be on improving access in the most efficient way while addressing high levels of consumption in other parts of the city [12], ultimately reducing greenhouse gas emissions while increasing access.
Urban metabolism uses the concept of flows to understand how resources move through a city [12], making it possible to understand flows that shape or have the potential to reshape urban areas to become sustainable. Thomson and Newman [13] highlighted that a city’s metabolism consists of many metabolisms. Therefore, it is vital to take a deeper exploration into cities to explore metabolisms of different resource types or metabolisms at different levels. For instance, it can be scaled to address specific resources (e.g., energy) at specific levels (e.g., household).
Studying energy at the household level provides the closest look at how human activity contributes to energy consumption. It follows that researchers persistently recommend a household focus for metabolism studies [14,15,16]. Although various urban metabolism tools have been developed, including Integrated Land Use, Transportation, Environment (ILUTE) (ILUTE “simulates the evolution of an integrated urban system over an extended period of time”) [17], Integrated Urban Metabolism Analysis Tool (IUMAT) [18], and URBANISM (“UrbanSim is an integrated transportation land-use model”) [19], few practical assessments have been done on energy metabolism at the household level.
It is essential to understand how household characteristics and activities shape energy flows. This includes addressing not only electricity, but also alternative energy carriers servicing many households in the Global South, such as charcoal and paraffin. While some households may consume large amounts of energy and have the potential for reducing this consumption, others still require sufficient access to energy carriers that do not threaten their health. Existing household energy metabolism assessments tend to use disaggregated city-level data, resulting in coarse estimates. In light of this, bottom–up assessments may offer robust insights on how different household types use energy. Further, both direct and indirect household energy consumption are overwhelmingly examined in the literature. However, this paper focuses only on the direct energy consumption, because (i) it is specifically focused on energy access, which is a concept that refers only to direct energy, and (ii) indirect energy is the subject of further research, particularly around implications of transportation as well as water and food consumption.
After presenting an overview of the literature related to urban energy metabolism and household energy consumption, the objective of this paper is therefore to present a method developed for undertaking a differential household energy metabolism assessment, focusing specifically on inflows in the form of energy carriers and through-flows in the form of energy services. Further, the method is applicable to both formal and informal settings within the urban environment, where formal dwellings include brick and mortar houses and apartments in high-income areas, and where informal dwellings are often built from scrap building materials and located in low-income areas. The method was applied to the city of Cape Town, South Africa, as it is a city where bottom–up household energy data are severely lacking. The city is also home to a broad range of income groups and dwelling types, making it a useful location for developing and applying the method.
2. Urban Energy Metabolism for Sustainability
The origin of the term ‘urban metabolism’ is highly contested. In 1883, Marx first imagined the notion that a society as a whole has a resource metabolism, in which nature is transformed as needed to provide society with the necessary commodities [11,20,21]. Some argue the first explicit mention of the term ‘urban metabolism’ was made in 1965 by Wolman, who presented the metabolism of a hypothetical American city to demonstrate the metabolic needs of a city, such as the materials the city’s inhabitants need to sustain their home, work and leisure lives [8,16,20,22]. Meanwhile, others believe that Theodor Weyl pioneered the term in 1894, in his discussion of food consumption, comparing nutrient discharge with the food intake into the city of Berlin [23].
The most frequently cited definition of urban metabolism is that of Kennedy et al. (2007, p. 44), which defines it as “the sum total of the technical and socioeconomic processes that occur in cities, resulting in growth, production of energy, and elimination of waste”. The authors originate from the Industrial Ecology discipline and, as the definition suggests, are particularly focused on the quantification of resource flows. The definition is criticized for being too restrictive in its implied methods and practical application of an urban metabolism assessment [3,11]. The main criticism is the bias toward quantification and consequent disregard for the emergent properties that are possible through resource exchange [11]. Similarly, Barrera et al. [3] argued that the definition should also include the social and political aspects of a city, such as how resources are distributed. Currie and Musango [14] and Musango et al. [11] call for the inclusion of people and information flows, while acknowledging the role of built and natural systems in conveying flows.
Currie and Musango [14] thus define urban metabolism as the “collection of complex sociotechnical and socioecological processes by which flows of material, energy, people, and information shape the city, service the needs of its populace, and impact the surrounding hinterland”. This definition includes a significantly broader scope, namely a shift from a purely accounting view to one that accounts for complexity and an explicit consideration for the needs of the residents in a city, thereby addressing not only efficiency, but also equity. However, this paper aims to understand a very specific aspect of resource flows in the city: that of energy consumption within households. For this specific application, the broad definition provides a foundation of accounting for various technical flows into and out of the city. This foundation aids in contextualizing flows of specific resources on a specific scale of the city, which, in this, case is household energy.
While the theoretical approach is developed enough for practical applications, urban metabolism assessments of cities are still limited, particularly in the Global South [8,11,21]. Possible reasons are that: (i) urban metabolism assessments lack standardized methods [11,16,24] and (ii) are simpler to conduct where rich data for resource flows already exist [25]. Another argument is that cities have different contexts, which implies that a standard method might not be as viable to large-scale practical applications of urban metabolism as the literature suggests.
Urban metabolism can highlight intervention points for lightening resource dependence in cities. Its inclusion of all types of resources may hinder its ability to make practical and spatially explicit recommendations for cities. This paper is of the similar view with Carréon and Worrell [20] that in order to progress toward a sustainable energy system, an important starting point is to understand the flows of energy through the city. Approaching a sustainable energy system also means understanding how people access and use energy differently in the city, to ensure access to safe, reliable, and modern energy sources to all citizens.
The Urban Energy System
Energy is a unique resource to examine, as it does not flow in the same manner as most resources. Instead, it flows through the different phases of the urban energy system. Zhang et al. [26] disaggregate the system into five phases: namely energy exploitation, energy transformation, industry, living, and recovery. Carreón and Worrell [20] indicate three phases of energy system, namely (i) energy sources, which are connected by (ii) energy carriers to meet (iii) the city’s energy demand. Both studies emphasize that energy flows from one phase to the next. Therefore, understanding the energy system requires understanding urban energy flows.
A city’s energy system can be conceptualized as depicted in Figure 1, which was adapted from Carreón and Worrell [20], Chen and Chen [27] and Zhang et al. [28]. Energy exploitation is the first phase of the system, which allows the identification of the source of the various energy flows. This phase includes all the mining activities for raw materials. In the second phase, energy is transformed into carriers. The physical infrastructure of grids, refineries, and power plants transform energy into the carriers of fuel, electricity, gas etc., which hold the energy.
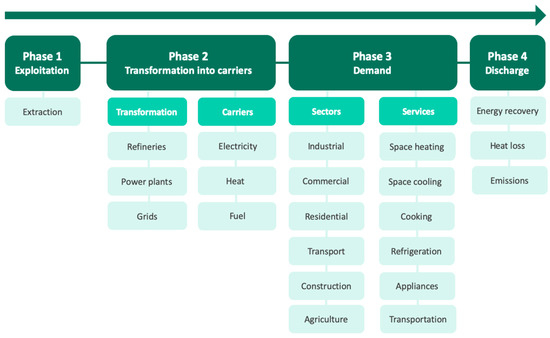
Figure 1.
The urban energy system. Sources: Adapted from Carreón and Worrell [20], Chen and Chen [27], and Zhang et al. [28].
The third phase is energy demand. According to Carreón and Worrell [20], this phase can be divided into energy sectors and end use, which represent two flows within the same phase. Figure 1 shows a possible further disaggregation in sectors based on Chen and Chen [27], who provided detail on the various energy sectors found in a city. Some disagreement exists around the difference between energy end use and energy services. What Carreón and Worrell [20] regarded as end use, Bristow and Kennedy [29] and Barrera et al. [3] regarded as services. Carreón and Worrell [20] regarded energy services as a further phase after energy end use. This study makes use of the views of Bristow and Kennedy [29] and Barrera et al. [3] based on Fell [30], who regarded energy services as the function performed using energy. A fourth phase needs to be added in order to account for Zhang et al.’s [28] energy recovery. The top arrow in Figure 1 indicates that the entire system represents the flow of energy from extraction to processes in the city, and finally discharge into the environment. Not all energy may flow through all phases, but it always flows from left to right, from exploitation to discharge.
3. Towards Conceptualizing Household Energy Metabolism
Various urban energy metabolism assessments have been conducted. Chen and Chen [27] translated the city’s energy activities into carbon flows in order to model the carbon metabolism and associated energy-use activities. Zhang et al. [31] studied the energy metabolism of various sectors in a city as well as their associated carbon footprints. Both studies argue that carbon flows should be central to urban energy metabolism assessments, as this helps to understand the carbon profile of cities and consequently the amount of pressure that a city’s energy system places on the environment and consequently the contribution of a city to climate change risk [27,31]. Therefore, the focus is mainly on the energy outflows. Weisz and Steinberger [32] similarly focus on the energy outflows in their review on the various ways in which a city can reduce both its energy and material flows. The notion to focus strongly on greenhouse gas emissions is limited. Energy assessments also require expansion beyond carbon to include the local dynamics of energy provision and use, so as to understand future energy demand, infrastructure pressures, and how to effectively plan fast-growing cities.
There is another prevailing gap in addressing the through-flows of energy within the urban system. While Chen and Chen [27] deemed the flows between sectors important, they mainly addressed the inflows in the form of extraction and the eventual outflows to the carbon sink. This correlates with the first and last phase of the energy system, and leaves a gap for addressing the flows within, namely carriers, sectors, and services. This gap is addressed by Zhang et al. [28], who argued that urban metabolism struggles to address ecological trophic levels within the energy system. They shifted the focus to analyze the relationships within this system using through-flow analysis and ecological network utility analysis, and found a total of 73 different metabolic pathways between 17 energy sectors, concluding that it is possible to make the city’s energy flows more efficient by adjusting these relationships [28]. For example, to balance out a system where demand is higher than supply, energy consumption must either be lowered, or energy production must be increased. Consequently, it is possible to grasp the adequacy of supply of primary energy sources to meet the needs of the energy service phase.
Carreón and Worrell [20] identified another gap: most energy metabolism studies are overwhelmingly linear, using only accounting approaches and input–output analysis, disregarding causal relationships between elements such as climate, demographics, and infrastructure. Beyond quantification are possibilities to address the other mentioned aspects of sustainability, such as equity. The energy literature is firmly embedded in a perspective of reducing and controlling. Weisz and Steinberger [32] argued that energy access is widely overlooked in energy metabolism studies. Therefore, interventions in areas that still lack access to energy might involve increasing inflows or shifting the energy carrier within a certain flow in order to provide more reliable, affordable, or efficient energy services. The concept of a sustainable energy system should go beyond quantifying carbon emissions and reducing energy flows [33]. Brunner’s [34] call to reshape flows rather than to reduce or control once again arises, and the energy metabolism literature can benefit from this perspective, as reshaping will allow for increased flows or a change in energy carriers where necessary.
Another gap in the literature on urban energy metabolism is that most of these studies were done at the city level, taking a top–down approach using national data, thereby disregarding the dynamics of space and time within a city [20]. This study addresses this gap by focusing on household energy metabolism, given the calls in Musango et al. [11], for conducting bottom-up research in cities in order to account for spatio-temporal dynamics.
Cities exist in various structural and societal scales and levels [3,11,35]. Barrera et al. [3] provided a useful representation of the levels within the energy system, distinguishing between the macro, meso, aggregated, and micro levels. Each of these levels can then be divided into behavioral and structural categories. Table 1 provides more detail.

Table 1.
Levels of organization of energy systems.
As Table 1 shows, the smallest scale of the energy system can be understood as buildings, or houses. On the behavioral level, it specifies the household as the smallest scale, which indicates a difference between a house and a household. However, the smallest scale of a city is the individual. Moll et al. [36] and Biesiot and Noorman [37] argued that while individuals perform different consumer activities, these are mostly focused within the household, and therefore the household, not the individual, is the smallest unit. In terms of energy consumption, this paper views the household as the smallest unit, as energy consumption within the household contributes to services that are shared between the individuals within. Furthermore, the household is a standardized unit in metabolic study, and the majority of energy consumption studies present their data for the household as a whole.
There exists no clear definition of a household energy metabolism. However, the literature provides definitions of household metabolism, from which a definition for energy in particular can be inferred. The most basic definition of household metabolism is “the integral patterns of natural resources flowing into and out of households” [37]. Donato et al. [38] provided further detail by defining household metabolism as the biophysical assessment of households from the point of view of raw materials, energy carriers, and water required, and emissions and wastes resulting from household consumption patterns. The inputs are further categorized in direct inputs of energy (electricity, heat, and vehicle fluids) and material, and indirect inputs of economic goods and services.
Based on the above, a household energy metabolism can be understood as the process by which energy flows are sourced and delivered through various carriers, which are conveyed through the house to service a household’s direct and indirect energy requirements, and result in waste or emissions. Through-flows are equally important to inflows and outflows, justifying the reference to through-flows in the household energy metabolism definition.
A brief distinction between direct and indirect energy consumption in the household is needed, as total household energy requirements include both. Direct energy is related to the energy consumed within the household and includes energy for space heating, water heating, cooking, lighting, and electronics, while indirect energy is used for the production, transportation, and disposal of goods and services consumed by the inhabitants of the house [5,7,36]. While Benders et al. [7] indicate that the majority of household energy consumption research includes only direct energy, the case for including indirect energy has strengthened significantly, and other scholars have considered the total household energy to include indirect consumption [3,36,38].
Existing household metabolism assessments are mostly embedded in a sustainable development approach. However, they vary considerably with regard to the resources studied. Both Moll et al. [36] and Donato et al. [38] identified intervention points for making the household more sustainable, but the former addresses total household energy requirements, while the latter reviewed a body of household metabolism research papers, including both energy and material resources. Yang et al. [39] and Biesiot and Noorman [37] focused on the environmental effects of household resource consumption with a strong focus on greenhouse gas emissions. The former analyzes emissions from energy, material, food, and waste, while the latter is interested only in total energy consumption. Frostell et al. [40] also studied total household energy requirements, but went beyond accounting to find ways of changing the energy consumption behavior. Within this variance exists a strong focus to measure the emissions impact of households, whether this pertains to the energy consumption alone or a broader study of household resource requirements [38].
In their literature review, Donato et al. [38] argued that the methods for conducting household metabolism assessments have not yet reached maturity, and only provided a review of its status. When considering the diversity in approaches to the household’s resources, it is understandable that most of the studies reviewed use hybrid methods. Moll et al. [36] and Biesiot and Noorman [37] used a combination of input–output analysis and process analysis to account for the complex nature of quantifying indirect energy consumption. Biesiot and Noorman [37] outlined that the direct energy requirements can be determined by: (i) considering the money spent on energy, (ii) dividing this into energy activities, (iii) accounting for the energy requirements of these activities, and (iv) converting this energy into CO2 emissions. The framework is useful, as it provides a method to quantify various household activities in energy terms. The framework can be applied to different scenarios, thereby projected future energy consumption.
Top–down approaches dominate in household metabolism assessments. Biesiot and Noorman [37] and Yang et al. [39] acquired their data sets from national data and disaggregated it to the household level. Yang et al. [39] acquired supplementary data from household surveys. Both Moll et al. [36] and Donato et al. [38] argued for the need to undertake a bottom–up approach to assessing household metabolism. Moll et al. [36] found significant variances in consumption patterns between the countries they studied, and concluded that it is crucial to study different types of households before identifying intervention points. Biesiot and Noorman [37] shared a similar view that different households display different lifestyles, and therefore different consumption patterns. Therefore, a differential household energy metabolism approach is crucial in order to account of variances in consumption patterns, lifestyles, and countries or areas within specific cities.
In order to conduct a differential household energy metabolism assessment, reliable and accurate data is crucial [36]. Biesiot and Noorman [37] recommended collecting the following data sets before attempting a household energy metabolism assessment: (1) energy production and consumption data, (2) economic input–output matrices, (3) household budget surveys, and (4) goods and services price information.
The studies focusing specifically on direct household energy consumption fall mostly outside of the urban metabolism field, but prove useful in identifying methods for collecting bottom–up data. Smart meters in households are proving to be a very effective and reliable way of collecting quantitative energy consumption data, as they account for exact consumption [41,42,43]. Studies that do not utilize smart meters often measure electricity consumption using utility bills [15,44]. Neither one of these approaches are appropriate for a study on direct energy consumption across a range of income groups and energy carriers, as an approach is needed that accounts for the different energy sources that a household may access, which is not depicted in smart meter data. While smart meters are excellent for tracking direct electricity consumption, they do not indicate exactly how this electricity is used in the house—for example, which appliances it services. A holistic understanding of household energy consumption means examining how multiple carriers feed into a variety of services accessed.
Existing household energy metabolism assessments account for the total energy requirements and total emissions. Limited studies have explored how energy flows into and through the household [37,45]. To study energy through-flows, the concept of energy services is useful. Both Sovacool [45] and Barrera et al. [3] advocated for household energy consumption studies to address services. Barrera et al. [3] indicate that the usefulness of viewing energy flows as services is due to the simplicity in translating the energy activities performed in a household, thereby making explicit what the individuals in a household choose to consume. It relates energy consumption to activities, which is easier for consumers to comprehend than referring to the amounts of Joules, kilowatt-hours, or liters of carriers consumed. In this way, intervention points become more tangible or accessible to the individual.
The main energy services within the household across different regions are similar. Based on work in the United States of America (USA) and Western Europe, Abrahamse et al. [4] developed an energy service hierarchy and suggested that space heating is the highest energy consuming service, followed by water heating, refrigeration, lighting, cooking, and finally space cooling. Sovacool [45] examined middle-income households from a broad range of countries and suggested that the primary energy services (in order) are space heating, water heating, cooking, appliances, and lighting. Kwak et al. [46] studies North Korea, and found that space heating and space cooling were major contributors to energy consumption due to the country’s four distinct seasons. In Finland, which experiences colder weather than most countries, space heating is the primary energy service [47].
In contrast to hierarchies developed by country, studies that compare energy services between low-income and high-income households have observed differing energy hierarchies. Sovacool [45] found that the energy in low-income households predominantly service lighting and cooking, while other surveys also include hot water, television, and radios. A study on energy services in rural African regions listed cooking, lighting, and water heating as primary energy services [10]. Offering an interesting contrast is the types of additional energy services found in high-income households: swimming in heated swimming pools or cooking with the television on are common findings [45]. This once again stresses the need for a differential household energy metabolism assessment in order to understand whether households in the same city may appear strikingly different when their energy inflows and through-flows are analyzed.
Sovacool [45] stressed that services also make it possible to identify the level of access of the household by a proposing an energy ladder. This energy ladder differs from the traditional energy ladder, which focuses only on carriers, and suggests that households transition to more efficient fuel types as their economic situation improves [48]. Sovacool’s [45] energy ladder includes three drivers to be applied to the various steps of the ladder: satisfying subsistence needs; convenience, comfort and cleanliness; and conspicuous consumption [45].
The basic energy carriers for a large number of households around the world are fairly consistent. Sovacool [45] identified electricity, natural gas, coal, liquefied petroleum gas, kerosene, and fuel oil, with electricity being the most dominant energy carrier. However, as with differences in service between low-income and high-income households, subsistence households may demonstrate the widest range of energy carriers. Figure 2 conceptualizes the energy ladder and household energy services of various income groups according to Sovacool [45]. Households driven by subsistence only can be regarded as not having sufficient access to energy.
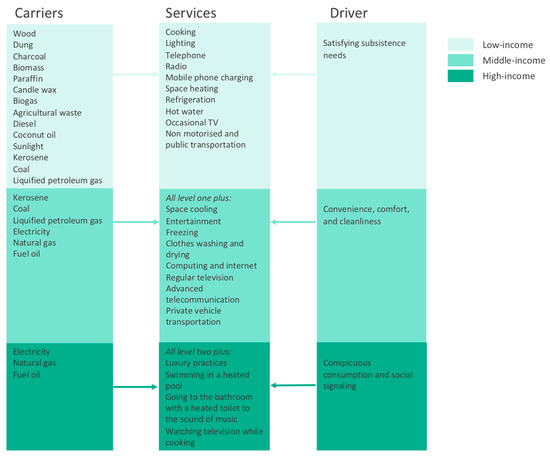
Figure 2.
Household energy ladder, adapted. Source: Adapted from Sovacool [45].
A useful way to look at energy access is to consider the concepts of ‘energy poverty’, ‘fuel poverty’, and ‘energy vulnerability’. All of these are conceptualizations that aim at identifying the group lowest on the energy ladder, but they differ quite significantly. Energy poverty is a term that is typically used to refer to inadequate energy access in the Global South, and links to the wider relationship between energy and development [49]. Fuel poverty and energy vulnerability refer to people typically in the Global North who have access to energy, but cannot afford to purchase sufficient amounts [49,50,51]. The difference between the two is that energy poverty is a state of being, while energy vulnerability can change according to external factors such as the dwelling quality, energy costs, and stability of household income [51]. Bouzarovski and Petrova [49] categorize all three terms under the umbrella term of ‘domestic energy deprivation’.
It is essential to consider energy in terms of drivers rather than a state of being, as it provides a clear pathway for improving energy security, which is important especially in the Global South, where energy access is a concern. Rather than containing the household in a negative state of being, the energy ladder creates a conceptualization of being able to climb up to a position in which energy consumption ceases being driven by subsistence and starts being driven by comfort, cleanliness, and convenience.
To achieve a more sustainable energy system may in some cases mean changing the energy carrier. Camara et al. [52] explicitly stated the importance of addressing the forms in which low-income households access energy, as a change in energy carrier could result in higher energy efficiency. Therefore, these households could climb to the second level of the energy ladder without experiencing an increase in energy spending. Examples of key intervention points in the Global South are improved cook stoves and cleaner fuel, such as a transition away from solid fuels and paraffin toward gas or electricity and improved wood burning stoves with, for example, chimneys [10,53,54,55,56,57]. This shows that improved access to modern energy carriers (such as electricity) is not the only possible intervention, but that in some cases, changing the fuel type from solid fuel to liquid petroleum gas or kerosene (widely considered to be modern fuel types) can also be beneficial [54]. Improved cook stoves and cleaner fuel is mostly discussed within the context of improving health; however, Williams et al. [57] and Maes and Verbist [55] discussed it in conjunction with air pollution, and Williams et al. [57] included hardships experienced by the women collecting solid fuels on foot. Given that a sustainable energy system must consider both social and environmental factors, the quality of cooking fuel or technology must necessarily reduce pollutants, as well as negative health impacts.
This paper proposes a method for examining the relationship between carriers, services, and drivers of household energy consumption. It forms part of a larger research project, which includes household consumption of food and water, and production of wastes, and a number of methods were performed together with co-researchers. However, this paper retains focus on the methods that relate only to household energy metabolism.
4. Materials and Methods
In order to develop a method for conducting a differential household energy metabolism assessment, this paper created two key conceptualizations. The first is that of Cape Town’s household energy flows in terms of carriers, services, and drivers, and the second illustrates the relationship between carriers and services in Cape Town households. In order to achieve this, various methods were used. Figure 3 illustrates the process and methods used to reach these conceptualizations.
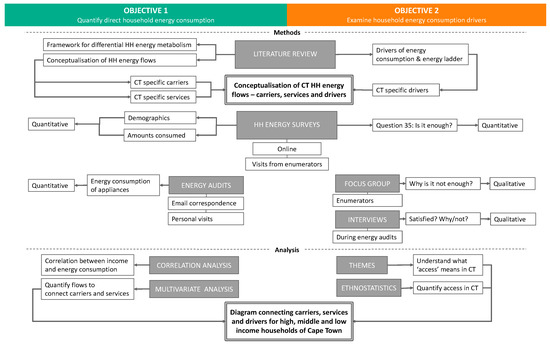
Figure 3.
Method conceptualization. Note: CT is Cape Town; HH is household.
Defining components of the energy system was essential in conceptualizing Cape Town’s household energy flows in terms of carriers, services, and drivers. However, since this energy system was created based on studies from the Global North, it was essential to adapt the carriers and services to correspond to the carriers and services accessed by the residents of Cape Town. This conceptualization is depicted in Figure 4. Based on the iterative process between the literature and the data collected, the paper made several changes to the services found in the literature:
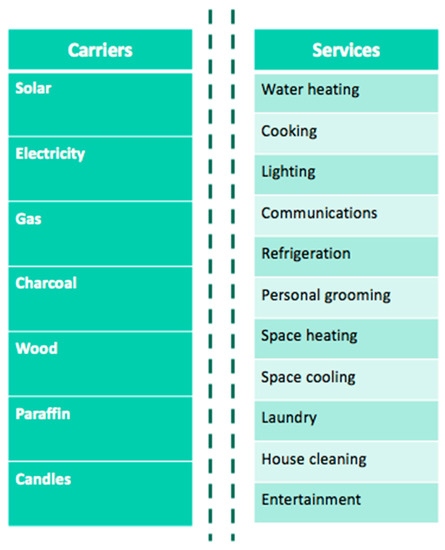
Figure 4.
Cape Town household energy carriers and services.
- The literature distinguishes between refrigeration and freezing, but this paper categorizes the two together as Refrigeration, as the majority of respondents own combination fridge/freezers, therefore requiring a single classification.
- The service of Personal grooming was added, as appliances such as hair dryers and electric shavers are a regular addition to households in Cape Town.
- The literature refers to ‘mobile phone charging’; however, as residents of Cape Town often use tablets for communication, mobile phones and tablets were grouped together as Communications.
- The service of House cleaning was added to account for the presence of dishwashers.
The services of computing and entertainment were grouped together as Entertainment, since many residents watch television or on-demand streaming services on their computers.
Following Sovacool [45], it was important to identify the drivers that are specific to the study. Since this paper’s focus was in households in Cape Town that still require sufficient access to energy, it was interested in the two drivers lowest on the energy ladder: how a household could move from ‘satisfying subsistence needs’ (not having sufficient energy access) to ‘convenience, comfort, and cleanliness’ (having sufficient access). For this reason, the top driver, namely ‘conspicuous consumption’, was omitted, as this focuses on the next level of the energy ladder (mostly associated with high-income households), and requires an in-depth study of its own.
Once the two energy drivers were selected, it was possible to add this information to the conceptualization of Cape Town’s household energy flows in order to create a conceptualization of Cape Town’s household energy flows—carriers, services, and drivers. This conceptualization is depicted in Figure 5. The services are reorganized according to the energy ladder in the literature, as well as the energy services and carriers applicable to Cape Town. The energy ladder specifies that low-income households are driven by satisfying subsistence needs, while middle-income households are driven by convenience, comfort, and cleanliness.
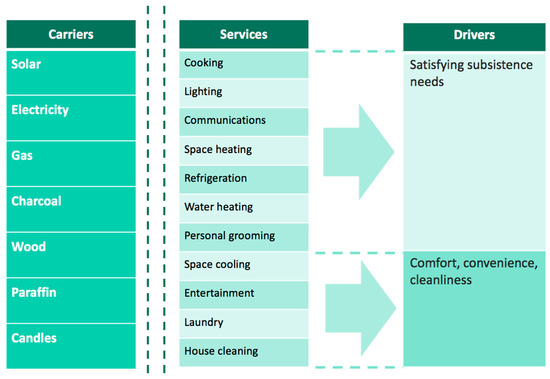
Figure 5.
Conceptualization of Cape Town’s household energy flows.
In order to understand the relationship between energy carriers and services, and thereby create the second conceptualization for Cape Town’s household energy flows, a household energy survey with questions about the use of 44 key household appliances was designed and distributed in Cape Town. The appliances were categorized twice: first by energy carrier, and second by the energy services detailed in Figure 5. After answering basic questions around household size, household income, and dwelling type, respondents were asked to explain the frequency with which they use the 44 appliances. The answers were presented in brackets: for example, 2–3 h per day or 4–5 times per week. This allowed respondents to answer the surveys without having the exact amounts and times on hand. While this is not as accurate as a metering exercise, it allows the opportunity to understand how energy is consumed in households that use more energy carriers than electricity (for which metering exercises are ideal). This survey was also designed in such a way to be easily understandable to all residents and to gain a broad idea of how many households consume energy, rather than a specific idea of a small sample of households.
An online version of the survey was aimed at reaching middle-income and high-income households. A group of enumerators visited low-income suburbs of Cape Town with hard copies of the surveys. The income groups were determined using the local income groups, as reflected in the South Africa Statistics.
The total number of households surveyed was 676, with only 391 surveys that were completed in full. Only 360 surveys that were useful for Cape Town were utilized in this paper. Responses came in from 56 of Cape Town’s 190 suburbs, with the most responses (66) received from the suburb of Khayelitsha. The enumerators surveyed a larger group of respondents than the online survey. However, some of their respondents earn middle or high incomes. This indicates that within suburbs such as Khayelitsha, Mfuleni, and Mitchell’s Plain reside many middle-income and high-income residents, and that enumerators visited these households, too.
5. Results
Figure 6 represents energy consumption based on activity for the household brackets using the average consumption per bracket. This consumption is divided into energy carriers (the left-hand side of each diagram) and energy services (the right-hand side of each diagram). Energy carriers indicate the total amount of activity for each carrier for each income bracket, while energy services indicate the end-use of energy for each bracket. This diagram provides a basic understanding of how the relationship between carriers and services changes with income. Figure 6a provides insight on the household level, and Figure 6b shows energy consumption per capita, which highlights the effect on average consumption as household size decreases and income increases.
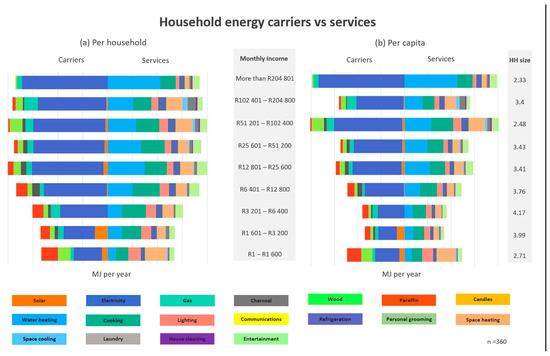
Figure 6.
Household energy consumption categorized into carriers and services.
Figure 6 provided a basic understanding of how the consumption of carriers and services changes with monthly income, indicating that the method applied can provide this overview for a city, especially where a huge discrepancy exists in income levels. The monthly income levels display the income brackets that were presented to the respondents when answering the survey. However, it was also important to also understand more closely the relationship between carriers, services, and drivers for each income group in order to make more specific interventions for sustainability and to create the second pivotal conceptualization, namely diagrams that connect the carriers, services, and drivers for various income groups. These results and intervention points are discussed in detail in Strydom et al. (58). This section discusses how these results were reached.
In order to understand the inflows and through-flows of energy for various income groups, the first step was to create pie charts for each income group depicting the average carriers and services for that income group. Figure 7 depicts these pie charts for a low-income household in Cape Town.
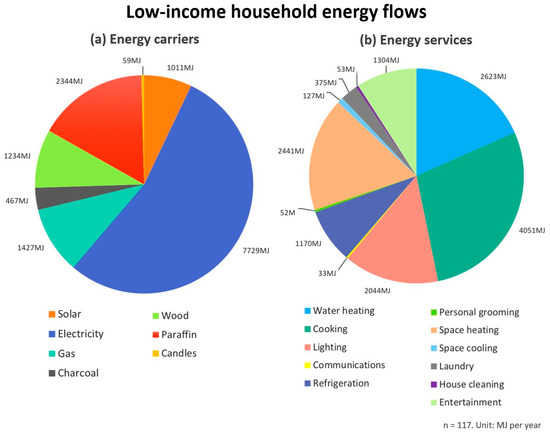
Figure 7.
Average carriers and services for low-income households in Cape Town Source: Strydom et al. [58].
While Figure 7 provides insight into the size of various carriers and services, and could do so for other cities where this method is applied, it does not yet clarify the relationship between carriers and services. In order to understand carriers and services in terms of inflows and through-flows, Sankey diagrams were useful. Figure 8 is a Sankey diagram connecting carriers and services for a low-income household in Cape Town.
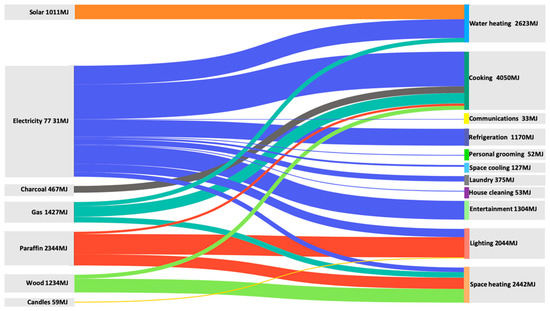
Figure 8.
Average energy flows for low-income households in Cape Town. Source: Strydom et al. [58].
Figure 8 makes it possible to understand the relationship between carriers and services of the studied city, thereby making apparent intervention points for sustainability. In the case of Cape Town, it becomes clear that paraffin contributes greatly to lighting in low-income households. However, as paraffin is a very inefficient carrier, one requires much more paraffin to light a house than one would should electricity be the main lighting source. This means that replacing paraffin with electric light bulbs in low-income households will provide the same amount of lighting, if not more, while using less energy. Further insights and intervention points for Cape Town are discussed in full in Strydom et al. [58]. This diagram illustrates the potential insights into the household energy consumption of a specific income group that can be gained when applying the discussed method to a city.
In order to create the final conceptualization for energy consumption, it is important to connect energy carriers and services with energy drivers. Figure 9 provides this conceptualization for low-income households in Cape Town.

Figure 9.
Energy drivers for low-income households. Source: Strydom et al. [58].
Figure 9 was created by totaling the energy services Sovacool [45] defined as satisfying subsistence needs and totaling the services defined as comfort, convenience, and cleanliness in another Sankey diagram. Creating such a diagram for each of the four income groups in Cape Town provided the opportunity for comparison and for understanding what drives energy consumption across income groups. The full results are discussed in Strydom et al. [58].
By viewing the two types of Sankey diagrams together, it is possible to arrive at a conceptualization of the relationship between carriers, services, and drivers for various income groups in cities across the world. Especially in the Global South, where low-income households consume a variety of energy carriers, it is possible to understand the importance of different energy carriers to fulfill different households’ needs. Once such an understanding of household energy consumption is reached, it is possible to identify different intervention points for different income groups based on these energy flows. It is also possible to understand the core driver for accessing energy. In low-income households in Cape Town, it is clear that residents simply aim to satisfy subsistence needs, but that certain services associated with comfort, convenience, and cleanliness are important to them. By comparing these findings across income groups in other cities, it is possible to know what drives energy consumption and consequently which energy services a city’s residents view as essential. With this knowledge, locally applicable intervention points for sustainability can be identified.
6. Conclusions
This paper reviewed the literature on urban metabolism, urban energy metabolism, and household energy metabolism to identify a conceptual framework with which to examine the inflows and through-flows of direct energy at the household level. The framework was further expanded to include drivers of energy consumption as they correlate with the services accessed in order to understand the level of access experienced in the household. It further examined the relationship between energy carriers and energy services based on income in Cape Town. The results show that both pie charts and Sankey diagrams provide the means to identify intervention points for sustainability.
This can in the future be applied to other cities where data is scarce and where residents access a range of energy carriers, not just electricity, as current studies assessing household energy consumption focus predominantly on electricity use and take national or city-level data to speak for household level energy consumption. It is flexible in that the carriers and services can be adapted depending the city studied. Since this study was conducted in a city that has both formal and informal housing, it also shows that the method can be used for both settings and for comparing results across formal and informal settlements. By using this method, it is possible to gain insight into the energy inflows and through-flows of households across income groups and dwelling types, and therefore provides a means to collect bottom–up data at the city level for a high-resolution image of the current state of energy consumption in our cities.
Author Contributions
Writing—original draft, conceptualization A.S.; methodology and data curation, A.S. and P.K.C.; supervision, writing, review and editing, J.K.M. and P.K.C.
Funding
This research was funded by the Centre for Renewable and Sustainable Energy Studies (CRSES), Stellenbosch, South Africa; and the National Research Foundation, South Africa, grant number 99103.
Conflicts of Interest
The authors declare no conflict of interest.
References
- Barragán-Escandón, A.; Terrados-Cepeda, J.; Zalamea-León, E. The role of renewable energy in the promotion of circular urban metabolism. Sustainability 2017, 9, 2341. [Google Scholar] [CrossRef]
- Grubler, A.; Bai, X.; Buettner, T.; Dhakal, S.; Fisk, D.; Ichinose, T.; Keirstead, J.; Sammer, G.; Satterthwaite, D.; Schulz, N. Urban Energy Systems; Cambridge University Press: Cambridge, UK; New York, NY, USA, 2012; pp. 1307–1400. [Google Scholar]
- Barrera, P.P.; Carreón, J.R.; de Boer, H.J. A multi-level framework for metabolism in urban energy systems from an ecological perspective. Resour. Conserv. Recycl. 2018, 132, 230–238. [Google Scholar] [CrossRef]
- Abrahamse, W.; Steg, L.; Vlek, C.; Rothengatter, T. A review of intervention studies aimed at household energy conservation. J. Environ. Psychol. 2005, 25, 273–291. [Google Scholar] [CrossRef]
- Abrahamse, W.; Steg, L.; Vlek, C.; Rothengatter, T. The effect of tailored information, goal setting, and tailored feedback on household energy use, energy-related behaviors, and behavioral antecedents. J. Environ. Psychol. 2007, 27, 265–276. [Google Scholar] [CrossRef]
- Banfi, S.; Farsi, M.; Filippini, M.; Jakob, M. Willingness to pay for energy-saving measures in residential buildings. Energy Econ. 2008, 30, 503–516. [Google Scholar] [CrossRef]
- Benders, R.M.J.; Kok, R.; Moll, H.C.; Wiersma, G.; Noorman, K.J. New approaches for household energy conservation-In search of personal household energy budgets and energy reduction options. Energy Policy 2006, 34, 3612–3622. [Google Scholar] [CrossRef]
- Kennedy, C.; Cuddihy, J.; Engel-yan, J. The Changing Metabolism of Cities. J. Ind. Ecol. 2007, 11, 43–59. [Google Scholar] [CrossRef]
- McCalley, L.T.; Midden, C.J.H. Energy conservation through product-integrated feedback: The roles of goal-setting and social orientation. J. Econ. Psychol. 2002, 23, 589–603. [Google Scholar] [CrossRef]
- Howells, M.I.; Alfstad, T.; Victor, D.G.; Goldstein, G.; Remme, U. A model of household energy services in a low-income rural African village. Energy Policy 2005, 33, 1833–1851. [Google Scholar] [CrossRef]
- Musango, J.K.; Currie, P.; Robinson, B. Urban Metabolism for Resource-Efficient Cities: From Theory to Implementation; UN Environment: Paris, France, 2017; Available online: https://resourceefficientcities.org/wp-content/uploads/2017/09/Urban-Metabolism-for-Resource-Efficient-Cities.pdf (accessed on 22 August 2019).
- Currie, P.K.; Musango, J.K.; May, N.D. Urban metabolism: A review with reference to Cape Town. Cities 2017, 70, 91–110. [Google Scholar] [CrossRef]
- Thomson, G.; Newman, P. Urban fabrics and urban metabolism—From sustainable to regenerative cities. Resour. Conserv. Recycl. 2018, 132, 218–229. [Google Scholar] [CrossRef]
- Currie, P.K.; Musango, J.K. African Urbanization: Assimilating Urban Metabolism into Sustainability Discourse and Practice. J. Ind. Ecol. 2016, 21, 1262–1276. [Google Scholar] [CrossRef]
- Gouveia, J.P.; Seixas, J. Unraveling electricity consumption profiles in households through clusters: Combining smart meters and door-to-door surveys. Energy Build. 2016, 116, 666–676. [Google Scholar] [CrossRef]
- Zhang, Y.; Yang, Z.; Yu, X. Urban Metabolism: A Review of Current Knowledge and Directions for Future Study. Environ. Sci. Technol. 2015, 49, 11247–11263. [Google Scholar] [CrossRef] [PubMed]
- Salvini, P.; Miller, E.J. ILUTE: An Operational Prototype of a Comprehensive Microsimulation Model of Urban Systems. Netw. Spat. Econ. 2005, 5, 217–234. [Google Scholar] [CrossRef]
- Mostafavi, N.; Farzinmoghadam, M.; Hoque, S. A framework for integrated urban metabolism analysis tool (IUMAT). Build. Environ. 2014, 82, 702–712. [Google Scholar] [CrossRef]
- Patterson, Z.; Bierlaire, M. Development of Prototype Urbansim Models. Environ. Plan. B Plan. Des. 2010, 37, 344–366. [Google Scholar] [CrossRef]
- Carreón, J.R.; Worrell, E. Urban energy systems within the transition to sustainable development. A research agenda for urban metabolism. Resour. Conserv. Recycl. 2018, 132, 258–266. [Google Scholar] [CrossRef]
- Voskamp, I.M.; Spiller, M.; Stremke, S.; Bregt, A.K.; Vreugdenhil, C.; Rijnaarts, H.H.M. Space-time information analysis for resource-conscious urban planning and design: A stakeholder based identification of urban metabolism data gaps. Resour. Conserv. Recycl. 2018, 128, 516–525. [Google Scholar] [CrossRef]
- Li, H.; Kwan, M.-P. Advancing analytical methods for urban metabolism studies. Resour. Conserv. Recycl. 2018, 132, 239–245. [Google Scholar] [CrossRef]
- Lederer, J.; Kral, U. Theodor Weyl: A pioneer of urban metabolism studies. J. Ind. Ecol. 2015, 19, 695–702. [Google Scholar] [CrossRef]
- Kennedy, C.; Pincetl, S.; Bunje, P. The study of urban metabolism and its applications to urban planning and design. Environ. Pollut. 2011, 159, 1965–1973. [Google Scholar] [CrossRef] [PubMed]
- Currie, P.; Lay-Sleeper, E.; Fernández, J.E.; Kim, J.; Musango, J.K. Towards Urban Resource Flow Estimates in Data Scarce Environments: The Case of African Cities. J. Environ. Prot. 2015, 6, 1066–1083. [Google Scholar] [CrossRef]
- Zhang, Y.; Li, S.; Fath, B.D.; Yang, Z.; Yang, N. Analysis of an urban energy metabolic system: Comparison of simple and complex model results. Ecol. Model. 2011, 223, 14–19. [Google Scholar] [CrossRef]
- Chen, S.; Chen, B. Modelling carbon-energy metabolism of cities: A systems approach. Energy Procedia 2016, 88, 31–37. [Google Scholar] [CrossRef][Green Version]
- Zhang, Y.; Yang, Z.; Fath, B.D.; Li, S. Ecological network analysis of an urban energy metabolic system: Model development, and a case study of four Chinese cities. Ecol. Model. 2010, 221, 1865–1879. [Google Scholar] [CrossRef]
- Bristow, D.N.; Kennedy, C.A. Urban metabolism and the energy stored in cities: Implications for resilience. J. Ind. Ecol. 2013, 17, 656–667. [Google Scholar] [CrossRef]
- Fell, M. Energy services: A conceptual review. Energy Res. Soc. Sci. 2017, 27, 129–140. [Google Scholar] [CrossRef]
- Zhang, Y.; Zheng, H.; Fath, B.D. Analysis of the energy metabolism of urban socioeconomic sectors and the associated carbon footprints: Model development and a case study for Beijing. Energy Policy 2014, 73, 540–551. [Google Scholar] [CrossRef]
- Weisz, H.; Steinberger, J.K. Reducing energy and material flows in cities. Environ. Sustain. 2010, 2, 185–192. [Google Scholar] [CrossRef]
- Leduc, W.R.W.A.; Van Kann, F.M.G. Spatial planning based on urban energy harvesting toward productive urban regions. J. Clean. Prod. 2013, 39, 180–190. [Google Scholar] [CrossRef]
- Brunner, P.H. Reshaping urban metabolism. J. Ind. Ecol. 2007, 11, 11–13. [Google Scholar] [CrossRef]
- Giampietro, M.; Mayumi, K. Multiple-scale integrated assessments of societal metabolism: Integrating biophysical and economic representations across scales. Popul. Environ. 2000, 22, 155–210. [Google Scholar] [CrossRef]
- Moll, H.C.; Noorman, K.J.; Kok, R.; Engström, R.; Throne-Holst, H.; Clark, C. Pursuing More Sustainable Consumption by Analyzing Household Metabolism in European Countries and Cities. J. Ind. Ecol. 2005, 9, 259–275. [Google Scholar] [CrossRef]
- Biesiot, W.; Noorman, K.J. Energy requirements of household consumption: A case study of The Netherlands. Ecol. Econ. 1999, 28, 367–383. [Google Scholar] [CrossRef]
- Di Donato, M.; Lomas, P.L.; Carpintero, Ó. Metabolism and environmental impacts of household consumption: A review on the assessment, methodology, and drivers. J. Ind. Ecol. 2015, 19, 904–916. [Google Scholar] [CrossRef]
- Yang, D.; Gao, L.; Xiao, L.; Wang, R. Cross-boundary environmental effects of urban household metabolism based on an urban spatial conceptual framework: A comparative case of Xiamen. J. Clean. Prod. 2012, 27, 1–10. [Google Scholar] [CrossRef]
- Frostell, B.M.; Sinha, R.; Assefa, G.; Olsson, L.E. Modeling both direct and indirect environmental load of purchase decisions: A web-based tool addressing household metabolism. Environ. Model. Softw. 2015, 71, 138–147. [Google Scholar] [CrossRef]
- Elkhorchani, H.; Grayaa, K. Novel home energy management system using wireless communication technologies for carbon emission reduction within a smart grid. J. Clean. Prod. 2016, 135, 950–962. [Google Scholar] [CrossRef]
- Shakeri, M.; Shayestegan, M.; Abunima, H.; Reza, S.M.S.; Akhtaruzzaman, M.; Alamoud, A.R.M.; Sopian, K.; Amin, N. An intelligent system architecture in home energy management systems (HEMS) for efficient demand response in smart grid. Energy Build. 2017, 138, 154–164. [Google Scholar] [CrossRef]
- Zhou, B.; Li, W.; Chan, K.W.; Cao, Y.; Kuang, Y.; Liu, X.; Wang, X. Smart home energy management systems: Concept, configurations, and scheduling strategies. Renew. Sustain. Energy Rev. 2016, 61, 30–40. [Google Scholar] [CrossRef]
- De Almeida, A.; Fonseca, P.; Schlomann, B.; Feilberg, N. Characterization of the household electricity consumption in the EU, potential energy savings and specific policy recommendations. Energy Build. 2011, 43, 1884–1894. [Google Scholar] [CrossRef]
- Sovacool, B.K. Conceptualizing urban household energy use: Climbing the “Energy Services Ladder”. Energy Policy 2011, 39, 1659–1668. [Google Scholar] [CrossRef]
- Kwak, S.Y.; Yoo, S.H.; Kwak, S.J. Valuing energy-saving measures in residential buildings: A choice experiment study. Energy Policy 2010, 38, 673–677. [Google Scholar] [CrossRef]
- Salo, M.; Nissinen, A.; Lilja, R.; Olkanen, E.; O’Neill, M.; Uotinen, M. Tailored advice and services to enhance sustainable household consumption in Finland. J. Clean. Prod. 2016, 121, 200–207. [Google Scholar] [CrossRef]
- Kowsari, R.; Zerriffi, H. Three dimensional energy profile: A conceptual framework for assessing household energy use. Energy Policy 2011, 39, 7505–7517. [Google Scholar] [CrossRef]
- Bouzarovski, S.; Petrova, S. A global perspective on domestic energy deprivation: Overcoming the energy poverty-fuel poverty binary. Energy Res. Soc. Sci. 2015, 10, 31–40. [Google Scholar] [CrossRef]
- Gillard, R.; Snell, C.; Bevan, M. Advancing an energy justice perspective of fuel poverty: Household vulnerability and domestic retrofit policy in the United Kingdom. Energy Res. Soc. Sci. 2017, 29, 53–61. [Google Scholar] [CrossRef]
- Middlemiss, L.; Gillard, R. Fuel poverty from the bottom-up: Characterising household energy vulnerability through the lived experience of the fuel poor. Energy Res. Soc. Sci. 2015, 6, 146–154. [Google Scholar] [CrossRef]
- Camara, N.F.; Xu, D.; Binyet, E. Understanding household energy use, decision making and behaviour in Guinea-Conakry by applying behavioural economics. Renew. Sustain. Energy Rev. 2017, 79, 1380–1391. [Google Scholar] [CrossRef]
- Budya, H.; Yasir Arofat, M. Providing cleaner energy access in Indonesia through the megaproject of kerosene conversion to LPG. Energy Policy 2011, 39, 7575–7586. [Google Scholar] [CrossRef]
- Foell, W.; Pachauri, S.; Spreng, D.; Zerriffi, H. Household cooking fuels and technologies in developing economies. Energy Policy 2011, 39, 7487–7496. [Google Scholar] [CrossRef]
- Maes, W.H.; Verbist, B. Increasing the sustainability of household cooking in developing countries: Policy implications. Renew. Sustain. Energy Rev. 2012, 16, 4204–4221. [Google Scholar] [CrossRef]
- Parikh, J. Hardships and health impacts on women due to traditional cooking fuels: A case study of Himachal Pradesh, India. Energy Policy 2011, 39, 7587–7594. [Google Scholar] [CrossRef]
- Williams, K.N.; Northcross, A.L.; Graham, J.P. Health impacts of household energy use: Indicators of exposure to air pollution and other risks. Perspectives 2015, 93, 507–508. [Google Scholar] [CrossRef] [PubMed]
- Strydom, A.; Musango, J.K.; Currie, P.K. Connecting energy services, carriers and flows: rethinking household energy metabolism in Cape Town, South Africa. Energy Res. Soc. Sci. 2020, 60. [Google Scholar] [CrossRef]


© 2019 by the authors. Licensee MDPI, Basel, Switzerland. This article is an open access article distributed under the terms and conditions of the Creative Commons Attribution (CC BY) license (http://creativecommons.org/licenses/by/4.0/).