Abstract
Wind and solar PV have become the lowest-cost renewable alternatives and are expected to dominate the power supply matrix in many countries worldwide. However, wind and solar are inherently variable renewable energy sources (vRES) and their characteristics pose new challenges for power systems and for the transition to a renewable energy-based power supply. Using new options for the integration of high shares of vRES is therefore crucial. In order to assess these options, we model the expansion pathways of wind power and solar photovoltaics (solar PV) capacities and their impact on the renewable share in a case study for Germany. Therefore, a numerical optimization approach is applied on temporally resolved generation and consumption time series data to identify the most efficient and fastest capacity expansion pathways. In addition to conventional layouts of wind and solar PV, our model includes advanced, system-friendly technology layouts in combination with electric energy storage from existing pumped hydro storage as promising integration options. The results provide policy makers with useful insights for technology-specific capacity expansion as we identified potentials to reduce costs and infrastructural requirements in the form of power grids and electric energy storage, and to accelerate the transition to a fully renewable power sector.
1. Introduction
The rapid expansion of renewable energies worldwide has resulted in a steep increase in installed capacities in recent years. Wind and solar photovoltaics (solar PV) in particular have seen a significant increase in global installed capacities and have displaced conventional sources in terms of annually added capacities worldwide. Climate protection is one of the key drivers for renewables, and especially wind and solar PV have become cost-competitive in comparison to established non-renewable sources [1].
Despite this dynamic expansion of renewables, there are several challenges ahead, since climate protection aims call for an even faster transition to keep on track with greenhouse gases (GHG) emission reduction [2]. Wind and solar PV are variable renewable energy sources (vRES). These inherently volatile sources pose major challenges for their integration into the power supply system [3,4,5,6,7,8,9] and the transition to a fully renewable power supply system [10,11,12,13].
Approaches to integrate the growing capacities from vRES are therefore the focus of much research. For the technical integration of vRES, three important elements have been identified: (a) electric energy storage; (b) an optimized capacity mix of different vRES; and (c) the introduction of advanced technologies in wind and solar PV systems, also called system-friendly layouts of vRES.
Electric energy storage is regarded as a key element for the integration of vRES to address the volatility of vRES, to utilize excess energy (EE) and to balance supply and demand to maintain a secure power supply [14,15,16,17]. Nevertheless, new storage technologies face either technological or economic constraints and are still not available in the required TWh range. Mature, large-scale electric energy storage solutions such as pumped hydro storage (PHS) face limitations in the physical potential of many countries, as well as restrictions due to nature conservation. In fact, electric energy storage capacities have not kept pace with vRES expansion in recent years [6,11,18,19,20,21,22,23].
A second important option is the optimization of the capacity mix of wind and solar PV [7,12,24,25,26,27,28,29]. Optimizing their shares allows exploiting the complementary production patterns of wind and solar PV over various time scales, ranging from the apparent daily patterns of solar PV production to seasonal patterns for both wind and solar PV [25,30]. In contrast, achieving high shares of vRES using either wind or solar PV alone leads to higher variability in power supply and higher EE [29,31,32,33] for a set renewable share (REN share) target. EE itself is likewise associated with a decline in the marginal utility of additional vRES capacities, as the energy produced in times of EE is not substituting non-renewable energy sources [3,5,10,34]. With many countries pursuing REN strategies with annual capacity targets for specific REN technologies, optimal mixes of vRES can contribute to effectively attaining these targets. Tenders for new renewable generation capacity in many countries could, in principle, allow governing the future capacity mix through the expansion pathways for each REN technology. However, there is to date little knowledge about an effective pathway for wind and solar PV regarding REN shares to achieve future REN share goals.
A third option for the integration of vRES has been identified in technologically advanced wind energy converters (WEC) and solar PV systems. Advanced technologies entail WEC with increased hub heights and low specific power ratings compared to the rotor swept area (W/m2), as well as solar PV panels facing east or west instead of the traditionally south-facing panels in the northern hemisphere or north-facing panels in the southern hemisphere [35,36]. East-west-facing solar PV offers improved technical system integration compared to standard technology, especially when introduced in power systems with high shares of vRES [34,37,38]. The International Energy Agency (IEA) “Grid Integration of Variable Renewables” research project (GIVAR) published a report in 2014 [39] describing the contribution of advanced technologies in wind and solar PV to addressing the challenges associated with the expansion of significant vRES capacities. These “advanced technologies” [38] or “system-friendly” layouts of wind and solar PV installations [40] are important options for the improved integration of high shares of vRES into power systems [39,41,42,43].
Existing studies cover only one or two of the three selected options: either optimized generation mixes of vRES [11,28,44,45], the interplay of vRES with electric energy storage [15], or advanced technologies for future vRES-based power systems [38,40,46]. Among these, Killinger et al. [46] introduced advanced technology from solar PV with different azimuth and inclination angles and determined the optimal regional vRES mix regarding economic efficiency, environmental sustainability and the security of supply. This therefore covers a wide range of important options and targets. Nevertheless, the article does not include electric energy storage capacities or the expansion pathways towards the identified optimal mix from vRES. Becker et al. [28] investigated wind and solar PV build-up pathways for different regions in the United States. Their analysis covers pathways for the minimization of back-up energy as well as for economic cost. Central to the approach is the mismatch of vRES power production and power consumption. A variety of cost-minimal pathways were identified for the different regions, underlining that region-specific factors like the spatio-temporal potentials for vRES as well as power demand play an important role, meaning that the analysis has to be performed specifically for each region of interest. Unlike the approach presented in this article, two of the three identified options for the integration of vRES are not covered: storage (option a) and system-friendly technologies (option c). The incremental efficiency of every added capacity of wind and solar PV on the renewable share is likewise not directly addressed, as build-up pathways are calculated in dependence of REN shares, which are not directly linked to capacity expansion as REN shares are negatively affected by EE from vRES.
To overcome the identified limitations in the research for optimized pathways in vRES capacity expansion, the approach presented here examines the effect of all three options on the efficiency of vRES expansion pathways. This will allow identifying the most effective pathways to achieve future REN goals from an overall capacity and REN share point of view and will enable us to assess the performance of alternative configurations of vRES capacities and electric energy storage. Using capacity expansion as the basis and calculating the resulting REN share offers a direct linkage to renewable support schemes, as many countries implement technology-specific tenders that allow directly governing capacity expansion for every vRES technology.
The main objectives of this paper are therefore to (i) provide a broad picture of how wind and solar PV can be combined to achieve efficient pathways in capacity expansion to fulfill future REN targets, (ii) identify the impact of advanced technologies in wind and solar PV against baseline technology, and (iii) to investigate the impact of electric energy storage. Therefore, we developed an algorithm to assess the incremental expansion of wind and solar PV by its impact on renewable shares (REN shares). This is built on the vRES optimization model published in 2014 [38] and is extended to calculate a wide range of capacity combinations, including electric energy storage from PHS as well as the identification of efficient pathways in capacity expansion in wind and solar PV.
For our case study we selected Germany, as it is one of the countries that has already seen a large expansion of vRES since 2000, exceeding 36.2% in REN share in 2017 [47]. Renewables, excluding wind and solar, made up for 11.2% in power consumption in 2017, so that wind and solar PV will have to provide more than 85% for the transition to a 100% renewable power supply at current consumption levels. In combination with the implemented tenders for the expansion of wind and solar PV capacities, Germany is a very suitable case study region.
The paper is structured as follows: in Section 2 we describe the input data, the investigated technologies and the study cases. Section 3 provides details on the methods and modeling. The results of the study are presented in Section 4, followed by a discussion in Section 5 and our conclusions in Section 6.
2. Input Data, Technology and Study Cases
2.1. Input Data
We used hourly electricity feed-in (from onshore wind and solar PV, including capacity factors) and net load data (representing electricity demand) for the years 2012 to 2015 for Germany, provided by the Open Power System Data Platform [48]. Net load data was adjusted on an annual basis to comply with the governmental projections for power consumption of 535.4 TWh/a [49,50]. The normalized feed-in time series for wind and solar PV covers the variability in vRES production over a time period of four years, and are up-scaled in order to model the future expansion of vRES capacities [38].
2.2. Technology Options
In accordance with [38,39,40,51], advanced technologies or system-friendly layouts include technologically advanced WEC with low specific rated power and solar PV in a mixed setup of south, east and west-oriented systems.
2.2.1. Advanced and Baseline WECs
The technology options considered in this study included onshore WEC with low specific rated power which were developed for application in low wind regimes. In recent years, a decline in specific rated power per rotor swept area from values in the range of 380–520 W/m2 (baseline technology) to values well below 350 W/m2 (advanced technology) can be observed for new WEC models [38,40,43,52,53]. Larger rotor diameters and increased hub heights allow increasing the energy output per installed capacity in terms of full load hours (FLH) (this principal relation, called the Capacity Factor (CF), is another performance parameter. CF is defined as the ratio of the energy actually produced by an energy converter to the energy that could have been produced if the converter ran at its rated power over a given time period. For the period of one year, the CF can be converted to FLH by multiplying the dimensionless CF with the 8760 h of one year.). Legacy onshore WEC achieved only 1576 FLH per year on average in the 2012–2015 period according to the feed-in time series data, whereas advanced WEC enable almost double the FLH and accordingly productivity per installed capacity [54,55]. Furthermore, advanced WEC offer significant advantages in the reduction of EE generation and the required overall installed capacity to achieve set REN share goals along with reduced economic costs at high penetration rates [56,57].
Figure 1 provides an impression of the significant differences between baseline and advanced WEC based on a short period of registered wind speed data from a wind farm in Germany (a) and the effects on the annual duration curves (duration curves are created by ordering all hourly feed-in or RL values in a descending order. The highest value is located on the very left of the graph and the lowest value on the right side.) (b). It becomes apparent that although the two different WEC (Enercon E-70 and Nordex N-117) have comparable rated power of 2.3 to 2.4 MW, their temporal production characteristics (Figure 1a) and annual duration curves (Figure 1b) differ significantly, as advanced WEC deliver twice the energy per installed capacity (equivalent to the area under the curve in Figure 2b).
Figure 1.
Comparison of the time series for power production based on actual wind and performance data from a wind farm in Germany (a) and generalized feed-in duration curves for baseline and advanced wind energy converters (WEC) (b).
Figure 2.
Comparison of normalized baseline feed-in (PV(S) vs. modified advanced feed-in PV (E) and PV (W) installations over 24 h.
The modeling of the time series data for advanced WEC was performed according to [38] based on the registered time series of WEC feed-in in Germany. A scaling factor was iteratively determined so that the time series reach 3000. The applied modeling has been published and cross-checked [38,40,58] and a similar approach to modify feed-in time series is documented and used in the ENERGY Plan Simulation model [59].
2.2.2. Advanced and Baseline Solar PV
Advanced layouts in solar PV, especially an east or west azimuth angle of solar panels and solar PV systems, have been identified as an option to improve the integration of solar PV into the power system [39,60,61,62,63]. Solar PV modules in an east-west orientation show a positive effect on the reduction of EE as they enable a better coverage of temporal demand profiles [64] (Figure 2). With increased capacities of solar PV systems in a south-facing azimuth, instances of EE production rise at mid-day, while residual loads in the morning and evening hours remain unmet. Solar PV systems with fixed azimuth angles facing east (PV(E)) and west (PV(W)) shift the feed-in pattern towards morning PV(E) and evening PV(W) hours and therefore smooth feed-in profiles and reduce EE [65]. As a trade-off, these solar PV setups have slightly reduced FLH in comparison to south-facing setups that maximize energy production [35,36,61,66].
A composition of solar PV systems with an equal distribution of solar PV setups oriented south, east and west were selected for the modeling of advanced solar PV. Solar PV systems facing east PV(E) are modeled with feed-in one hour earlier and solar PV systems facing west PV(W) with feed-in delayed by one hour compared to south-oriented setups. East and west systems also have reduced FLHs of 869 compared to the 1000 FLHs assumed for baseline setups facing south PV(S) (see Figure 3).
Figure 3.
Illustration of the incremental evaluation of additional capacity from either wind or solar PV on the REN share surface plot with higher gradient for wind compared to solar PV (red: REN share delta solar PV, green REN share delta wind).
2.2.3. Electric Energy Storage
To implement the effect of electric energy storage [11,14] into the modeling, we included existing electric energy storage from pumped hydro storage (PHS) currently installed in Germany. For the modeling, we refered to the 9 gigawatt (GW) of PHS with a storage capacity of approximately 66 gigawatt hours (GWh) installed in Germany [14,50].
Other options for the integration of vRES, such as interconnectors for import and export or demand side management (DSM), [67] were not considered.
2.3. Study Cases
This study aims to determine efficient vRES development pathways for both “baseline” and “advanced” technologies and with and without electric energy storage from PHS. Therefore, we established four cases illustrating the respective options (Table 1).
Table 1.
Introduction of the four study cases.
For Cases B and BS, we used baseline or non-advanced setups from wind and solar PV, whereas in Cases A and AS we applied advanced setups [38]. Cases BS and AS also included the modeling of storage from PHS, so that EE production from wind and solar PV can be utilized and consequently contribute to achieving higher REN shares (see storage section).
The overall annual net electricity demand for Germany was set constant at the projected level of 535.4 TWh/a [50]. Other important factors for the integration of vRES into power supply systems, especially conventional Must-Run or other renewable energy sources (bioenergy, hydropower, geothermal), can be included but are not presented here [15,39,68,69,70], primarily because the focus of this study is on the inter-temporal patterns of demand and supply from vRES, and secondarily because the simplicity of the approach should be maintained to provide a better understanding of the basic interplay of vRES in power systems.
3. Methods
This study aims to investigate pathways for the effective capacity expansion of volatile renewable energy sources. As key indicators, we calculated the renewable energy share (REN share) and the cumulated negative RL, or simply EE. By comparing the indicators for different development pathways, we can identify efficient pathways in the sense of maximizing REN share per additionally installed capacity. All calculations were performed using MATLAB and all key components are presented in this section.
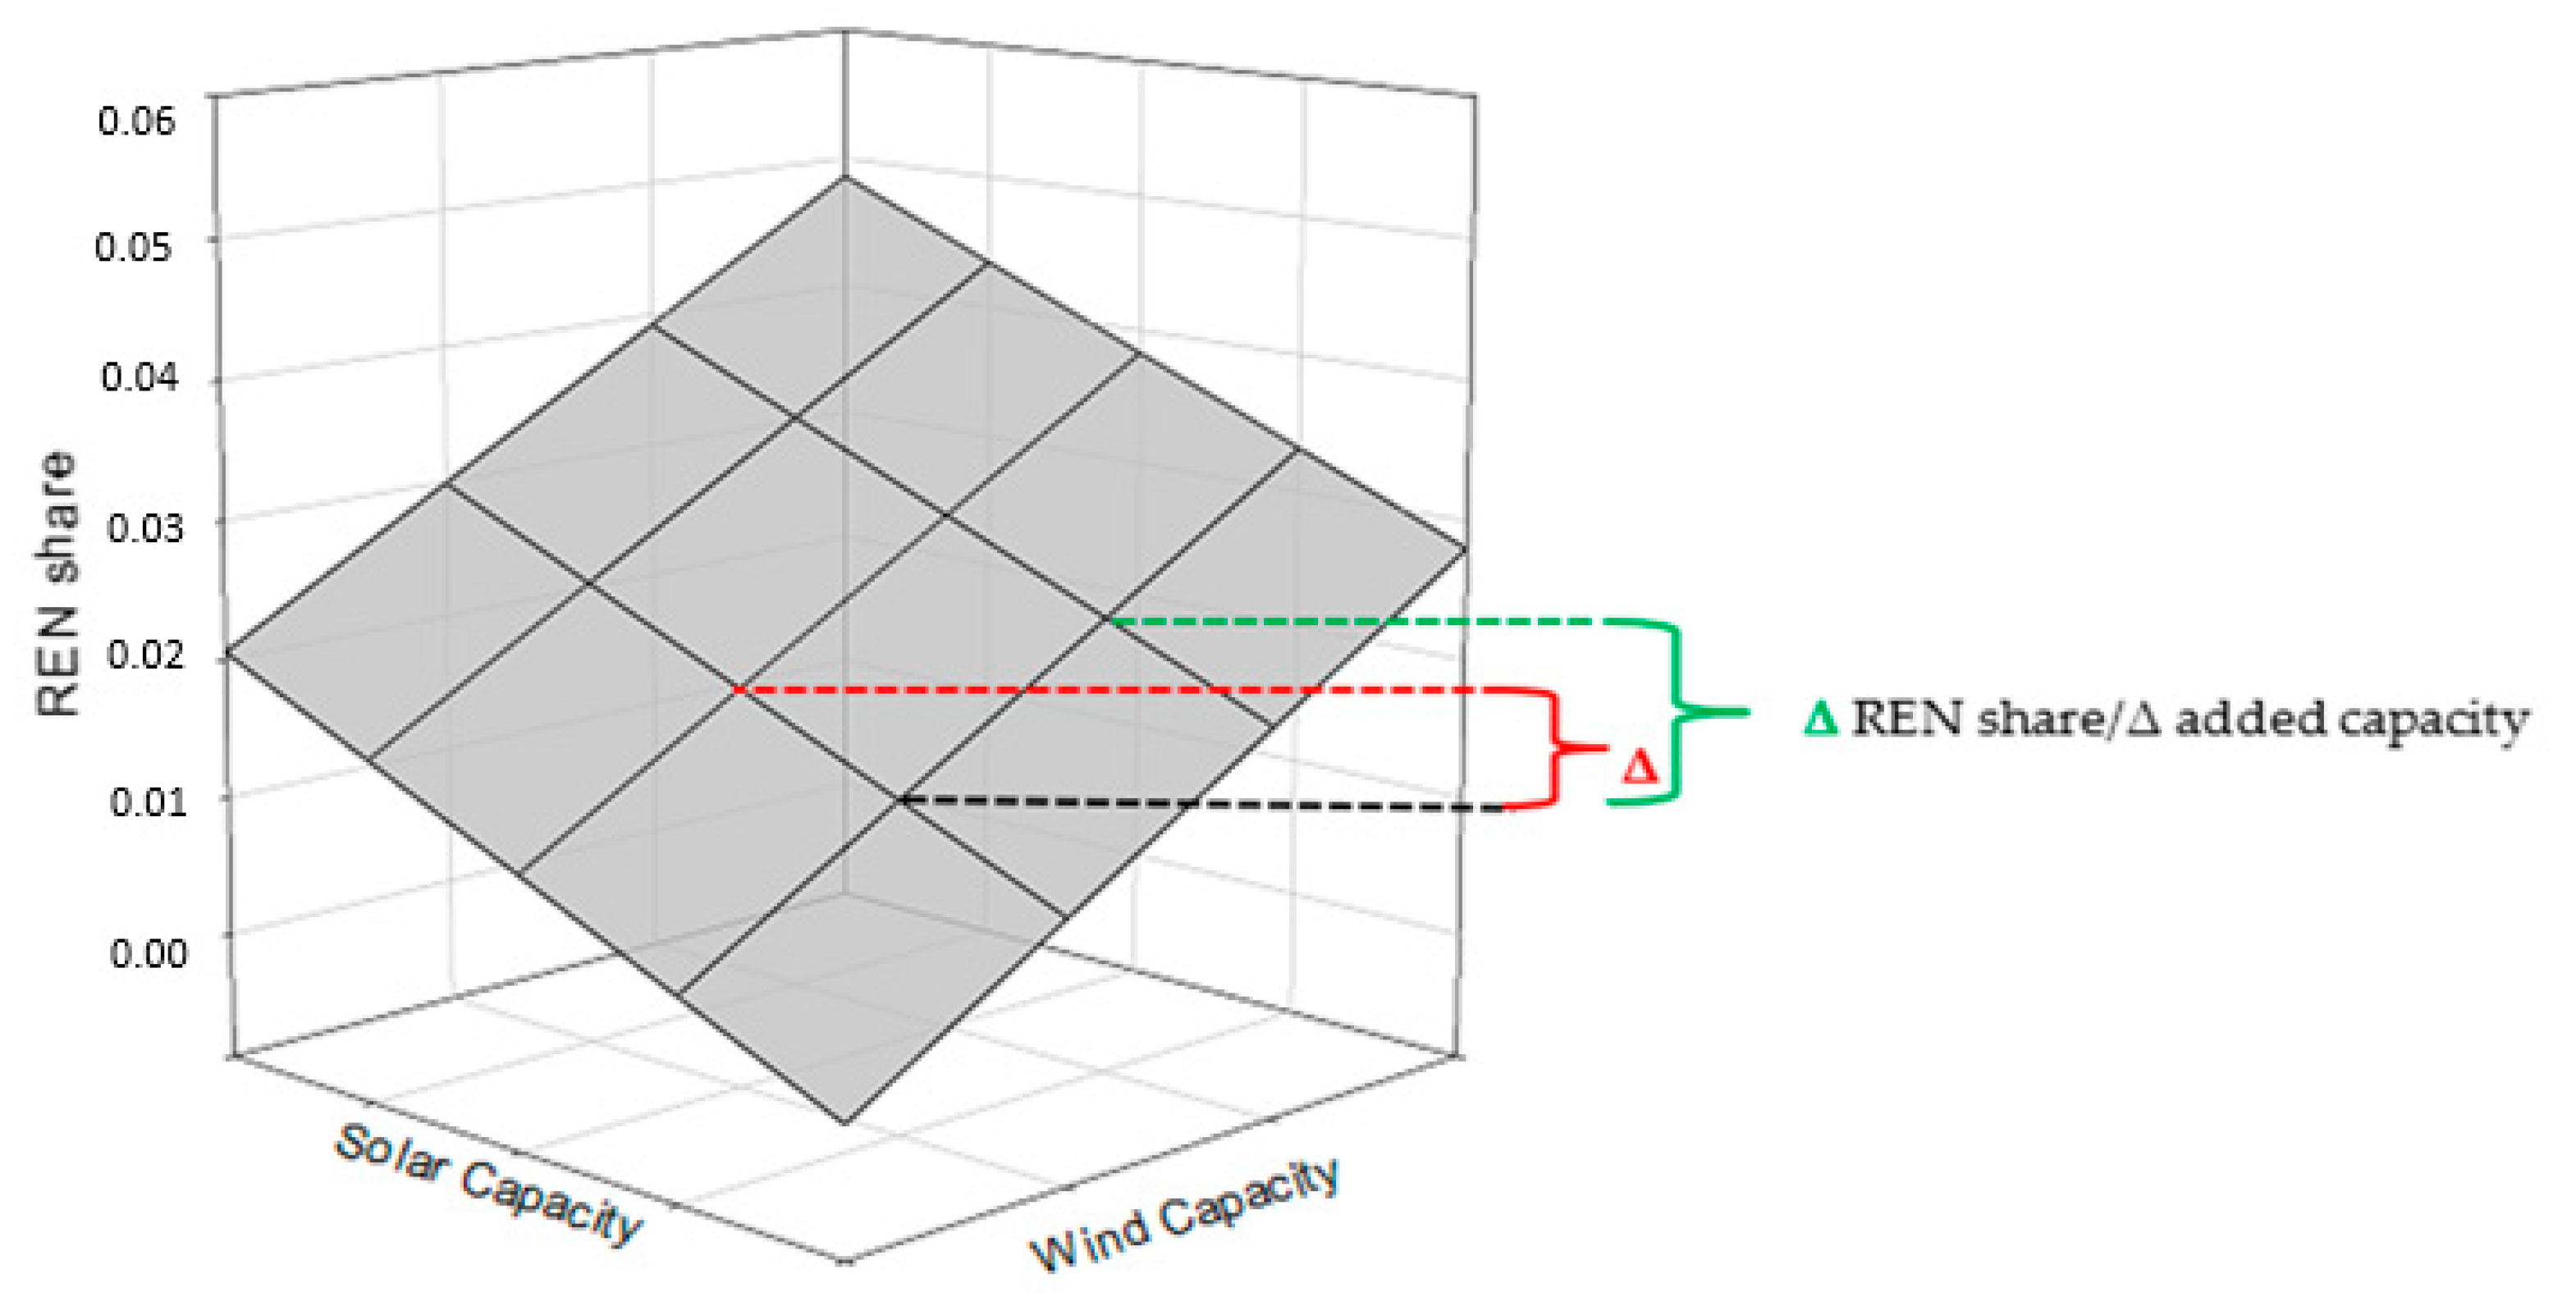
3.1. Calculation of Key Indicator Renewable Energy Share
The renewable energy share (REN share) is the amount of wind and solar PV energy generated and directly serving the power demand. EE from vRES does not contribute to the REN share in Cases B and A, whereas in Cases BS and AS we modeled electric energy storage from PHS as an integration infrastructure to make EE available to serve power demand and contribute to REN shares accordingly. The resulting direct REN share over the course of the 4-year time series was calculated for every capacity combination as:
where REN share = renewables share, Demandt = electricity demand, RL post = positive Residual Load (see Equation (3)), t = time step of 1 h in the 2012–2015 time-series data. RL neg or EE from vRES is not accounted for. The Residual Load (RL) is the result of the scaled feed-in time series data for wind and solar PV subtracted from the hourly time series data for demand:
where Windt and Solar PVt are the normalized time series data for wind and solar PV representing the feed-in of 3 GW installed capacity each, and scaling factors Swind and Ssolar PV range stepwise from 1 to 100 in order to reach from 3 to 300 GW in the calculation runs (see Section 2.3 Input Data). We selected a step size of 3 GW, which is roughly equivalent to the annual capacity expansion target for wind and solar PV in Germany.
Positive and negative RL is separately accounted for over the course of the 4-year time series data:
* or simply EE from vRES.
For the cases including electric energy storage (BS and AS), Equations (2)–(4) were extended so that the discharge from the combined electric energy storage is likewise subtracted from the hourly demand data and thus increases the REN share accordingly.
The variables used in Equations (5) and (6) are:
CPHS = energy stored in PHS. Further constraints were set for CPHS max = maximum storage capacity (=66 GWh), CPHS min = minimum storage capacity (=0 GWh), PPHS = maximum storage power in/output (=9 GW) and a single cycle efficiency η of 90% [16] in the model code.
We modeled electric energy storage to identify how it enables the use of EE production from vRES which is otherwise not contributing to the REN share and progressively curtailed. The modeled PHS stores any EE in times of negative RL from vRES, and discharges the stored energy in times of positive RL to contribute to the power supply whenever vRES are not fully meeting power demand. This presented technical modeling of PHS is deterministic, so that no uncertainties are introduced. Its performance was checked by a comparison to a spreadsheet calculation and proved to be adequate for this specific approach.
All four investigated cases cover all combinations of wind and solar PV installations ranging from 0 to 300 GW with a step size of 3 GW, resulting in a 100 × 100 array with 10,000 possible capacity combinations. The calculated results for REN shares and EE were visualized as a surface plot and are given in the Results section.
3.2. Algorithm for Efficient Pathways
To identify efficient pathways, we applied an incremental evaluation of the discrete values for a REN share compared to its neighboring value in the 100 × 100 array by calculating the discrete gradient between the neighboring REN share values on the surface (7):
where w is the indexed capacity from wind power in the 100 × 100 array and s is the indexed capacity from solar PV in the 100 × 100 array.
By dividing the increase in REN share through the 3 GW of additionally installed wind or solar PV, we calculated the resulting gradient per additionally installed capacity for every neighboring grid node in the REN share array (see Figure 3). Following the highest gradients from grid node to grid node forms a pathway in capacity expansion, which results in the highest increase in REN share per installed capacity of wind or solar PV. This way, the most efficient pathways in the calculated 100 × 100 REN share array are identified, beginning at an initial point and performing an incremental assessment and selection (this approach is, in principle, also applicable to more than two RES sources. The necessary higher dimensional space needed to integrate more RES sources in one graph would be less suited for a quick visual interpretation and is therefore not realized in this study). All resulting REN share surface plots in this study show a convex or concave surface, enabling this basic algorithm to identify efficient pathways.
The necessary discrete starting point can be, for example, a combination of 0 GW of wind and 0 GW of solar PV for no initial vRES deployment, or the capacity combination of 50.5 GW of wind and 42.4 GW of solar PV installed in Germany at the end of 2017 [47]. This overall approach was used to check the various combinations in vRES technologies and identify efficient pathways, as a higher value for the gradient leads to a more efficient capacity expansion pathway compared to a lower value. In Section 4.4 we will apply this algorithm to the calculated results to identify optimal pathways and we will present residual load duration curves (RLDC) of selected results to showcase the immense impact different pathways have on the structure of the residual load and especially on EE.
4. Results
In this section, we present the results calculated for all four cases: baseline and advanced technology, with and without pumped hydro storage. The results are presented through surface plots and tables.
4.1. Baseline Technology Case B
4.1.1. Key Indicator REN Share Case B
The resulting REN share surface plot of the various capacity combinations on the 100 × 100 array forms a bi-directional concave surface. Figure 4 shows a surface plot for the resulting REN share in Case B, with REN share plotted on the vertical axis and installed capacities of wind on the horizontal right hand axis and of solar PV capacities on the horizontal left hand axis.
Figure 4.
REN share surface plot for Case B, including the 2017 capacities from wind and solar PV (point marking), and the 50% REN share marking for various combinations resulting in a 50% REN share (mixed dotted-dashed line).
Starting either at a 0% REN share with 0 GW installed capacity for both wind and solar PV or with 50 GW of wind and 42 GW of solar PV which were installed in Germany at the end of 2017, every unit of capacity added results in an increase in REN share in the surface plot. Initially, additional wind capacities on the right hand axis of the surface plot result in a steeper increase in REN share compared to adding the same amount of solar PV capacities on the left hand axis. The initial gradient on the left hand axis, representing additional solar PV capacities, is lower (0.89% per 3 GW of solar PV) than the initial gradient for additional wind capacities (1.48% per 3 GW of wind). Furthermore, a sole solar PV deployment of 300 GW only achieves a maximum REN share of 36%, compared to the 62% for wind for the same amount of installed capacity. REN shares above 62% can only be achieved through a combination of both wind and solar PV. Overall, a declining gradient of the REN share for a sole deployment of either wind or solar becomes apparent in the surface plot, which forms a concave surface.
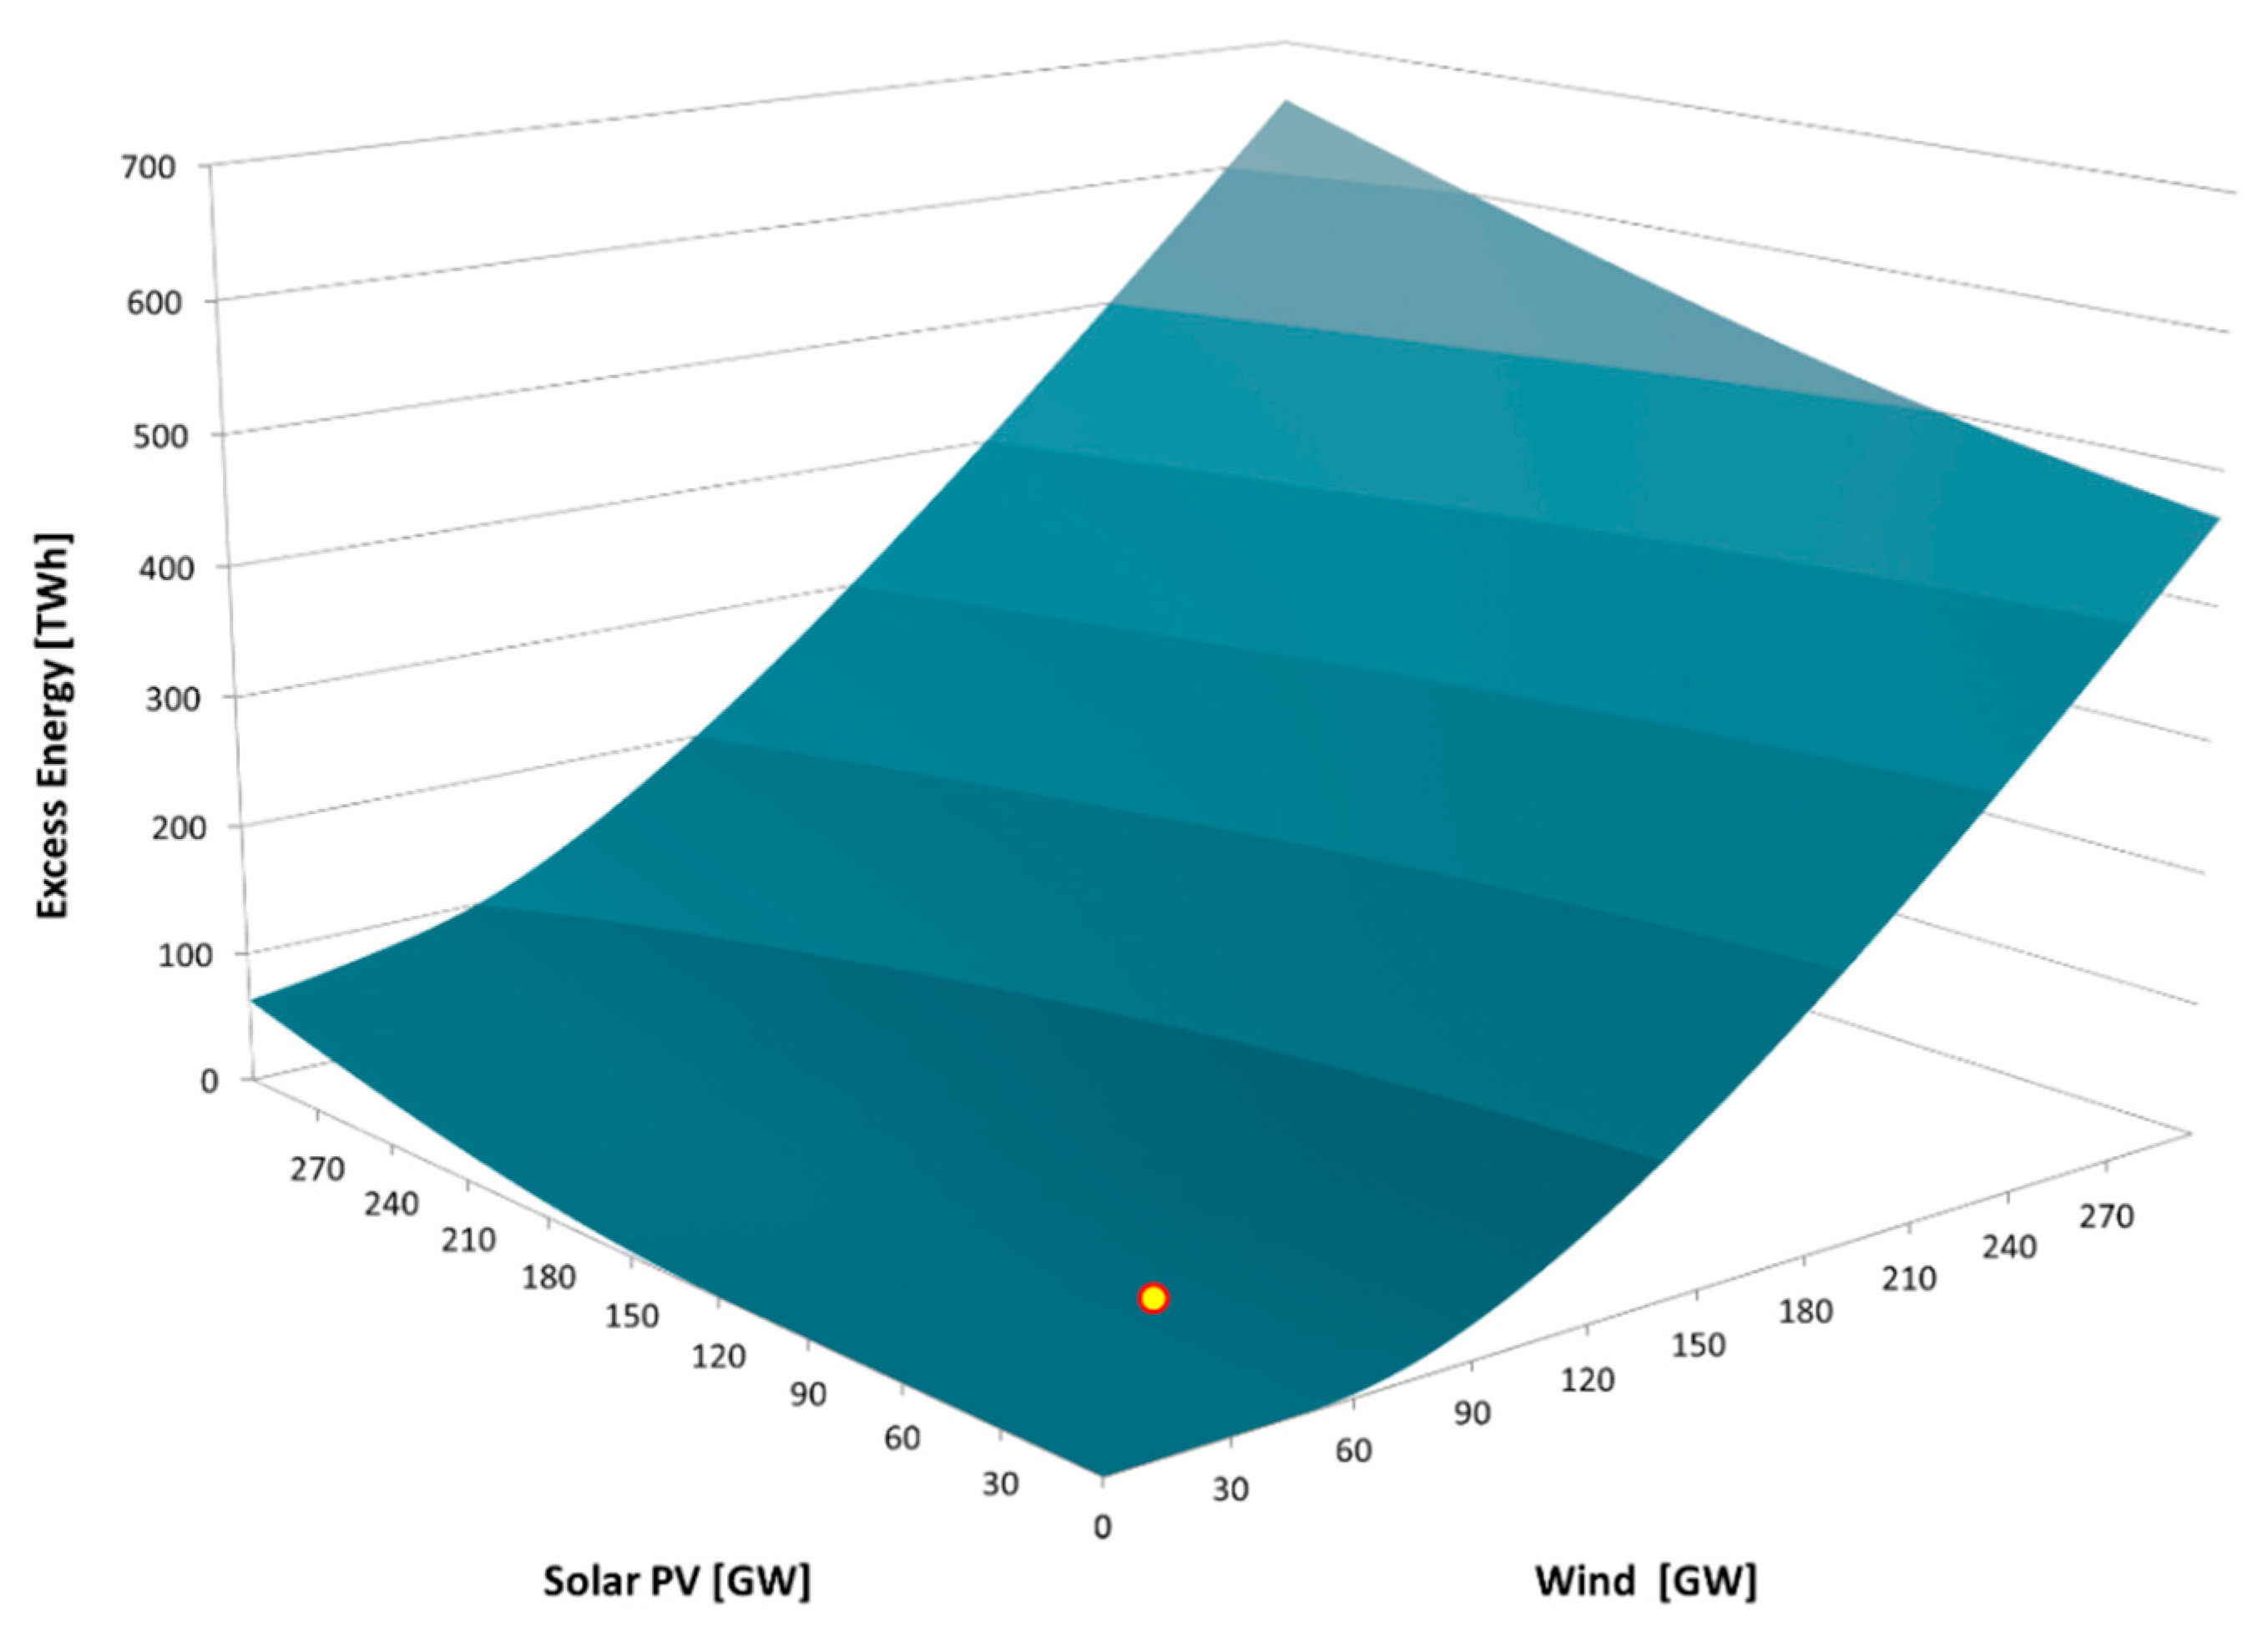
4.1.2. Key Indicator EE (Negative Residual Load) Case B
Figure 5 shows the development of EE production in Case B. EE is also presented as a surface plot and plotted on the vertical axis, with installed capacities of wind on the horizontal right hand axis and of solar PV capacities on the horizontal left hand axis.
Figure 5.
Excess energy (EE) surface plot Case B including the 2017 capacities from wind and solar PV (point marking).
After a threshold of roughly 20 GW from wind or solar is surpassed, a progressive production of EE is apparent in Figure 5. In contrast to the REN share surface plot in Figure 4, the EE surface plot forms a bi-directional convex surface. The convex surface of the progressive increase in EE is the reason for the concave surface of the REN share surface plot in Figure 4, as without electric energy storage EE does not contribute to serve the power demand and thus does not increase REN share.
Figure 6 demonstrates that EE is generated progressively when additional vRES capacities surpass a threshold of roughly 20 GW from wind or solar PV. This is the tipping point of the marginal improvement of additional capacities in the REN share plot given in Figure 5.
Figure 6.
REN share surface plot for Case A, including the 2017 capacities from wind and solar PV (point marking), and the 50% REN share marking for various combinations resulting in a 50% REN share (mixed dotted-dashed line).
4.2. Advanced Technology Case A
4.2.1. Key Indicator REN Share Case A
The corresponding surface plot for the advanced technology case (Figure 6) shows significant differences from the baseline REN share plot (Figure 4).
While advanced solar PV again reaches about 40% REN share in a sole deployment of 300 GW, additional capacities from advanced wind power boost REN shares faster than in the baseline case, and a sole deployment of 300 GW of wind pushes REN share above 80%. The initial gradient on the left hand axis for additional solar PV capacities is significantly lower (0.78% per 3 GW of solar PV) than the gradient for additional wind capacities (2.87% per 3 GW of wind). REN shares beyond 80% are only achieved by a combination of both wind and solar PV.
The results reflect the much higher energy production per installed capacity of wind compared to solar PV in the advanced technology case (3000 FLH from advanced wind compared to 1536 FLH in the baseline case; 869 FLH for advanced solar PV compared to 1000 FLH in the baseline case). As a consequence, it is possible to achieve higher REN shares with the same installed capacities using advanced technology in wind power.
4.2.2. Key Indicator EE (Negative Residual Load) Case A
The corresponding EE surface plot (Figure 7) indicates a much higher EE production compared to the baseline case (Figure 5), especially from advanced wind power along the right hand horizontal axis. However, the higher EE production does not contradict the greater effectiveness of advanced WEC from a REN share point of view, as shown in Figure 7.
Figure 7.
EE surface plot Case A including the 2017 capacities from wind and solar PV (point marking).
4.3. Cases BS and AS Including Electric Energy Storage from PHS
As described in Section 2.3, we modeled electric energy storage from PHS to identify its impact. The modeled storage enables the recovery of some of the EE from vRES, thus achieving higher REN shares from a given vRES capacity.
To visualize the results, we have chosen a surface plot showing only the differences in REN share between the cases with and without storage by subtracting the non-storage case from the storage case (and thus not providing any information about the absolute increase in REN share). The resulting differences surface plot (Figure 8) shows how storage boosts REN shares at different combinations of wind and solar PV capacities.

Figure 8.
Differences surface plot for REN share illustrating the additional REN share enabled by electric energy storage from pumped hydro storage (PHS); (a) for the differences between the baseline cases and (b) for the differences between the advanced technology cases.
Comparison with Cases Including Storage
For wind and solar PV capacities below the already identified threshold of 20 GW, no EE is produced and thus there is no effect from electric energy storage. For higher vRES capacities, the overall REN share increase from the modeled storage reaches up to 2.9% in the baseline case (BS) compared to the non-storage case B (Figure 8a). For high solar PV capacities, the addition of electric energy storage enables higher relative gains in REN share compared to the gains enabled for the same amount of wind capacities.
For the advanced technology case AS, a quite similar overall characteristic of the differences surface plot is obtained (Figure 8b). The higher productivity of advanced WEC leads to an earlier stabilization of the additional REN share.
The maximum additional improvement in REN share through PHS is about 2.9% at a 63% REN share provided by a wind capacity of 135 GW and a solar PV capacity of 300 GW (for the advanced technology case it is 2.8% additional REN share at 62% from 63 GW wind and 300 GW from solar PV). For lower and higher overall REN shares, this additional improvement is reduced as either less EE is available for storage or too much EE cannot be stored, either because of the limitations in installed power from PHS or storage capacity from PHS. This peak in additional improvement in REN share is therefore specific for each combination of power and storage capacity of PHS.
4.4. Efficient Pathways
Applying the algorithm for efficient pathways (see Section 3.2), the efficient capacity expansion from wind and solar can be identified and illustrated as pathways on the REN share surface plot. Efficient pathways starting from a zero wind and solar PV capacity combination are represented by the dashed red line in Figure 9 and Figure 10, and the pathway starting at the 2017 capacities in Germany (yellow dot) is represented by the yellow dotted line. Figure 9 and Figure 10 illustrate the identified pathways for cases BS and AS. Cases B and A without electric energy storage show only minor deviations below 3% in REN share (see Figure 9) and are therefore not depicted.
Figure 9.
REN share surface plot and efficient pathway for Case BS, including the efficient pathway starting at 0 GW wind and solar PV deployment (dashed line), the efficient pathway starting at the 2017 capacities from wind and solar PV (dotted line), and the 50% REN share marking for various combinations resulting in a 50% REN share (mixed dotted-dashed line).
Figure 10.
REN share surface plot and efficient pathway for Case AS, including the efficient pathway starting at 0 GW wind and solar PV deployment (dashed line), the efficient pathway starting at the 2017 capacities for wind and solar PV (dotted line), and the 50% REN share marking for various combinations resulting in a 50% REN share (mixed dotted-dashed line).
As apparent from Figure 9, for Case BS wind power was solely prioritized for REN share levels up to 47%. Solar PV capacity was added only before this threshold, after which an alteration of additional solar PV and wind forms the efficient pathway. When reaching the boundaries of the 100 × 100 array, the pathway for Case BS reaches 76% REN share, with wind power clearly dominating the capacity mix.
The same characteristics can be registered in Figure 10 for Case AS including advanced technology, although the first deployment of solar PV is pushed back to 76% of REN. When reaching the boundaries of the 100 × 100 array, the pathway calculated surpassed 87% REN share.
As shown in Table 2, the higher efficiency of wind power regarding the REN share per installed capacity is significant and is responsible for the initial dominance of wind power along the pathways. Efficient pathways do not include solar PV for REN shares below 47%. A comparison of Cases B and BS with Cases A and AS for a 50% REN share clearly shows that PHS can reduce the capacity requirement slightly but pushes the introduction of solar PV even further back along the efficient pathways. Interestingly, comparing baseline cases against advanced technology cases reveals that advanced wind allows for a reduction of almost 50% in required wind capacity.
Table 2.
Overview of selected results from the calculated pathways.
To complement the findings on pathways, we provide residual load duration curves (RLDC) in Figure 11 to add one additional aspect associated with efficient pathways and capacity mixes for vRES. The RLDC presented are directly derived from Equation (2) for three different wind and solar PV capacity combinations, each enabling a 50% REN share in Case B. The duration curves are created by ordering all hourly RL values in a descending order [14,29]. The highest RL value is located on the very left of the graph and the lowest value on the right side. Values below 0 GW indicate negative RL and the connected enclosed area between the RLDC and the zero line is equivalent to the EE produced.
Figure 11.
Residual load duration curve (RLDC) of different combinations of wind and solar PV all achieving a 50% REN share in Case B.
On the right side of the duration curve, where excess power is located below the 0 GW RL level, significant differences become apparent. For both solar PV and wind-dominated mixes (like the case for 60 GW wind and 300 GW of solar PV in a solar PV-dominated mix or 186 GW of wind and 15 GW of solar PV in a wind-dominated mix that is also part of the efficient pathway in Case B, see Table 2), higher maximum excess power can be identified and the enclosed area under the curve (equivalent to EE) is significantly enlarged compared to a balanced mix from wind and solar PV (108 GW wind and 114 GW solar PV). Especially for the solar PV-dominated capacity mix, high EE is generated with a three-fold higher maximum excess power.
As indicated by Ueckerdt [10], the RLDC continuously becomes steeper on the right hand side of the RLDC for high shares of wind and solar PV. Wind slightly covers peak load and increasingly contributes to cover mid and base load, but also contributes to EE production, whereas a solar PV-dominated capacity mix increases excess power and EE significantly.
The examination of RLDCs makes clear that different pathways have a huge impact on the magnitude and volume of the EE produced. It is possible to deduce the energetic and temporal structure of EE from the RLDC and identify how integration options like storage, demand side management or interconnectors have to be developed in order to make use of EE from vRES.
5. Discussion
The results provide a broader perspective on the interplay of wind, solar PV and power demand, the effect of electric energy storage form PHS, as well as pathways towards high REN shares in a case study for Germany. For power systems with a low initial REN penetration, wind power boosts REN share per installed capacity more than solar PV. This is primarily due to the higher productivity (full load hours) of wind compared to solar in the German case. Up to levels of installed wind capacity equivalent to more than 47% in REN share, wind power is more efficient from a required capacity perspective than solar PV, although significantly more EE is produced. Above this level, a mix from additional solar PV and wind shows a better performance regarding the boosting of REN shares compared to the sole addition of wind capacities. This is due to solar PV’s different temporal production profile, which complements wind power to better match temporal demand patterns [20,31,32,46,71]. An indicator for this complementariness is the two-fold bend (bi-directional) concave surface of all the REN share plots, as neither wind nor solar PV alone reaches very high values for REN share (e.g., >62% in Case B), so that a combination of both sources is required. Additional renewable sources, enlarged electric energy storage, and DSM are key requirements for a fully renewable power supply.
5.1. Impact of Advanced Technology
Advanced wind power allows a significant increase of REN shares compared to the baseline technology, as apparent from the sharp gradient of the REN share surface plot in Case A (Figure 5) compared to Case B (Figure 7). In contrast, advanced solar PV, although allowing for a better coverage of daily load profiles, falls short of delivering equal benefits regarding its contribution to REN shares. Consequently, advanced solar PV is pushed back even further along the efficient pathways compared to the baseline setups and is only effective after high REN share levels of 74% are reached in Case A. Even considering the fact that EE production from advanced wind is increased, advanced wind performs better than solar PV.
5.2. Effect of Electric Energy Storage
By adding storage capacities from PHS, EE from vRES can be recovered, which allows for higher REN shares compared to a progressive curtailment in the non-storage cases. The REN share differences plots showed a distinct effect of the modeled storage from PHS and that the interplay of PHS with solar PV performed better than in combination with wind power. The specific power-to-capacity ratio of the modeled PHS can be characterized as short-term electric energy storage, which is capable of integrating EE with a high frequency (several hours for a storage cycle) and high number of storage cycles but limited storage capacity. This characteristic of the existing PHS is ideal for the integration of the daily production pattern of solar PV. However, contrary to our expectation, PHS does not shift efficient pathways towards an earlier introduction of solar PV, as the generation from wind power also benefits from electric energy storage. Therefore, for all cases calculated, wind power dominated in the optimal pathways, especially in the advanced technology Cases A and AS.
5.3. Efficient Pathways
Efficient pathways for the capacity expansion of wind and solar PV show significant differences in their required overall capacities of wind and solar compared to all other possible pathways presented. The higher productivity of wind in terms of FLH in the case study region leads to wind-dominated pathways in the presented cases, regardless of whether PHS was included or not. Storage and especially advanced wind technology reduce the capacity requirement to achieve a 50% REN share, with an almost 50% reduction in overall required capacity from vRES (Table 2). As far as overall installed capacities are a criterion from an economic or technical point of view, wind power is identified as a preferable vRES source until substantial REN shares of at least 47% are reached, although it comes at the cost of increased EE production.
5.4. Transferability and Uncertainties
The presented findings cannot be fully generalized and directly transferred to other regions, as load and vRES complementarities are specific to individual regions [29,72]. For instance, the findings of Solomon [20] for the California state power system are affected by significant differences in demand and vRES production profiles. This makes it necessary to identify efficient combinations and pathways specifically for each region.
Since no field data for future cases of higher vRES shares in Germany are available, no direct comparison of the calculated outcomes is possible, but results are in line with the findings of relevant publications in the field regarding the effect of high vRES shares and the impact of electric energy storage [3,15,24,29,40,45]. Input time series data have likewise been checked by the authors, as well as by the scientific community using the data source [48]. To the best of our observation, all presented calculations are reproducible as expected due to their deterministic nature. Selected results were successfully checked based on alternative spreadsheet calculations of the modeling. Furthermore, published studies for selected elements of the approach underline the validity of the presented approach [11,25,31,40,45,59,73].
Clearly, the presented model is a simplified model in relation to the actual power system and many other relevant aspects are not considered. Consequently, the results only highlight the temporal integration aspects of vRES and do not cover other relevant aspects like economic costs, land availability, acceptance etc.
6. Conclusions
This case study for the German power system widens the existing systems analysis approaches with regard to the discourse of vRES integration in electricity systems and adds additional criteria for the transition towards a vRES-based power supply system.
The main objectives of this paper were to (i) provide a broad picture of how wind and solar PV can be combined to achieve efficient pathways in capacity expansion to fulfill future REN share targets in a storage-restricted energy system, (ii) compare the impact of advanced technologies from wind and solar PV against baseline technology, (iii) and study the impact of electric energy storage from PHS to make use of EE production from wind and solar PV. With these objectives in mind, our results indicate the following conclusions.
The results show that the higher power production from wind energy per installed capacity leads to a higher effectiveness of wind power, and effective pathways all depend on wind power in the first place, with solar PV added only after a certain REN share provided by wind is surpassed.
The positive impact of advanced technologies was confirmed for the case of wind power, as less capacity is required to achieve set REN share targets. For solar PV in a mixed setup of south, east and west-oriented systems, the lower productivity of these setups is not compensated by their better temporal matching with the demand profile from a REN share point of view.
Existing electric energy storage from PHS enables a better integration of wind and solar PV into the power system and allows for a faster achievement of REN share goals in the modeled cases. However, PHS does not result in an earlier introduction of solar PV along the efficient pathways. For all different cases calculated, wind power dominated the efficient pathways, especially in the advanced technology case, regardless of whether PHS was included or not.
To sum up: taking efficient pathways as a criterion for the future capacity expansion of vRES in the investigated case, a wind-based capacity expansion provides a faster transition towards high REN shares, even considering existing electric energy storage infrastructure from PHS in the region. Per unit of installed capacity, a considerably larger fraction of renewable energy can be provided from wind than from solar PV. Advanced wind power in particular provides higher productivity and effectiveness along with benefits regarding system integration [39,40].
Support schemes and especially tenders for renewable generation capacities should therefore ensure a steady capacity expansion of wind power, especially in the form of advanced system-friendly wind turbines. The reduced overall capacity requirement additionally offers substantial potential to reduce land use conflicts and environmental impacts, so that the results provide various connecting points for an analysis of land use implications [74], environmental impacts and economic comparison.
Specifically for the case of Germany, which has an almost equal proportion of existing wind and solar PV installations, the results underline the importance of wind power expansion in the coming years to reach the governmental goals for 2030 and beyond.
7. Outlook
The assessment of advanced technology is the focus of ongoing research [16,40,42,52,65] and an economic evaluation of the combined perspective of advanced technology and efficient pathways will be helpful to prioritize renewable policies. With specific investment costs and levelized cost of energy for wind and solar PV currently in the same order of magnitude in Europe [10,75,76,77,78,79,80], non-economic aspects are likewise relevant to decide on future capacity expansion pathways. The possibility for a quick capacity expansion of solar PV, contested public acceptance, as well as availability of sites for wind power and environmental impacts, are additional aspects to be considered. Given the mid- to long-term perspective that was taken in this case study, further advancements in technology and innovations in vRES technologies and electric energy storage will influence the outcome of efficient pathways as well.
Furthermore, a successful and fast transition to a fully renewable power supply system also depends on the extent to which other renewable sources such as bioenergy, hydro and geothermal can complement vRES in order to contribute to a secure power supply. Without additional contributions from these non-vRES sources and at current consumption levels [47], wind and solar PV have to provide more than 85% of the power supply in Germany. Therefore, additional integration options like new storage technologies, demand side management or a better coupling of the sectors for electricity, heat and mobility are key factors for integrating high shares of vRES on power supply systems.
Author Contributions
P.T. had the idea and developed the model and performed the modeling and analyzed the data and results; P.T. wrote the paper with contributions from M.E. and D.T.
Funding
This work was supported by the Helmholtz Association under the Joint Initiative “Energy System 2050 - A Contribution of the Research Field Energy.
Acknowledgments
We would like to thank the Open Power System Data platform for providing the crucial time series data used in this article.
Conflicts of Interest
The authors declare no conflict of interest.
Abbreviations
The following abbreviations are used in this manuscript:
| Case A | advanced technology study case |
| Case AS | advanced technology + electric energy storage study case |
| Case B | baseline (non-advanced) technology study case |
| Case BS | baseline (non-advanced) technology + electric energy storage study case |
| DSM | demand side management |
| EE | excess energy (equivalent to the cumulated negative residual load) |
| FLH | full load hours, equivalent to the capacity factor of a power converter |
| GW | gigawatt |
| GWh | gigawatt hour |
| MW | megawatt |
| RL | residual load (power demand minus renewable feed-in; renewable feed-in is limited to wind and solar PV in the modeling) |
| REN | renewable energy |
| REN share | renewable share on power demand |
| solar PV | solar photovoltaics |
| vRES | variable renewable energy sources (primarily wind and solar PV) |
| WEC | wind energy converter |
References
- IEA. World Energy Outlook 2017; International Energy Agency (IEA): Paris, France, 2017. [Google Scholar]
- IPCC. Climate Change 2014: Synthesis Report; Contribution of Working Groups I, II and III to the Fifth Assessment Report of the Intergovernmental Panel on Climate Change Geneva; IPCC: Paris, France, 2014; p. 151. [Google Scholar]
- Edenhofer, O.; Hirth, L.; Knopf, B.; Pahle, M.; Schlömer, S.; Schmid, E.; Ueckerdt, F. On the economics of renewable energy sources. Energy Econ. 2013, 40 (Suppl. 1), S12–S23. [Google Scholar] [CrossRef]
- González-Aparicio, I.; Zucker, A. Impact of wind power uncertainty forecasting on the market integration of wind energy in Spain. Appl. Energy 2015, 159, 334–349. [Google Scholar] [CrossRef]
- Ueckerdt, F.; Brecha, R.; Luderer, G.; Sullivan, P.; Schmid, E.; Bauer, N.; Böttger, D.; Pietzcker, R. Representing power sector variability and the integration of variable renewables in long-term energy-economy models using residual load duration curves. Energy 2015, 90, 1799–1814. [Google Scholar] [CrossRef]
- Beaudin, M.; Zareipour, H.; Schellenberglabe, A.; Rosehart, W. Energy storage for mitigating the variability of renewable electricity sources: An updated review. Energy Sustain. Dev. 2010, 14, 302–314. [Google Scholar] [CrossRef]
- Huber, M.; Dimkova, D.; Hamacher, T. Integration of wind and solar power in Europe: Assessment of flexibility requirements. Energy 2014, 69, 236–246. [Google Scholar] [CrossRef]
- Schlachtberger, D.P.; Becker, S.; Schramm, S.; Greiner, M. Backup flexibility classes in emerging large-scale renewable electricity systems. Energy Convers. Manag. 2016, 125, 336–346. [Google Scholar] [CrossRef]
- Xydis, G. On the exergetic capacity factor of a wind—Solar power generation system. J. Clean. Prod. 2013, 47, 437–445. [Google Scholar] [CrossRef]
- Ueckerdt, F.; Hirth, L.; Luderer, G.; Edenhofer, O. System LCOE: What are the costs of variable renewables? Energy 2013, 63, 61–75. [Google Scholar] [CrossRef]
- Rasmussen, M.G.; Andresen, G.B.; Greiner, M. Storage and balancing synergies in a fully or highly renewable pan-European power system. Energy Policy 2012, 51, 642–651. [Google Scholar] [CrossRef]
- Becker, S.; Frew, B.A.; Andresen, G.B.; Zeyer, T.; Schramm, S.; Greiner, M.; Jacobson, M.Z. Features of a fully renewable US electricity system: Optimized mixes of wind and solar PV and transmission grid extensions. Energy 2014, 72, 443–458. [Google Scholar] [CrossRef]
- Bussar, C.; Stöcker, P.; Cai, Z.; Moraes, L.; Alvarez, R.; Chen, H.; Breuer, C.; Moser, A.; Leuthold, M.; Sauer, D.U. Large-scale Integration of Renewable Energies and Impact on Storage Demand in a European Renewable Power System of 2050. Energy Procedia 2015, 73, 145–153. [Google Scholar] [CrossRef]
- Child, M.; Bogdanov, D.; Breyer, C. The role of storage technologies for the transition to a 100% renewable energy system in Europe. Energy Procedia 2018, 155, 44–60. [Google Scholar] [CrossRef]
- Schill, W.-P.; Diekmann, J.; Zerrahn, A. Power Storage: An Important Option for the German Energy Transition. 2015. Available online: https://www.econstor.eu/handle/10419/108856 (accessed on 13 April 2018).
- Mills, A.D.; Wiser, R.H. Strategies to mitigate declines in the economic value of wind and solar at high penetration in California. Appl. Energy 2015, 147, 269–278. [Google Scholar] [CrossRef]
- Hirth, L. The benefits of flexibility: The value of wind energy with hydropower. Appl. Energy 2016, 181, 210–223. [Google Scholar] [CrossRef]
- Lindley, D. The energy storage problem. Nature 2010, 463, 18–20. [Google Scholar] [CrossRef] [PubMed]
- Denholm, P.E.E.; Kirby, B.; Milligan, M. Role of Energy Storage with Renewable Electricity Generation; National Renewable Energy Laboratory: Golden, CO, USA, 2010.
- Solomon, A.A.; Kammen, D.M.; Callaway, D. Investigating the impact of wind–solar complementarities on energy storage requirement and the corresponding supply reliability criteria. Appl. Energy 2016, 168, 130–145. [Google Scholar] [CrossRef]
- Jülch, V. Comparison of electricity storage options using levelized cost of storage (LCOS) method. Appl. Energy 2016, 183, 1594–1606. [Google Scholar] [CrossRef]
- Amirante, R.; Cassone, E.; Distaso, E.; Tamburrano, P. Overview on recent developments in energy storage: Mechanical, electrochemical and hydrogen technologies. Energy Convers. Manag. 2017, 132, 372–387. [Google Scholar] [CrossRef]
- Nikolaidis, P.; Poullikkas, A. Cost metrics of electrical energy storage technologies in potential power system operations. Sustain. Energy Technol. Assess. 2018, 25, 43–59. [Google Scholar] [CrossRef]
- Heide, D.; Greiner, M.; von Bremen, L.; Hoffmann, C. Reduced storage and balancing needs in a fully renewable European power system with excess wind and solar power generation. Renew. Energy 2011, 36, 2515–2523. [Google Scholar] [CrossRef]
- Heide, D.; von Bremen, L.; Greiner, M.; Hoffmann, C.; Speckmann, M.; Bofinger, S. Seasonal optimal mix of wind and solar power in a future, highly renewable Europe. Renew. Energy 2010, 35, 2483–2489. [Google Scholar] [CrossRef]
- Vidal-Amaro, J.J.; Østergaard, P.A.; Sheinbaum-Pardo, C. Optimal energy mix for transitioning from fossil fuels to renewable energy sources—The case of the Mexican electricity system. Appl. Energy 2015, 150, 80–96. [Google Scholar] [CrossRef]
- Huber, M.; Weissbart, C. On the optimal mix of wind and solar generation in the future Chinese power system. Energy 2015, 90 Pt 1, 235–243. [Google Scholar] [CrossRef]
- Becker, S.; Frew, B.A.; Andresen, G.B.; Jacobson, M.Z.; Schramm, S.; Greiner, M. Renewable build-up pathways for the US: Generation costs are not system costs. Energy 2015, 81, 437–445. [Google Scholar] [CrossRef]
- Ueckerdt, F.; Brecha, R.; Luderer, G. Analyzing major challenges of wind and solar variability in power systems. Renew. Energy 2015, 81, 1–10. [Google Scholar] [CrossRef]
- Zappa, W.; van den Broek, M. Analysing the potential of integrating wind and solar power in Europe using spatial optimisation under various scenarios. Renew. Sustain. Energy Rev. 2018, 94, 1192–1216. [Google Scholar] [CrossRef]
- Kreifels, N.; Mayer, J.N.; Burger, B.; Wittwer, C. Analysis of Photovoltaics and Wind Power in Future Renewable Energy Scenarios. Energy Technol. 2014, 2, 29–33. [Google Scholar] [CrossRef]
- Denholm, P.; Margolis, R.M. Evaluating the limits of solar photovoltaics (PV) in electric power systems utilizing energy storage and other enabling technologies. Energy Policy 2007, 35, 4424–4433. [Google Scholar] [CrossRef]
- Lund, H. Excess electricity diagrams and the integration of renewable energy. Int. J. Sustain. Energy 2003, 23, 149–156. [Google Scholar] [CrossRef]
- Hirth, L. The Optimal Share of Variable Renewables: How the Variability of Wind and Solar Power affects their Welfare-optimal Deployment. Energy J. 2015, 36, 149–184. [Google Scholar] [CrossRef]
- Zipp, A. Revenue prospects of photovoltaic in Germany—Influence opportunities by variation of the plant orientation. Energy Policy 2015, 81, 86–97. [Google Scholar] [CrossRef]
- Hartner, M.; Ortner, A.; Hiesl, A.; Haas, R. East to west—The optimal tilt angle and orientation of photovoltaic panels from an electricity system perspective. Appl. Energy 2015, 160, 94–107. [Google Scholar] [CrossRef]
- Hirth, L. The Market Value of Solar Photovoltaics: Is Solar Power Cost-Competitive? IET Renew. Power Gener. 2015, 9, 37–45. [Google Scholar] [CrossRef]
- Tafarte, P.; Das, S.; Eichhorn, M.; Thrän, D. Small adaptations, big impacts: Options for an optimized mix of variable renewable energy sources. Energy 2014, 72, 80–92. [Google Scholar] [CrossRef]
- IEA. The Power of Transformation: Wind, Sun and the Economics of Flexible Power Systems; International Energy Agency (IEA): Paris, France, 2014; p. 238. [Google Scholar]
- Hirth, L.; Müller, S. System-friendly wind power-How advanced wind turbine design can increase the economic value of electricity generated through wind power. Energy Econ. 2016, 56, 51–63. [Google Scholar] [CrossRef]
- May, N. The Impact of Wind Power Support Schemes on Technology Choices. Energy Econ. 2017, 65, 343–354. [Google Scholar] [CrossRef]
- May, N.; Karsten, N.; Frieder, B. Market incentives for system-friendly designs of wind turbines. DIW Econ. Bull. 2015, 5, 313–321. [Google Scholar]
- Bucksteeg, M. Modelling the impact of geographical diversification of wind turbines on the required firm capacity in Germany. Appl. Energy 2019, 235, 1476–1491. [Google Scholar] [CrossRef]
- Pforte. Untersuchungen zur Integration der Fluktuierenden Windenergie in das System der Elektroenergieversorgung; KIT: Karlsruhe, Germany, 2010. [Google Scholar]
- Wagner, F. Electricity by intermittent sources: An analysis based on the German situation 2012. Eur. Phys. J. Plus 2014, 129, 20. [Google Scholar] [CrossRef]
- Killinger, S.; Mainzer, K.; McKenna, R.; Kreifels, N.; Fichtner, W. A regional optimisation of renewable energy supply from wind and photovoltaics with respect to three key energy-political objectives. Energy 2015, 84, 563–574. [Google Scholar] [CrossRef]
- Erneuerbare Energien in Deutschland. Daten zur Entwicklung im Jahr 2017. 2018. Available online: https://www.umweltbundesamt.de/sites/default/files/medien/376/publikationen/180315_uba_hg_eeinzahlen_2018_bf.pdf (accessed on 5 December 2018).
- Open Power System Data: Wind and Solar Power Time Series. 2016. Available online: http://open-power-system-data.org/data-sources#8_Wind_and_solar_power_time_series2016 (accessed on 5 December 2017).
- Schlesinger, M.; Lindenberger, D.; Lutz, C. Energieszenarien für ein Energiekonzept der Bundesregierung. 2010. Available online: https://www.prognos.com/uploads/tx_atwpubdb/100827_Prognos_Studie__Energieszenarien_fuer_ein_energiekonzept_der_Bundesregierung.pdf (accessed on 11 January 2018).
- Netzentwicklungsplan Strom 2012. 2. Überarbeiteter Entwurf der Übertragungsnetzbetreiber. 50Hertz, Amprion, TenneT TSO, TransnetBW. 2012. Available online: https://www.netzentwicklungsplan.de/sites/default/files/nep_2012_2_entwurf_teil_1_kap_1_bis_8.pdf (accessed on 21 April 2018).
- May, N.; Neuhoff, K.; Borggrefe, F. Marktanreize für Systemdienliche Auslegungen von Windkraftanlagen; DIW Wochenbericht: Wirtschaft, Politik, Wissenschaft; DIW Berlin: Berlin, Germany, 2015; pp. 555–564. [Google Scholar]
- Molly, P. Design of Wind Turbines and Storage: A Question of System Optimisation. 2012. Available online: https://www.dewi.de/dewi_res/fileadmin/pdf/publications/Magazin_40/04.pdf (accessed on 23 April 2017).
- Molly, P. Rated Power of Wind Turbines: What is Best? 2011. Available online: https://www.dewi.de/dewi_res/fileadmin/pdf/publications/Magazin_38/07.pdf (accessed on 12 November 2018).
- IWES. Entwicklung der Windenergie in Deutschland—Eine Beschreibung von aktuellen und zukünftigen Trends und Charakteristika der Einspeisung von Windenergieanlagen; IWES: Kassel, Germany, 2013; p. 28. [Google Scholar]
- Durstewitz, M.; Berkhout, V.; Hirsch, J.; Pfaffel, S.; Rohrig, K.; Adam, F.; Bange, J.; Bergmann, D.; Cernusko, R.; Faulstich, S. Windenergie Report Deutschland 2016; Fraunhofer Institut für Windenergie und Energiesystemtechnik (IWES): Stuttgart, Germany, 2017. [Google Scholar]
- FfE. Verbundforschungsvorhaben Merit Order der Energiespeicherung im Jahr 2030 Teil 1: Hauptbericht Endbericht; Forschungsstelle für Energiewirtschaft FfE: München, Germany, 2016; p. 350. [Google Scholar]
- Buck, P. Ökonomische Bewertung Systemfreundlich Optimierter Erneuerbarer Stromerzeugungstechnologien. Master's Thesis, Munich, Germany, 2016. [Google Scholar]
- Tafarte, P.; Buck, P. Integration of wind power—Challenges and options for market integration and its impact on future cross-sectorial use. In Proceedings of the 14th International Conference on the European Energy Market (EEM), Dresden, Germany, 6–7 June 2017; pp. 1–5. [Google Scholar]
- Lund, H. EnergyPLAN Advanced Energy Systems Analysis. 2012. Available online: http://energy.plan.aau.dk/EnergyPLAN%20documentation.pdf (accessed on 12 December 2017).
- Matthes, F. Erneuerbare-Energien-Gesetz 3.0 (Langfassung). In Studie im Auftrag von Agora Energiewende; Öko-Institut: Freiburg, Germany, 2014. [Google Scholar]
- Fraunhofer_ISE. Effekte Regional Verteilter Sowie Ost-/West-Ausgerichteter Solaranlagen; Fraunhofer_ISE: Freiburg, Germany, 2014. [Google Scholar]
- Hafez, A.Z.; Soliman, A.; El-Metwally, K.A.; Ismail, I.M. Tilt and azimuth angles in solar energy applications—A review. Renew. Sustain. Energy Rev. 2017, 77, 147–168. [Google Scholar] [CrossRef]
- Deetjen, T.A.; Garrison, J.B.; Rhodes, J.D.; Webber, M.E. Solar PV integration cost variation due to array orientation and geographic location in the Electric Reliability Council of Texas. Appl. Energy 2016, 180, 607–616. [Google Scholar] [CrossRef]
- Hummon, M.; Denholm, P.; Margolis, R. Impact of photovoltaic orientation on its relative economic value in wholesale energy markets. Prog. Photovolt. Res. Appl. 2013, 21, 1531–1540. [Google Scholar] [CrossRef]
- Achner, S.; Brühl, S.; Krzikalla, N. Möglichkeiten zum Ausgleich Fluktuierender Einspeisungen aus Erneuerbaren Energien; BET Büro für Energiewirtschaft und Technische Planung GmbH: Aachen, Germany, 2013. [Google Scholar]
- Li, G.; Jin, Y.; Akram, M.W.; Chen, X.; Ji, J. Application of bio-inspired algorithms in maximum power point tracking for PV systems under partial shading conditions—A review. Renew. Sustain. Energy Rev. 2018, 81, 840–873. [Google Scholar] [CrossRef]
- Salpakari, J.; Mikkola, J.; Lund, P.D. Improved flexibility with large-scale variable renewable power in cities through optimal demand side management and power-to-heat conversion. Energy Convers. Manag. 2016, 126, 649–661. [Google Scholar] [CrossRef]
- Szarka, N.; Eichhorn, M.; Kittler, R.; Bezama, A.; Thrän, D. Interpreting long-term energy scenarios and the role of bioenergy in Germany. Renew. Sustain. Energy Rev. 2017, 68, 1222–1233. [Google Scholar] [CrossRef]
- Szarka, N.; Scholwin, F.; Trommler, M.; Fabian Jacobi, H.; Eichhorn, M.; Ortwein, A.; Thrän, D. A novel role for bioenergy: A flexible, demand-oriented power supply. Energy 2013, 61, 18–26. [Google Scholar] [CrossRef]
- Thrän, D.; Eichhorn, M.; Krautz, A.; Das, S.; Szarka, N. Flexible power generation from biomass—An opportunity for a renewable sources based energy system? In Transition to Renewable Energy System; Stolten, D., Scherer, V., Eds.; Whiley-VCH: Weinheim, Germany, 2013. [Google Scholar]
- Schill, W.-P. Residual load, renewable surplus generation and storage requirements in Germany. Energy Policy 2014, 73, 65–79. [Google Scholar] [CrossRef]
- Solomon, A.; Kammen, D.; Callaway, D. The role of large-scale energy storage design and dispatch in the power grid: A study of very high grid penetration of variable renewable resources. Appl. Energy 2014, 134, 75–89. [Google Scholar] [CrossRef]
- Petrakopoulou, F.; Robinson, A.; Loizidou, M. Exergetic analysis and dynamic simulation of a solar-wind power plant with electricity storage and hydrogen generation. J. Clean. Prod. 2016, 113, 450–458. [Google Scholar] [CrossRef]
- Lund, H. Large-scale integration of optimal combinations of PV, wind and wave power into the electricity supply. Renew. Energy 2006, 31, 503–515. [Google Scholar] [CrossRef]
- Eichhorn, M.; Tafarte, P.; Thrän, D. Towards energy landscapes—“Pathfinder for sustainable wind power locations”. Energy 2017, 134, 611–621. [Google Scholar] [CrossRef]
- Moné, C.; Maples, A.S.B.; Hand, M. 2013 Cost of Wind Energy Review; NREL (National Renewable Energy Laboratory): Golden, CO, USA, 2015; p. 94.
- Reichelstein, S.; Yorston, M. The prospects for cost competitive solar PV power. Energy Policy 2013, 55, 117–127. [Google Scholar] [CrossRef]
- Aisma, V. IEA Wind Task 26: Wind Technology, Cost, and Performance Trends in Denmark, Germany, Ireland, Norway, the European Union, and the United States: 2007–2012; NREL: Golden, CO, USA, 2015.
- Wiser, R.; Bolinger, M. 2013 Wind Technologies Market Report; U.S. Department of Energy: Washington, DC, USA, 2014.
- Fraunhofer_ISE. Current and Future Cost of Photovoltaics. In Long-term Scenarios for Market Development, System Prices and LCOE of Utility-Scale PV Systems; Study on behalf of Agora Energiewende; Fraunhofer-Institute for Solar Energy Systems: Freiburg, Germany, 2015. [Google Scholar]
© 2019 by the authors. Licensee MDPI, Basel, Switzerland. This article is an open access article distributed under the terms and conditions of the Creative Commons Attribution (CC BY) license (http://creativecommons.org/licenses/by/4.0/).