Abstract
The columnar joints in Baihetan hydropower station are primary tensile joints since they were formed during the process of lava condensation. Understanding the influence of columnar jointed rock mass (CJRM) on the mechanical response and failure modes is the basis for designing of associated engineering works. Hence, the structural characteristics of Baihetan CJRM were analyzed by carrying out a geological survey at first. Three groups of numerical models capable of reflecting the structural characteristics of CJRM were then established to analyze the mechanical and failure characteristics. The results in this study showed that: (1) Irregularity of columnar basalt restricted crack propagation on columnar joints and also led to stress concentration in the distorted parts, and thus, damage of basalt columns; (2) when the included angle between direction of concentrated defect structures in CJRM and uniaxial stress was large, the defect structures can prevent crack propagation on columnar joints, and the failure of defect structure can cause the overall failure of the rock mass; and (3) under the condition of same columnar structure and included angle, the peak strength of models with microcracks and structural plane was low and the irregular shape of columnar joints decreased the anisotropy of mechanical parameters.
1. Introduction
Baihetan hydropower station on Jinsha River is located in the gorge between Ningnan County, Sichuan Province, and Qiaojia County, Yunnan Province, southwest China. It is the second of four cascade hydropower stations on Jinsha River, and is 195 km from Xiluodu hydropower station. It is the second-largest hydropower station in the world in terms of installed capacity, following the Three Gorges Project on the Yangtze River, China. Columnar jointed rock masses (CJRM) are widely distributed in the dam foundation, abutment slope, and surge chamber areas. The special structural characteristics and mechanical properties of CJRM pose a great challenge for engineering construction and operation safety, such as excavations [1].
The research into mechanical properties and failure characteristics of brittle materials cover three aspects: In situ tests, laboratory tests, and numerical simulations [2,3,4]. For in situ tests, Shan et al. [5] analyzed the characteristics of deformation and stress variation by carrying out loading and unloading tests on CJRM. Jiang et al. [6] explored the anisotropic characteristics of CJRM formation in Baihetan hydropower station, including aspects of geometrical rock structure, deformation, and strength anisotropy. The investigations found that the anisotropic coefficients obtained for the deformability and strength of CJRM are similar for all testing methods employed, such as including in situ P-wave velocity, point load tests, and uniaxial compression tests. By conducting a bearing plate test on CJRM, Jin et al. [7] investigated the physico-mechanical properties of columnar jointed basalt at Baihetan dam site. For laboratory tests, the existing research usually generalizes the columnar structure into polygonal prisms and columnar joints into straight joints. By making a columnar mould, Jin et al. [8] studied the variation of different mechanical parameters and failure characteristics by using reconstructed CJRM specimens. For numerical simulation, Santarsieroet al. [9] proposed an original model of Abaqus to simulate the failure of brittle material, such as glasses and concrete. This model is able to account for the geometrical and mechanical properties of reference connection specimens. According to Cosserat theory and Goodman equivalent superposition principle, Zhu et al. [10] established a macroscopic constitutive model for CJRM and analyzed its anisotropy by regarding columnar joints as parallel cut-through joints. Wang et al. [11] performed numerical direct shear tests on stratified rocks drilled from granulite rocks. Thus, the influence of joint orientations and normal stresses was tested, and the anisotropy and directionality of the shear strength were evaluated. The results demonstrate that the peak shear stress of granulite rocks was more sensitive to inclination angles than normal stress.
The unique CJRM structure leads to mechanical anisotropy and complex failure behaviors. Generally, the experimental data are discrete and cannot be used for analyzing the influence of internal fracture mechanisms. In laboratory tests and numerical simulations, the structures of CJRM are generalized so that some structural characteristics are ignored. Actually, the mechanical properties of CJRM are influenced by irregular columns and jointed fractures. Therefore, it is necessary to explore the influence of realistic structures on mechanical characteristics of CJRM. Hence, in this paper, three groups of numerical models of CJRM structures were established firstly based on statistical damage theory. Then the influence of structural characteristics of CJRM on its failure modes and anisotropic mechanical properties were analyzed in detail. Finally, the failure characteristics of CJRM in different directions under uniaxial compression were summarized.
2. Structural Characteristics of Baihetan Columnar Jointed Basalt
2.1. Distribution Characteristics of CJRM at Baihetan Hydropower Station
According to columnar structures of CJRM at Baihetan hydropower station, the CJRM can be divided into three types [12]. Type I has a high density, with fine, long columns of 2~3 m in length and 13~25 cm in diameter. The columnar rock is ash black in color, and contains microcracks. Type II is irregularly distributed, without cutting through the whole columnar rocks, with length and diameter in the range of 0.5~2.0 m and 5~40 cm, respectively. Moreover, microcracks exist in columnar rocks. Type III is bulky and irregularly distributed, with length and diameter in the range of 1.5~4.0 m and 0.5~2.0 m, respectively. In the arrangement of the geological drilling rig, the direction of geological drilling should be the same with the direction and dip angle of the basalt column, so as to prevent the fragmentation caused by drilling bit. The drilling area was cleaned up by high-pressure water before drilling.
The columnar joints are intermittent and densely embedded within each other. Among the three types of columnar structures, Type I is distributed most widely. In addition to basalt columns and columnar joints, Baihetan CJRM also contains microcracks, structural planes, etc. To quantify the structural characteristics, the structural characteristics of joints in the rock mass at the wall of drainage tunnel #1-1 in the underground powerhouse was sketched and presented in Figure 1 by applying the sampling window method.
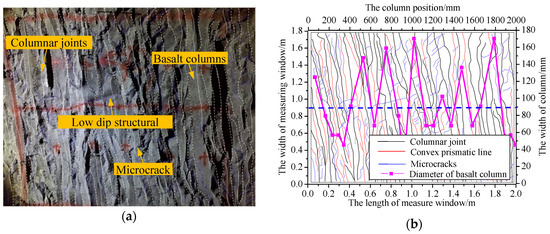
Figure 1.
Structural characteristics of columnar jointed basalt in drainage tunnel #1-1: (a) Sampling window for columnar jointed basalt; (b) analysis of various structures in the sampling window.
2.2. Structural Characteristics of CJRM on A Longitudinal Section
Figure 1 shows a typical sketch of CJRM through a sampling window, and the size of the sampling window was 2.0 m × 1.8 m. In Figure 1a, white imaginary lines refer to the structure of columnar joints, while solid white lines represent the line of prisms of basalt columns. Moreover, the solid blue lines in basalt column refer to microcracks and structural planes. Figure 1b shows the refined sketch of the sampling window corresponding to Figure 1a. In the sampling window, a centerline along the horizontal direction was drawn as the baseline, and the diameter of basalt columns crossing the line was calculated. The statistical results show that, in the sampling window, there are 25 basalt columns with an average diameter of 80 mm. The basalt columns with diameters in the range of 0~50 mm, 51~100 mm, 101~150 mm, and 151~200 mm accounted for 16%, 56%, 12%, and 16%, respectively. On the whole, the basalt columns with a diameter between 51 and 150 mm accounted for 68%.
2.3. The Roughness of Columnar Joints
The failure of jointed rock mass tends to be controlled by columnar joints, and the strength and deformation of unfilled joints are mainly influenced by joint surface morphology, the strength of joint rock wall, and normal stress. Among them, the strength of rock wall and normal stress can be easily measured. Therefore, how to describe the surface morphology of columnar joints is the key problem [13,14].
In this study, rock cores with a diameter of 220 mm were drilled along the longitudinal direction of columnar joints. A rock specimen containing columnar joints is shown in Figure 2a. On the whole, the columnar joints in CJRM were even, relatively smooth and no other filling structures were found therein. To quantify the roughness of columnar joints, the joint roughness coefficient (JRC) was determined as 5.558 with the assistance of a 3D scanning system, and the calculation of JRC could be calculated in Figure 2b [15].
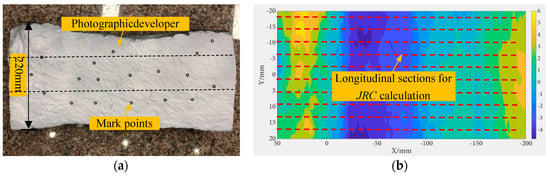
Figure 2.
Calculation of joint roughness coefficient (JRC) for columnar joints: (a) Primary columnar jointed rock (CJRM) with columnar joints; (b) acquisition of JRC across a longitudinal section.
2.4. Distribution of Microcracks in Columnar Rocks
Microcracks are widely distributed in Baihetan basalt columns, which is an important factor influencing the failure of CJRM during unloading. Therefore, the occurrence of microcracks, which could be recognized in the sampling window, was analyzed in detail. The strike and dip angle of microcracks were also calculated. Figure 3 shows the contour map of strike and dip angle, and rosette plots of predominant joint sets in the sampling window. In the sampling window, it could be seen that there were 133 microcracks, which can be mainly divided into two groups. The first group with the strike of SW 65°~75° and dip angle of ∠25°~33° took up 20.33% (31 fractures) of the total number of fractures. The second group with the strike of SE 10°~20°, and dip angle of ∠70°~∠80°, accounted for 17.5% (23 fractures) of the total. By statistical analysis on the occurrence of microcracks in the sampling window, it could be seen that the structures of microcracks in basalt columns were not randomly distributed, but showed a significant orientation tendency. Therefore, it is necessary to consider the influence of structural defects, including microcracks and structural planes on the mechanical properties and failure characteristics of CJRM.
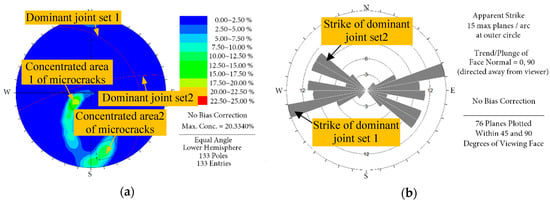
Figure 3.
The occurrence of microcracks in columnar jointed basalt in the drainage tunnel #1-1: (a) Contour diagram; (b) rosette plot.
In summary, the Baihetan columnar jointed basalt has the following typical structural characteristics: (1) CJRM exhibits significant orientation dependency, and its structure is extremely non-uniform, that is, basalt columns are irregular long columns with varying parameters, including diameter and length. A feather edge can be observed in some columns along the longitudinal direction. (2) Basalt columns exist in diverse shapes and are interactively embedded with each other in space, showing a characteristic mosaic structure. (3) Columnar joints extended over a long distance and were uneven. (4) The microcracks were formed in basalt columns and occurred in a predominant direction. (5) Structural planes were found in CJRM and generally cut the basalt columns transversely.
3. Modelling of CJRM Based on Digital Image Processing (DIP) Technology
Through the above analysis, the structure of CJRM of Baihetan hydropower station is very complex, rather than simple structures formed via directional alignment of regular columns. Therefore, to investigate the mechanical properties of CJRM, it is necessary to consider various factors, including columnar joints, microcracks, and structural planes in basalt columns, as well as variations in the geometric dimensions of basalt columns. Hence, numerical simulation was conducted by using the digital image processing (DIP) technology, which was expected to simulate the complex structures of primary rocks to the utmost extent.
Yu et al. [16] proposed the model construction method for rocks based on DIP, which could realize refined reconstruction of surface or internal structural characteristics of rocks by utilizing a digital image system or CT scanning system. The processes of numerical model establishment could be concluded, as follows. Firstly, the digital image of the rock mass structures is attained by photography. Secondly, the color information of each pixel in the digital image is then recognized and classified by using DIP technology, that is, the pixels are processed into a group of integer variables (integer variable I (0~255) in grey space; variables R, G and B (0~255) in 3D true color space) in grey space or true color space (for example, RGB space) [17]. Finally, the digital image is discredited into square elements or meshes. The meshes are directly mapped into the cells required during the numerical simulation.
In terms of structures, rock mass can be classified into rocks, joints, fractures, etc., shown as different colors in the digital image, which can be clearly distinguished during pixel identification and classification. On this basis, the relationship between rock mass structures and image colors could be established to distinguish the materials and parameters in numerical simulation. Based on the analysis of structural characteristics of Baihetan jointed basalt in the previous section, a typical area (1.0 m × 1.0 m) was selected from the digital image which contained 1000 × 1000 pixels, as shown in Figure 4a. In this image, the solid blue lines denote the microcracks and structural planes, while solid black lines represent columnar joints. The DIP technology was then applied to process the digital image, and the result is shown in Figure 4b.
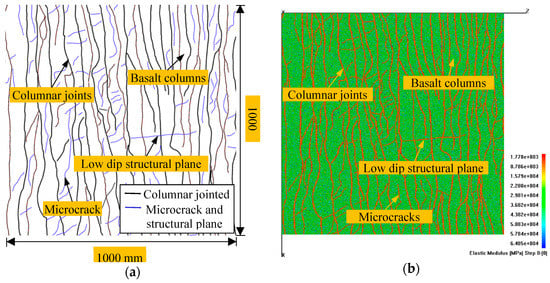
Figure 4.
Establishment of numerical model: (a) Digital image containing basalt columns, microcracks and structural planes; (b) numerical model based on recognition by DIP technology.
Table 1 displays the color information (such as R, G, B and I ((R+G+B)/3)) contained in the digital image shown in Figure 4b. The structures (including columnar joints, microcracks, and structural planes in columns) all belonged to defects in the rock mass in which the value of I was 0 for columnar joints (black in color), while 85 for both microcracks and structural planes (blue in color). The basalt columns appeared as white, with I = 255. According to the variation of I for structural characteristics, the median I of two adjacent structures with different colors was taken as the threshold for distinguishing different structures. Therefore, I values of 50 and 150 were selected as the threshold for distinguishing four structures. Additionally, through the above analysis, it could be seen that all the structures were classified as defects. Therefore, the three types of structures could be regarded as the same kind of material during the simulation.

Table 1.
Color information in digital CJRM images as recognized by the computational procedure.
To analyze the influence of structural complexity on mechanical properties of the rock mass, the CJRM models were divided into three groups, namely Groups A, B, and C, as shown in Figure 5. The model in Group A particularly considered the main characteristics of the structural composition of columnar jointed basalt, which involved different structures, such as basalt columns, columnar joints, microcracks and structural planes in columns. The model in Group B excluded some structures, such as microcracks and structural planes on the basis of Group A. By comparing the results for Groups A and B, the influence of defects (including microcracks and structural planes within the sampling window) on the failure and mechanical properties of CJRM could be studied. For the model in Group C, straight lines were used to replace the traces of columnar joints based on Group B, i.e., a generalized structure of CJRM was used. By comparing the results for Groups B and C, the influence of structural characteristics of basalt columns on the failure and mechanical behaviors of CJRM could also be analyzed.
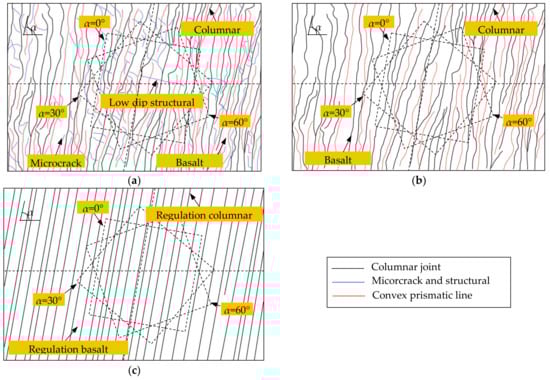
Figure 5.
Three groups of sampling windows for numerical simulation: (a) Sampling window containing microcracks and structural planes; (b) sampling window without microcracks and structural planes; (c) generalized model for the sampling window of CJRM.
The rock mass structures in sampling window showed a dip angle of about 15° with respect to the vertical direction. Therefore, when selecting the simulation area, the included angle (α) between the longitudinal direction of basalt columns and loading direction was taken as a reference (Figure 5). To analyze the mechanical properties of CJRM at different directions under stress, modeling was carried out in different areas at intervals of 10°. Figure 5 shows the numerical models with α = 0°, 30°, and 60°, respectively.
4. Mechanical Model for CJRM and Calibration of Relevant Parameters
4.1. Mechanical Model for CJRM
Basalt is hard and brittle, exhibiting significant brittle failure characteristics under pressure. By transforming non-linear mechanical problems into simple elastic-brittle mechanical problems, the RFPA (Rock Failure Process Analysis) program could simulate the failure process of brittle materials, such as rocks [18,19,20,21,22]. The elasto-brittle damage constitutive model is employed to describe the mechanical behavior of rock during brittle failure. When rocks are damaged, that is, the stress or strain on the elements satisfies a certain given damage threshold, the element is damaged, and the elastic modulus of the damaged element can be expressed as follows:
where D refers to the damage variable, E and E0 denote the elastic modulus of the damaged and undamaged elements, respectively. To avoid the discontinuity caused by zero elastic modulus, the elastic modulus of the damaged element is endowed with a low value at D = 1.0, for example, 1.0 × 10⁻⁵ MPa, so as to guarantee continuity in numerical calculation. Under uniaxial tensile stress, the damage variable D can be expressed as follows:
where ε refers to the minor principal stress and tensile strain, respectively, and λ denotes the coefficient of residual strength, which is calculated according to ftr = λft0. Moreover, ftr refers to the residual strength of damaged element and εt0 represents the threshold of initial damage, that is, the tensile strain corresponding to uniaxial tensile strength (ft0). Additionally, εtu refers to the ultimate tensile strain, implying that elements are completely damaged (εtu = ηεt0) and η denotes the coefficient of ultimate strain, as shown in Figure 6a.
E = (1–D)E0,
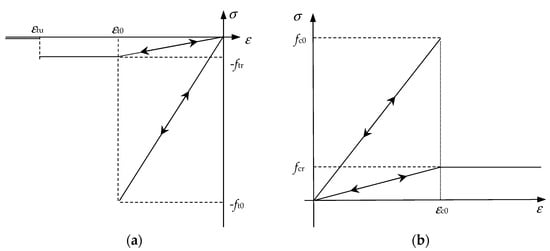
Figure 6.
Elasto-brittle damage constitutive law of element subject to uniaxial stress: (a) Under uniaxial tensile stress; (b) under uniaxial compressive stress.
Under a triaxial stress state, when the equivalent principal tensile strain () reaches the strain threshold εt0, it is inferred that elements are damaged under tension [23]. The equivalent principal tensile strain () is defined as follows:
where ε1, ε2, and ε3 denote the principal strains in three directions and the expression (< >) is shown as . When elements are in the uniaxial compressive stress or shear stress state, the threshold of damage is determined according to the Mohr-Coulomb criterion, shown in Equation (4):
where σ1, fc0, and ϕ represent the major principal stress, the uniaxial compressive strength, the internal friction angle of elements, respectively, and the other parameters are as defined above. When elements satisfy the Mohr-Coulomb criterion under triaxial stress state, the maximum principal compressive strain (εc0) can be quantified at the peak stress as:
where ν is the Poisson’s ratio. Here, it is assumed that the evolution of shear damage is related to the major principal compressive strain (ε1) in elements. Afterwards, by deducing the damage variable D in Equation (2), the damage variable for the elastic modulus of elements under different stress levels could be calculated. To simulate the failure process of rocks, the anisotropy of rocks is taken into account in the RFPA program, which is described by Weibull distribution [24]:
where u and u0 refer to the mean values of mechanical parameters, such as strength and elastic modulus, respectively. Moreover, m denotes the heterogeneity of the rock mass, and ϕ(u) represents the statistical distribution of mechanical properties for rock elements [25].
4.2. Calibration of Mechanical Parameters for Basalt Columns
As shown in Figure 5, the structures in CJRM mainly include basalt columns, columnar joints, microcracks in columns and structural planes. Calibrations of mechanical parameters for structures are the premise of reliable numerical simulation results. This section focuses on the determination of mechanical parameters by uniaxial compression tests on basalt column specimens. The failure modes and stress-strain curves of five basalt column specimens with a diameter of 50 mm and height of 100 mm are shown in Figure 7a. In Figure 7a, Specimens YJZ-03 and ZT-01 fragmented, and specimens YJZ-04, YJZ-05, and ZT-02 were subjected to splitting failure. No post-peak stage was observed in the stress-strain curves for all the basalt column specimens, indicating high brittleness. The mechanical parameters of jointed basalt column specimens are listed in Table 2. The mean values of peak strength, elastic modulus and Poisson’s ratio are 149.58 MPa, 40.60 GPa, and 0.21, respectively.
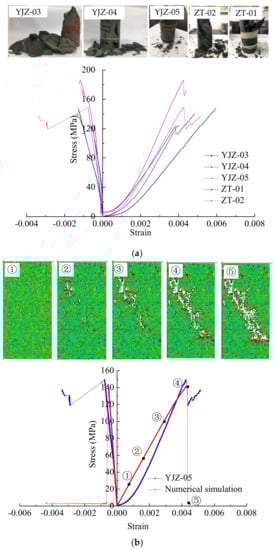
Figure 7.
Stress-strain curves and failure modes of columnar jointed basalt specimens: (a) Laboratory test results; (b) calibration of parameters for numerical simulation between stress-strain curves and failure process obtained by numerical simulation and laboratory test.
Table 2.
Mechanical parameters of jointed basalt columns.
Since the test results of specimen YJZ-05 approximate to the mean mechanical parameters listed in Table 2, the stress-strain curve and failure mode of this specimen was taken as the fitting standard for verification of numerical parameters. The mechanical parameters of the basalt column were acquired through a trial-and-error method by comparing the stress-strain curves and failure modes obtained by numerical simulation and laboratory tests. The numerical models had the same dimension as laboratory tests, and the model was divided into 50 × 100 = 5000 elements. By constantly adjusting parameters in numerical simulation, the final stress-strain curve and failure mode of the basalt column are displayed in Figure 7b. It could be seen that the peak strength, elastic modulus, and Poisson’s ratio of the numerical model are 141.71 MPa, 32.65 GPa, and 0.13, respectively. Moreover, the failure modes obtained by numerical simulation and laboratory experiments are also consistent (Figure 7b). Finally, the mechanical parameters of basalt columns listed in Table 3 were adopted in numerical simulations.
Table 3.
Mechanical parameters of various structures for numerical simulation.
4.3. Calibration of Mechanical Parameters for Defect Structures
According to in situ tests, the defect structures (columnar joints, microcracks in columns, and structural planes) in CJRM are unfilled structures composed of the same material and tightly embedded with each other. Therefore, the same material parameters were applied for the defects in the simulation. In RFPA, the material representing a defect is processed as elements with a relatively weak elastic modulus and strength. The mechanical parameters can hardly be directly acquired through mechanical testing, but can be determined by using indirect methods.
Firstly, according to Equation (7) and laboratory tests results in reference [12], the shear strength of the columnar joints under normal stress of 5 MPa is calculated [13]:
where τ, σn, JRC, JCS, and ϕb refer to peak shear strength (MPa), normal stress (MPa), roughness coefficient, compressive strength, and basic friction angle of rock structural planes, respectively. The shear strength of the columnar joint is calculated as 4.86 MPa when the values of JRC, JCS, σn, and ϕb of columnar joints are 5.56, 149.4 MPa, 5 MPa, and 36°, respectively [12].
According to the roughness and shape of the columnar joint in Figure 8, a shear model containing joint structure was established. The model has a dimension of 250 mm × 250 mm. The mechanical parameters of basalt columns listed in Table 3 were taken as the parameters of upper and lower-plate materials. The boundaries of the lower plate were fixed. Normal stress of 5 MPa and a shear displacement of 0.05 mm/step were applied on the upper plate. The mechanical parameters of each columnar joint were constantly adjusted, and the shear strength of the joint plane was calculated until the shear strength derived from simulation conformed to that from Equation (7). Figure 9 shows the relationship between shear stress and shear displacement obtained by numerical simulation. It can be seen that the shear strength of this typical joint plane is 4.2 MPa, which is consistent with Equation (7). Therefore, the mechanical parameters for defect structures in CJRM are determined and listed in Table 3.
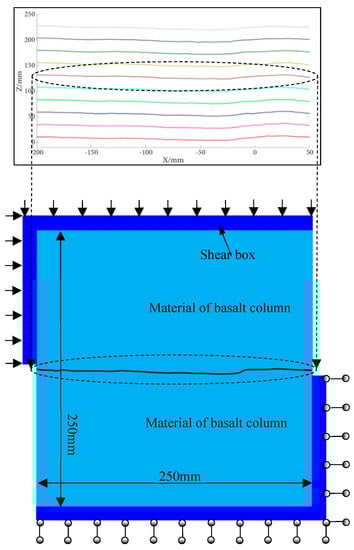
Figure 8.
Shear properties of columnar joints by numerical simulation.
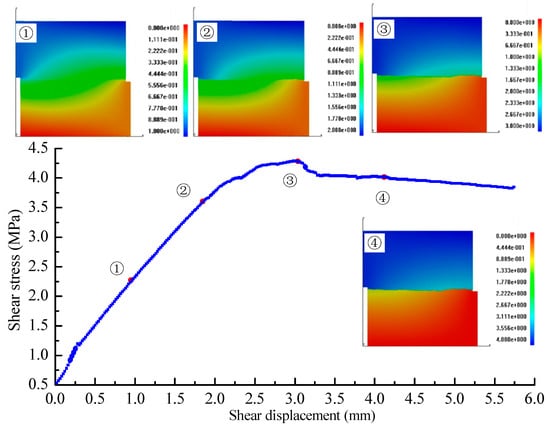
Figure 9.
Shear stress-shear displacement curve and displacement field of the numerical model for columnar joints.
After the mechanical parameters of different structures were calibrated in the numerical model, the parameters were assigned to various structural compositions according to I values obtained from the digital image in Table 1. Eventually, the numerical model was established, as shown in Figure 4b. In terms of the mechanical boundary, uniaxial compression was applied to the numerical model at 0.005 mm/step.
5. Mechanical and Failure Responses of CJRM
5.1. Damage Evolution in CJRM
In the RFPA code, when the damage variable (D) of elements under different stress levels reaches 1.0 × 10⁻⁵ MPa, the elements are considered as damaged. Moreover, the colors of elements under different damage degrees are shown in Table 4. As could be seen in this table, completely damaged elements are marked as white, while undamaged elements or elements with a high elastic modulus appear as blue-green. If an element is damaged or shows a low elastic modulus, the element color changes to red. When the element is completely damaged, its color changes to white [18]. Additionally, it is supposed that the acoustic emission (AE) count of the numerical model is proportional to the number of damaged elements. An AE event is defined when the elements in the model are damaged, and the model failure could be distinguished by color, that is, blue and red separately represent tensile failure and shear failure (Refer to Ref. [26] for more details).
Table 4.
Elements colors under different damage degree.
Figure 10 shows the failure evolution for the CJRM model (Group A) containing various defects in the case that the included angle (α) between the loading direction and the longitudinal direction of columns is 10°. It can be seen that, with increasing uniaxial stress, some columnar joints and steeply-dipping microcracks in CJRM crack first, and the columns become the main load-bearing structures in the rock mass. In this case, the stress in columns and tips of steeply-dipping microcracks increased. Fractures rapidly extend to the edge of columns and then intersect with the columnar joints, thus, causing the failure of basalt columns. Meanwhile, the initiation and propagation of low-angle microcracks are more difficult.
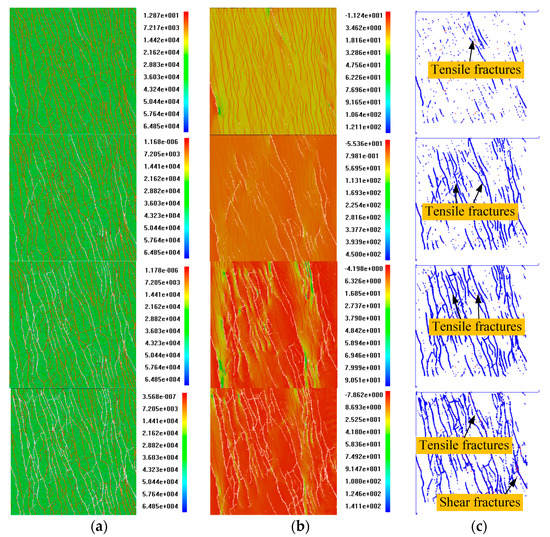
Figure 10.
Simulation results of the model containing microcracks and structural planes in the case of α = 10°: (a) Elastic modulus (MPa); (b) max principal stress (MPa); (c) acoustic emission (AE) events (blue: Tensile failure; red: Shear failure).
When α is 30° (Figure 11), the columnar joints cracks at first and the cracks constantly propagate with increasing stress. Different from the structural failure mode in the case of α = 0°, the columnar joints propagate directly across the structural planes when reaching them. In this group of models, due to the concentrated distribution of microcracks in columns, the included angle between microcracks and axial stress is large. As a result, initiation and propagation of microcracks are difficult in columns. Additionally, since the failure mainly occurs in columnar joints, the columnar structure in the rock mass is relatively intact.
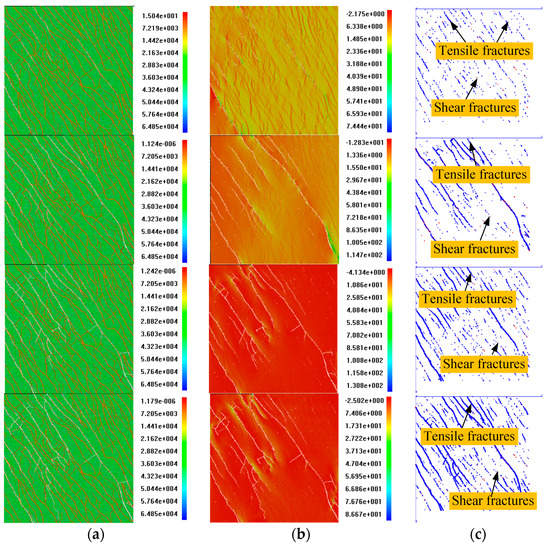
Figure 11.
Simulation results of the model containing microcracks and structural planes in the case of α = 30°: (a) Elastic modulus (MPa); (b) max principal stress (MPa); (c) AE events (blue: Tensile failure; red: Shear failure).
When α is 50° (Figure 12), since the included angle between the structural plane and loading direction is small, tensile failure of the structural planes occurs due to the crack propagation at first. With increasing stress, steeply-dipping microcracks in columns are damaged, and thus, cut the columns. Furthermore, the microcracks propagate and coalesce along the loading direction, and intersect the structural plane, causing the overall failure of CJRM. Under this situation, the columns exhibit tensile failure mode. The failures of structural plane and steeply-dipping microcracks are dominant in the rock mass. Additionally, due to the low dip angle of columnar joints, the columnar joints are subjected to tensile-shear failure.
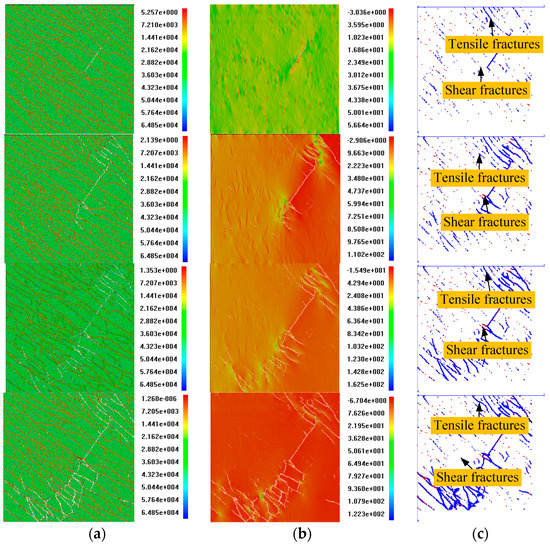
Figure 12.
Simulation results of the model containing microcracks and structural planes in the case of α = 50°: (a) Elastic modulus (MPa); (b) max principal stress (MPa); (c) AE events (blue: Tensile failure; red: Shear failure).
When α is 90° (Figure 13), the microcracks are highly concentrated, and the angle of the structural planes in basalt columns is the maximum. Under the effect of uniaxial compressive stress, the microcracks and structural planes are damaged firstly and cut through the columns, resulting in gradual decomposition of basalt columns. Moreover, the damaged microcracks coalesce with each other. Finally, tensile failure is dominant, causing the structural failure of the rock mass. In this case, due to the small angle of columnar joints, the damage and failure of the rock mass are caused mainly by shearing. Although columnar joints are regarded as the weakest part in the rock mass, their shear strength is still higher than the tensile strength of basalt columns, thus, hindered the crack propagation in CJRM to some extent.
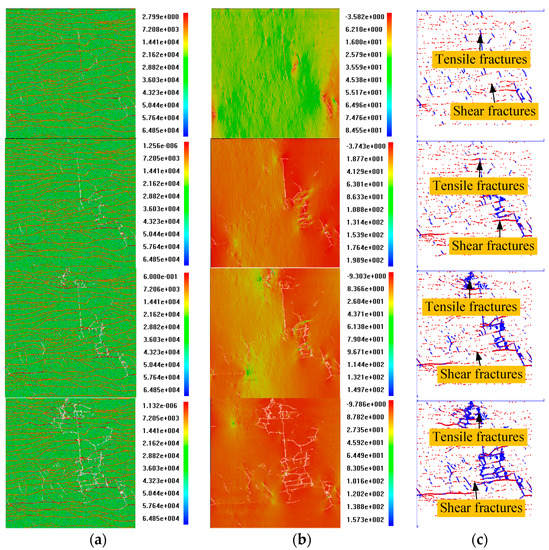
Figure 13.
Simulation results of the model containing microcracks and structural planes in the case of α = 90°: (a) Elastic modulus (MPa); (b) max principal stress (MPa); (c) AE events (blue: Tensile failure; red: Shear failure).
5.2. Influence of Microcracks on the Failure of CJRM
Figure 14 shows the simulation results of CJRM model in Group B without microcracks and structural planes. Figure 14a presents the failure mode in terms of elastic modulus of elements and Figure 14b,c present the max principal stress and AE records during the failure process. According to Figure 14, when the dip angle of columns is large, for example, α is 0°, columnar joints crack firstly in the loading process, and the load path shifts to basalt columns. With increasing stress, columns are gradually damaged. By comparing with the simulation results from Group A (Figure 10), the significantly different failure mode is observed: Small columns with a poor load-bearing capacity are damaged first, due to the irregular shapes of columns. Moreover, some columns with edges wedging in the longitudinal direction are subjected to wedge effects during loading, thus, causing the failure of neighboring columns. In another word, the failure of columns is dominant in this case, rather than propagation of microcracks. As a result, the strength of CJRM in Group A is lower, compared to Group B.
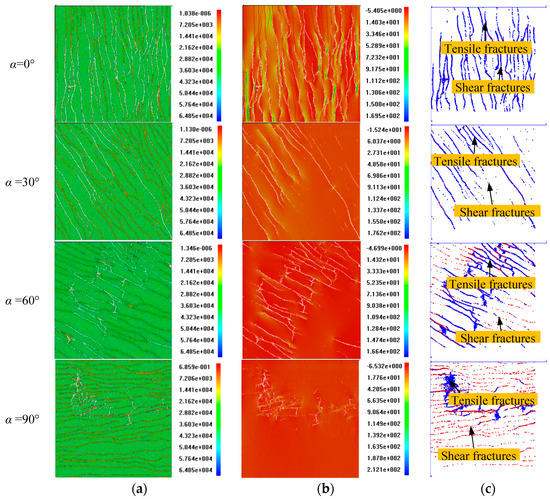
Figure 14.
Numerical simulation results of the model without microcracks and structural planes: (a) Elastic modulus (MPa); (b) max principal stress (MPa); (c) AE events (blue: Tensile failure; red: Shear failure).
When α is 20°, 30°, and 40°, the failure of the rock mass without microcracks is mainly caused by the tensile failure of columnar joints. Comparison with Figure 11 indicates that the failure of columnar joints in Group A is nearly the same as that in Group B. When α is 40°, the damaged columnar joints formed a stripe inclining from the top-right corner to the lower-left corner, but the columns involved are not damaged. In this case, the dominant failure still appears along the primary columnar joints, and the damaged primary joint plane is formed by overlapping of two columnar joints. In terms of the degree of damage, Group A is more significantly damaged in columnar joints, and cracks appear in some columns under pressure. The dominant failure along columnar joints determines that the strengths of CJRM under the two conditions are similar.
When α is 50° or 60°, the failure modes of Groups A and B are similar. Columnar joints in a strip inclining from the top-right corner are observed at first. Afterwards, the columns are damaged, followed by penetrating failure of the whole model. The difference lays in that the presence of microcracks and structural plane in Group A accelerates the damage and overall penetrating failure of columns, leading to significantly lower strength of Group A. When α increases to 70°, 80°, and 90°, the tensile failure occurred at the stress concentration of irregular cylinders and then caused the instability of the whole model.
In summary, the microcracks in columns along the predominant direction and penetrating structural planes have important influences on the failure mode of CJRM. For example, at low α, the steeply-dipping microcracks propagate readily and coalesce with the columnar joints, resulting in damage of the columns. At large α, in the model containing microcracks and structural planes, the failure of the rock mass is likely to develop into the overall penetrating failure. The basalt columns usually crack in areas of small column diameter and low bearing capacity, gradually leading to the damage of the whole rock mass.
5.3. Failure Characteristics of Generalised CJRM Model
Figure 15 shows the simulation results obtained by generalized CJRM model (Group C) in terms of elastic modulus, max principal stress and AE. Compared with Figure 14, it indicates that the overall failure modes and mechanisms of Groups B and C are similar except at the low included angle (α). However, significant differences can be observed in the damage evolution.
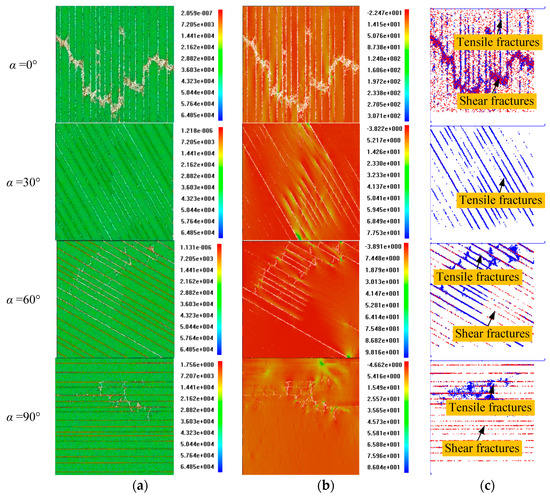
Figure 15.
Numerical simulation results of the generalized model: (a) Elastic modulus (MPa); (b) max principal stress (MPa); (c) AE events (blue: Tensile failure; red: Shear failure).
The failure of irregular columns mainly appears in areas with shape distortion, weak load-bearing capacity, and stress concentration. Additionally, the regular columns do not suffer from the feather edge problem. Therefore, local failure caused by wedge effects is not found. While α = 90°, the tensile cracks will appear in columns after the certain transverse strain and tensile strength are reached because of lower values of Poisson’s ratio compared to the columnar joint. The similar phenomenon could also be found in the literature [27]. In the case of a low included angle α, the regular columns also become the main load-bearing structure after cracks occur in columnar joints. The difference is that regular columns are uniformly stressed along the long axis and have the approximated peak strength. Therefore, the failure of the rock masses is mainly characterized by the failure of almost all columns, which does not conform to the failure characteristics found in situ.
5.4. Mechanical Properties
The structural characteristics have important influences on the mechanical properties of the rock mass [28,29,30]. In this section, the mechanical properties of CJRM with three different structures under uniaxial compressive stress are compared by numerical simulations.
5.4.1. Stress-Strain Curves
Figure 16 shows the stress-strain curves of three groups of CJRM models with different included angles α. The stress-strain curves of Group A exhibit significant non-linear characteristics in the vicinity of peak stress and post-peak stress stages. The slopes of curves in the pre-peak stress stage are constant, while drops abruptly in the post-peak stress stage. In contrast, the stress-strain curves of Group B show characteristics similar to Group A in the pre-peak stress stage, while the non-linearity is insignificant in the post-peak stress stage, approximating to a direct drop. For the stress-strain curves of Group C, insignificant non-linearity is observed both before and after the peak stress stages. The difference between three groups of stress-strain curves directly reflects the non-linear response of progressive caused by microcracks and irregular columns during failure evolution of the rock mass.
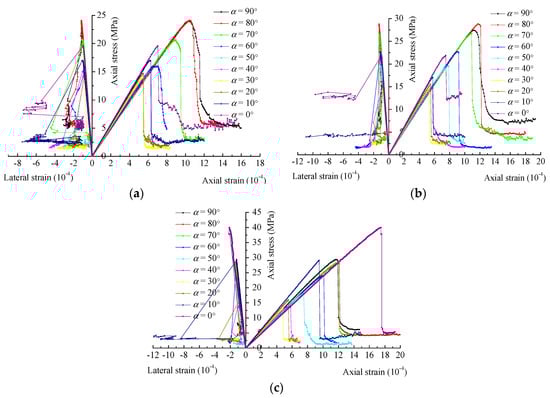
Figure 16.
Stress-strain curves of numerical models: (a) The model containing microcracks and structural planes; (b) the model without microcracks and structural planes; (c) the generalized model.
5.4.2. Peak Strength and Elastic Modulus
Figure 17a shows the variation of peak strength with the included angle α for the three groups of CJRM models. Generally, the three groups of numerical models all exhibit significant anisotropy in peak strength, that is, the peak strength shows a U-shaped change with increasing α, and the lowest peak strengths appear at α = 30°. The general variation trend is consistent with the test results in References [31,32].
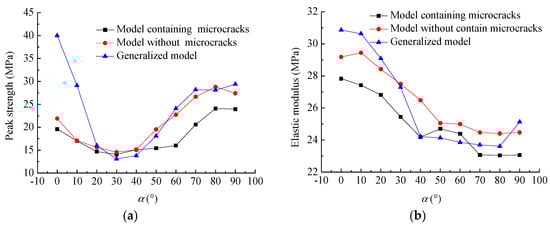
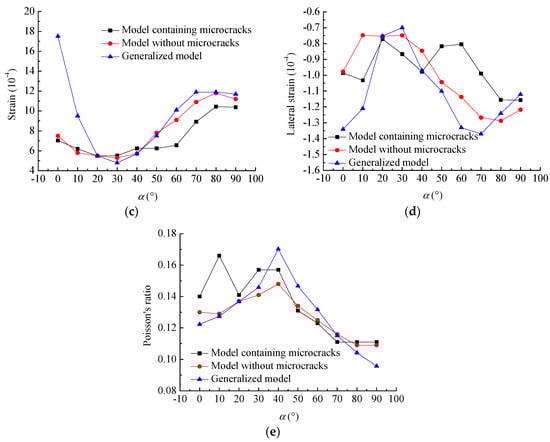
Figure 17.
Anisotropy of mechanical parameters: (a) Peak strength; (b) elastic modulus; (c) axial strain corresponding to peak strength; (d) lateral strain corresponding to peak strength; (e) Poisson’s ratio.
It is worth noting that the generalized CJRM model exhibits more significant anisotropy, as the presence of microcracks and irregular basalt columns actually weaken the orientation of structures in the rock mass, thus, reducing the anisotropy of the CJRM. Moreover, the peak strength of the rock masses in Group A is greatly lower than that in Group B, as the presence of some defects (including microcracks and structural planes) accelerates the failure of columns, and thus, reduces their strength. The maximum peak strength for Groups A and B models with different included angles (α) appears at α = 90°. However, the maximum peak strength of the generalized model in Group C occurs at α = 0°. On one hand, propagation of microcracks leads to early damage of columns. On the other hand, stress concentration occurs in irregular columns subjected to distortion, which also leads to early damage of columns. As a result, the CJRM has a low load-bearing capacity along the longitudinal direction of columns. However, in the transverse direction, the load-bearing capacity of columnar rocks is higher. By contrast, the strength characteristics of regular columns in Group C with different included angles are similar to those of a transversely isotropic rock mass. The strengths of all the models are similar when the included angle α is 20°, 30°, or 40°, respectively. In this case, the failure of CJRM is mainly controlled by columnar joints that have the same mechanical parameters and structural characteristics.
Figure 17b shows the variation of elastic modulus for the three groups of CJRM models with included angle α. The elastic modulus monotonically declines with increasing α. The columnar joints in the three groups of CJRM models exhibit weak strength, which is the main factor of controlling deformation. In the case of low α, the uniaxial stress on the model is mainly sustained by strong columnar structures and the overall deformation is insignificant. With the gradual increase of α, the model is deformed with a relatively lower elastic modulus of columnar joints.
5.4.3. Axial Strain, Lateral Strain, and Poisson’s Ratio Corresponding to Peak Strength
Figure 17c displays the variation of axial strain corresponding to peak strength for three groups of CJRM models with the included angle α. The strains corresponding to peak stresses exhibit significant anisotropy with varying α. However, the anisotropy of the generalized model is more remarkable, which conforms to the change of peak strength. The variations of lateral strain and Poisson’s ratio (Figure 17d,e) with the included angle α generally appear as an inverse-U shape, which has an opposite trend to peak strength and corresponding strain.
6. Discussions
By using RFPA code, the structural model (Group A) of Baihetan jointed rock masses, the models (Group B) without microcracks and structural plane and generalized model (Group C) of CJRM were separately established. Based on the simulation results, the mechanical response and failure characteristics of CJRM with different structures were analyzed. In this section, by combining the results of existing in situ tests, laboratory tests on reconstructed models and numerical simulations, the influences of different structures on stress concentration effect and failure mode of CJRM are compared.
The figures of max principal stress for each numerical model were also presented from Figure 10 to Figure 15. As could be seen in these figures, the stress concentration areas are quite different because of the different structures of CJRM. For the irregular CJRM with microcracks, the stress concentration areas are determined by both structures of columnar joints and microcracks because these structures are the defects of CJRM. For an irregular model of CJRM without microcracks, the stress concentration areas always exhibited in the turning points of the columnar joint. For the regular CJRM model, the areas of columnar joints are always as the stress concentration regions.
Figure 18 shows the failure modes of CJRM obtained through in situ tests when the basalt columns are vertical (α = 0°) [12]. Figure 18a shows a typical specimen for in situ experiments, while Figure 18b shows the overall failure mode. It can be seen that the failure mode of CJRM specimen is relatively complex. It involves not only the cracking of basalt columns under uniaxial stress, but also spalling of rock fragments on the specimen surfaces, due to the combined failure of columnar joints and microcracks in basalt columns. Figure 18c,d display the failure characteristics of transverse and longitudinal sections of CJRM, respectively. It can be seen from Figure 18c that failure occurs along the columnar joints. Meanwhile, cracks are found on the zones of Nos. #6, #10, #11, and #12 basalt columns. Similarly, it can be seen from Figure 18d that the microcracks exhibit a great influence on specimen failure and rock fragmentation occurs on the specimen surface. By comparing the results of in situ tests (Figure 18) and numerical simulations (Figure 10), it can be seen that the irregularity of basalt columns, microcracks, structural planes, etc. are fully taken into account in numerical simulations. Thus, the simulation results are favorably consistent with those obtained by in situ tests.
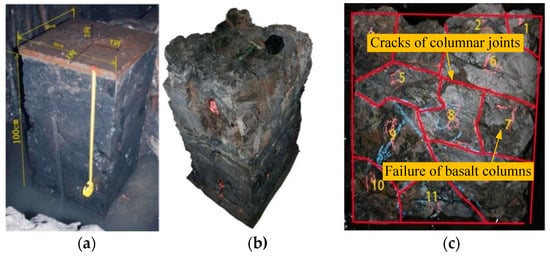
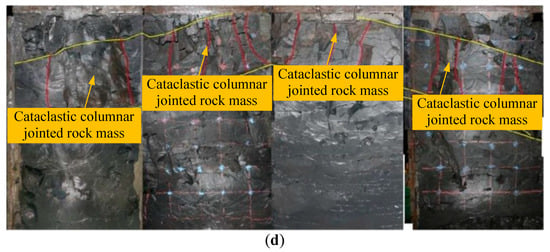
Figure 18.
Failure modes of columnar jointed basalt during in situ testing [12]: (a) Preparation of in situ test specimens; (b) the overall failure mode of CJRM during in situ testing; (c) failure characteristics of transverse section; (d) failure characteristics of the longitudinal section.
Figure 19 shows the failure modes of reconstructed CJRM specimens with different included angles α under uniaxial compression in the laboratory [33]. It can be seen that, for reconstructed CJRM specimens with different included angles, the specimens are cracked along the columnar joints, while the structural failure of columns is rare. On one hand, the irregularity of columns is not taken into account in the reconstructed specimens. Instead, the columns are directly generalized into a regular shape. On the other hand, some defects (such as microcracks and structural planes) in columns are not considered. Therefore, the failure mode of these reconstructed CJRM specimens are different from that obtained through in situ testing, but consistent with the simulation result of the generalized CJRM model, as shown in Figure 15.
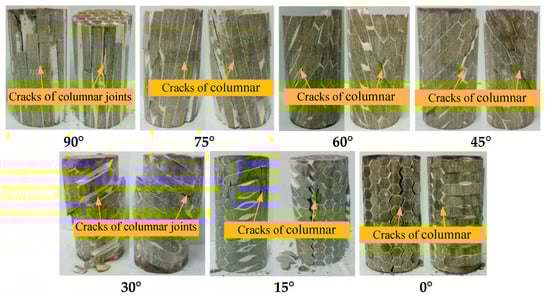
Figure 19.
Failure modes of reconstructed CJRM specimens with different dips angles [33].
Figure 20 shows the failure mode of CJRM with different dip angles simulated by 3 dimensional distinct element code (3DEC) modelling [12]. When the dip angle of the columnar structure is in the range of 0°~20°, the CJRM is damaged, due to the tensile failure of columnar joints. When the dip angle ranges from 30° to 80°, shear failure of columnar joints is dominant in CJRM. Moreover, if the dip angle of the columnar structure is 90°, tensile failure of columnar joints is dominant in CJRM. In 3DEC modeling, the irregular columns of CJRM and the influence of various defect structures (including microcracks and structural planes) on the failure of the rock mass are not taken into account. As a result, the failure mode obtained by 3DEC modeling differs significantly from the in situ test result, but conforms to the generalized model, as shown in Figure 15. By comparing the simulation results (Figure 12, Figure 13, Figure 14 and Figure 15) with failure mode of CJRM during in situ testing, it can be seen that irregularity of columns and some special structural forms (including microcracks and structural planes) of CJRM are fully taken into account. Therefore, the simulation result concerning the failure mode of CJRM matches actual result better. This favorably reflects the significant influence of structural characteristics on the failure mode of CJRM. In contrast, when the realistic structure of CJRM is ignored, the failure characteristics and mechanical properties of CJRM obtained by laboratory tests and numerical simulations differ from the real situation.
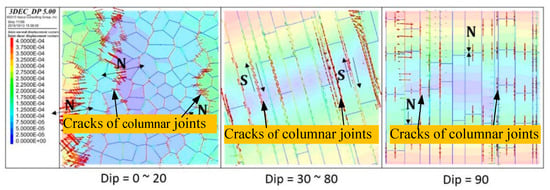
Figure 20.
The failure mode of CJRM obtained by 3 dimensional distinct element code (3DEC) modeling [12] (N for normal joint displacement, S for joint shear displacement).
7. Conclusions
By using the sampling window method, the typical CJRM structures at Baihetan hydropower station were analyzed. On this basis, the structural models (Group A) containing microcracks and structural planes, the numerical models (Group B) without microcracks and structural planes, and generalized models (Group C) for CJRM were established by using RFPA code. The mechanical behaviors of the three groups of models under uniaxial compression were simulated and compared. Moreover, by comparing the simulation results with those obtained through the existing in situ tests, laboratory tests on reconstructed models, and other numerical simulations, the main conclusions can be drawn as follows.
(1) The CJRM structure is more complex than the generalized structure used in laboratory tests or numerical simulations. The CJRM consists of columns, columnar joints, microcracks in columns, and structural planes. Moreover, the shape of columns is irregular along the longitudinal direction, with non-uniform thickness and varying degrees of bending. The columnar joints are rough, and microcracks exhibit certain orientation.
(2) Microcracks and structural planes have an important influence on the failure characteristics and mechanical properties of CJRM. The propagation of microcracks led to early damage of columns, resulting in a decrease of overall load-bearing capacity, and consequently causing fractures in the rock mass during failure. When the included angle between the structural planes and applied uniaxial stress was large, the defect structure can prevent crack propagation of the rock mass. When the included angle was small, or even equal to zero, the failure of defect structure was dominant and finally led to the failure of the whole rock mass.
(3) Irregular basalt columns can prevent crack propagation in columnar joints. As a result, stress concentration occurred in areas where columns underwent shape distortion and early damage took place in these areas, thus, influencing the overall load-bearing capacity of CJRM.
(4) The mechanical properties of CJRM exhibited significant anisotropy, which was greatly influenced by structural characteristics. When the included angle α was small (< 20°), the strength of CJRM with generalized structure was significantly higher than that of the actual rock mass. When the included angle α ranged from 20° to 40°, the strength of CJRM was not significantly influenced by such structures, but was mainly controlled by the strength of the columnar joints. When the included angle α was greater than 40°, the strength of primary CJRM was less than those of the rock masses without microcracks or generalized structure.
Author Contributions
The simulations about CJRM were carried out by Y.X. and C.Z. (Chuanqing Zhang), who were also responsible for writing the manuscript of this paper. H.Z. and C.Z. (Chunsheng Zhang) conducted analysis and guidance, who also revised the manuscript critically. W.H. is in charge of data statistics and analysis, and provides technical guidance.
Funding
This research was funded by the National Science Foundation of China (Grant Nos. 41807269, U1865203 and 51427803). The work presented in this paper was also supported by the China Postdoctoral Science Foundation (Grant No. 2018M642959) and the Open Projects of the Research Centre for Safe Mining and Clean Utilization of Coal Resources, Liaoning Province (Grant No. LNTU17KF12).
Conflicts of Interest
The authors declare no conflict of interest.
References
- Fan, Q.; Feng, X.T.; Weng, W.L.; Fan, Y.L.; Jiang, Q. Unloading performances and stabilizing practices for columnar jointed basalt. JRMGE 2017, 9, 1041–1053. [Google Scholar]
- Ng, K.L.A.; Small, J.C. Behavior of joints and interfaces subjected to water pressure. Comput. Geotech. 1997, 20, 71–93. [Google Scholar] [CrossRef]
- Xia, Y.J.; Zhou, H.; Zhang, C.Q.; He, S.H.; Gao, Y.; Wang, P. The evaluation of rock brittleness and its application: A review study. Eur. J. Environ. Civ. Eng. 2019. [CrossRef]
- Mu, W.Q.; Li, L.C.; Yang, T.H.; Yu, G.F.; Han, Y.C. Numerical investigation on grouting mechanism with slurry-rock coupling and shear displacement in single rough fracture. Bull. Eng. Geol. Environ. 2019. [Google Scholar] [CrossRef]
- Shan, Z.G.; Di, S.J. Loading-unloading test analysis of anisotropic columnar jointed basalts. J. Zhejiang Univ. Sci. A 2013, 14, 603–614. [Google Scholar] [CrossRef]
- Jiang, Q.; Feng, X.T.; Hatzor, Y.H.; Hao, X.J.; Li, S.J. Mechanical anisotropy of columnar jointed basalts: An example from the Baihetan hydropower station. China Eng. Geol. 2014, 175, 35–45. [Google Scholar] [CrossRef]
- Jin, C.Y.; Yang, C.X.; Fang, D.; Xu, S.A. Study on the failure mechanism of basalts with columnar joints in the unloading process on the basis of an experimental cavity. Rock Mech. Rock Eng. 2015, 48, 1–14. [Google Scholar] [CrossRef]
- Jin, C.Y.; Li, S.G.; Liu, J.P. Anisotropic mechanical behaviors of columnar jointed basalt under compression. Bull. Eng. Geol. Environ. 2016, 77, 1–14. [Google Scholar] [CrossRef]
- Santarsiero, M.; Bedon, C.; Louter, C. Experimental and numerical analysis of thick embedded laminated glass connections. Compos. Struct. 2018, 188, 242–256. [Google Scholar] [CrossRef]
- Zhu, Z.D.; Qin, T.H.; Wang, S.H.; Wang, L.G.; Sun, L.Z. Study of anisotropic constitutive model of columnar jointed rock masses based on Cosserat theory. Chin. J. Rock Mech. Eng. 2010, 29, 4068–4076. (In Chinese) [Google Scholar]
- Wang, P.T.; Ren, F.H.; Miao, S.J.; Cai, M.F.; Yang, T.H. Evaluation of the anisotropy and directionality of a jointed rock mass under numerical direct shear tests. Eng. Geol. 2017, 225, 29–41. [Google Scholar] [CrossRef]
- Hou, J.; Shi, A.C.; Jiang, Y.L. High stress fracture problem and control measures of brittle rock mass in western hydropower project. China Hydropower Electr. Consult. Corp. 2017, 1, 20–500. (In Chinese) [Google Scholar]
- Barton, N. Review of a new shear-strength criterion for rock joints. Eng. Geol. 1973, 7, 287–332. [Google Scholar] [CrossRef]
- Barton, N. Shear strength criteria for rock, rock joints, rockfill and rock masses: Problems and some solutions. J. Rock Mech. Geotech. Eng. 2013, 5, 249–261. [Google Scholar] [CrossRef]
- Xia, Y.J.; Zhang, C.Q.; Zhou, H.; Chen, J.L.; Gao, Y.; Liu, N.; Chen, P.Z. Structural characteristics of columnar jointed basalt in drainage tunnel of Baihetan hydropower station and its influence on the behavior of P-wave anisotropy. Eng. Geol. (accepted; in press).
- Yu, Q.L.; Yang, S.Q.; Ranjith, P.G.; Zhu, W.C.; Yang, T.H. Numerical modeling of jointed rock under compressive loading using X-ray computerized tomography. Rock Mech. Rock Eng. 2016, 49, 877–891. [Google Scholar] [CrossRef]
- Zhu, W.C.; Liu, J.; Yang, T.H.; Sheng, J.C.; Elsworth, D. Effects of local rock heterogeneities on the hydromechanics of fractured rocks using a digital-image-based technique. Int. J. Rock Mech. Min. Sci. 2006, 43, 1182–1199. [Google Scholar] [CrossRef]
- Wang, S.Y.; Sloan, S.W.; Tang, C.A. Three-dimensional numerical investigations of the failure mechanism of a rock disc with a central or eccentric hole. Rock Mech. Rock Eng. 2014, 47, 2117–2137. [Google Scholar] [CrossRef]
- Liang, Z.Z.; Xing, H.; Wang, S.Y.; Williams, D.J.; Tang, C.A. A three-dimensional numerical investigation of the fracture of rock specimens containing a pre-existing surface flaw. Comput. Geotech. 2012, 45, 19–33. [Google Scholar] [CrossRef]
- Li, Z.C.; Li, L.C.; Li, M.; Zhang, L.Y.; Zhang, Z.L.; Huang, B.; Tang, C.A. A numerical investigation on the effects of rock brittleness on the hydraulic fractures in the shale reservoir. J. Nat. Gas Sci. Eng. 2018, 50, 22–32. [Google Scholar] [CrossRef]
- Li, G.; Tang, C.A. A statistical meso-damage mechanical method for modeling trans-scale progressive failure process of rock. Int. J. Rock Mech. Min. Sci. 2015, 74, 133–150. [Google Scholar] [CrossRef]
- Li, L.; Xia, Y.; Huang, B.; Zhang, L.; Li, M.; Li, A. The behaviour of fracture growth in sedimentary rocks: A numerical study based on hydraulic fracturing processes. Energies 2016, 9, 169. [Google Scholar] [CrossRef]
- Wang, S.Y.; Lam, K.C.; Au, S.K.; Tang, C.A.; Zhu, W.C.; Yang, T.H. Analytical and numerical study on the pillar rockbursts mechanism. Rock Mech. Rock Eng. 2006, 39, 445–467. [Google Scholar] [CrossRef]
- Weibull, W.A. A statistical distribution function of wide applicability. J. Appl. Mech. 1951, 18, 293–297. [Google Scholar]
- Tang, C.A. Numerical simulation of progressive rock failure and associated seismicity. Int. J. Rock Mech. Min. Sci. 1997, 34, 249–261. [Google Scholar] [CrossRef]
- Tang, C.A.; Kaiser, P.K. Numerical simulation of cumulative damage and seismic energy release during brittle rock failure—Part I: Fundamentals. Int. J. Rock Mech. Min. Sci. 1998, 35, 113–121. [Google Scholar] [CrossRef]
- Amann, F.; Thoeny, R.; Button, E.A.; Kaiser, P.K. Insight into the brittle failure behavior of clay shales in unconfined and confined compression. J. Polym. Sci. Pol. Chem. 2011, 37, 1979–1986. [Google Scholar]
- Chen, C.S.; Pan, E.; Amadei, B. Determination of deformability and tensile strength of anisotropic rock using Brazilian tests. Int. J. Rock Mech. Min. Sci. 1998, 35, 43–61. [Google Scholar] [CrossRef]
- Cho, J.W.; Kim, H.; Jeon, S.; Min, K.B. Deformation and strength anisotropy of Asan gneiss, Boryeong shale, and Yeoncheon schist. Int. J. Rock Mech. Min. Sci. 2012, 50, 158–169. [Google Scholar] [CrossRef]
- Wang, M.M.; Li, P.; Wu, X.W.; Chen, H.R. A study on the brittleness and progressive failure process of anisotropic shale. Environ. Earth Sci. 2016, 75, 1–7. [Google Scholar] [CrossRef]
- Saroglou, H.; Tsiambaos, G. A modified Hoek–Brown failure criterion for anisotropic intact rock. Int. J. Rock Mech. Min. Sci. 2008, 45, 223–234. [Google Scholar] [CrossRef]
- Fjær, E.; Nes, O.M. The impact of heterogeneity on the anisotropic strength of an outcrop shale. Rock Mech. Rock Eng. 2014, 47, 1603–1611. [Google Scholar] [CrossRef]
- Ji, H.; Zhang, J.C.; Xu, W.Y.; Wang, R.B.; Wang, H.L.; Yan, L.; Lin, Z.N. Experimental investigation of the anisotropic mechanical properties of a columnar jointed rock mass: Observations from laboratory-based physical modelling. Rock Mech. Rock Eng. 2017, 50, 1–13. [Google Scholar] [CrossRef]
© 2019 by the authors. Licensee MDPI, Basel, Switzerland. This article is an open access article distributed under the terms and conditions of the Creative Commons Attribution (CC BY) license (http://creativecommons.org/licenses/by/4.0/).