Article

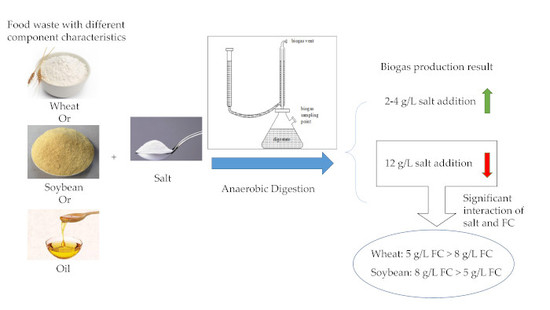
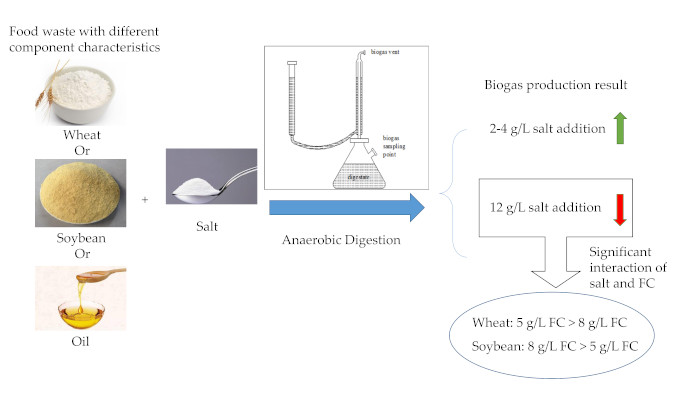
Effects of Salt on Anaerobic Digestion of Food Waste with Different Component Characteristics and Fermentation Concentrations

1
Faculty of Geosciences and Environmental Engineering, South-West Jiaotong University, Chengdu 611756, China
2
Institute for Sanitary Engineering, Water Quality and Solid Waste Management, University of Stuttgart, 70569 Stuttgart, Germany
*
Author to whom correspondence should be addressed.
Energies 2019, 12(18), 3571; https://doi.org/10.3390/en12183571
Submission received: 16 August 2019 / Revised: 13 September 2019 / Accepted: 15 September 2019 / Published: 18 September 2019
(This article belongs to the Section A4: Bio-Energy)

Abstract

:
Effects of salt on anaerobic digestion are dosage-dependent. As salt is a widely used condiment in food processing, effects of salt are bound to be considered when food waste is digested. In this study, salt addition effects (0, 2, 4, 6, 9, 12 g∙L−1) on biogas and methane yields and kinetics of biogas production were researched. Meanwhile, component characteristics (food waste featured in carbohydrate, protein and fat, respectively) and fermentation concentrations (5 and 8 gVS∙L−1) were also taken into consideration. Results showed that 2–4 g∙L−1 salt addition was the optimal addition dosage for AD systems as they not only have the maximum biogas and methane yields, but also the maximum vs. removal in most cases. Also, according to the results of a modified Gompertz model, which is used to predict biogas and methane production rates, suitable salt addition can accelerate biogas production, improving the maximum biogas production rate (Rmax). Factorial design (2 × 2) proved that interaction of salt and fermentation concentrations was significant for food waste featured with carbohydrate and with protein (p < 0.05). High salt addition and fermentation concentration can break the AD system when the feeding material was food waste featured with carbohydrate, but for food waste featured with protein, interaction of fermentation concentrations and salt addition can alleviate inhibition degrees.

Graphical Abstract

1. Introduction

Considerable amounts of food waste are discharged annually; it is estimated that 1.3 billion tons of food waste were produced in 2018 globally and the amount of food waste could keep increasing in the next 20 years [1,2]. Without proper treatment, food waste may cause many problems, such as bad odors and the emission of greenhouse gases. Among all the methods, anaerobic digestion (AD) is considered as a good option for organic waste treatment, as the products of AD are biogas and digestate. Biogas can be used to generate electricity and heat and digestate can be used as fertilizer [3].
Salt mentioned in this article refers to table salt, which is a widely used food flavoring agent and its content in food is between 2% and 5% in mass fraction [4]. The main composition of salt in China is NaCl, taking up more than 97%, and the corresponding sodium content is 39% approximately [5]. Sodium is necessary for AD, as it plays an important role in cell synthesis, cell growth and metabolism related to the AD process [6]. Approximately 350 mg∙L−1 Na+ was reported as the optimal concentration for mesophilic hydrogentrophic methanogens and methane production [7]. For mesophilic aceticlastic methanogens, the optimal Na+ concentration was found to be 230 mg∙L−1 for acetate utilization [8]. Meanwhile, salt addition could improve the solution of carbohydrate and protein, which are the main organic parts of food waste [9]. When NaCl concentration increased from 0 to 0.5 mol∙L−1, soluble carbohydrate and protein in digestate increased from 15 to 115 mg(COD)∙L−1 and 60 to 500 mg(COD)∙L−1, respectively, after 32 days of AD [10]. It could be reasoned that as the main constituents of extracellular polymeric substances, carbohydrate and protein are absorbed on the surface of microorganisms by Ca2+ and Mg2+ [11]. With the presence of NaCl, Ca2+ and Mg2+ could be exchanged by Na+, resulting in the enhancement of carbohydrate and protein releasing. As reported, salt could improve the dissolution of the organic part, which is considered as the rate-limiting step in anaerobic digestion; it is assumed that suitable salt addition can accelerate biogas production [12,13,14]. However, until now, few studies have discussed the effect of salt or sodium on AD from a kinetics view. In order to fill this gap, a well-fitting kinetics model, the modified Gompertz model, was applied in this research to figure out the influence from salt on biogas production kinetics [3,15,16,17].
When the concentration of sodium is too high, the activity of microbes would be impacted, and their metabolism would also be restrained to some degree. The inhibition phenomenon from Na+ appeared as Na+ concentration ranged between 3.5 and 5.5 g∙L−1 and more than 8 g∙L−1 Na+ strongly suppressed methane production at mesophilic temperatures [18]. Another study reported that if the concentration of sodium was raised to 5.6–53 g∙L−1, AD would be inhibited [19]. During the AD process of food waste, 2 g∙L−1 salt addition (approx. 0.78 g∙L−1 Na+) brought evident inhibition effects on methane production [6]. With the AD of waste-activated sludge, results have also shown that 0.05 mol∙L−1 salt addition halved methane production. Meanwhile, compared with bacteria, methanogens are more vulnerable to salt addition, according to fluorescence in-situ hybridization analysis [10]. It can be seen that there is a considerable difference of salt concentration when inhibition phenomenon on AD process appeared. The difference could be attributed to several factors: differences in sensitivity between different species of microorganisms, and antagonistic and synergistic effects from the presence of other cations [8,20]. Meanwhile, there is a considerable difference of biogas and methane yields from food waste with different components or from different sources. Eight different organic waste steams were examined for 30d biochemical methane potential (BMP), and food waste collected in a commercial canteen during the summer had the highest BMP [3]. Several kinds of agricultural and food processing by-products (AFPBPs) were used to study their AD behaviors and the results showed that their carbohydrate, protein and fat contents affected their biogas productivity and degradation rates [15]. Nevertheless, until now, few studies had focused on the difference of salt inhibition degree on AD of food waste with different component characteristics. Considering that the organic part of food waste consists of three kinds of material, which are carbohydrate, protein and fat, high carbohydrate food waste (HCFW), high protein food waste (HPFW) and high fat food waste (HFFW) were used as feeding material to research their AD behavior with salt inhibition [9].Furthermore, on the one hand, it is known that salt improves the production of volatile fatty acids (VFA), important intermediates in AD process, and the accumulation of VFA can inhibit AD process [10,19]. On the other hand, the accumulation of VFA is more evident under higher fermentation concentration (FC) [21]. Thus, FC was also taken into consideration in this research.
Overall, the objectives of this study were to research the effects of salt addition on AD of food waste, especially paying attention to biogas production kinetics with low salt addition and the difference of inhibition degree on AD of food waste with different component characteristics and FC with high salt addition.

2. Materials and Methods

2.1. Test Substrate

In this research, milled wheat, skimmed soybeans and edible sunflower oil were used to simulate HCFW, HPFW and HFFW, respectively. Wheat and oil were produced by Kaufland Corporation. Skimmed soybeans were bought online from Stadtmühle Waldenbuch and had been skimmed by the seller. They were then grinded by a mill produced by Fritsch (serial number is 09.203.348) into powder with the size less than 2 mm before being taken as substrate. The main characteristics of them were in Table 1.
It can be seen that carbohydrate content of wheat, protein content of skimmed soybeans and fat content of oil took up 84.8%, 71.4% and 100.0% respectively, which can be considered as HCFW, HPFW and HFFW [15].
Inoculum was the digestated sludge, which was taken from an anaerobic digester in a municipal wastewater treatment plant of Institut für Siedlungswasserbau, Wassergüte-und Abfallwirtschaft (ISWA), Germany. Sludge was put into a temperature-controlled chamber under 36 °C in the absence of oxygen for one week before utilization, in order to consume organic matter. The main characteristics of inoculum are shown in Table 1. Although the species of microorganisms in inoculum had not been identified, one fact that can be sure was that there existed no pre-acclimation of inoculum to high salinity condition and the salt concentration in inoculum was only 0.5 g∙kg−1 (Table 1). Meanwhile, considering that the effects of salt immensely depended on the presence of other cations in the inoculum, detailed information of cations’ concentration of inoculum was listed in Table A1. As the inoculum was from the same batch and the concentrations of cations were not changed artificially, they would be considered identically in this study. As the result, although the presence of cations may cause antagonism or synergism and influence salt effects on AD, it would not be discussed in this paper [8,20].

2.2. Experimental Set-Up

The experiments were carried out at 35.5 ± 0.5 degree Celsius, which results in mesophilic AD. Bottles whose total and working volumes are 500 mL and 300 mL were used in the experiments. Six different levels of salt addition (0, 2, 4, 6, 9, 12 g∙L−1) were chosen to be tested under two levels of FC (5 and 8 gVS∙L−1). After corresponding dosages of salt and feeding materials were put in each bottle, 150 mL inoculum was added and an amount of water was injected to let the test material reach 300 mL. For example, for the case of HCFW, when the test condition was 2 g∙L−1, salt addition and 5 gVS∙L−1 FC, 0.60 g salt and 1.67 g milled wheat (for the case of HPFW and HFFW, here was 1.81 g skimmed soybeans and 1.5 g edible sunflower oil respectively) was put into one bottle, followed by 150 mL inoculum and then, water was injected until test material reach 300 mL. As a result, the ratio between feeding material and inoculum (F/I) for 5 and 8 gVS∙L−1 FC was 0.52 and 0.83, respectively, which was in the range of 0.5 and 2, recommended by [22]. Considering the TS content of all cases were between 6.5 and 10.5 gTS∙L−1, the test could be considered as wet AD [23]. A batch test containing inoculum only was conducted as a blank test and another test was carried out with cellulose as a standard test. Proper dosage of 4.0 M hydrochloric acid was added to make the pH in all reactors 7.0 ± 0.5, which was the optimal pH for microbes [24]. Biogas produced from standard test (560.28 mL∙g−1VS) was 74.86% of theoretical biogas yield (748.41 mL∙g−1VS). All cases were operated in duplicate with 21-day digestion time and then, TS, VS, NH4+, FOS/TAC, pH and conductivity of digestate were measured.

2.3. Analytical Methods and Calculation

TS and VS were measured based on standard methods [25]. pH was determined with a digital pH meter (CG819, SCHOTT, Mainz, Germany). Total inorganic carbon (TIC) and volatile organic acids (VOA) were analyzed using 0.05M H2SO4 to titrate with endpoints of pH 5.0 and 4.4 [26]. Elements (C, H, N) were analyzed by an elemental analyzer, vario MAX CHN, produced by Analysensysteme GmbH, Langenselbold, Germany. NH4+ was determined with product 1.16977.001 produced by Replectoquant Company. Salt content was determined by testing the conductivity of the mixture of 20 g sample and 200 mL distilled water [27]. The relationship between NaCl concentration and conductivity was found with the building of a standard curve (Table A2). Total ammonia nitrogen (TAN) has two forms, NH4+-N and NH3-N, which were calculated according to Equations (1) and (2), respectively [28]:
NH 4 + - N = NH 4 + × 0.776
NH 3 - N = NH 4 + - N × 10 pH e ( 6344 273 + T ) + 10 pH
Daily biogas yield was measured by displacing solution, which was composed of 170 g Na2SO4, 30 mL H2SO4 and 900 mL H2O. Then 4 mg methyl red indicator was added to per liter of solution. The results were transferred to standard condition (0 °C, 101.325 kPa) based on Clausius–Clapeyron relation. Composition of biogas was analyzed by gas chromatography, produced by Bodenseewerk Perkin-Elmer GmbH, Ueberlingen, Germany.
VS removal rate was calculated according to the Equation [15]:
VS removal ( % ) = ( F + I ) × a I × b F × 100
where F = total VSfeed added to reactor (g); I = total VSinoculum added to reactor (g); a = calculated vs. removal of feed plus inoculum based on total initial and final mass of vs. present in the reactor (%); b = calculated vs. removal of inoculum in blank reactor (%).
Sodium addition and concentration in each test was calculated. As NaCl taking up at least 97% of table salt, 1 g table salt has approximate 0.39 g Na+ [5]. The concentration of sodium in digestate is calculated based on Equation (4):
C s = C i × L i + C w × L w + m s a + m s s L i + L w × 0.39
where C i and C w are the concentrations of salt in inoculum and water, respectively; L i and L w are the volume of inoculum and water put into the reactor, respectively; m s a is the mass of salt supplied into the digestate and m s s is the mass of salt in skimmed soybeans. The calculation result is in Table A3.
Theoretical biogas production (TBP) was calculated with stoichiometric conversion of organic matter: TBP (mL∙g−1VS) = 750 carbohydrates (%VS) + 800 proteins (%VS) + 1390 fat (%VS) [29]. As a result, TBP of HCFW, HPFW and HFFW was 794.83 mL∙g−1 VS, 779.64 mL∙g−1VS, and 1390.00 mL∙g−1VS, respectively.
Inhibition degree was used to describe the adverse impact on biogas yield from high salt addition.
Inhibition degree ( % ) = ( 1 biogas yield without salt addition biogas yield with high salt addition ) × 100 %

2.4. Kinetic Model

Gompertz model, which can predict cumulative biogas yield and production rate based on Equaiton (5), was employed to calculate biogas production rate of each reactor [3,15,30].
Y ( t ) = Y m a x exp exp R m a x e Y m a x ( λ t ) + 1
where Y(t) is the cumulative biogas yield at time t (mL∙g−1VS); Ymax is the potential maximum biogas yield (mL∙g−1VS); Rmax is the maximum biogas production rate (mL∙g −1VS∙d−1); λ is the lag phase (d); t is the duration of the test (d) and e is 2.7183.
All of these parameters, i.e., Ymax, Rmax, λ and R2, were determined with nonlinear least-square regression analysis using Matlab R2010b.

2.5. Statistical Analysis

In order to research the significance of interaction effect on biogas yields from salt addition and FC, 2 × 2 factorial design was utilized, calculated by Origin 8.0 [31]. Here, 2 × 2 factorial design means the factorial design had two factors and two levels for each factor. As FC had two levels, namely, 5 and 8 gVS∙L−1, only two levels of salt addition were chosen correspondingly and in order to research the inhibition effects from salt, two levels of salt addition were 0 and 12 g∙L−1.

3. Results and Discussion

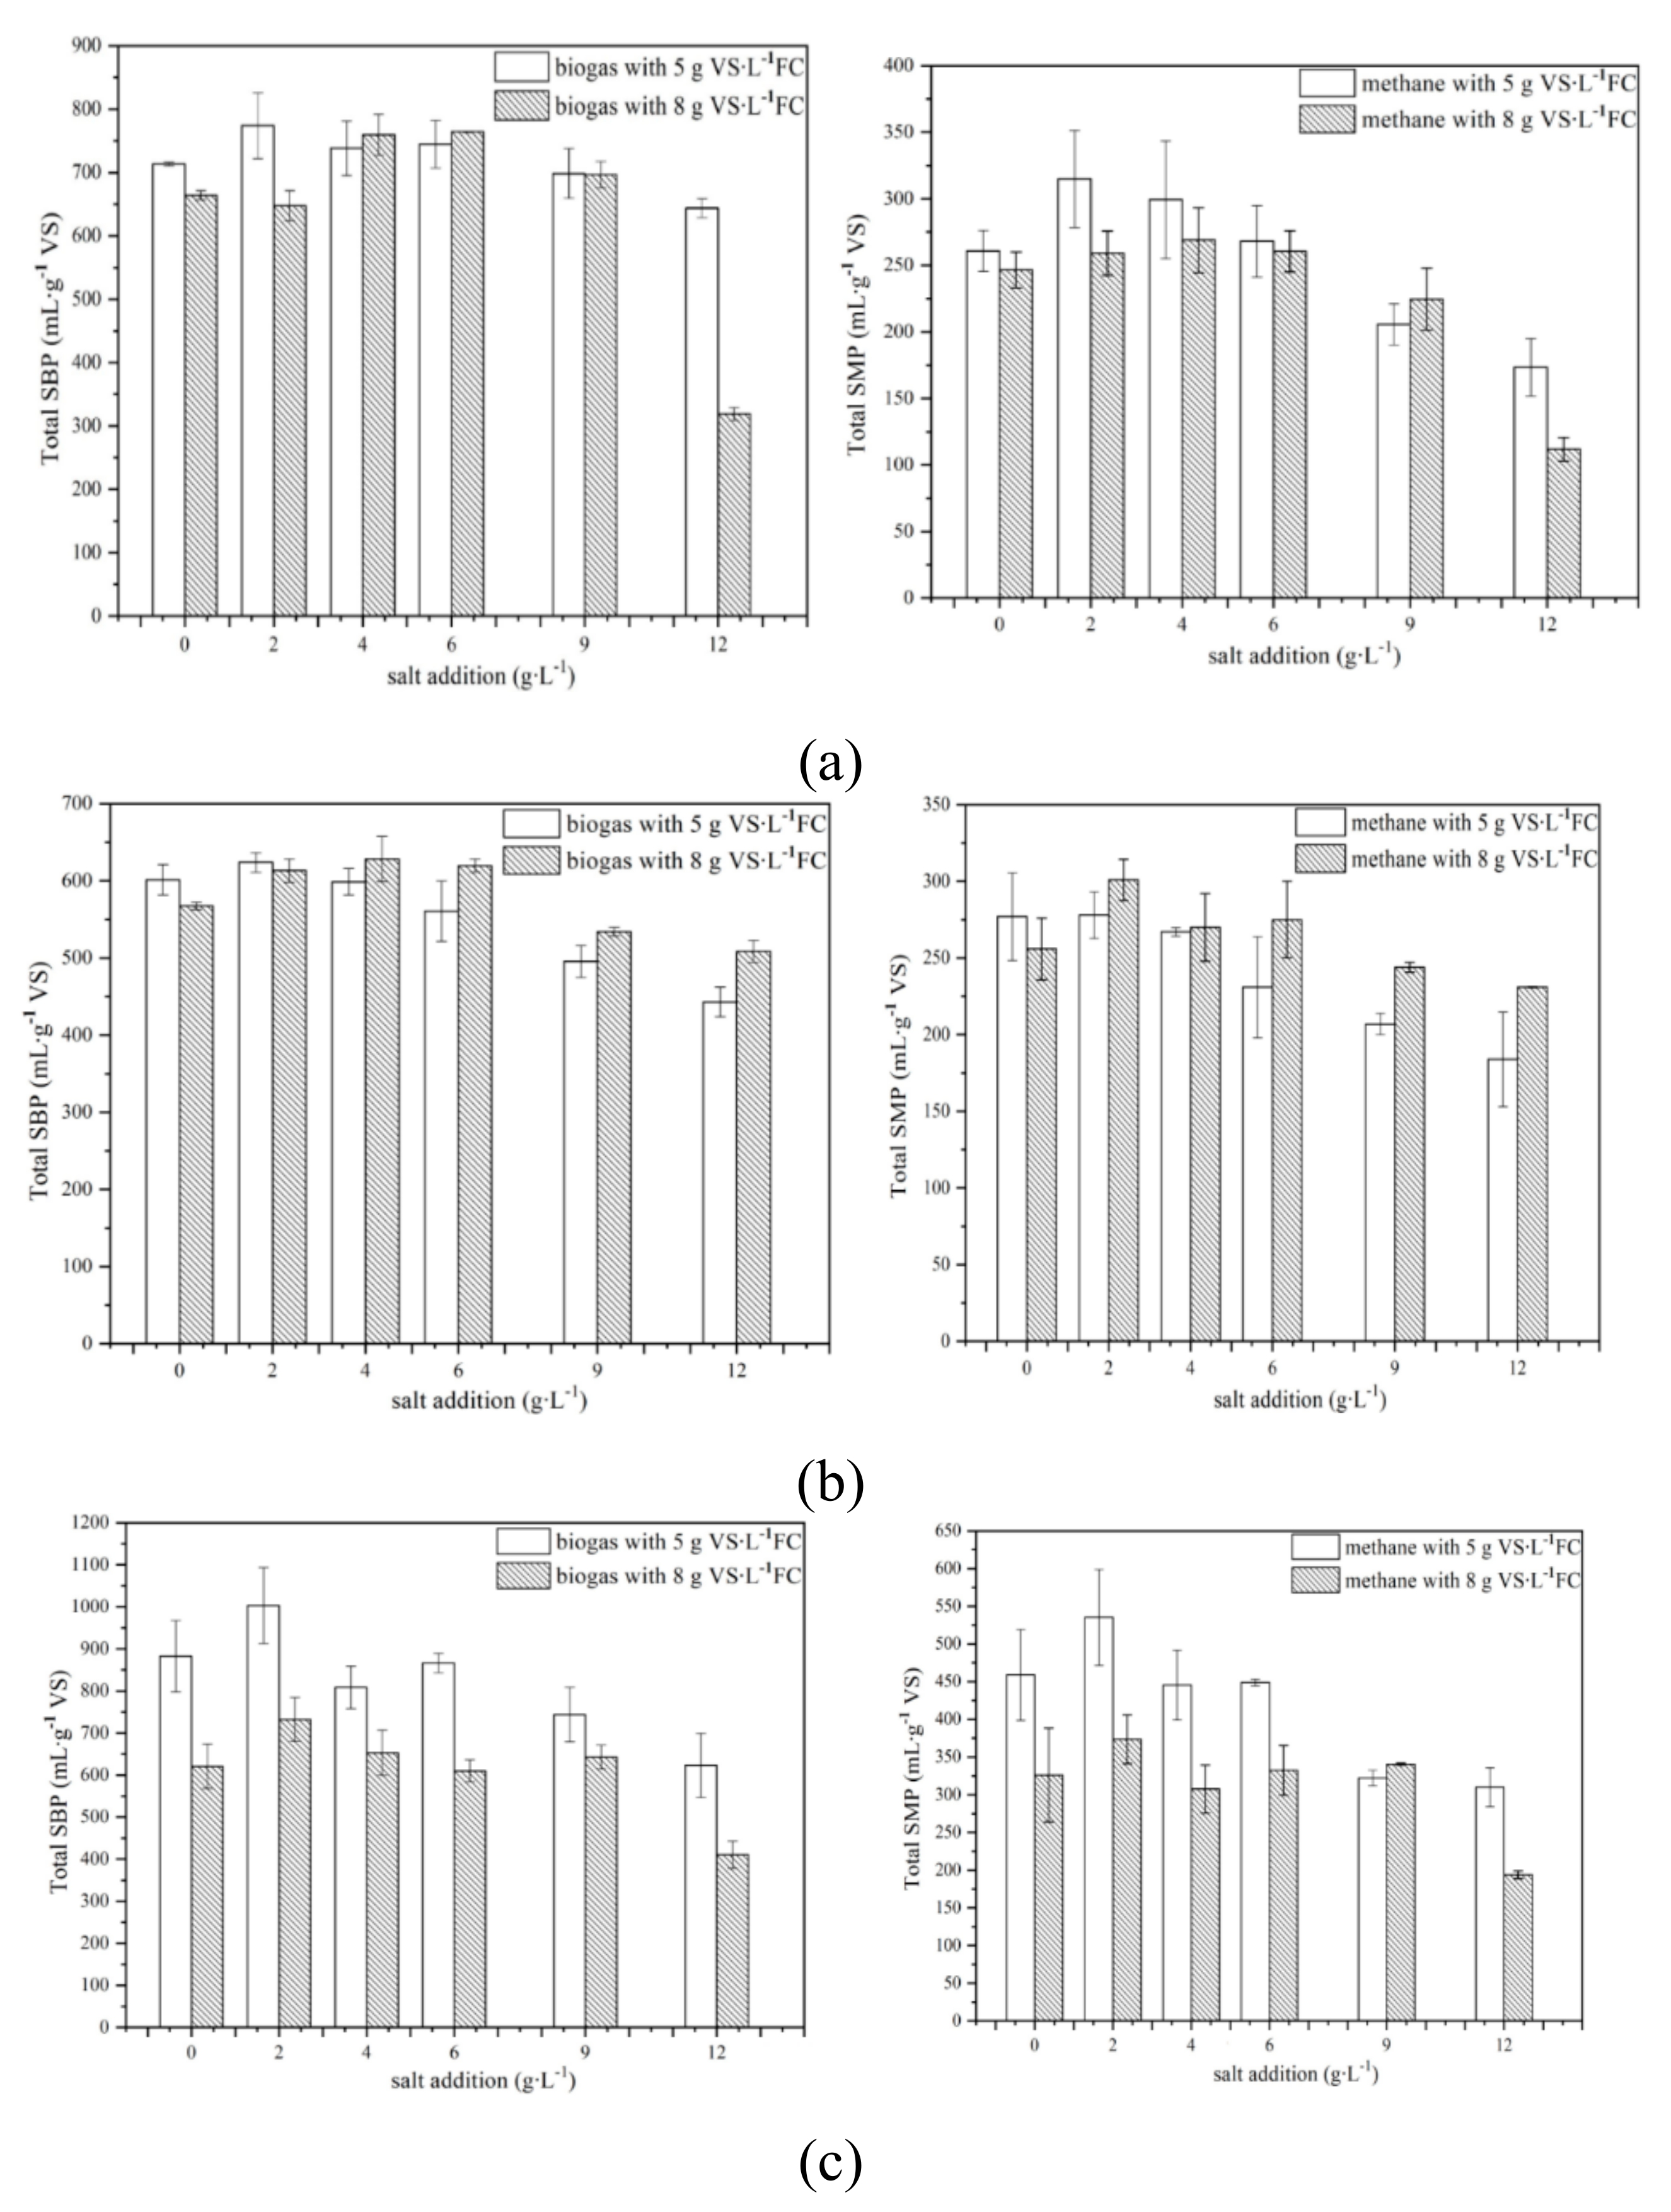
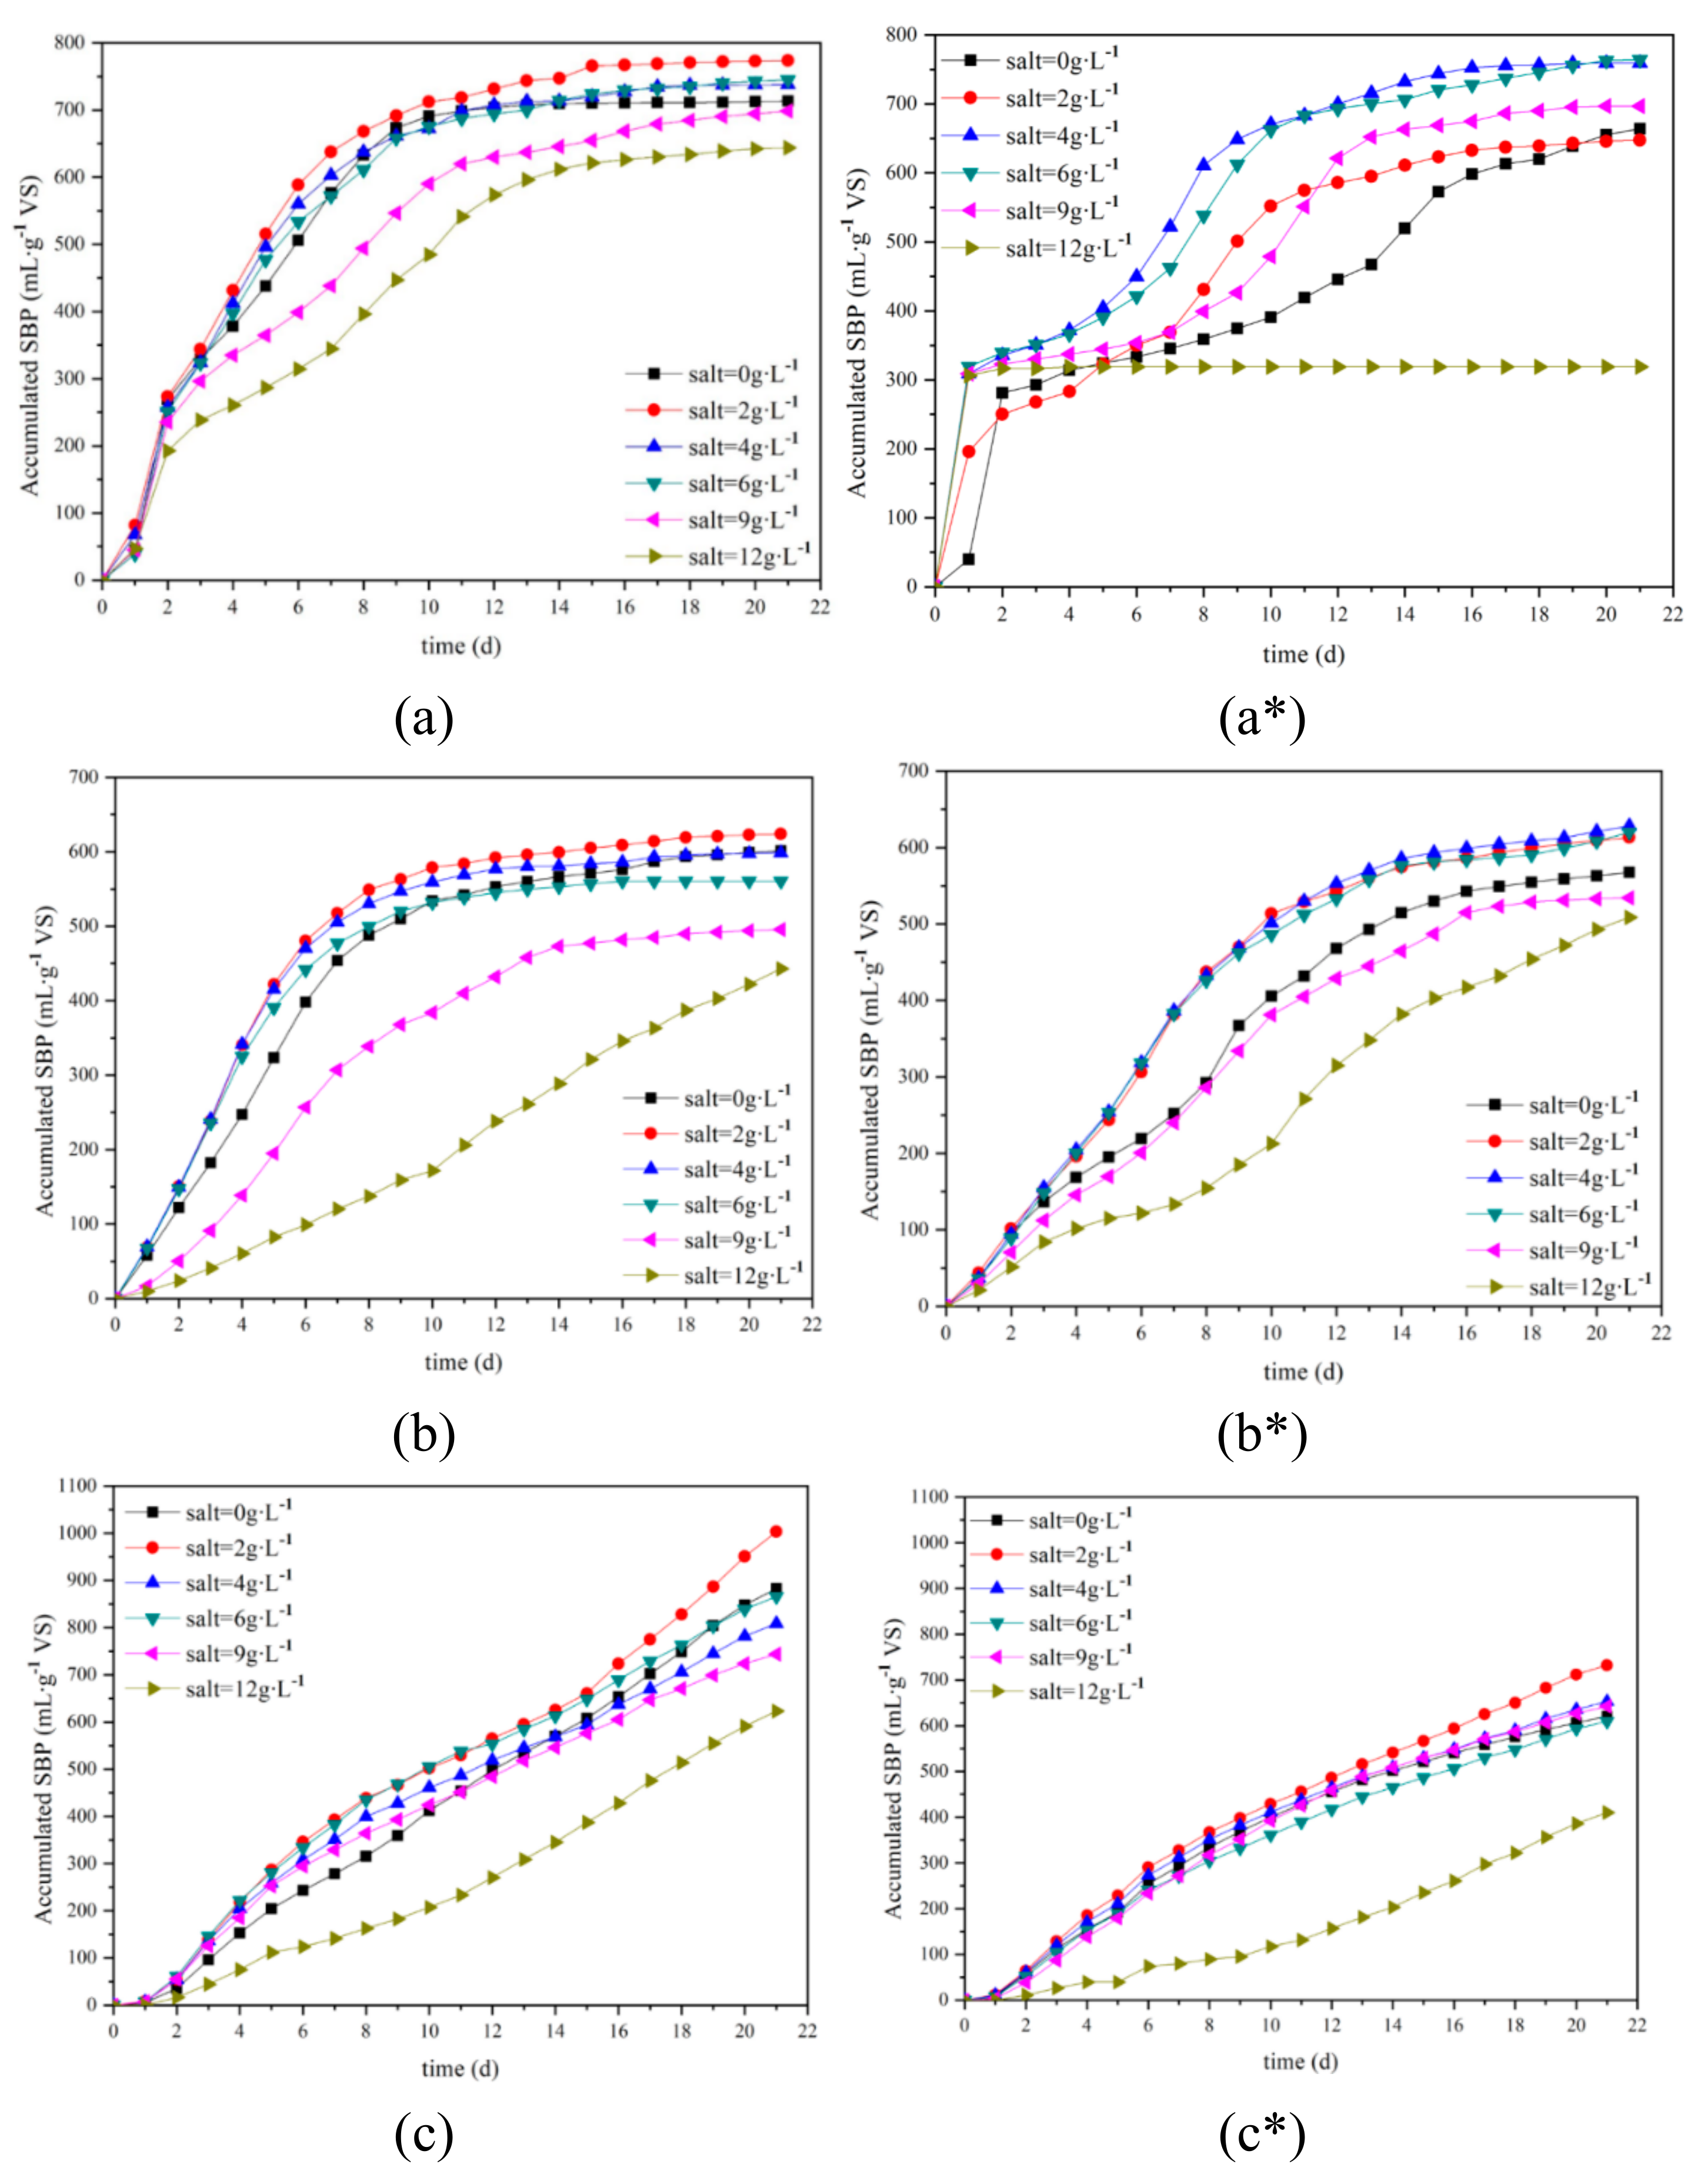
3.1. Promotion Effects of Salt on Biogas and Methane Yield

Effects of salt on total specific biogas production (SBP) and specific methane production (SMP) from AD of food waste with different components are shown in Figure 1 and Table 2. Both total SBP and SMP have experienced a trend of an increase at first and then decrease in each of the six figures Among all cases, 2 g∙L−1 salt addition had the maximum total SBP and SMP (in four and five cases). For biogas yield, the only two exceptions were those for HCFW digestion with 8 gVS∙L−1 FC, 6 g∙L−1 salt addition had the maximum total SBP (764 mL∙g−1VS, Table 2) and for HPFW digestion with 8 gVS∙L−1 FC, 4 g∙L−1 salt addition had the maximum total SBP (628 mL∙g−1VS, Table 2). For methane yield, the only exception was when HCFW was digested with 8 gVS∙L−1 FC; 4 g∙L−1 salt addition had the maximum total SMP (269 mL∙g−1VS, Table 2). It can be seen that even though the optimal salt addition varied with different FC and feeding materials, proper salt addition can enhance biogas and methane production compared with no salt addition. Considering the fact that in the case of HCFW digestion with 8 gVS∙L−1 FC, total SBP with 4 and 6 g∙L−1 salt addition were very similar (759 and 764 mL∙g−1VS, respectively, Table 2), it could be concluded that 2–4 g∙L−1 salt addition was the optimal dosage of sodium for biogas and methane production. In a previous study, the optimal sodium concentration was from 0.10 to 0.35 g∙L−1 [7,18]. However, in this study, 0.88–1.66 g∙L−1 sodium concentration had more biogas and methane yields than 0.10 g∙L−1 sodium concentration (without salt addition, Table A3). Furthermore, 2 g∙L−1 and 4 g∙L−1 salt addition also had the maximum vs. removal five times, 83.3% of the total (Table 2). It further proved that 2–4 g∙L−1 salt addition benefited AD progress for improving the dissolution of the organic part [6,14].

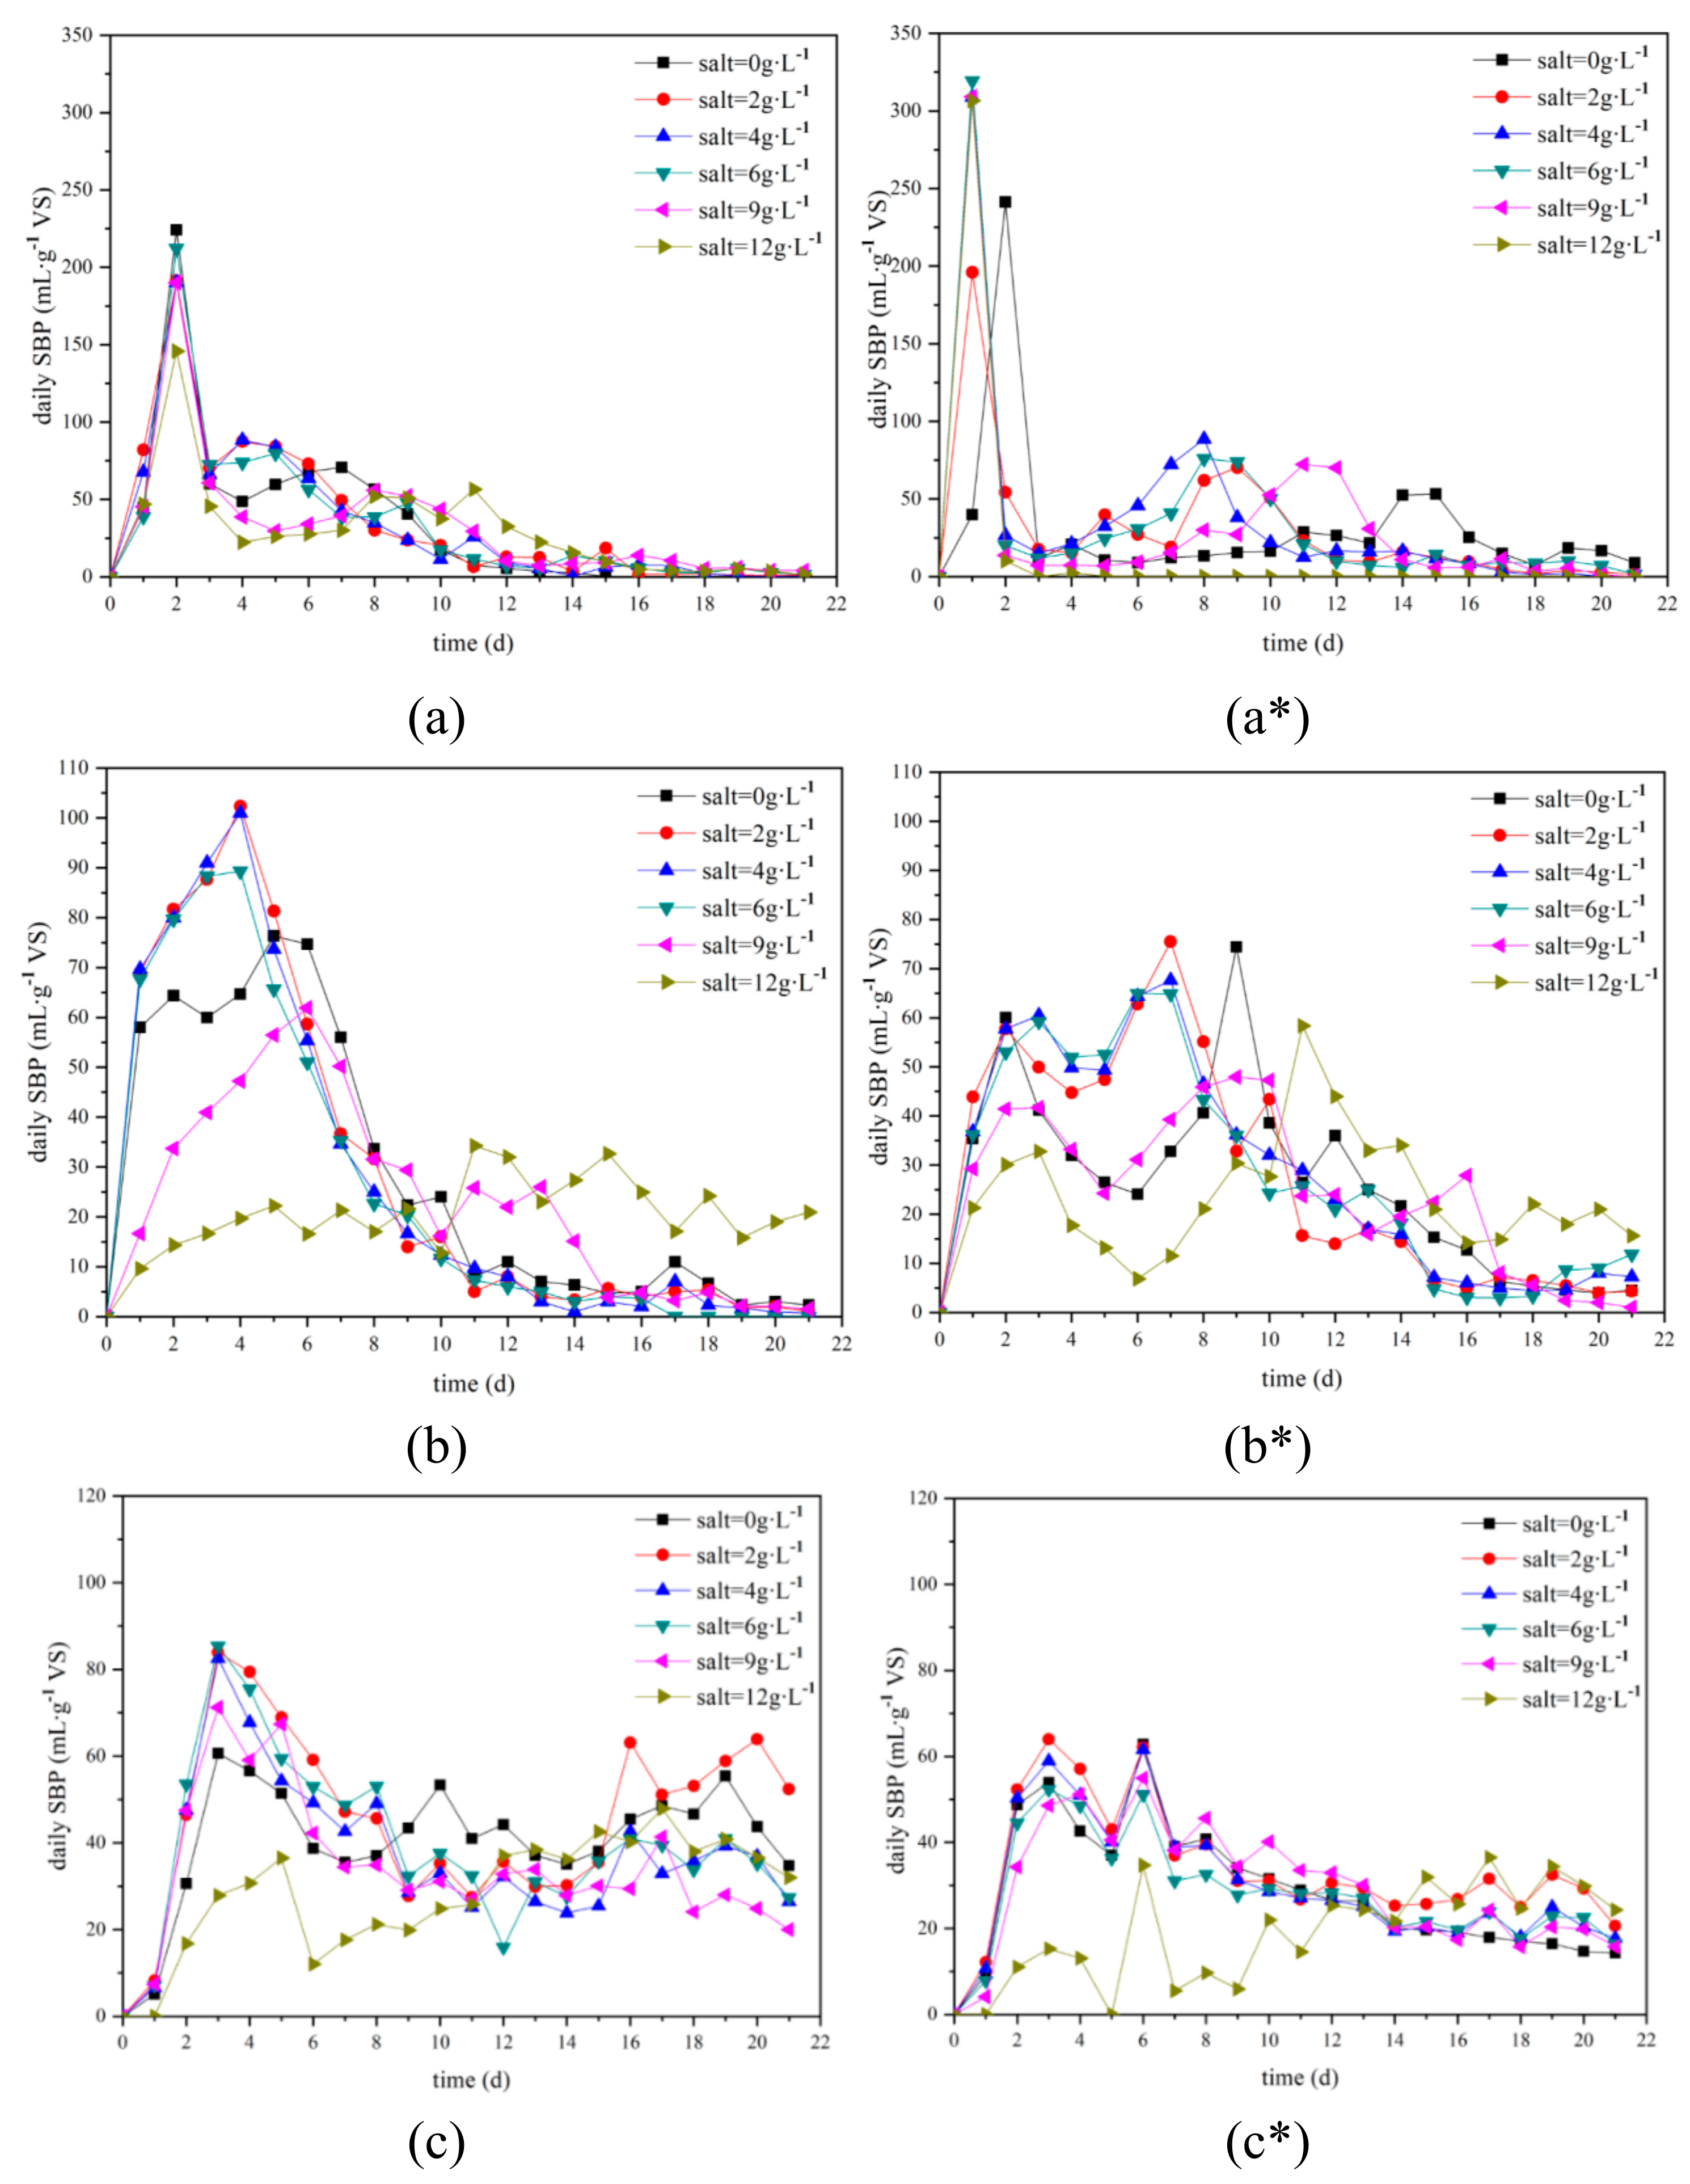
3.2. Promotion Effects of Salt on Biogas Production Rate

Figure 2 and Figure 3 show information about daily and accumulated SBP of three feeding materials. Compared with HPFW and HFFW, AD of HCFW had significantly higher SBP peaks (Figure 2a). Especially with 8 gVS∙L−1 FC, the peak of 6 g∙L−1 salt addition was 319 mL∙g−1VS. Also, the peaks’ appearance time of HCFW was earlier than others. HCFW reached the peaks in the first two days while others were later than the third day (Figure 2). Both of them can be ascribed to the rapid degrading kinetics of carbohydrate [15].
In Figure 3, it can be observed that for biogas production, curves of 0 g∙L−1 salt addition often lagged under curves of 2–6 g∙L−1 salt addition. Especially for AD of HPFW with 5 gVS∙L−1 FC, even the total SBP of 0 g∙L−1 salt addition was more than 6 g∙L−1 salt addition; the latter stayed in the lead until the 10th day (Figure 3b). On this basis, it can be preliminarily concluded that 2–6 g∙L−1 salt addition can increase biogas production rate.
Further comparison will be done quantitatively with a modified Gompertz model, which is often used to predict biogas and methane yield [3,15,30]. Under the same condition of salt addition and FC, HCFW had faster maximum biogas production rate (Rmax) and shorter lag phase (λ) than HPFW and HFFW, indicating that the former produced biogas faster and earlier (Table 3). The result is in accordance with the observation from Figure 2. For HCFW, 2 g∙L−1 salt addition (110.86 mL∙g−1VS) and 4 g∙L−1 salt addition (90.29 mL∙g−1VS) had the maximum Rmax with 5 and 8 gVS∙L−1 FC respectively. Compared with 0 g∙L−1 salt addition, the former had a 10.12% increase while the latter had an 89.05% increase. Here, although with 8 gVS∙L−1 FC, 12 g∙L−1 salt addition had the maximum Rmax (277.27 mL∙g−1VS), it was not taken into account due to its terrible R2, 0.6047 only. This poor fitting result can be attributed to the fact that AD of this case had broken on the 4th day and no biogas was produced then (Figure 2 and Figure 3). A similar phenomenon also happened when feeding material was agricultural and food processing by-products. It was reported that feeding materials with medium carbohydrate could be used with higher OLRs in continuous AD than feeding materials with high carbohydrate contents as the possibility of acidification due to accumulation of VFA would be lower with lower carbohydrate contents [15]. The maximum Rmax of HPFW for 5 and 8 gVS∙L−1 FC were 97.30 mL∙g−1VS and 62.62 mL∙g−1VS with 2 g∙L−1 salt addition, a 28.08% and 51.11% increase compared to 0 g∙L−1 salt addition. For HFFW, even salt addition also had an increasing of Rmax, the increasing was not as significant as HCFW and HPFW. 6 g∙L−1 salt addition had a 6.33% increase with 5 gVS∙L−1 FC and 9 g∙L−1 salt addition had a 1.65% increase with 8 gVS∙L−1 FC. Nevertheless, the promotion on biogas production rate from proper salt addition can be proved, especially for HCFW and HPFW. It was reported that with the increasing of salt concentration from 2 to 15 g∙L−1, soluble carbohydrate and soluble protein increased from 8596 and 2156 mg COD∙L−1 to 12,054 and 3124 mg COD∙L−1 respectively [6]. A similar result was found where the addition of salt improved solution of waste-activated sludge efficiently. With the dosage of salt, both soluble protein and carbohydrate increased in the digestate, resulting in a larger amount of VOA produced [10]. This could be explained by the exchange between the Na+ released from NaCl solution and some divalent cations (e.g., Ca2+ and Mg2+) from the extracellular polymeric substances which can result in the release of extracellular polymeric substances from the waste activated sludge (WAS) [11]. As solubilization and hydrolysis are widely considered as the rate-limiting steps, rapid solubilization and hydrolysis of organic material would induce rapid biogas production [12,13]. However, the promotion effect of salt on oil degradation is much worse.

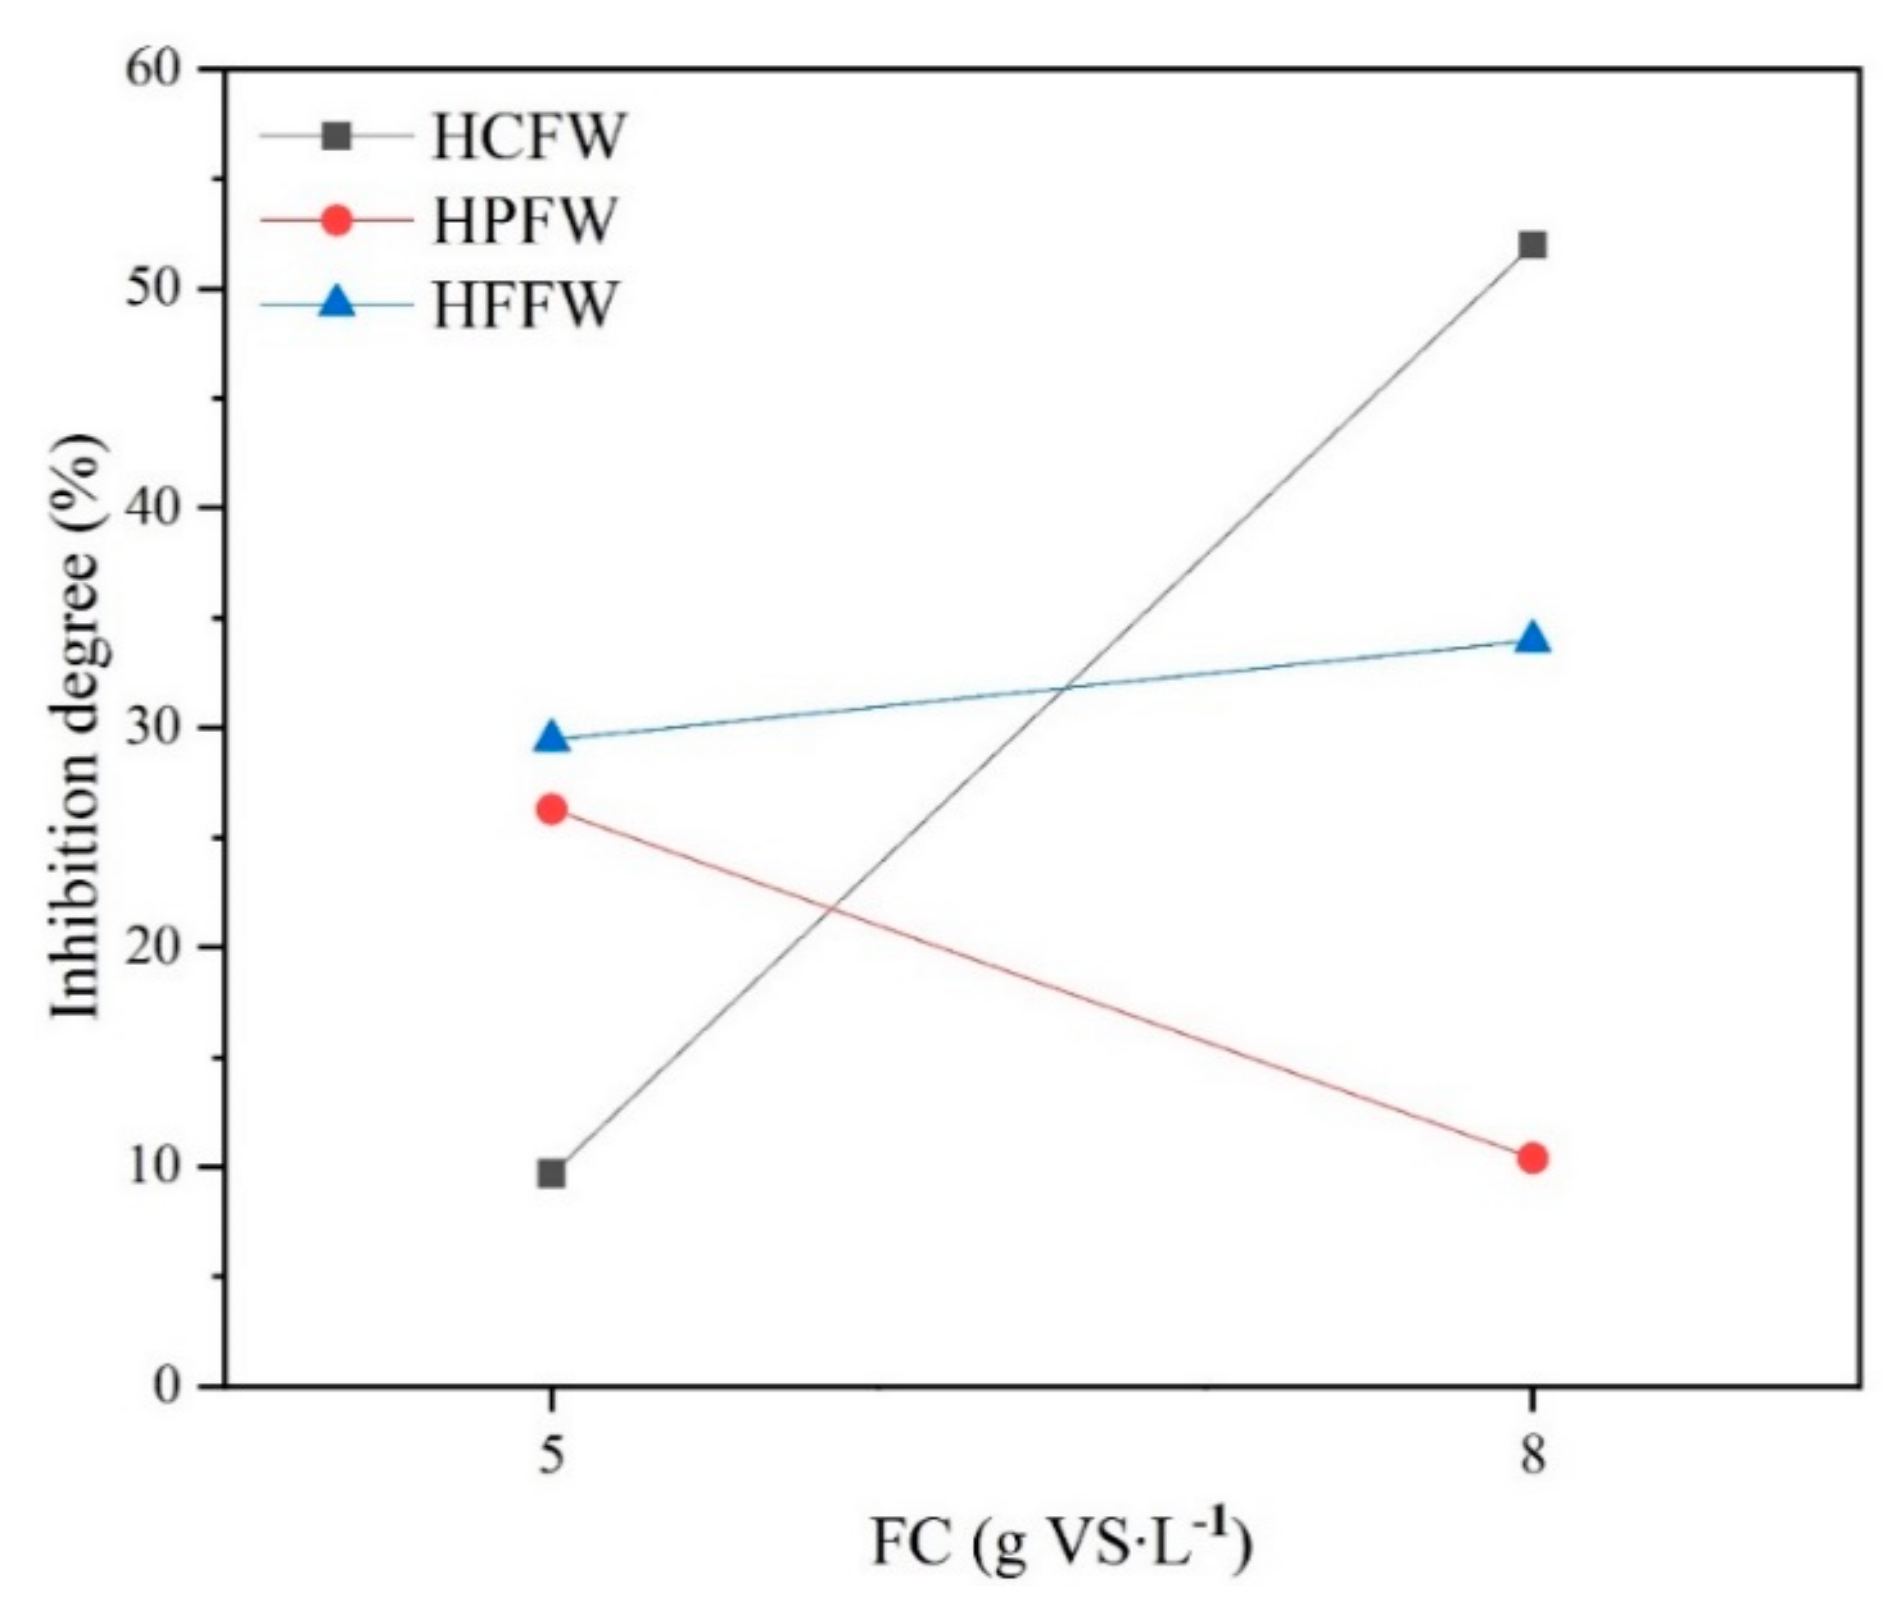
3.3. Interaction of FC and High Salt Addition on Inhibition Degree of Biogas Yield

In all cases, 12 g∙L−1 salt addition had the worst AD performance, which was mainly reflected in the minimum biogas and methane yield and minimum Rmax (Figure 1 and Table 3). This inhibition phenomenon could be because high concentration of sodium cation would lead to high osmotic pressure, resulting in the loss of the intracellular water of microbes [32]. Also, high salt addition could suppress the activities of key enzymes, such as CoAT and F420, which are responsible for acid generation and methane formation [14]. Nevertheless, the inhibition degree with 12 g∙L−1 salt addition varied with different feeding materials and FC (Figure 4). For HCFW, an inhibition degree at 5 gVS∙L−1 FC was slight, 9.78% only. However, when FC increased to 8 gVS∙L−1, the degree increased sharply to 52.0% and the AD process even ceased at the 4th day (Figure 2 and Figure 3). For HFFW, with the increasing of FC, inhibition degree increased from 29.4% to 34.0%. However, inhibition degree of HPFW dropped with the increasing of FC, from 26.3% to 10.4%. Factorial design was used to analyze significance of interaction of FC and salt addition. The results showed that interaction from salt addition and FC had significant effects on inhibition degree of HCFW and HPFW (p < 0.05) but had insignificant effects on inhibition degree of HFFW (p = 0.62 > 0.05). It could be concluded that for HCFW, interaction of FC and salt addition aggravated the inhibition degree and significantly reduced biogas production while for HPFW, interaction of FC and salt addition can alleviate the inhibition degree (Figure 4). The explanation of this difference could be that, at first, with the increasing of FC, during the period of hydrolysis and acidogenesis, the accumulation of VFA would be more severe, leading to pH dropping and AD inhibition [21]. This fact was also observed in Figure 2 where for HCFW and HPFW, when initial FC increased to 8 g∙L−1, two SBP peaks can be observed while for 5 gVS∙L−1 FC case, there was only one SBP peak. A significant decrease in daily SBP after the first biogas production peak may be due to the fact that the enhancement of FC made the rates of hydrolysis and acidogenesis exceed the rate of methanogenesis, resulting in the increase of VFA concentration and concomitant biogas production inhibition [33]. After that, as the initial substrate was mostly hydrolyzed and acidified, the consumption rate of VFA in the methanogenic process was higher than that of VFA formation, leading to the decrease of VFA concentration and the recovery of gas production rate and a second peak appeared consequently. Secondly, high salt addition can improve protein and carbohydrate solubilization and provide considerable organic compounds for VFA production. Also, high salt addition inhibits the growth of methanogens and suppresses the consumption of VFA, resulting in the accumulation of VFA and pH dropping. Taking into account the rapid degradation of carbohydrates, when the feeding material was HCFW, AD acidized quickly with high FC and salt addition, causing the system to crash on the 4th day (Figure 2 and Figure 3). This could be proved by the fact that the pH of this case was only 4.72, far below neutral conditions (Table 4). However, for HPFW, with the solubilization of protein, ammonium was produced, which can alleviate the dropping of pH and avoid excessive acidification [8]. With 12 g∙L−1 salt addition and 8 gVS∙L−1 FC, TAN of HPFW was 1076.2 mg∙L−1 while TAN of HCFW was only 488.5 mg∙L−1, resulting in higher pH of HPFW (6.98) and preventing the system from crashing at the same time. Meanwhile, TAN of this case was lower than 1540 mg∙L−1, indicating that AD was not affected by TAN inhibition [34]. Furthermore, the inhibition degree dropped from 26.3% to 10.4% with increasing of FC. One possible reason may be that as sodium plays an important role in cell synthesis and growth and high feeding substrates can support more microorganism and need additional salt for cell synthesis and growth, especially for the AD progress getting rid of acidification [6]. For HFFW, because of the lack of protein (Table 1), the pH decreased with the increasing of FC and salt addition (Table 4), and pH was at a minimum (6.76) with 12 g∙L−1 salt addition and 8 gVS∙L−1. Also, although VOA/TIC was at a maximum (0.24) in this case, the AD system still did not crash, as it was reported that an unstable AD process and methane fermentation inhibition appeared when VOA/TIC ratio was higher than 0.3–0.4 [21,35]. It can be ascribed to the slow degrading characteristics of HFFW, preventing it from rapid pH dropping [30].

4. Conclusions

The effects of salt on food waste with different component characteristics were studied on 5 and 8 gVS∙L−1 FC; 2–4 g∙L−1 salt addition (namely, 0.88–1.66 g∙L−1 sodium concentration) was considered as the optimal salt addition as this range had the maximum biogas and methane yield and the highest vs. removal and rapidest biogas production in most cases. Meanwhile, 12 g∙L−1 salt addition and 8 gVS∙L−1 FC had significant interaction with biogas yield from HCFW and HPFW. When the feeding material was HCFW, high salt addition and FC caused the ceasing of biogas production. However, for HPFW, 8 gVS∙L−1 FC can alleviate inhibition from 12 g∙L−1 salt addition, compared with 5 gVS∙L−1 FC. In practice, when carbohydrate content of food waste and FC is high, salt concentration should be paid attention carefully in case of the break of the AD system. Meanwhile, high protein content in food waste can enhance the buffering capacity of the AD system and prevent it from acidification, especially for high salt concentrations and FC.

Author Contributions

Conceptualization, X.L.; methodology, X.L.; software, X.L.; validation, J.H., C.M. and M.K.; formal analysis, X.L.; investigation, X.L.; resources, M.K.; data curation, X.L.; writing—original draft preparation, X.L.; writing—review and editing, J.H., Y.L., T.H., C.M. and M.K.; visualization, X.L.; supervision, T.H.; project administration, T.H.; funding acquisition, T.H.

Funding

This research was funded by Sichuan Province Science and Technology Support Program, grant number 2019YFH0058 and 2019YJ0244.

Acknowledgments

This study was financially supported by Sichuan Province Science and Technology Support Program (no. 2019YFH0058 and 2019YJ0244).

Conflicts of Interest

The authors declare no conflict of interest. The funders had no role in the design of the study; in the collection, analyses, or interpretation of data; in the writing of the manuscript, or in the decision to publish the results.

Appendix A

Table A1. Concentrations of common cations in inoculum in recent 10 years.
ParameterUnit2009201320162018ParameterUnit2009201320162018
Cdmg∙kg−1<2.7<1.20.7140.926Alg∙kg−152.853.625.424.1
Crmg∙kg−133.52721.418.2Feg∙kg−18.849.588.214.33
Cumg∙kg−1375327348379Cag∙kg−131.332.724.424.0
Nimg∙kg−122.728.716.117.5Kg∙kg−16.476.565.153.50
Pdmg∙kg−133.12718.413.6Mgg∙kg−15.14.43.33.3
Znmg∙kg−111611070867865Mng∙kg−10.110.090.090.09
Hgmg∙kg−15.053.450.710.64
Note: data were from regular monitoring by ISWA and sampling time of this experiment was in 2017.
Table A2. The relationship between salt addition and conductivity after dilution.
Salt Addition (g∙L−1)ConductivitySalt Addition (g∙L−1)ConductivitySalt Addition (g∙L−1)Conductivity
0.50.134.50.828.51.46
10.250.991.53
1.50.35.50.979.51.6
20.461.06101.72
2.50.486.51.1610.51.73
30.5671.26111.8
3.50.667.51.3511.51.88
40.7481.44121.95
Standard curve: conductivity = 0.16 × salt addition + 0.0876, R2 = 0.996.
Table A3. Calculation of sodium concentration with different salt addition.
Salt Addition (g∙L−1)Corresponding Sodium Addition (g∙L−1)Sodium Concentration (g∙L−1)
000.10
20.780.88
41.561.66
62.342.44
93.513.61
124.684.78

References

  1. Gao, S.; Bao, J.; Liu, X.; Stenmarck, A. Life cycle assessment on food waste and its application in China. IOP Conf. Ser. Earth Environ. Sci. 2018, 108, 042037. [Google Scholar] [CrossRef]
  2. Uçkun Kiran, E.; Trzcinski, A.P.; Ng, W.J.; Liu, Y. Bioconversion of food waste to energy: A review. Fuel 2014, 134, 389–399. [Google Scholar] [CrossRef]
  3. Browne, J.D.; Allen, E.; Murphy, J.D. Assessing the variability in biomethane production from the organic fraction of municipal solid waste in batch and continuous operation. Appl. Energy 2014, 128, 307–314. [Google Scholar] [CrossRef]
  4. Wang, D.; Zhao, J.; Zeng, G.; Chen, Y.; Bond, P.L.; Li, X. How Does Poly(hydroxyalkanoate) Affect Methane Production from the Anaerobic Digestion of Waste-Activated Sludge? Environ. Sci. Technol. 2015, 49, 12253–12262. [Google Scholar] [CrossRef] [PubMed]
  5. Zhao, Y.; Chen, M.; Yu, X.; Zou, J.; Li, L. GB/T 5461-2016 Edible Salt; General Administration of Quality Supervision, Inspection and Quarantine of the People’s Republic of China and Standardization Administration of the People’s Republic of China: Beijing, China, 2016.
  6. Zhao, J.; Liu, Y.; Wang, D.; Chen, F.; Li, X.; Zeng, G.; Yang, Q. Potential impact of salinity on methane production from food waste anaerobic digestion. Waste Manag. 2017, 67, 308–314. [Google Scholar] [CrossRef] [PubMed]
  7. Patel, G.B.; Roth, L.A. Effect of sodium chloride on growth and methane production of methanogens. Can. J. Microbiol. 1977, 23, 893–897. [Google Scholar] [CrossRef]
  8. Kugelman, I.J.; Chin, K.K. Toxicity, Synergism, and Antagonism in Anaerobic Waste Treatment Processes. Adv. Chem. 1971, 105, 55–90. [Google Scholar]
  9. Meng, Y.; Li, S.; Yuan, H.; Zou, D.; Liu, Y.; Zhu, B.; Chufo, A.; Jaffar, M.; Li, X. Evaluating biomethane production from anaerobic mono- and co-digestion of food waste and floatable oil (FO) skimmed from food waste. Bioresour. Technol. 2015, 185, 7–13. [Google Scholar] [CrossRef]
  10. Su, G.; Wang, S.; Yuan, Z.; Peng, Y. Enhanced volatile fatty acids production of waste activated sludge under salinity conditions: Performance and mechanisms. J. Biosci. Bioeng. 2016, 121, 293–298. [Google Scholar] [CrossRef]
  11. Higgins, M.J.; Novak, J.T. The effect of cations on the settling and dewatering of activated sludges: Laboratory results. Water Environ. Res. 1997, 69, 215–224. [Google Scholar] [CrossRef]
  12. Gomec, C.Y.; Kim, M.; Ahn, Y.; Speece, R.E. The role of pH in mesophilic anaerobic sludge solubilization. J. Environ. Sci. Health Part A 2002, 37, 1871–1878. [Google Scholar] [CrossRef]
  13. Zhang, C.; Su, H.; Baeyens, J.; Tan, T. Reviewing the anaerobic digestion of food waste for biogas production. Renew. Sustain. Energy Rev. 2014, 38, 383–392. [Google Scholar] [CrossRef]
  14. Zhao, J.; Zhang, C.; Wang, D.; Li, X.; An, H.; Xie, T.; Chen, F.; Xu, Q.; Sun, Y.; Zeng, G.; et al. Revealing the underlying mechanisms of how sodium chloride affects short-chain fatty acid production from the cofermentation of waste activated sludge and food waste. ACS Sustain. Chem. Eng. 2016, 4, 4675–4684. [Google Scholar] [CrossRef]
  15. Kafle, G.K.; Kim, S.H. Effects of chemical compositions and ensiling on the biogas productivity and degradation rates of agricultural and food processing by-products. Bioresour. Technol. 2013, 142, 553–561. [Google Scholar] [CrossRef] [PubMed]
  16. Piatek, M.; Lisowski, A.; Kasprzycka, A.; Lisowska, B. The dynamics of an anaerobic digestion of crop substrates with an unfavourable carbon to nitrogen ratio. Bioresour. Technol. 2016, 216, 607–612. [Google Scholar] [CrossRef] [PubMed]
  17. Zhang, J.; Li, W.; Lee, J.; Loh, K.-C.; Dai, Y.; Tong, Y.W. Enhancement of biogas production in anaerobic co-digestion of food waste and waste activated sludge by biological co-pretreatment. Energy 2017, 137, 479–486. [Google Scholar] [CrossRef]
  18. McCarty, P.L. Anaerobic Waste Treatment Fundamentals (parts 1–4). Chem. Microbiol. 1964, 95, 107–112. [Google Scholar]
  19. Chen, Y.; Cheng, J.J.; Creamer, K.S. Inhibition of anaerobic digestion process: A review. Bioresour. Technol. 2008, 99, 4044–4064. [Google Scholar] [CrossRef]
  20. Rinzema, A.; van Lier, J.; Lettinga, G. Sodium inhibition of acetoclastic methanogens in granular sludge from a UASB reactor. Enzyme Microb. Technol. 1988, 10, 24–32. [Google Scholar] [CrossRef]
  21. Raposo, F.; Banks, C.J.; Siegert, I.; Heaven, S.; Borja, R. Influence of inoculum to substrate ratio on the biochemical methane potential of maize in batch tests. Process Biochem. 2006, 41, 1444–1450. [Google Scholar] [CrossRef]
  22. Kafle, G.K.; Bhattarai, S.; Kim, S.H.; Chen, L. Effect of feed to microbe ratios on anaerobic digestion of Chinese cabbage waste under mesophilic and thermophilic conditions: Biogas potential and kinetic study. J. Environ. Manag. 2014, 133, 293–301. [Google Scholar] [CrossRef] [PubMed]
  23. De Gioannis, G.; Diaz, L.F.; Muntoni, A.; Pisanu, A. Two-phase anaerobic digestion within a solid waste/wastewater integrated management system. Waste Manag. 2008, 28, 1801–1808. [Google Scholar] [CrossRef] [PubMed]
  24. Choong, Y.Y.; Norli, I.; Abdullah, A.Z.; Yhaya, M.F. Impacts of trace element supplementation on the performance of anaerobic digestion process: A critical review. Bioresour. Technol. 2016, 209, 369–379. [Google Scholar] [CrossRef] [PubMed]
  25. Federation, W.E.; Association, A.P.H. Others Standard Methods for the Examination of Water and Wastewater; American Public Health Association: Washington, DC, USA, 2005. [Google Scholar]
  26. Weiland, P.; Rieger, C. Prozessstörungen frühzeitig erkennen. Biogas J. 2006, 9, 18. [Google Scholar]
  27. Organisation, F.C.Q.A. Methods Book for the Analysis of Compost; Ger. Bundesgütegemeinschaft Kompost eV: Colonge, Germany, 1994; p. 122. [Google Scholar]
  28. Anthonisen, A.C.; Loehr, R.C.; Prakasam, T.B.S.; Srinath, E.G. Inhibition of nitrification by ammonia and nitrous acid. J. (Water Pollut. Control Fed.) 1976, 48, 835–852. [Google Scholar]
  29. VDI 4630. Fermentation of Organic Materials: Characterization of the SUBSTRATE, sampling, Collection of Material Data, Fermentation Tests; Verein Deutscher Ingenieure, Ed.; VDI-handbuch Energietechnik, Beuth Verlag GmbH: Berlin, Germany, 2006. [Google Scholar]
  30. Zhang, W.; Lang, Q.; Fang, M.; Li, X.; Bah, H.; Dong, H.; Dong, R. Combined effect of crude fat content and initial substrate concentration on batch anaerobic digestion characteristics of food waste. Bioresour. Technol. 2017, 232, 304–312. [Google Scholar] [CrossRef]
  31. Montgomery, D.C. Design and Analysis of Experiments; John Wiley & Sons: New York, NY, USA, 2017. [Google Scholar]
  32. Oh, G.; Zhang, L.; Jahng, D. Osmoprotectants enhance methane production from the anaerobic digestion of food waste containing a high content of salt. J. Chem. Technol. Biotechnol. Int. Res. Process Environ. Clean Technol. 2010, 83, 1204–1210. [Google Scholar] [CrossRef]
  33. Pavlostathis, S.G.; Giraldo-Gomez, E. Kinetics of anaerobic treatment: A critical review. Crit. Rev. Environ. Control 1991, 21, 411–490. [Google Scholar] [CrossRef]
  34. Sheng, K.; Chen, X.; Pan, J.; Kloss, R.; Wei, Y. Effect of ammonia and nitrate on biogas production from food waste via anaerobic digestion. Biosyst. Eng. 2013, 116, 205–212. [Google Scholar] [CrossRef]
  35. Borja, R.; Rincón, B.; Raposo, F.; Alba, J.; Martín, A. Kinetics of mesophilic anaerobic digestion of the two-phase olive mill solid waste. Biochem. Eng. J. 2003, 15, 139–145. [Google Scholar] [CrossRef]
Figure 1. Specific biogas production (SBP) and specific methane production (SMP) of (a) HCFW, (b) HPFW, (c) HFFW with different salt additions.
Energies 12 03571 g001
Figure 2. Daily specific biogas production of (a) HCFW, (b) HPFW, (c) HFFW with different salt additions under 5 (without *) and 8 (with *) gVS∙L−1 FC.
Energies 12 03571 g002
Figure 3. Accumulated specific biogas production of (a) HCFW, (b) HPFW, (c) HFFW with different salt additions under 5 (without *) and 8 (with *) gVS∙L−1 FC.
Energies 12 03571 g003
Figure 4. Inhibition degree of three feeding materials with 12 g∙L−1 salt addition.at 5 and 8 gVS∙L−1 FC.
Energies 12 03571 g004
Table 1. The characteristics of wheat, skimmed soybeans, edible oil and inoculum.
ParametersMilled WheatSkimmed SoybeansEdible Sunflower OilInoculum
Total solid (TS) (%)90891003
Volatile solid (VS) (%TS)1009310064
pH5.56.15.97.9
NH4+ (mg∙L−1)NDNDND979
Salt (g∙kg−1)<0.1 *2.1<0.1 *0.5
C (%VS)45.045.483.828.0
H (%VS)6.86.419.34.6
N (%VS)1.97.70.03.9
Protein (%VS)13.3 *71.4 *0.0 *ND
Carbohydrate (%VS)84.8 *26 *0.0 *ND
Fat (%VS)1.2 *2.6 *100.0 *ND
Note: * means that the data is given by the seller. ND: not detected.
Table 2. Total SBP, total SMP and vs. removal of skimmed soybeans with different levels of salt addition and fermentation concentrations.
FC (gVS∙L−1)Salt Addition (g∙L−1)Total SBP (mL∙g−1VS)AD Efficiency (%)Total SMP (mL∙g−1VS)VS Removal (%)
50713 a, 601 b, 883 c89.7 a, 77.1 b, 63.5 c261 a, 277 b, 459 c66.5 a, 79.0 b, 74.2 c
2774 a, 624 b, 1003 c97.4 a, 80.0 b, 72.2 c315 a, 278 b, 535 c58.7 a, 81.7 b, 85.6 c
4738 a, 599 b, 809 c92.9 a, 76.8 b, 58.2 c299 a, 267 b, 445 c57.6 a, 78.7 b, 67.6 c
6745 a, 561 b, 866 c93.7 a, 72.0 b, 62.3 c268 a, 231 b, 449 c52.3 a, 72.6 b, 58.4 c
9698 a, 495 b, 744 c87.9 a, 63.5 b, 53.5 c206 a, 207 b, 322 c61.2 a, 61.2 b, 50.8 c
12644 a, 443 b, 623 c81.0 a, 56.8 b, 44.8 c173 a, 184 b, 310 c54.3 a, 56.4 b, 53.4 c
80664 a, 568 b, 621 c83.5 a, 72.9 b, 44.7 c247 a, 256 b, 326 c72.0 a, 75.3 b, 35.4 c
2647 a, 613 b, 733 c81.5 a, 78.6 b, 52.7 c259 a, 301 b, 374 c70.0 a, 76.4 b, 35.9 c
4759 a, 628 b, 653 c95.5 a, 80.6 b, 47.0 c269 a, 270 b, 308 c78.5 a, 70.6 b, 50.8 c
6764 a, 620 b, 610 c96.2 a, 79.5 b, 43.9 c261 a, 275 b, 332 c72.5 a, 69.9 b, 46.1 c
9697 a, 534 b, 643 c87.7 a, 68.5 b, 46.2 c225 a, 244 b, 341 c74.2 a, 61.4 b, 58.2 c
12319 a, 509 b, 410 c40.1 a, 65.3 b, 29.5 c112 a, 231 b, 194 c72.8 a, 62.5 b, 27.6 c
Note: Superscript a, b and c represent HCFW, HPFW and HFFW respectively. And AD efficiency ( % ) = Total SBP ( mL · g 1 VS ) TBP ( mL · g 1 VS ) × 100 % .
Table 3. Kinetic result of soybean with different salt addition modeled by the modified Gompertz model.
FC (gVS∙L−1)Salt Addition (g∙L−1)Yp (mL∙g−1VS)Rmax (mL∙g−1VS)λ (d)R2
50717.0 a, 592.8 b, 858.2 c100.7 a, 76.0 b, 49.1 c0.11 a, 0.58 b, 1.89 c0.98 a, 1.00 b, 0.99 c
2762.1 a, 613.4 b, 940.0 c110.9 a, 97.3 b, 50.8 c0.03 a, 0.48 b, 0.50 c0.99 a, 1.00 b, 0.97 c
4727.0 a, 589.7 b, 761.3 c107.2 a, 96.2 b, 47.7 c0.10 a, 0.45 b, 0.36 c0.99 a, 1.00 b, 0.98 c
6728.4 a, 558.5 b, 816.9 c100.9 a, 89.0 b, 52.2 c0.08 a, 0.35 b, 0.37 c0.99 a, 1.00 b, 0.98 c
9687.6 a, 498.3 b, 715.5 c73.1 a, 54.6 b, 45.3 c0.00 a, 1.41 b, 0.43 c0.97 a, 1.00 b, 0.99 c
12652.8 a, 630.5 b, 627.2 c55.6 a, 26.3 b, 39.8 c0.00 a, 2.93 b, 5.20 c0.98 a, 1.00 b, 1.00 c
80659.8 a, 623.9 b, 599.5 c47.8 a, 41.4 b, 46.1 c0.00 a, 0.36 b, 0.91 c0.85 a, 0.99 b, 1.00 c
2653.3 a, 618.1 b, 696.7 c64.1 a, 62.6 b, 45.5 c0.00 a, 0.80 b, 0.43 c0.94 a, 1.00 b, 0.99 c
4754.0 a, 630.0 b, 620.2 c90.3 a, 62.5 b, 45.7 c0.00 a, 0.76 b, 0.62 c0.91 a, 1.00 b, 1.00 c
6749.4 a, 614.4 b, 584.3 c82.7 a, 62.0 b, 39.8 c0.00 a, 0.79 b, 0.65 c0.88 a, 1.00 b, 0.99 c
9718.6 a, 578.0 b, 620.8 c60.8 a, 41.3 b, 46.8 c0.00 a, 0.84 b, 1.41 c0.81 a, 1.00 b, 1.00 c
12406.9 a, 731.0 b, 414.5 c277.3 a, 29.5 b, 31.5 c0.00 a, 2.05 b, 7.84 c0.60 a, 0.99 b, 1.00 c
Note: Superscript a, b and c represent HCFW, HPFW and HFFW respectively.
Table 4. Characteristic of digestates with different levels of salt addition.
FC (gVS∙L−1)Salt Addition (mg∙L−1)pHTAN (mg∙L−1)TOA/TIC
507.15 (0.05) a, 7.31 (0.01) b, 7.13 (0.15) c548.2 (83.6) a, 1002.8 (19.3) b, 508.1 (10.7) c0.08 (0.016) a,0.07 (0.003) b, 0.11 (0.041) c
27.11 (0.01) a, 7.30 (0.02) b, 7.10 (0.04) c586.6 (125.8) a, 1077.3 (180.5) b, 628.0 (67.28) c0.10 (0.043) a,0.04 (0.015) b, 0.19 (0.000) c
47.10 (0.01) a, 7.12 (0.05) b, 7.10 (0.01) c586.3 (71.84) a, 1169.9 (145.3) b, 503.1 (53.33) c0.11 (0.005) a,0.05 (0.015) b, 0.14 (0.002) c
67.06 (0.03) a, 7.15 (0.04) b, 7.09 (0.00) c702.6 (67.3) a, 1080.4 (70.5) b, 503.1 (18.2) c0.08 (0.023) a,0.05 (0.025) b, 0.10 (0.022) c
97.10 (0.01) a, 7.07 (0.01) b, 7.13 (0.00) c564.7 (0.5) a, 849.5 (17.9) b, 508.0 (48.7) c0.08 (0.037) a,0.10 (0.006) b, 0.11 (0.013) c
127.08 (0.07) a, 7.00 (0.02) b, 7.15 (0.01) c694.5 (22.8) a, 959.7 (80.6) b, 502.9 (30.5) c0.13 (0.082) a,0.10 (0.019) b, 0.15 (0.069) c
807.01 (0.01) a, 7.08 (0.03) b, 7.06 (0.01) c685.2 (18.5) a, 1072.2 (124.7) b, 426.5 (54.7) c0.06 (0.003) a,0.10 (0.004) b, 0.09 (0.009) c
27.06 (0.04) a, 7.00 (0.02) b, 7.10 (0.01) c670.6 (62.5) a, 1120.4 (48.2) b, 468.8 (30.5) c0.06 (0.001) a,0.12 (0.001) b, 0.04 (0.007) c
47.01 (0.00) a, 7.10 (0.00) b, 6.97 (0.04) c411.4 (53.1) a, 1134.2 (86.4) b, 579.2 (30.6) c0.10 (0.000) a,0.13 (0.006) b, 0.16 (0.006) c
66.98 (0.01) a, 7.04 (0.03) b, 6.85 (0.01) c575.2 (55.1) a, 1005.5 (99.0) b, 582.8 (12.1) c0.16 (0.052) a,0.10 (0.035) b, 0.16 (0.014) c
96.83 (0.01) a, 7.05 (0.01) b, 6.83 (0.01) c556.6 (42.7) a, 988.5 (37.3) b, 582.7 (12.0) c0.16 (0.044) a,0.08 (0.001) b, 0.19 (0.005) c
124.72 (0.05) a, 6.98 (0.02) b, 6.76 (0.04) c488.5 (63.6) a, 1076.2 (137.8) b, 492.4 (30.1) cUD a, 0.12 (0.001) b, 0.24 (0.008) c
Note: Superscript a, b and c represent HCFW, HPFW and HFFW respectively and UD means unable to ae detected.

