Article

Experimental Investigation of Diluents Components on Performance and Emissions of a High Compression Ratio Methanol SI Engine

1
State Key Laboratory of Automotive Simulation and Control, Jilin University, Changchun 130025, China
2
FAW Sihuan Engine Manufacturing Co. Ltd., Changchun 130062, China
*
Author to whom correspondence should be addressed.
Energies 2019, 12(17), 3366; https://doi.org/10.3390/en12173366
Submission received: 15 March 2019 / Revised: 12 April 2019 / Accepted: 12 April 2019 / Published: 1 September 2019

Abstract

:
Increasing compression ratio and using lean burn are two effective techniques for improving engine performance. Methanol has a wide range of sources and is a kind of suitable fuel for a high-compression ratio spark-ignition lean burn engine. Lean burn mainly has a dilution effect, thermal effect and chemical effect. To clarify the influences of different effects and provide guidance for improving composition of dilution gases and applications of this technology, this paper chose Ar, N2 and CO2 as diluents. A spark-ignition methanol engine modified from a diesel engine with a compression ratio of 17.5 was used for the experiments. The results obtained by using methanol spark ignition combustion indicated that at engine speed of 1400 rpm and 25% load, NOx dropped by up to 77.5%, 100% and 100% by Ar, CO2 and N2. Gases with higher specific heat ratio and lower heat capacity represented by Ar exhibited the least adverse effect on combustion and showed a downward break-specific fuel consumption (BSFC) trend. Gas with high specific heat capacity represented by CO2 can decrease NOx and total hydro carbons (THC) emissions at the same time, but the BSFC of CO2 showed the worst trend, followed by N2. Gas affecting the combustion process like CO2 had chemical effect.

1. Introduction

As a response to increasingly severe energy and environment regulations, researchers are committed to the development of new combustion strategies and spread of alternative fuels [1,2]. Unlike other alternative fuels, methanol can be produced from inferior coal and is in line with the energy structure and developing national conditions of China [3]. Besides, methanol has its own physical and chemical properties which can improve engine performance. First, the high octane number and favorable anti-knock performance of methanol is suitable for a high-compression ratio engine. Secondly methanol molecular structure contains oxygen so that combustion reaction works more completely and helps reduce particle concentration [4]. Finally, its fast flame propagation can help improve the in-cylinder combustion reaction and decrease particulate emissions [5]. Therefore, using methanol as an engine alternative fuel has great potential for development.
As an alternative fuel with great application potential, many researchers have tested methanol on spark ignition (SI) engines and compression ignition (CI) engines or other engines work with new combustion strategies. Turner [6] et al. tested methanol–gasoline blends on an SI engine, they figured that methanol provides a much higher knock limit and gives great improvements in thermal efficiency compared with pure gasoline. Avinash et al. [7] found methanol can increase brake thermal efficiency (BTE) and made a lower emission of NOx, CO and smoke opacity for its higher latent heat of evaporation on a SI engine. Dinesh Kumar Soni et al. [8] changed the blending ratio of methanol in diesel and found a 30% methanol blending ratio achieved a maximum reduction of NOx, CO and HC emissions (27%, 58% and 65%, respectively) compared to original diesel fuel on a CI engine. Erik [9] et al. showed that the emission of soot is non-existent and formaldehyde can be avoided on an engine running in partially premixed combustion (PPC) mode at medium loads, however CO and NOx emissions are not significantly improved. But in general, methanol is widely used in an SI engine for its high octane rating [10].
The increasing compression ratio (CR) is a promising approach matched with enhancing thermal efficiency and reducing emissions of the engine. G. Di Blasio [11] et al. demonstrated CR is an important design parameter, which is closely related to the methane unburnt (MHC) on methane-diesel light-duty engine. Srivastava [12] et al. found increasing CR showed benefit on decreasing mean effective pressure cyclic variation (COVIMEP) and break-specific fuel consumption (BSFC), a higher CR can also expand the lean flammability limit of λ from 1.62 to 1.76 which provides favorable conditions for lean burn. Ibrahim et al. [13] have found that when exhaust gas was employed for dilution on a natural gas SI engine, the fuel consumption rate could be reduced by about 10% with CR increased from 8 to 10. However, knock is a major obstacle for further increasing CR in the SI engine, and running engine with fuel has high octane number is an effective solution, as methanol exactly meets this condition [14]. M. Bahattin [15] et al. increased CR from 6 to 10 by fuelling with methanol then discovered the brake thermal efficiency of engine fueled with methanol increased by up to 36% and CO emissions reduced about 37%.
According to Erik, methane and formaldehyde emissions on engines fueled with methanol all can be solved, but NOx emission is still a problem for a methanol engine. Lean burn is one of the most effective ways to decrease NOx emissions in engine fueled with methanol. It can decrease NOx emissions by changing the heat capacity of the mixture, reducing in-cylinder temperature and slowing down flame speed [16,17,18]. In addition, a larger throttle percentage is in favor of reducing throttle pump loss. Exhaust gas is a commonly used as diluent gas, and charging exhaust gas into fresh air will decrease the concentration of oxygen molecules and raise the specific heat capacity of the mixture, causing the in-cylinder temperature and in-cylinder pressure to decrease, the combustion speed to slow down, finally the low temperature and the lack of oxygen suppresses the generation of NOx. Xie et al. [19] indicated that when a hot exhaust gas recirculation (EGR) ratio increases to 20%, fuel saving reaches 7%, NOx decreases 36% and particle number reduces 87%, and the speed of the flame is accelerated, the cycle-by-cycle combustion variation is weakened. Giacomo et al. [20] showed increasing the exhaust gas recirculation up to 45% will lead to a higher indicated thermal efficiency for the lower in-cylinder temperature. Ladommatos et al. [21,22,23,24] also pointed out that dilution effect of EGR is the dominate cause of the NOx reduction through experiments on a diesel engine. According to Turner, methanol allows using EGR for lean burn to a higher degree than gasoline on a high-CR engine, so methanol is a suitable fuel for high-CR SI lean burn engine [6].
Although it has been proved that EGR can improve engine performance, the specific role of its internal components, it is not clear which is required to study further. Exhaust gas contains nitrogen (N2), carbon dioxide (CO2) and argon (Ar). CO2 is a common three-atom molecule and it can be separated from mixture such as exhaust gas, raw natural gas by membrane separation technology [25]. N2 is a kind of diatomic molecule that takes up about 78% of the volume of air, it also can be extracted from a mixture by membrane separation technology like CO2. Ar is chemically inert and can be used as a circulating gas on large equipment such as gas turbines and generators leading to high efficiency [26,27]. These three gases derive from a wealth of sources, are easy to obtain, and have different applications. CO2 and N2 can be applied to vehicles expediently, and compared with them Ar is more suitable for large machinery. So their effects when injecting into intake pipes are worthy of studying. Weifeng Li [28] et al. indicated that Ar, N2 and CO2 all can decrease NOx emissions with the dilution ratio increasing on an engine fueled with natural gas, but Ar can increase the thermal efficiency at the same time compared with N2 and CO2. However, there is a “trade-off” relationship between NOx emissions and fuel consumption. Miaomiao Zhang et al. [29] found that when NOx emissions is reduced to the same level, Ar can give the best BSFC because of its specific heat ratio value on a SI engine fueled with methanol.
However, most research focuses on the traditional diesel engines, natural gas engine or gasoline direct injection (GDI) engine. Few studies are related to the influences of diluent gas on combustion and emissions of high compression ratio engine fueled with methanol, but it is necessary to work on the methanol engine for its specific characteristics.
The main content of this paper is to further explore the relationship between diluent gas physicochemical properties and engine performance improvement, clarify the influence of dilution, thermal and chemical effects of a high compression ratio SI engine fueled with methanol, finally finding a balance between methanol consumption and emissions. The results will provide a reference for the subsequent studies on the selection and proportion of dilution gas for a vehicle, and popularize the application of Ar as a dilution gas in large power machinery such as generators and so on. In the article, argon is also used as a measure for its low and stable specific heat capacity in addition to being used as a diluent gas [30,31,32].

2. Results

2.1. Experimental Setup and Procedure

Experimental observations for this study were made on a four-cylinder high-compression ratio SI engine. It was transformed from a diesel engine. The intake manifold of prototype was modified for SI engine and four methanol injectors were installed at intake ports. The original diesel injectors were replaced by spark plugs. Detailed specifications are shown in Table 1.
A WAVEsimulator (Lab8000, Nanjing, China) was used as a tool to write the debugging programs during the test. A 16-bit microcontroller (80C196KC, Intel, Santa Clara, California, America) was selected for the engine control. During the test, the mass flow of pure dilution gas and air were measured by a CMF025 flowmeter (Tongyuan, Shanghai, China) and an AVL 1000 flowmeter (AVL List GmbH, Graz, Austria). The volume fraction of each gas in the exhaust was measured by AVL DICOM4000 Emissions Analyzer (AVL List GmbH, Graz, Austria). The in-cylinder pressure signal passed through the signal amplifier to a DS9100 combustion analyzer produced by Ono Instrument Equipment Factory (Kanagawa, Japan), and then the combustion analyzer (DS9100, Kanagawa, Japan) processes the cylinder pressure signal and the crankshaft position signal for displaying the in-cylinder pressure curve in real time. Figure 1 contains an image of the base experimental setup. Valve1 was disposed of at the outlet of the compressed gas bottle full of pure dilution gas, the intake heater was arranged between valve1 and valve2, and the heated gas entered the CMF025 through valve2 then mixed with fresh air.

2.2. Experimental Methods

In this experiment, three kinds of dilution gases (CO2, N2 and Ar) which were provided by compressed gas bombs with a purity level of 99% were employed (Xinhai Economic and Trade Group, Changchun, China), and all test results were compared with methanol (Aladdin, Shanghai, China) spark ignition combustion without dilution; the error bars are the standard errors of the measurements. The test was conducted at 1400r/min and 25% load conditions. During the test, ignition advance angle, methanol injection amount and intake air temperature were all kept constant, and excess air coefficient (λ) was kept at unity (λ = 1). At the beginning of the test, we opened the compressed gas bomb, valve1, and the water inlet valve of the gas heater in turn to stabilize the gas temperature at 30 ( ± 2 ) °C. Then we opened valve2 and adjusted the water inlet valve to ensure the final intake air temperature was maintained at 28 ( ± 2 ) °C. Adjusted valve2 and observed the mass flow meter, until the quality of pure dilution gas reached the target value, then adjusted the throttle to ensure λ was stabilized at 1, finally recorded the required value. Next, continued to adjust valve2 to change the mass flow rate of pure dilution gas charged until the dilution limitation.
To compare and analyze the effects of different gases at the same addition level, a dilution factor (DF) was introduced in this paper, and it is defined as the ratio of the mass flow of gas actually entering the engine and the mass flow of air when λ = 1; it can be indicated by following Equations (1) and (2):
λ =   m inlet m methanol + AFR methanol
DF = m gas + m air m inlet = m gas + m air m methanol + AFR methanol
m gas is mass flow rates of CO2, N2 and Ar, and it is acquired by the gas mass flow meter, m air is the practical air mass flow, and it can be measured by the air flow meter. m methanol is the practical injecting methanol mass flow, AFR methanol is the theoretical air fuel ratio of methanol, and m inlet is the air mass flow for stoichiometric combustion. Therefore, when diluted with different dilution gases under the same load condition, the mass flow rate of the dilution gas is considered to be the same as long as the dilution factor has no change.
The dilution limitation mentioned above means the maximum dilution gas mass flow that can keep engine operating stably. In this paper, a dilution limitation was adopted with a mean effective pressure cyclic variation (COV) below 5%. During the experiment, 200 cycles of in-cylinder pressure signals were collected for each operating point, so COV can be indicated by following Equation (3):
COV = σ p m e P m e ¯
σ p m e is the standard deviation of mean effective pressure, P m e ¯ is the average of mean effective pressure.

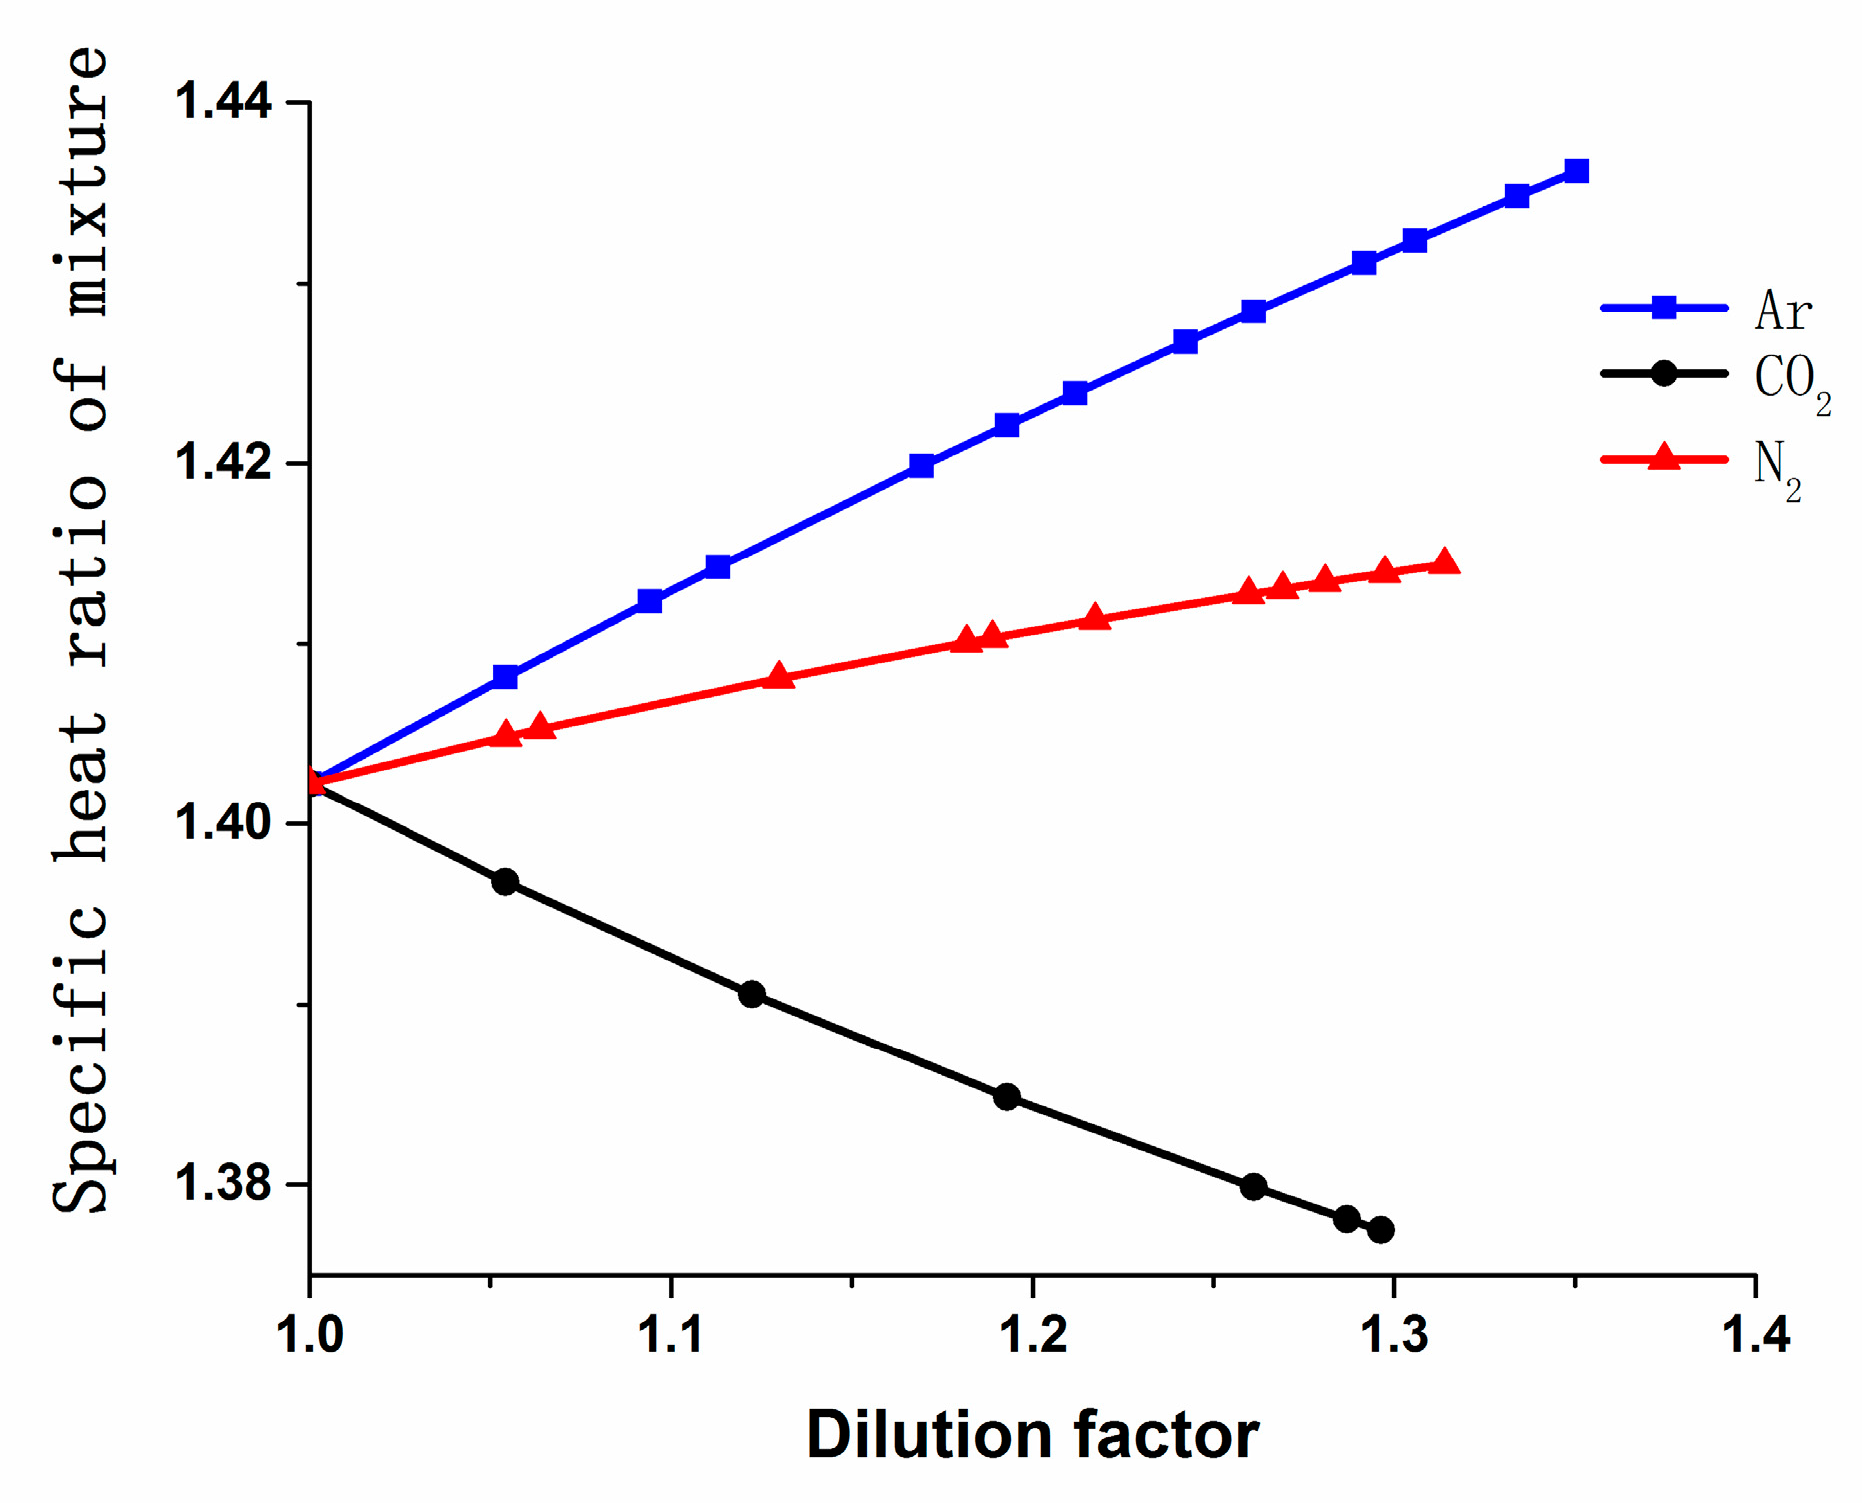
2.3. The Basic Physical Properties of Diluent Gases

Figure 2 shows the variation in heat capacities of the charge mixture at constant pressure (cp) with dilution gases added in the 101.325 kPa, 293.15 K condition. According to Equation (4), with the DF increasing, the heat capacity of N2 maintains the maximum growth rate, followed by CO2 and Ar. But as shown in the following Equation (5) and Table 2, the increase rate of heat capacity of CO2 is greater than N2 under high temperature environment, and the change of heat capacity of argon with temperature can be ignored for its chemical reaction inertia. Therefore, CO2 showed the most obvious effect on in-cylinder temperature, followed by N2 and Ar.
c p = m i c pi
c p 0 = a 0 + a 1 T + a 2 T 2 + a 3 T 3   kJ / ( kmol · K )
cp is the heat capacity at constant pressure of the charge mixture, mi represents the mass of each component in the mixture, and cpi is the heat capacity of this component, c p 0 is the heat capacity of pure gas, a0, a1, a2 and a3 are coefficients of the temperature.
Figure 3 shows the variation in specific heat ratio (κ) as a function of DF with different gases. According to Equations (6) and (7),
c v = m i c vi
κ = c pi c vi
cv is the heat capacity at constant volume of the charge mixture, and cvi is the heat capacity of a component. With the increase of DF, the specific heat ratio of CO2 keeps falling, the specific heat of N2 has a slight rise, but for Ar, it keeps rising sharply. According to the theoretical cycle of an internal combustion engine, the higher the specific heat ratio, the higher the thermal efficiency [33], so Ar has the highest thermal efficiency among these three gases, which can improve combustion.
Figure 4 [28] depicts the variation in thermal diffusivities of CO2, N2, Ar and air as a function of DF. Ar has higher thermal diffusivities even than air when the temperature is higher than 700 K; N2 has a similar thermal diffusivity as air, but with the temperature increasing this slightly increases; and CO2 has the lowest thermal diffusivities.

3. Results and Discussion

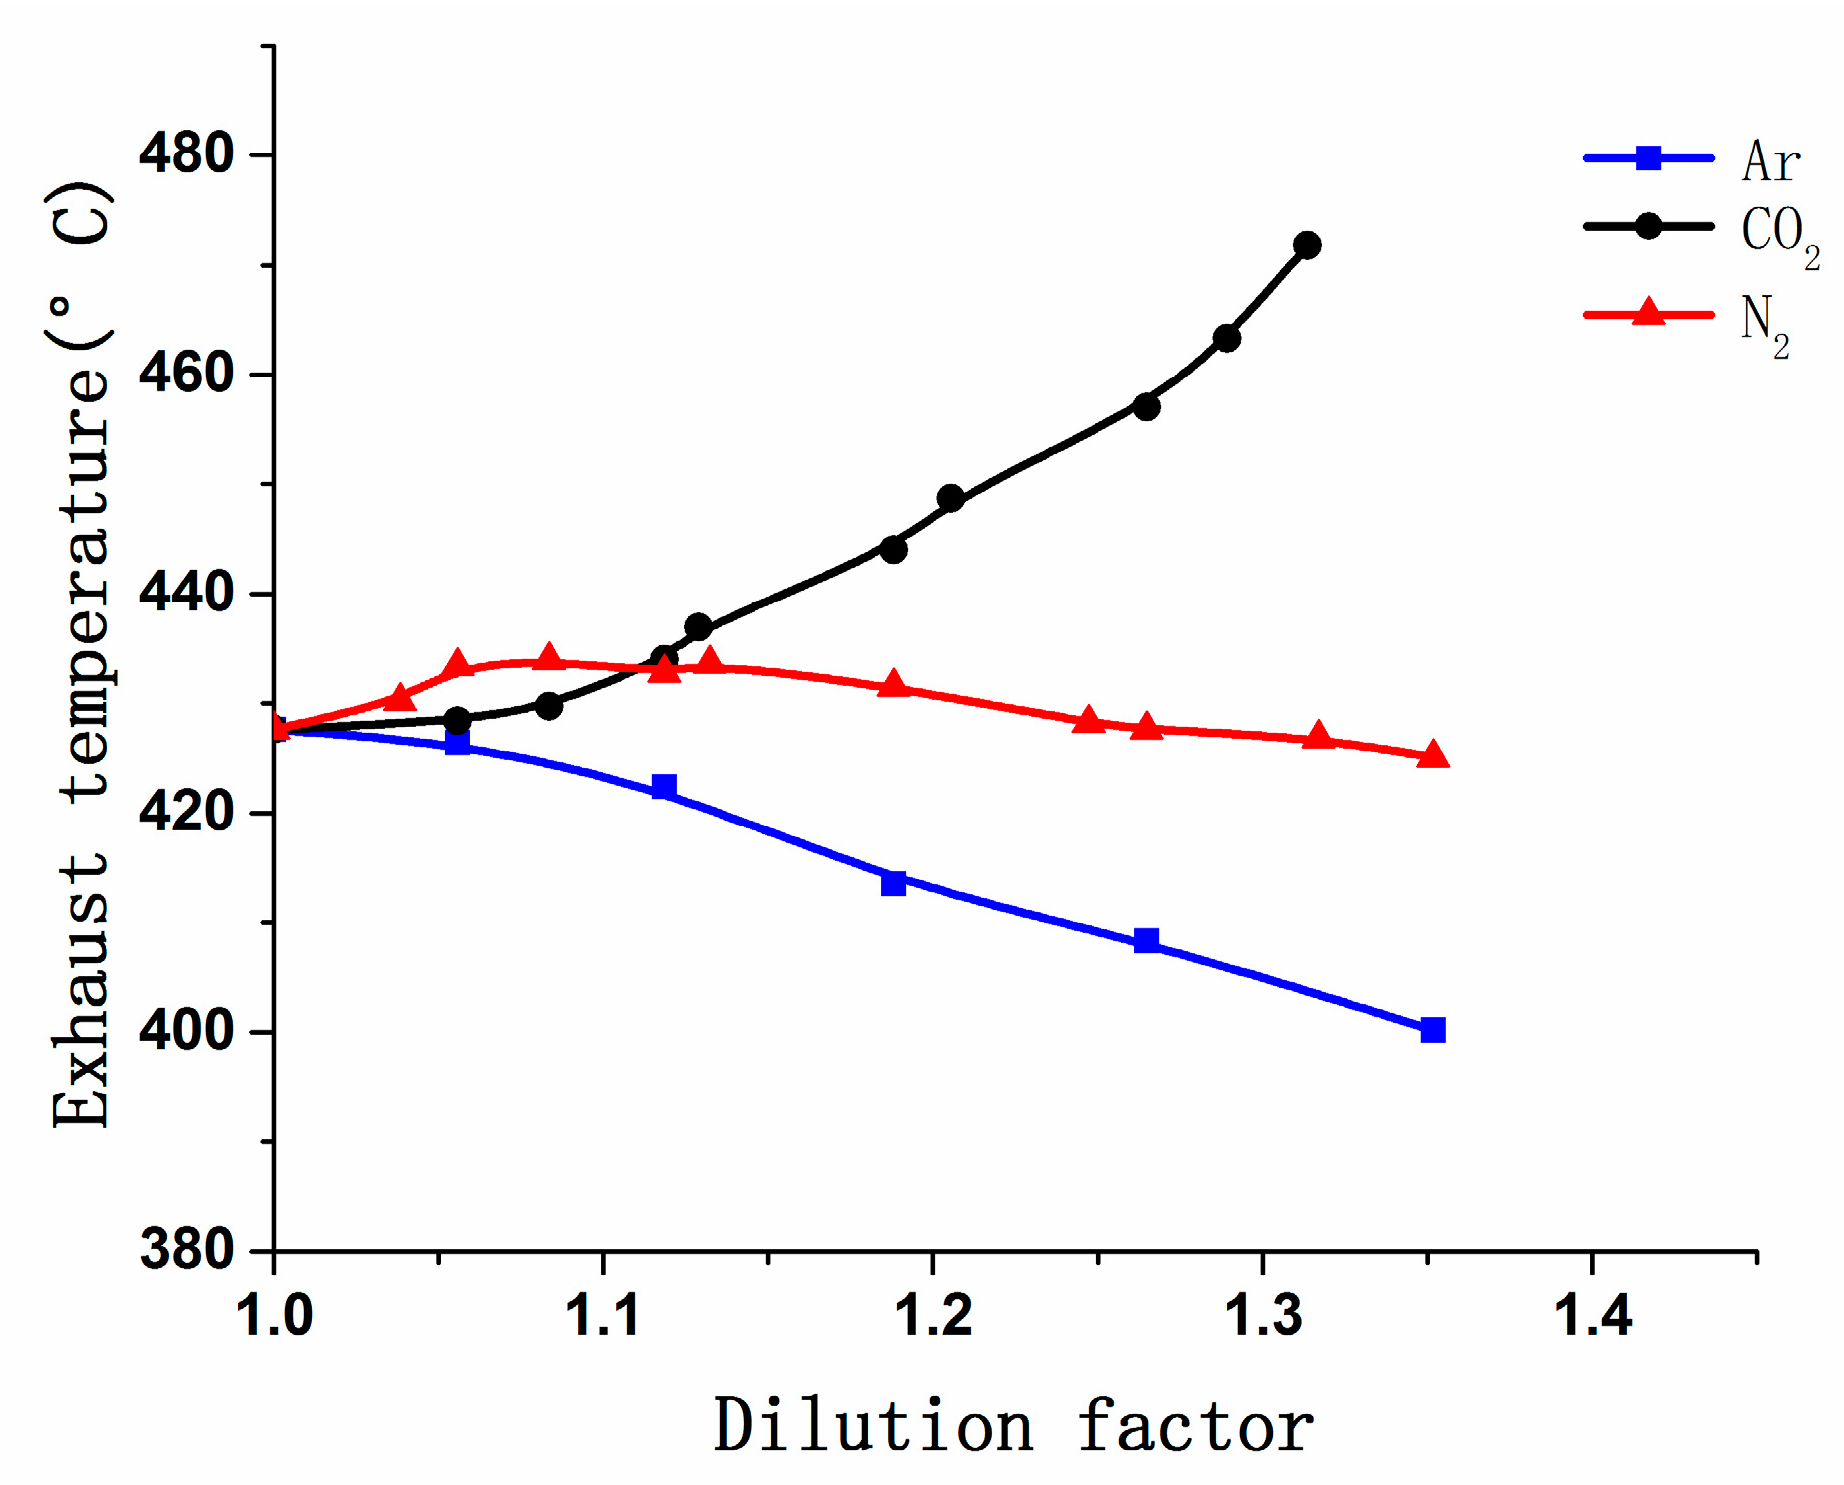
3.1. Effect of Dilution Gases on Combustion Characteristics

According to Srinvasan, the influence of EGR on in-cylinder combustion is mainly divided into three aspects. It can increase in the specific heat capacity of in-cylinder working gas through thermal effect, and diluent effect decreases available oxygen concentration for combustion. In addition, CO2 as a major component of EGR has a chemical effect during combustion [34].
Figure 5 shows the variation in the in-cylinder temperature as a function of crank angle with different DF. It can be clearly seen from Figure 5, as the DF increases, the peak of in-cylinder temperature of CO2 and N2 decreased and the crank angle matched with peak value was delayed. But for Ar, in-cylinder temperature became higher with the DF increasing, and its peak value was always near the top dead center. Figure 6 compares the maximum average in-cylinder temperature of the three dilution gases, the maximum average in-cylinder temperature of Ar increased continuously but the trend was opposite to CO2 and N2, CO2 showed the fastest falling speed. According to Figure 2 and Equation (5), due to the higher heat capacity meaning more heat is needed for changing 1 K [35], CO2 has the highest heat capacity under high temperature and showed the most obviously cooling effect followed by N2 and Ar. At the same time, the decrease in temperature caused the in-cylinder combustion preparation phase to be extended and the combustion reaction rate to be slowed down, so the moment when the highest temperature occurs was postponed.
Figure 7 shows the variation in the O2 mass concentration with increasing DF. The O2 concentration decreased significantly as DF increased, and the change in oxygen concentration was independent of gas type and DF. According to the molecular collision theory, the probability of the combination of methanol molecules with oxygen molecules is reduced and combustion will be affected [36].
Figure 8 illustrates the changes of combustion start point (CA10), combustion center (CA50) and cycle-by-cycle combustion variations (COV) with the DF of Ar, CO2, and N2. CA10 was defined as the crank angle at which 10% of gross heat release was reached, CA50 was defined as the crank angle at which 50% of gross heat release was reached, COV was defined as the ratio of the standard deviation of mean effective pressure to the average of mean effective pressure. For Ar, with the dilution factor increasing, CA10, CA50 and COV showed a small growth trend, the range of which is below 2°CA. It can be inferred that Ar hardly influenced the in-cylinder burning moment, while CO2 and N2 delayed and prolonged combustion distinctly.
Combustion is affected by chemical reaction kinetics, and temperature is the most important parameter of chemical reactions [37]. According to combustion theory, charging any kinds of diluent gas will affect the combustion process, and the introduction of inert gas with high thermal diffusivity is conducive to the spread of flame [38,39,40]. As shown in Figure 4, Ar has higher thermal diffusivity than air so that it was more conducive to fire nucleation and flame propagation. Both the thermal effect and dilution effect of Ar can affect CA10, CA50 and COV, but the former was stronger, so that CA10, CA50 and COV have not been delayed obviously. By contrast, when using CO2 or N2 as dilution gas, combustion reaction speed turned slowly because of the in-cylinder temperature decreasing. Moreover, according to Zhaoyang Chen [38], Ar and N2 are all chemically passive agents and do not participate in in-cylinder chemical reaction. Although CO2 is also a chemical passive agent, it is a major reaction product. CO2 weakens the flame and decreases the H atom concentration because of the reversal of the reaction, CO + OH = CO2 + H. Hence CO2 has chemical effect on combustion which was different from the other two gases, and it led to the lowest flame values so that delay of CA10, CA50 and COV was the most serious, followed by N2 and Ar.
Figure 9 depicts the variation in the in-cylinder pressure as a function of crank angle with different DF. As it is shown in Figure 9, there was nearly no changes of in-cylinder pressure and crank angle matched with peak value of Ar with dilution factor increasing. But there was an opposite trend of CO2 and N2. With the DF increasing, the in-cylinder pressure of N2 decreased constantly, and CO2 had the lowest in-cylinder pressure. Moreover, crank angle matched with peak value was delayed. When the dilution factor was more than 1.05, the in-cylinder pressure curve showed a double peak. Due to the thermal effect and dilution effect, CA10 and CA50 were delayed and the peak of heat release rate deviated from the top dead center so that the peak of in-cylinder pressure deviates from the top dead center and decreases. This can confirm that CO2 and N2 is capable to reduce in-cylinder pressure, and at the same time, they can be used as an inhibitor of abnormal combustion occurrence such as knock within a certain range. But CO2 and N2 can also cause combustion deterioration.
It can be seen clearly in Figure 10 that when CO2 was charged, exhaust temperature increased as the dilution factor was increasing; for N2, the exhaust temperature increased slightly first, then the curve became flat; but Ar showed the opposite trend. As shown in Figure 8 and Figure 9, combustion duration was extended and CA10 was postponed when N2 and CO2 are charged, post-combustion was longer, and the combustion stability became worse, so a part of the mixture burned in the exhaust pipes, which made exhaust temperature rise. However, CO2 was more potent in delaying combustion, so it made exhaust temperature continue rising.

3.2. Effect of Dilution Gases on NOx Emissions

Figure 11 shows the effects of CO2, N2 and Ar on NOx emissions. NOx emissions decreased significantly with increasing DF no matter what kind of gas was charged. NOx emissions decreased by 77.5%, from 934 ppm to 210 ppm, as the DF increased from 1 to 1.67 reaching the dilution limitation for Ar; when DF reached 1.26, NOx cannot be detected within exhaust gas for CO2, when DF reaching 1.32, NOx can’t be detected in exhaust gas for N2. According to a related study conducted by the former Soviet Union scholar Zeldovich on the mechanism of NOx formation, it was found that NOx is generated by a chain reaction under a high-temperature flame and a high oxygen concentration area [30].
As shown clearly in Figure 7, different gases should have similar effects on oxygen concentration at the same DF so that the NOx emissions reduction caused by decreasing in oxygen concentration is considered at an equal level. According to Guldber and Waage [28], the direct effect of diluent is the reduction of O2 molecular concentrations that suppress effective collision between methanol molecules and oxygen molecules. Oxygen concentration is an indirect effect on combustion rate and reaction temperature.
According to Figure 2, the heat capacity of different gases differs significantly, because of their different molecular structures. And according to Equation (5), under high temperature condition, the heat capacity of CO2 is higher than N2. Figure 6 shows maximum average in-cylinder temperature, because of the thermal effect, using CO2 as a diluent gas achieved the lowest in-cylinder temperature, followed by N2. There was an opposite trend for Ar, which can confirm that thermal effect of Ar did not reduce NOx emissions, so the decline of NOx emissions was all caused by dilution effect, and the dilution effect of three gases at different dilution factors was the same, according to the above, only CO2 had a chemical effect on combustion. On the basis of Ar, the percentage of dilution effect on NOx emissions can be calculated according to the following method.
DEP = Con Ar Con total × 100 %
According to Figure 12a, the dilution effect of Ar reduced NOx emissions by 253 ppm by 100%. N2 reduced NOx emissions by 675 ppm, with dilution effects accounting for 37%, and thermal effect accounting for 63%. CO2 reduced NOx emissions by 778 ppm, with a dilution effect of 33%, and thermal effect and chemical effect of 67% totally. Figure 12b depicts the variations of the proportion of dilution effect, thermal effect and chemical effect of different dilution factors. As shown in (b), the decreased NOx emissions of Ar were all caused by the dilution effect, and with the DF increasing, the dilution effect on CO2 and N2 was gradually strengthened.

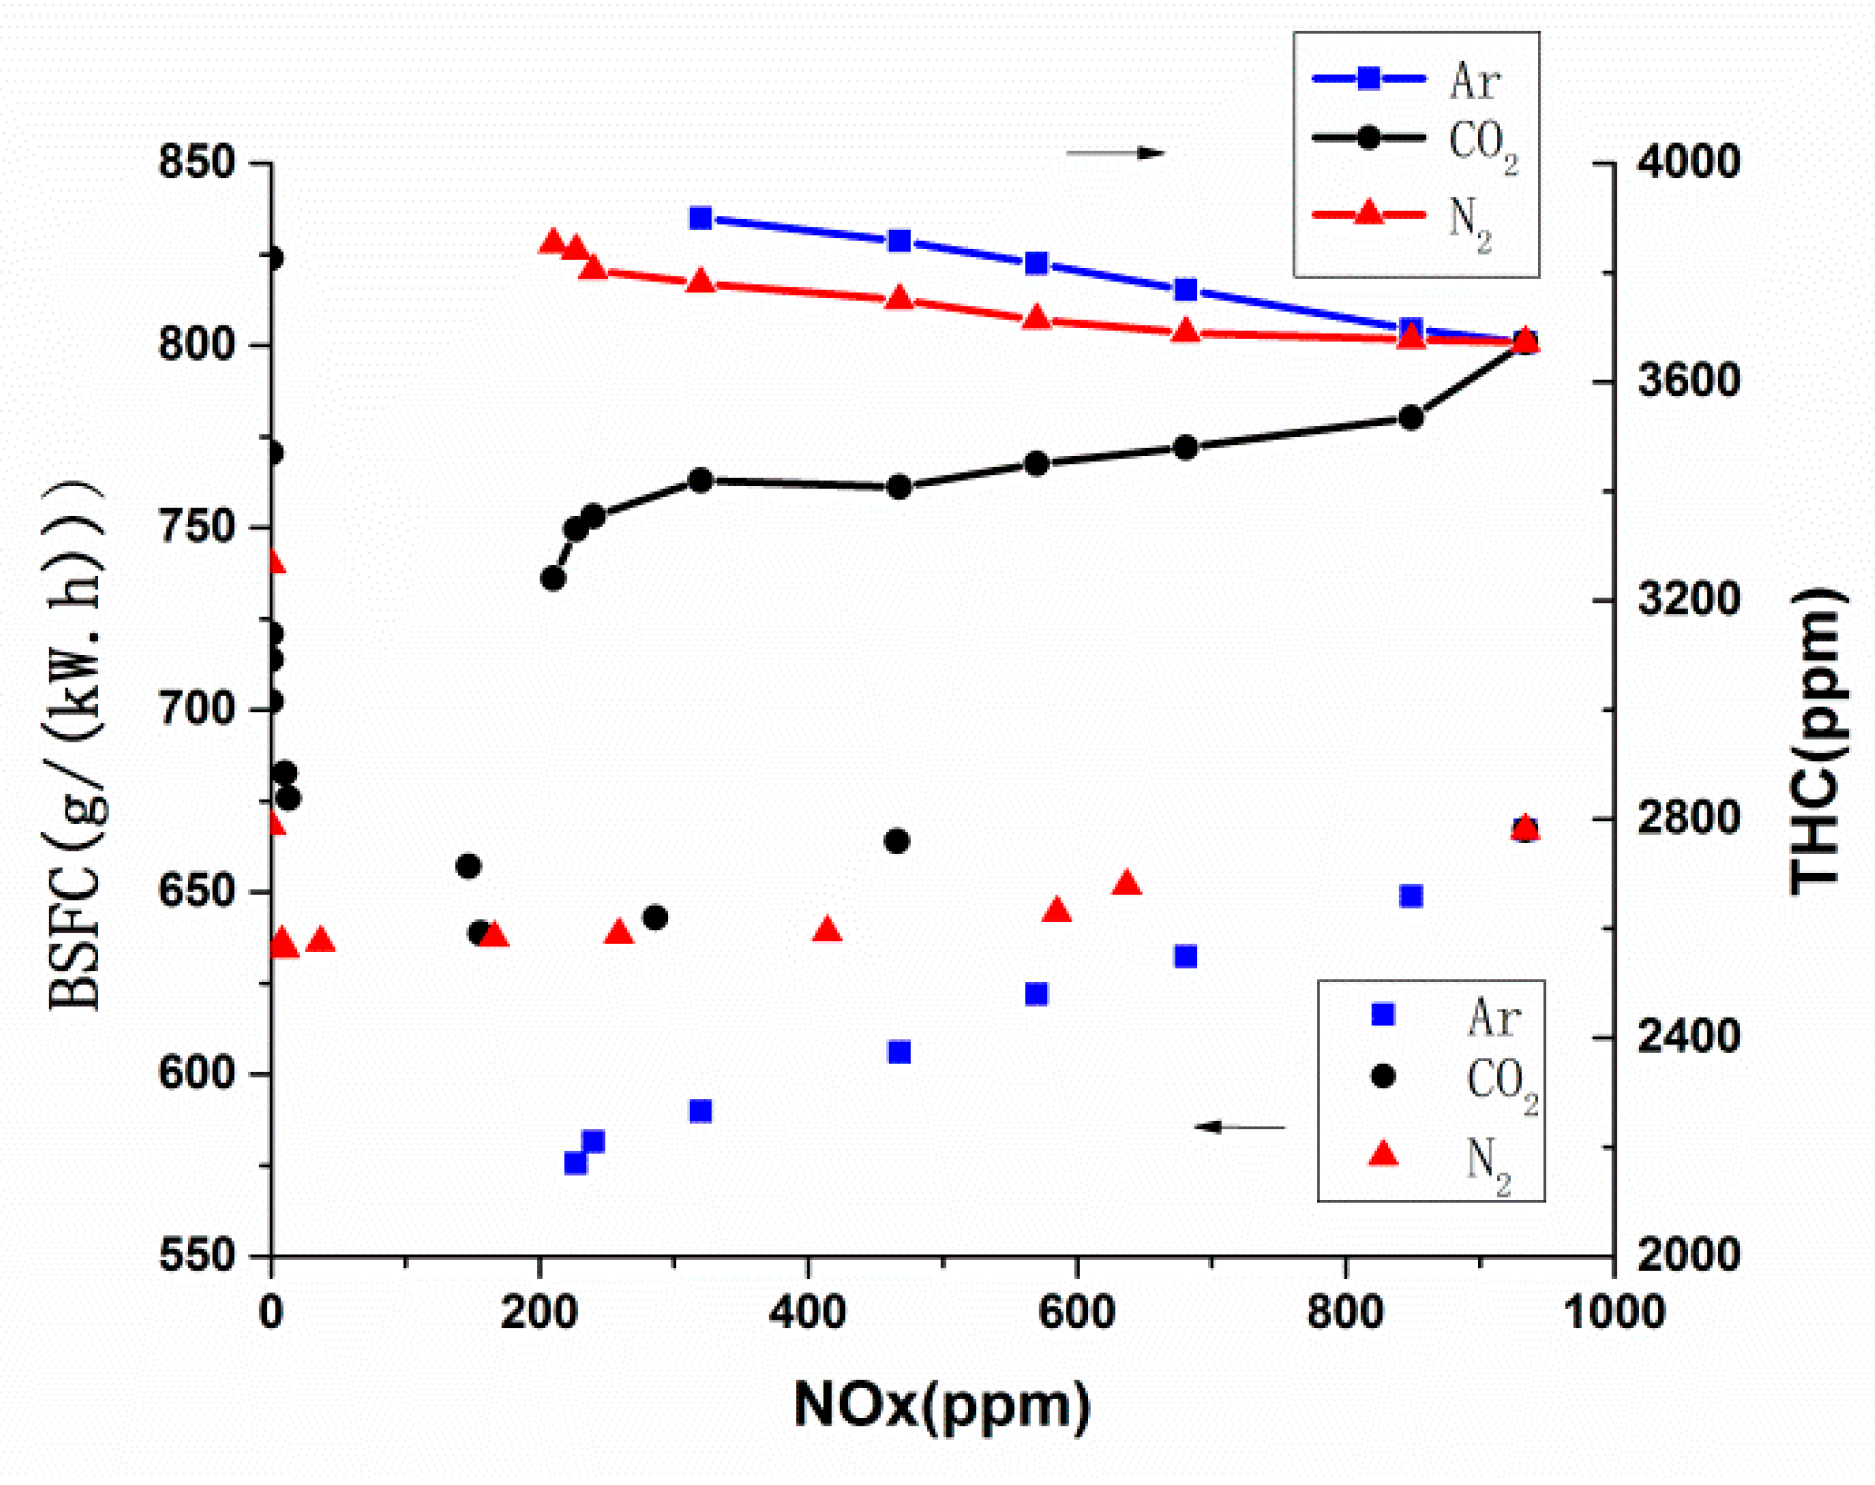
3.3. Effect of Dilution Gases on total hydro carbons (THC) Emissions

Figure 13 illustrates the effects of CO2, N2 and Ar on THC emissions. The THC emissions showed different trends as the DF increases. THC emissions increased by 6.2%, from 3672 ppm to 3900 ppm, and increased by 7.2%, from 3672 ppm to 3936 ppm, as the DF increased from 1 to 1.35 reaching the dilution limitation for Ar and N2. But for CO2, it showed an opposite trend, when DF reached 1.35, THC emissions decreased by 12.1%, from 3672 ppm to 3228 ppm. It can be seen that charging CO2 had a beneficial effect on reducing THC emissions.
THC emissions are mainly caused by incomplete in-cylinder combustion, wall quenching effects, slit effects, and oil film and carbon adsorption; in addition, as the temperature of the exhaust gas increases, part of the discharged THC can continue to be oxidized in the exhaust pipe [41,42,43]. Under the same combustion chamber structure, it was considered that the effects of slit effect, oil film and carbon adsorption on THC emissions were same when filling different dilution gases.
As shown in Figure 10, CO2 dilution delayed CA10 and CA50, causing the in-cylinder combustion reaction to lag, and the exhaust gas temperature always increased with the increase of DF, the increase of exhaust temperature causing THC to be oxidized in the exhaust pipes. In addition, according to Figure 8 and Figure 9, the in-cylinder pressure decreased as DF increasing when charging CO2 as a dilution gas, and crank angle matched with peak value was delayed, as CA10 was postponed, the mass fraction of THC trapped in the crevice volumes is reduced [44]. Although using Ar as diluent gas achieved a better combustion, the exhaust temperature of Ar was lower than N2, and these two reasons made the THC emissions change similarly when Ar and N2 were charged. Although CO2 caused the combustion deterioration, at the same time, the oxidation effect of THC under high temperature in the exhaust pipe was greater than the effect of incomplete combustion in the cylinder, so using CO2 as diluent gas can effectively reduce THC emissions.

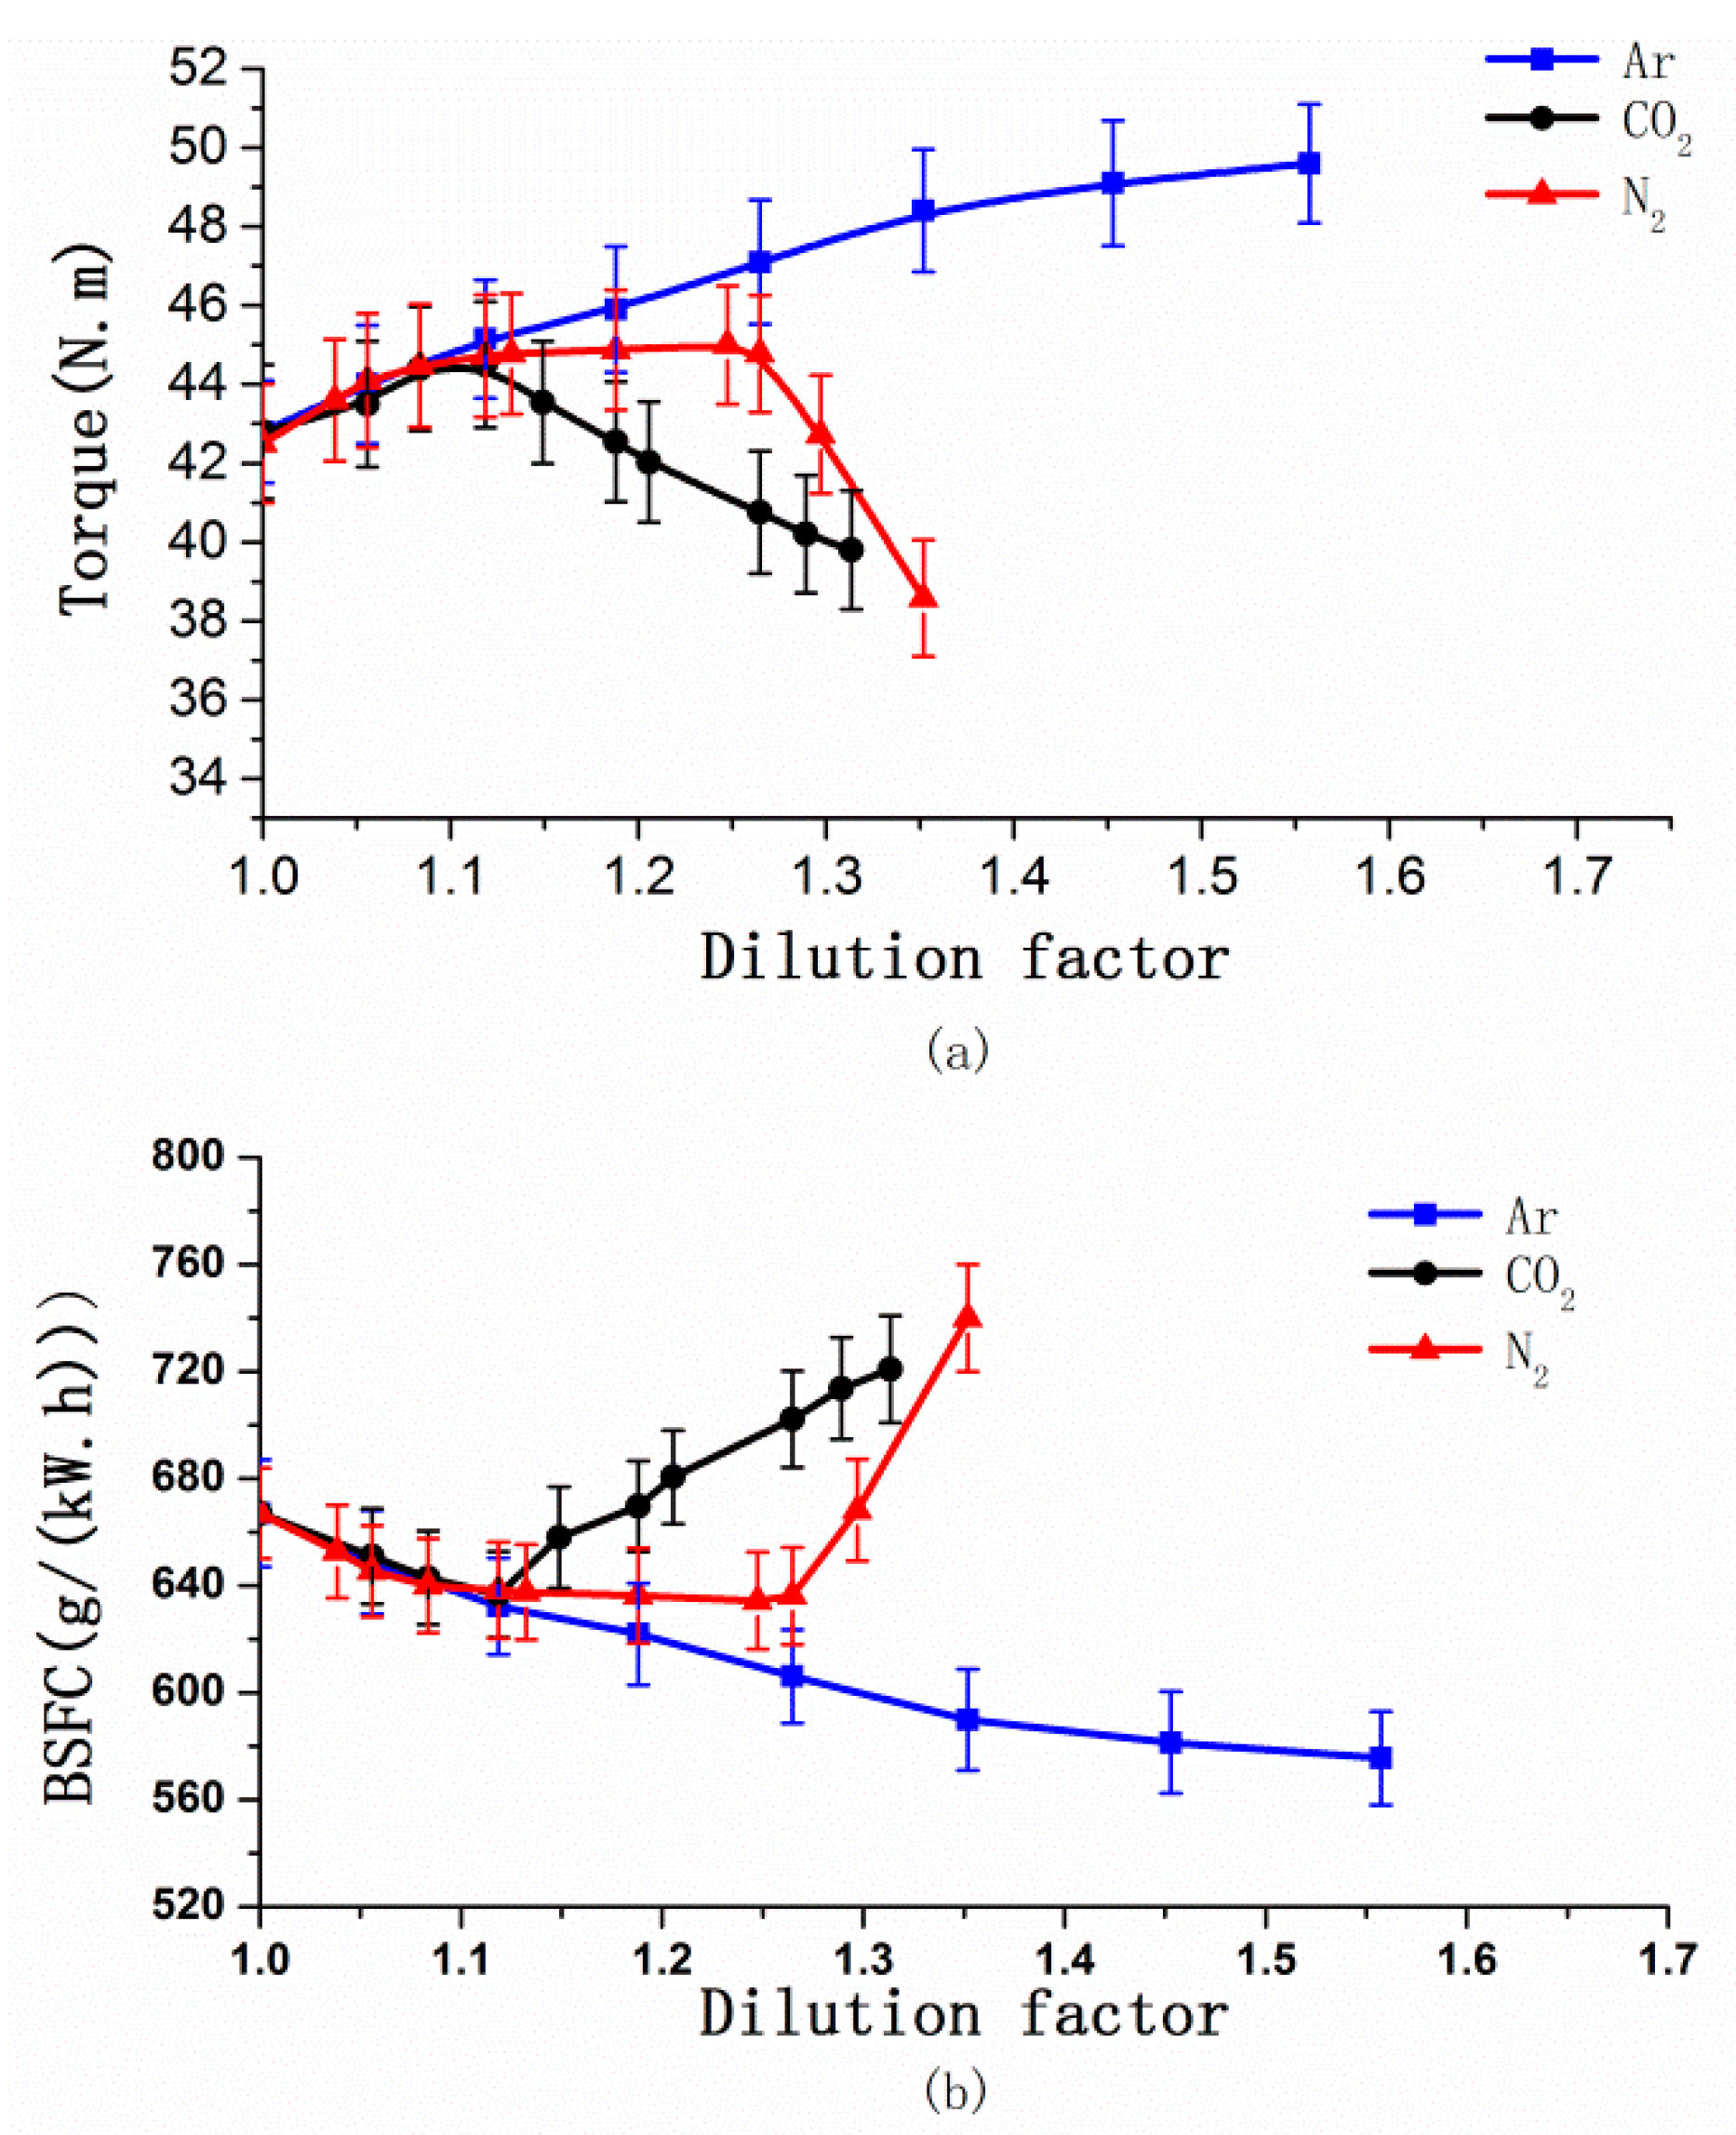
3.4. Effect of Dilution Gases on Brake-Specific Fuel Consumption (BSFC)

Figure 14 shows the effects of CO2, N2 and Ar on brake-specific fuel consumption (BSFC) and torque. BSFC was falling first and then rising with increasing DF no matter what kind of gas was charged. Torque experienced the opposite trend. The BSFC reached a minimum of 575.56 g/(kW.h), 86.2% of the original machine, and torque reached a maximum of 49.6 N.m as the DF at 1.56 for Ar. When the DF was 1.12 for CO2, the BSFC reached a minimum of 638.65 g/(kW.h), 95.75% of the original machine, and torque reached a maximum of 44.73 N.m. The BSFC reached a minimum of 634.39 g/(kW.h), 95.11% of the original machine, and torque reached a maximum of 45 N.m, with the DF was 1.25 for N2. There are two main factors affecting the BSFC, the specific heat ratio of the mixture and the in-cylinder combustion condition. According to the theoretical cycle of an internal combustion engine, the smaller the specific heat ratio of mixture, the lower theoretical heat efficiency, and the higher the BSFC [33].
As shown in Figure 3, for Ar, because of the highest specific heat ratio and there are hardly changes of in-cylinder combustion, so Ar achieved the minimum BSFC. For N2 and CO2, there were obviously changes of in-cylinder combustion; as Figure 8 shows, the ignition was delayed and COV increased with increasing DF, so that the constant volume of combustion decreased, and the mixture performed a reduction in the function of the expansion stroke. In particular for CA50, Heywood found that the best engine dynamic performance can be obtained when CA50 is about 8–9° CA ATDC. The delayed CA50 generally means increased post combustion, which will decrease the conversion efficiency of fuel [30]. When the effect of the in-cylinder combustion was greater than that of the specific heat ratio, BSFC rose. Due to CO2 causing worse combustion than N2 and the decreasing specific heat ratio, this caused the highest methanol consumption.
Figure 15 shows the variation in methanol consumption and THC emissions as a function of NOx emissions of these three dilution gases until reaching the dilution limitation. When using Ar as the diluent gas, with the decrease of NOx emissions the methanol consumption rate dropped most obviously, until reaching the minimum NOx emissions, which was because of the higher specific heat ratio and better combustion of Ar. For CO2 and N2, with the reduction of NOx emissions there was a slight decrease in the methanol consumption rate until reaching the minimum NOx emissions. After reaching the minimum NOx emissions, this continued increasing DF until the dilution limitation, and the methanol consumption rate of all three gases increased sharply. For THC emissions, CO2 can decrease NOx emissions and THC emissions at the same time, but Ar and N2 had the opposite trend.

4. Conclusions

The present work investigated the influence of charging diluents in an SI engine fueled with methanol on emissions and performance. The specific conclusions are as follows:
(1) With the DF increasing, Ar showed weak effects on combustion for its stable chemical properties. CO2 and N2 delayed the combustion start point, slowed down the flame speed and lowered the in-cylinder temperature; they caused the deterioration of combustion, but can also suppress knock within a certain range.
(2) Before reaching the dilution limit, NOx emissions decreased by 77.5%, from 934 ppm to 210 ppm for Ar, but CO2 and N2 can decrease NOx emissions to zero. Ar influenced NOx emissions by dilution effect only; N2 also showed a thermal effect; and only CO2 had chemical effect because it can participate in the combustion reaction leading to an effect on the progress of the reaction.
(3) Compared to N2 and CO2, Ar deteriorated THC emissions as the dilution factor increased, even it hardly showed harmful effect on in-cylinder combustion. Higher exhaust temperature is beneficial for the THC to be oxidized in exhaust pipes, and lower cylinder pressure is beneficial to reduce the mass fraction of THC trapped in the crevice volumes, so CO2 can effectively reduce THC emissions.
(4) Each diluent can increase torque and reduce fuel consumption within a certain range. Due to Ar having the highest specific heat ratio and not deteriorating combustion, it produced the most obvious effect, followed by N2 and CO2.
In general, the use of diluents will optimize engine performance in different aspects; every diluent can decrease NOx emissions and BSFC at the same time until reaching the minimum NOx emissions, but Ar can make an optimized balance between NOx emissions and BSFC, followed by N2 and CO2. CO2 can suppress knock and decrease NOx and THC emissions at the same time, but Ar and N2 had the opposite trend. Based on the characteristics and currently known effects of these three pure gases, a better diluent can be formulated in the future; in addition, the microscopic effects of different diluents in the combustion reaction also require more in-depth analysis.

Author Contributions

Experiment, Y.Z. and Y.S.; Analysis, F.X.; Software, X.L.; Supervision, W.H.; Writing-Original Draft Preparation, Y.Z.; Writing-Review & Editing, Y.S. and F.X.; Data Curation, Y.Y.

Funding

This work is supported financially by the National Natural Science Foundation of China (51876079), Science and Technology Pilot Projects of Jilin Province (20170101137JC and 20180201008GX), Science and Technology Research Projects of Jilin Province education department for 13th Five Year Plan (JJKH20180141KJ), Project of Jilin Province Development and Reform Commission (2019C058-4), Excellent Youth Talent Fund Project (20190103049JH), Graduate Innovation Fund of Jilin University (101832018C204).

Conflicts of Interest

The authors declare no conflict of interest.

Nomenclature

SIspark ignitionDFdilution factor
CIcombustion ignition m inlet air mass flow for stoichiometric combustion
BTEbrake thermal efficiency m methanol practical injecting methanol mass flow
CRcompression ratio AFR methanol theoretical air fuel ratio of methanol
BSFCbreak-specific fuel consumptionmgasmass flow rates of diluents
COVIMEPmean effective pressure cyclic variationmairpractical air mass flow
EGRexhaust gas recirculationαdilution factor
λexcess air coefficientcpheat capacity at constant pressure
κvariation in specific heat ratiocvheat capacity at constant volume
CA10combustion start pointCA50combustion left
DEPdilution effect percentageConArreduced NOx concentration by Ar
Contotalreduced NOx concentration by diluent (Ar, CO2, NOx)BTDCbefore top dead left
ATDCafter top dead leftTHCtotal hydro carbons
GDIgasoline direct injectionCAcrank angle

References

  1. Benajes, J.; García, A.; Monsalve-Serrano, J.; Balloul, I.; Pradel, G. An assessment of the dual-mode reactivity controlled compression ignition/conventional diesel combustion capabilities in a EURO VI medium-duty diesel engine fueled with an intermediate ethanol-gasoline blend and biodiesel. Energy Convers. Manag. 2016, 123, 381–391. [Google Scholar] [CrossRef]
  2. Abdelaal, M.M.; Hegab, A.H. Combustion and emissions characteristics of a natural gas-fueled diesel engine with EGR. Energy Convers. Manag. 2012, 64, 301–312. [Google Scholar] [CrossRef]
  3. Jiansen, Y. Artificial neural network modeling of methanol production from syngas. Pet. Sci. Technol. 2019, 37, 629–632. [Google Scholar]
  4. Leach, F.C.; Stone, R.; Richardson, D.; Turner, J.W.; Lewis, A.; Akehurst, S.; Remmert, S.; Campbell, S.; Cracknell, R. The effect of oxygenate fuels on PN emissions from a highly boosted GDI engine. Fuel 2018, 225, 277–286. [Google Scholar] [CrossRef]
  5. Chen, Z.; Wang, L.; Zhang, Q.; Zhang, X.; Yang, B.; Zeng, K. Effects of spark timing and methanol addition on combustion characteristics and emissions of dual-fuel engine fuelled with natural gas and methanol under lean-burn condition. Energy Convers. Manag. 2019, 181, 519–527. [Google Scholar] [CrossRef]
  6. Turner, J.W.; Lewis, A.G.; Akehurst, S.; Brace, C.J.; Verhelst, S.; Vancoillie, J.; Sileghem, L.; Leach, F.; Edwards, P.P. Alcohol fuels for spark-ignition engines: Performance, efficiency and emission effects at mid to high blend rates for binary mixtures and pure components. Inst. Mech. Eng. 2018, 232, 36–56. [Google Scholar] [CrossRef] [Green Version]
  7. Agarwal, A.K.; Karare, H.; Dhar, A. Combustion, performance, emissions and particulate characterization of a methanol–gasoline blend (gasohol) fuelled medium duty spark ignition transportation engine. Fuel Process. Technol. 2014, 121, 16–24. [Google Scholar] [CrossRef]
  8. Soni, D.K.; Gupta, R. Optimization of methanol powered diesel engine: A CFD approach. Appl. Therm. Eng. 2016, 106, 390–398. [Google Scholar] [CrossRef]
  9. Svensson, E.; Li, C.; Shamun, S.; Johansson, B.; Tuner, M.; Perlman, C.; Lehtiniemi, H.; Mauss, F. Potential Levels of Soot, NOx, HC and CO for Methanol Combustion; 2016-01-0887; SAE: Warrendale, PA, USA, 2016. [Google Scholar]
  10. Nguyen, D.-K.; Sileghem, L.; Verhelst, S. Exploring the potential of reformed-exhaust gas recirculation (R-EGR) for increased efficiency of methanol fueled SI engines. Fuel 2019, 236, 778–791. [Google Scholar] [CrossRef]
  11. Di Blasio, G.; Belgiorno, G.; Beatrice, C. Effects on performances, emissions and particle size distributions of a dual fuel (methane-diesel) light-duty engine varying the compression ratio. Appl. Energy 2017, 204, 726–740. [Google Scholar] [CrossRef]
  12. Srivastava, D.K.; Agarwal, A.K. Combustion characteristics of a variable compression ratio laser-plasma ignited compressed natural gas engine. Fuel 2018, 214, 322–329. [Google Scholar] [CrossRef]
  13. Ibrahim, A.; Bari, S. Effect of varying compression ratio on a natural gas SI engine performance in the presence of EGR. Energy Fuels 2009, 23, 4949–4956. [Google Scholar] [CrossRef]
  14. Li, Y.; Bai, X.S.; Tunér, M.; Im, H.G.; Johansson, B. Investigation on a high-stratified direct injection spark ignition (DISI) engine fueled with methanol under a high compression ratio. Appl. Therm. Eng. 2019, 148, 352–362. [Google Scholar] [CrossRef]
  15. Celik, M.B.; Özdalyan, B.; Alkan, F. The use of pure methanol as fuel at high compression ratio in a single cylinder gasoline engine. Fuel 2011, 90, 1591–1598. [Google Scholar] [CrossRef]
  16. Fontana, G.; Galloni, E. Experimental analysis of a spark-ignition engine using exhaust gas recycle at WOT operation. Appl. Energy 2010, 87, 2187–2193. [Google Scholar] [CrossRef]
  17. Ishida, M.; Yamamoto, S.; Ueki, H.; Sakaguchi, D. Remarkable improvement of NOx–PM trade–off in a diesel engine by means of bioethanol and EGR. Energy 2010, 35, 4572–4581. [Google Scholar] [CrossRef]
  18. Zamboni, G.; Capobianco, M. Influence of high and low pressure EGR and VGT control on in-cylinder pressure diagrams and rate of heat release in an automotive turbocharged diesel engine. Appl. Therm. Eng. 2013, 51, 586–596. [Google Scholar] [CrossRef]
  19. Xie, F.; Hong, W.; Su, Y. Effect of external hot EGR dilution on combustion, performance and particulate emissions of a GDI engine. Energy Convers. Manag. 2017, 142, 69–81. [Google Scholar] [CrossRef]
  20. Belgiornoa, G.; Dimitrakopoulos, N. Effect of the engine calibration parameters on gasoline partially premixed combustion performance and emissions compared to conventional diesel combustion in a light-duty Euro 6 engine. Appl. Energy 2018, 228, 2221–2234. [Google Scholar] [CrossRef]
  21. Ladommatos, N.; Abdelhalim, S.; Zhao, H.; Hu, Z. The Dilution, Chemical, and Thermal Effects of Exhaust Gas Recirculation on Diesel Engine Emissions—Part 4: Effects of Carbon Dioxide and Water Vapour; SAE Paper No. 971660; Society of Automotive Engineers: Warrendale, PA, USA, 1997. [Google Scholar]
  22. Ladommatos, N.; Abdelhalim, S.; Zhao, H.; Hu, Z. The Dilution, Chemical, and Thermal Effects of Exhaust Gas Recirculation on Diesel Engine Emissions—Part 1: Effect of Reducing Inlet Charge Oxygen; SAE Paper No. 961165; Society of Automotive Engineers: Warrendale, PA, USA, 1996. [Google Scholar]
  23. Ladommatos, N.; Abdelhalim, S.; Zhao, H.; Hu, Z. The Dilution, Chemical and Thermal Effects of Exhaust Gas Recirculation on Diesel Emissions—Part 2: Effects of Carbon Dioxide; SAE Paper No. 961167; Society of Automotive Engineers: Warrendale, PA, USA, 1996. [Google Scholar]
  24. Ladommatos, N.; Abdelhalim, S.; Zhao, H.; Hu, Z. The Dilution, Chemical, and Thermal Effects of Exhaust Gas Recirculation on Diesel Engine Emissions—Part 3: Effects of Water Vapour; SAE Paper No. 971659; Society of Automotive Engineers: Warrendale, PA, USA, 1997. [Google Scholar]
  25. Maria, G. Buonomenna. Membrane separation of CO2 from natural gas. Recent Pat. Mater. Sci. 2017, 10, 26–49. [Google Scholar]
  26. Li, L.; Shen, Y. Gas turbine argon gas circulation driving system. Chinese Patent CN204716320, 21 October 2015. [Google Scholar]
  27. Mansor, M.R.A.; Shioji, M. Investigation of the combustion process of hydrogen jets under argon-circulated hydrogen-engine conditions. Combust. Flame 2016, 173, 245–257. [Google Scholar] [CrossRef]
  28. Li, W.; Liu, Z.; Wang, Z. Experimental investigation of the thermal and diluent effects of EGR components on combustion and NOx emissions of a turbocharged natural gas SI engine. Energy Convers. Manag. 2014, 88, 1041–1050. [Google Scholar] [CrossRef]
  29. Zhang, M.; Hong, W.; Xie, F. Influence of diluents on combustion and emissions characteristics of a GDI engine. Appl. Therm. Eng. 2017, 124, 746–755. [Google Scholar] [CrossRef]
  30. Zheng, M.; Reader, G.; Hawley, J. Diesel engine exhaust gas recirculation—A review on advanced and novel concepts. Energy Convers. Manag. 2004, 45, 883–900. [Google Scholar] [CrossRef]
  31. Brecq, G.; Bellettre, J.; Tazerout, M.; Muller, T. Knock prevention of CHP engines by addition of N and CO to the natural gas fuel. Appl. Therm. Eng. 2003, 23, 1359–1371. [Google Scholar] [CrossRef]
  32. Parka, C.; Lee, S. Full load performance and emission characteristics of hydrogen-compressed natural gas engines with valve overlap changes. Fuel 2014, 123, 101–105. [Google Scholar]
  33. Heywood, J.B. Internal Combustion Engine Fundamentals; McGraw-Hill: New York, NY, USA, 1988. [Google Scholar]
  34. Srinvasan, K.K.; Krishnan, S.R.; Qi, Y.; Midkiff, C.; Yang, H. Analysis of diesel pilot ignited natural gas low-temperature combustion with hot exhaust gas recirculation. Combust. Sci. Technol. 2007, 179, 1737–1776. [Google Scholar] [CrossRef]
  35. Park, C.; Won, S.; Kim, C.; Choi, Y. Effect of mixing CO with natural gas–hydrogen blends on combustion in heavy-duty spark ignition engine. Fuel 2012, 102, 299–304. [Google Scholar] [CrossRef]
  36. Li, W.; Liu, Z.; Wang, Z. Experimental and theoretical analysis of effects of N, O2 and Ar in excess air on combustion and NOx emissions of a turbocharged NG engine. Energy Convers. Manag. 2015, 97, 253–264. [Google Scholar] [CrossRef]
  37. Bendu, H.; Sivalingam, M. Experimental investigation on the effect of charge temperature on ethanol fueled HCCI combustion engine. J. Mech. Sci. Technol. 2016, 30, 4791–4799. [Google Scholar] [CrossRef]
  38. Chen, Z.; Tang, C.; Fu, J. Experimental and numerical investigation on diluted DME flames: Thermal and chemical kinetic effects on laminar flame speeds. Fuel 2012, 102, 567–573. [Google Scholar] [CrossRef]
  39. Prathap, C.; Ray, A. Investigation of nitrogen dilution effects on the laminar burning velocity and flame stability of syngas fuel at atmospheric condition. Combust. Flame 2008, 155, 145–160. [Google Scholar] [CrossRef]
  40. Lide, D.R. Handbook of Chemistry and Physics; CRC Press: Boca Raton, FL, USA, 2009. [Google Scholar]
  41. Teng, H.; Mccandless, J.C.; Schneyer, J.B. Themochemical Characteristics of Dimethyl Ether an Alternative Fuel for Compression-ignition Engines; SAE Paper, 2001-01-0154; SAE: Warrendale, PA, USA, 2001. [Google Scholar]
  42. Dernotte, J.; Mounaim-Rousselle, C.; Halter, F.; Seers, P. Evaluation of butanolgasoline blends in a port fuel-injection, spark-ignition engine. Oil Gas Sci. Technol. 2010, 65, 345–351. [Google Scholar] [CrossRef]
  43. Iodice, P.; Senatore, A.; Langella, G.; Amoresano, A. Effect of ethanol–gasoline blends on CO and HC emissions in last generation SI engines within the cold-start transient: An experimental investigation. Appl. Energy 2016, 179, 182–190. [Google Scholar] [CrossRef]
  44. Lavoie, G.A.; Blumberg, P.N. A fundamental model for predicting fuel consumption, NOx and HC emissions of the conventional spark-ignited engine. Combust. Sci. Technol. 1980, 21, 225–258. [Google Scholar] [CrossRef]
Figure 1. Schematic diagram of the experimental setup.
Energies 12 03366 g001
Figure 2. Variation in the mixture heat capacity vs. the DF of CO2, N2, and Ar.
Energies 12 03366 g002
Figure 3. Variation in the mixture specific heat ratio vs. the DF of CO2, N2, and Ar.
Energies 12 03366 g003
Figure 4. Variation in thermal diffusivities of CO2, N2 and Ar and air vs. temperature [28]. Adapted with permission from [Zhongshu Wang], Li, W.; Liu, Z.; Wang, Z. Experimental investigation of the thermal and diluent effects of EGR components on combustion and NOx emissions of a turbocharged natural gas SI engine. Energy Convers. Manag. 2014.
Energies 12 03366 g004
Figure 5. Variation in the cylinder temperature vs. crank angle with the dilution factor (DF) of CO2, N2 and Ar.
Energies 12 03366 g005
Figure 6. Variation in the maximum average in-cylinder temperature vs. the DF of CO2, N2, and Ar.
Energies 12 03366 g006
Figure 7. Variation in the O2 concentration in the cylinder vs. the DF of CO2, N2, and Ar.
Energies 12 03366 g007
Figure 8. Changes of combustion start point (CA10), combustion center (CA50), cycle-by-cycle combustion variations (COV) vs. the DF of CO2, N2 and Ar, (a) CA10 vs. Ar, (b) CA50 vs. Ar, (c) COV vs. Ar.
Energies 12 03366 g008
Figure 9. Variation in the in-cylinder pressure vs. crank angle with the DF of CO2, N2 and Ar.
Energies 12 03366 g009
Figure 10. Variation in exhaust temperature vs. the DF of CO2, N2, and Ar.
Energies 12 03366 g010
Figure 11. Variation in NOx emissions vs. the DF of CO2, N2, and Ar.
Energies 12 03366 g011
Figure 12. The proportion of different effects.
Energies 12 03366 g012
Figure 13. Variation in THC emissions vs. the DF of CO2, N2, and Ar.
Energies 12 03366 g013
Figure 14. Variation in methanol consumption and torque vs. the DF of CO2, N2, and Ar.
Energies 12 03366 g014
Figure 15. Variation in methanol consumption and THC emissions vs. NOx emissions.
Energies 12 03366 g015
Table 1. Specifications of the test engine.
Engine PropertiesSpecifications
Bore/Stroke85 mm/88 mm
Connecting rod length175 mm
Displacement1.997 L
Compression ratio17.5:1
Intake valve opening3870 CA BTDC
Intake valve closing1440 CA ATDC
Table 2. Molar heat capacity vs. temperature of CO2 and N2.
Species a 0 a 1 a 2 a 3
CO222.2659.811−35.017.47
N228.9−1.5708.081−28.73

