1. Introduction
Energy is a vital component needed to improve quality of life, reduce poverty and for the promotion of socio-economic activities. However, there is still global uncertainty in the energy sector because of the declining quantity of fossil fuel reserves coupled with crude oil price instability. This global energy situation requires alternative or renewable sources of energy and a review of current technologies. It is vital to focus not only on the sustained economic usage of current finite resources, but also to identify and develop renewable technologies and resources that possess the potential to provide for the increasing energy demand. These resources and technologies should also be sustainable, clean, globally available and easy to exploit and operate, while contributing towards the materialisation of the United Nations millennium development goals (MDGs) [
1].
The growing demand of energy due to population growth, the lack of clean energy, and the inadequate availability of natural resources have led to growing demand for anaerobic digestion technologies in rural areas of developing countries. Anaerobic digestion is a biochemical process that is applied for the efficient transformation of, for example, manure and other agricultural residues into biogas, a renewable energy source and biofertiliser. Biogas is rich in methane (50–70%), and CO
2 (30–50%) with traces of water vapour (1–6%) and H
2S. Biogas is a renewable, clean and efficient source of alternative energy which can be used as a substitute for fuels such as firewood, charcoal and cattle dung, usually used by rural dwellers [
2,
3,
4].
The household or domestic digester is an example of an anaerobic digester usually applied in a single decentralised system mostly in rural areas of developing countries. It serves as an energy producer and sometimes, when coupled to the toilets, as a sanitation system. Household digesters are non-mechanically mixed and non-heated reactors [
5]. Domestic biogas plants can serve as an energy solution to meet the cooking needs of rural households. Various governments and international funders support this system, and if managed well [
6], it is a cost-effective way of mitigating greenhouse gas emissions from animal dung [
7]. This is accomplished by replacing fossil fuels with biogas and reducing methane emissions during manure management, starting from its production to the final application on agricultural lands [
8].
Among all household digesters, the Chinese dome digester (CDD) is the most popular and most widely implemented reactor because of its reliability, low maintenance requirement, and long lifespan [
9,
10]. The CDD is a basis for the development of recent household digester designs; for example, the Puxin digester is an example of a prefabricated digester [
10].
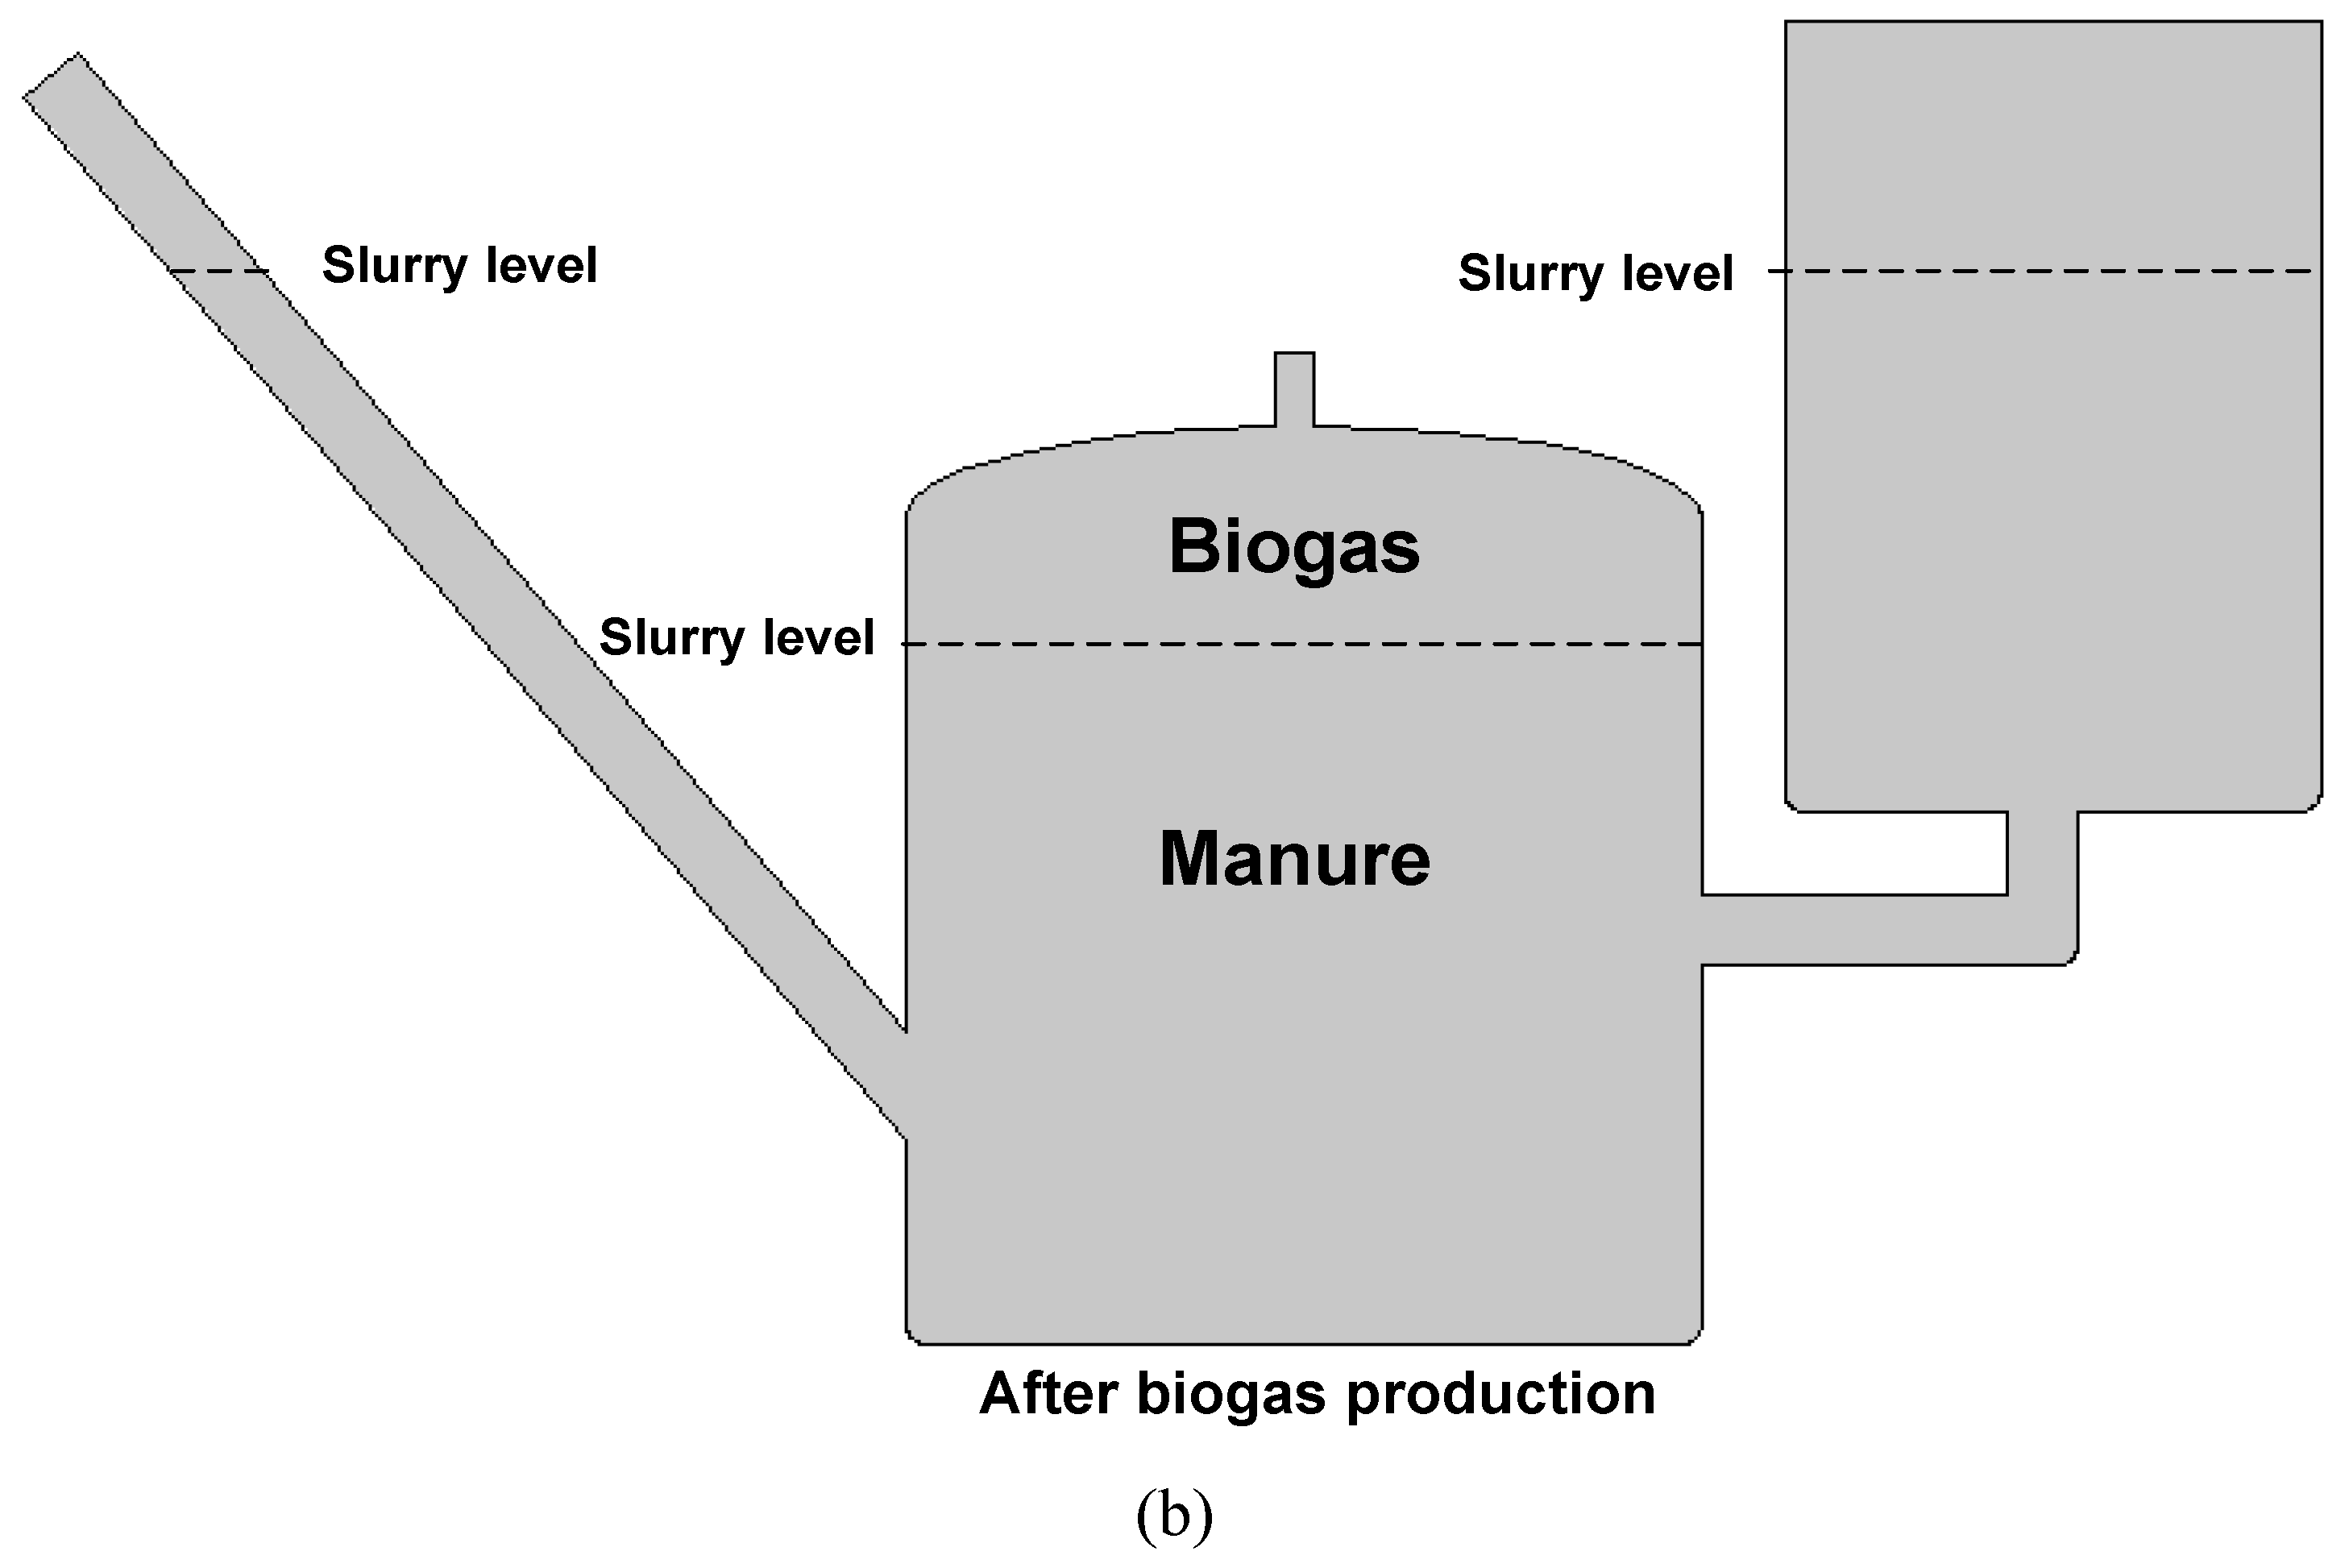
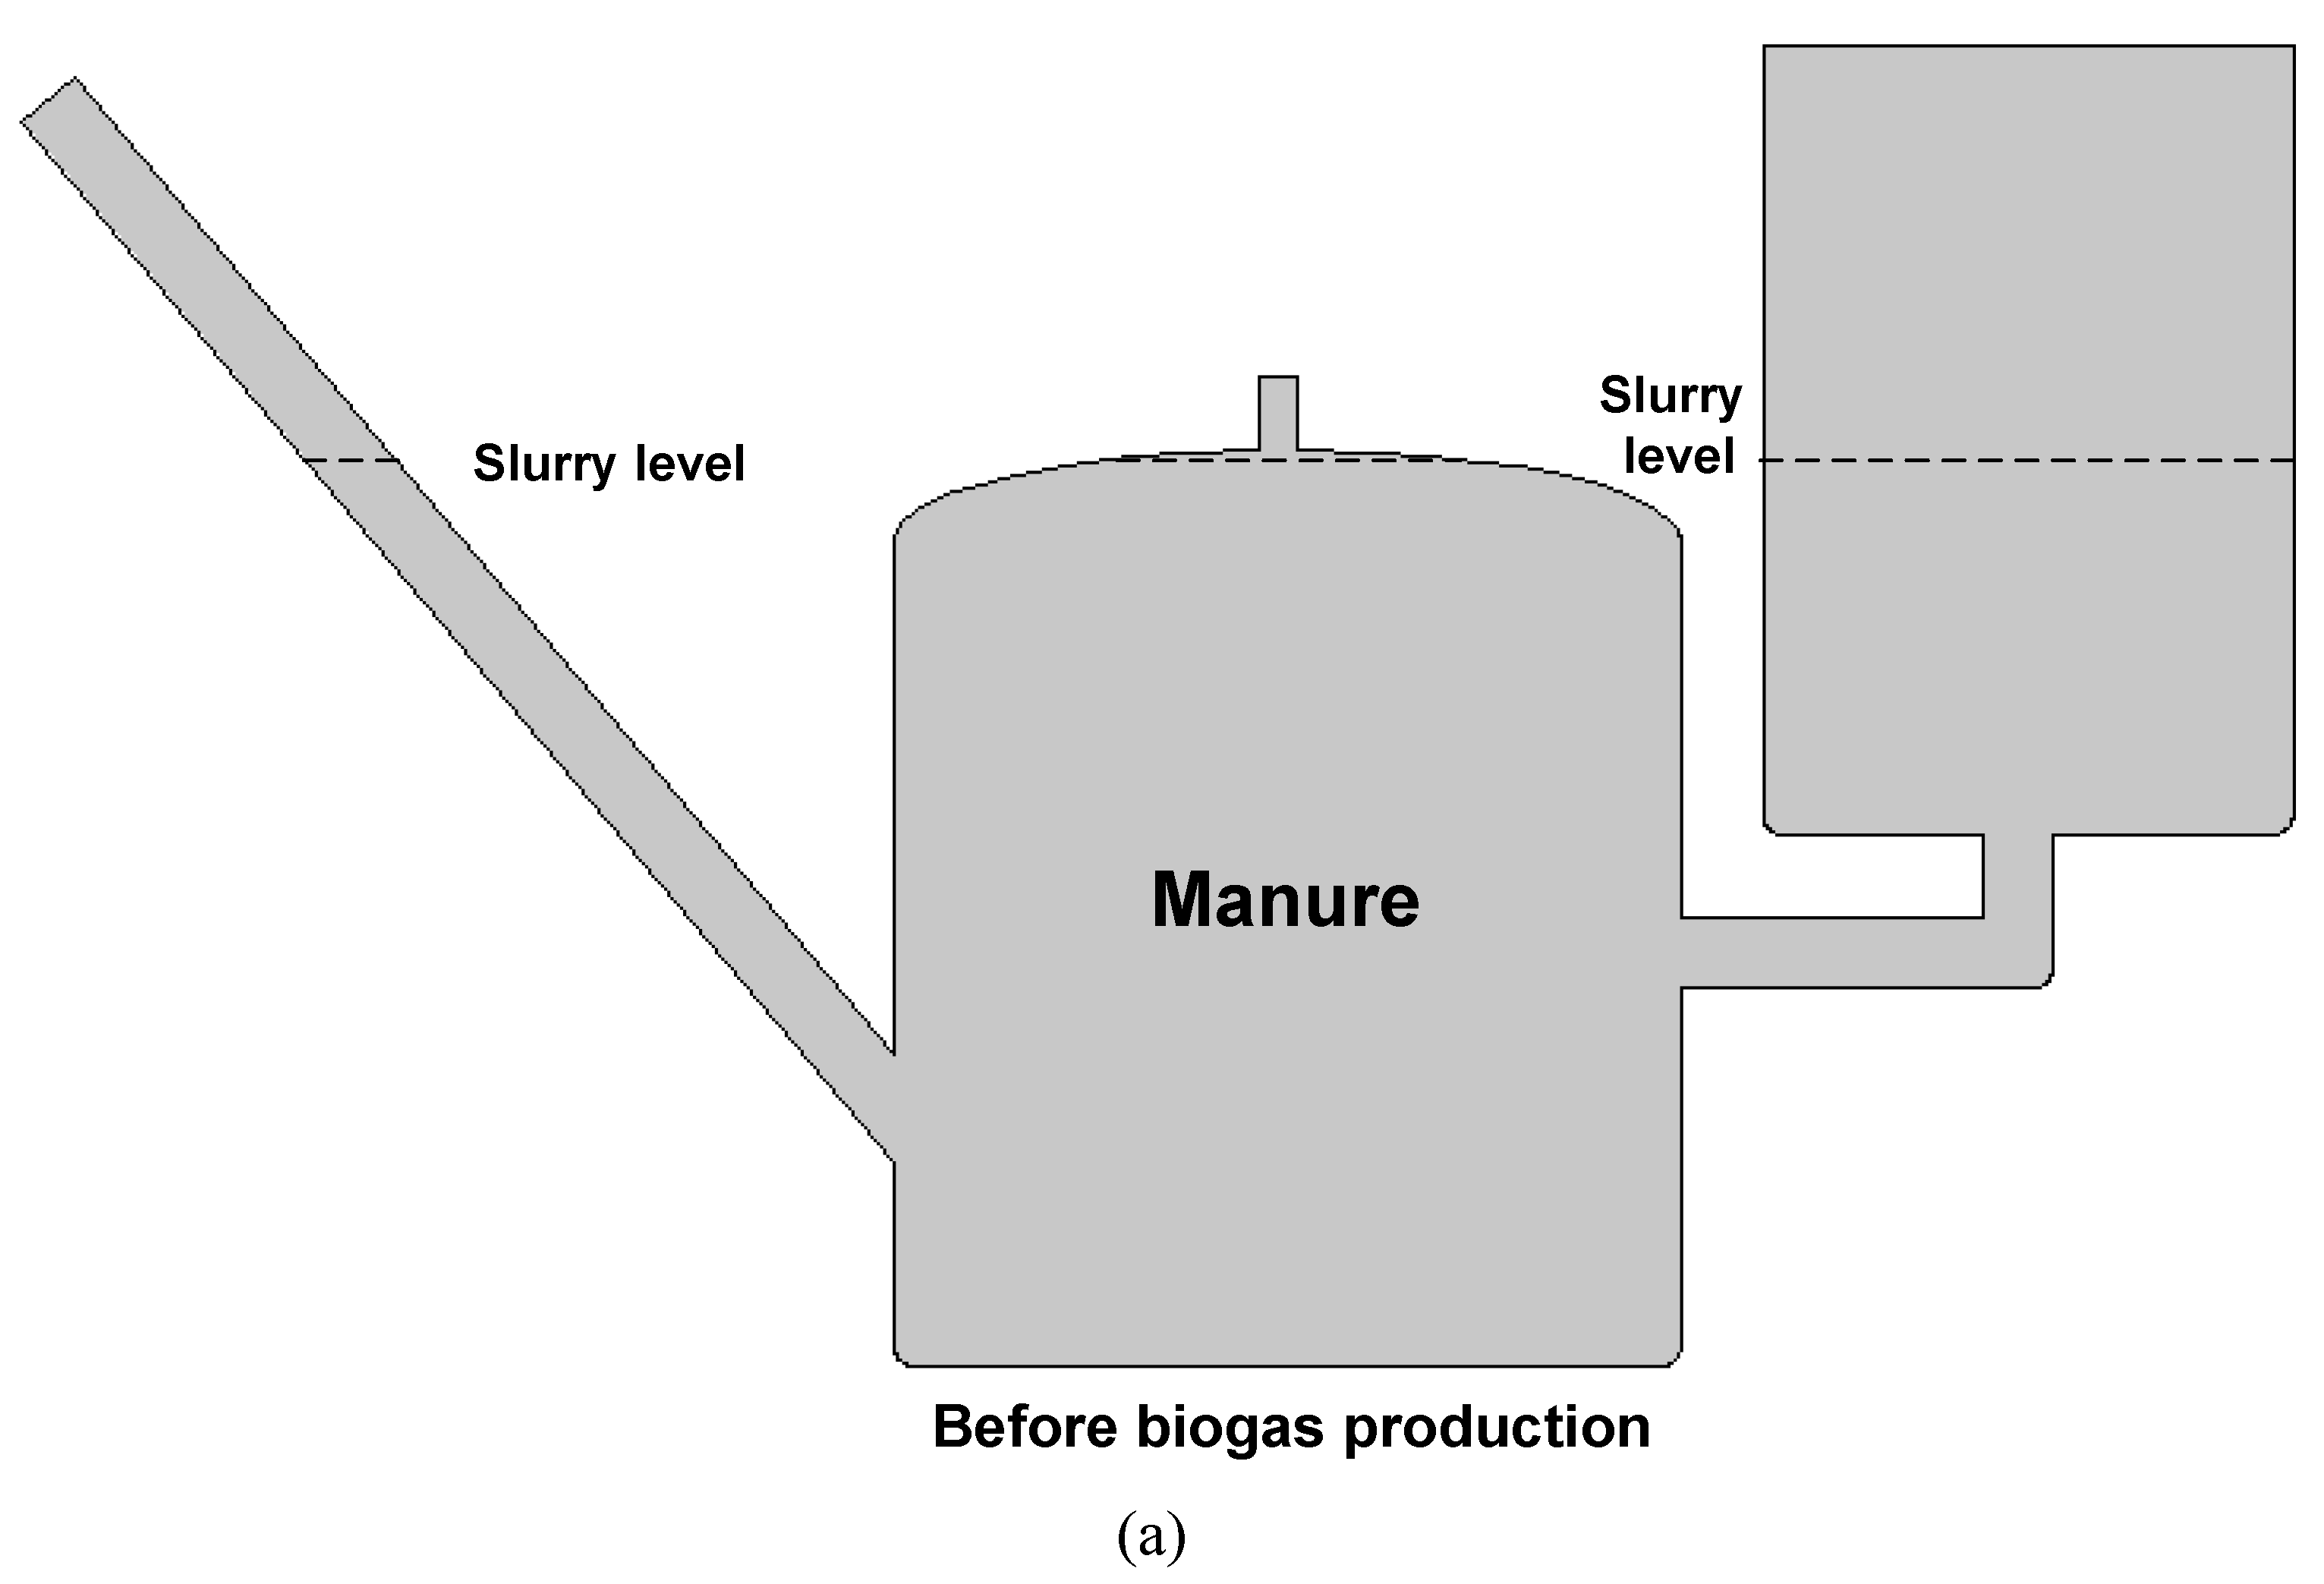
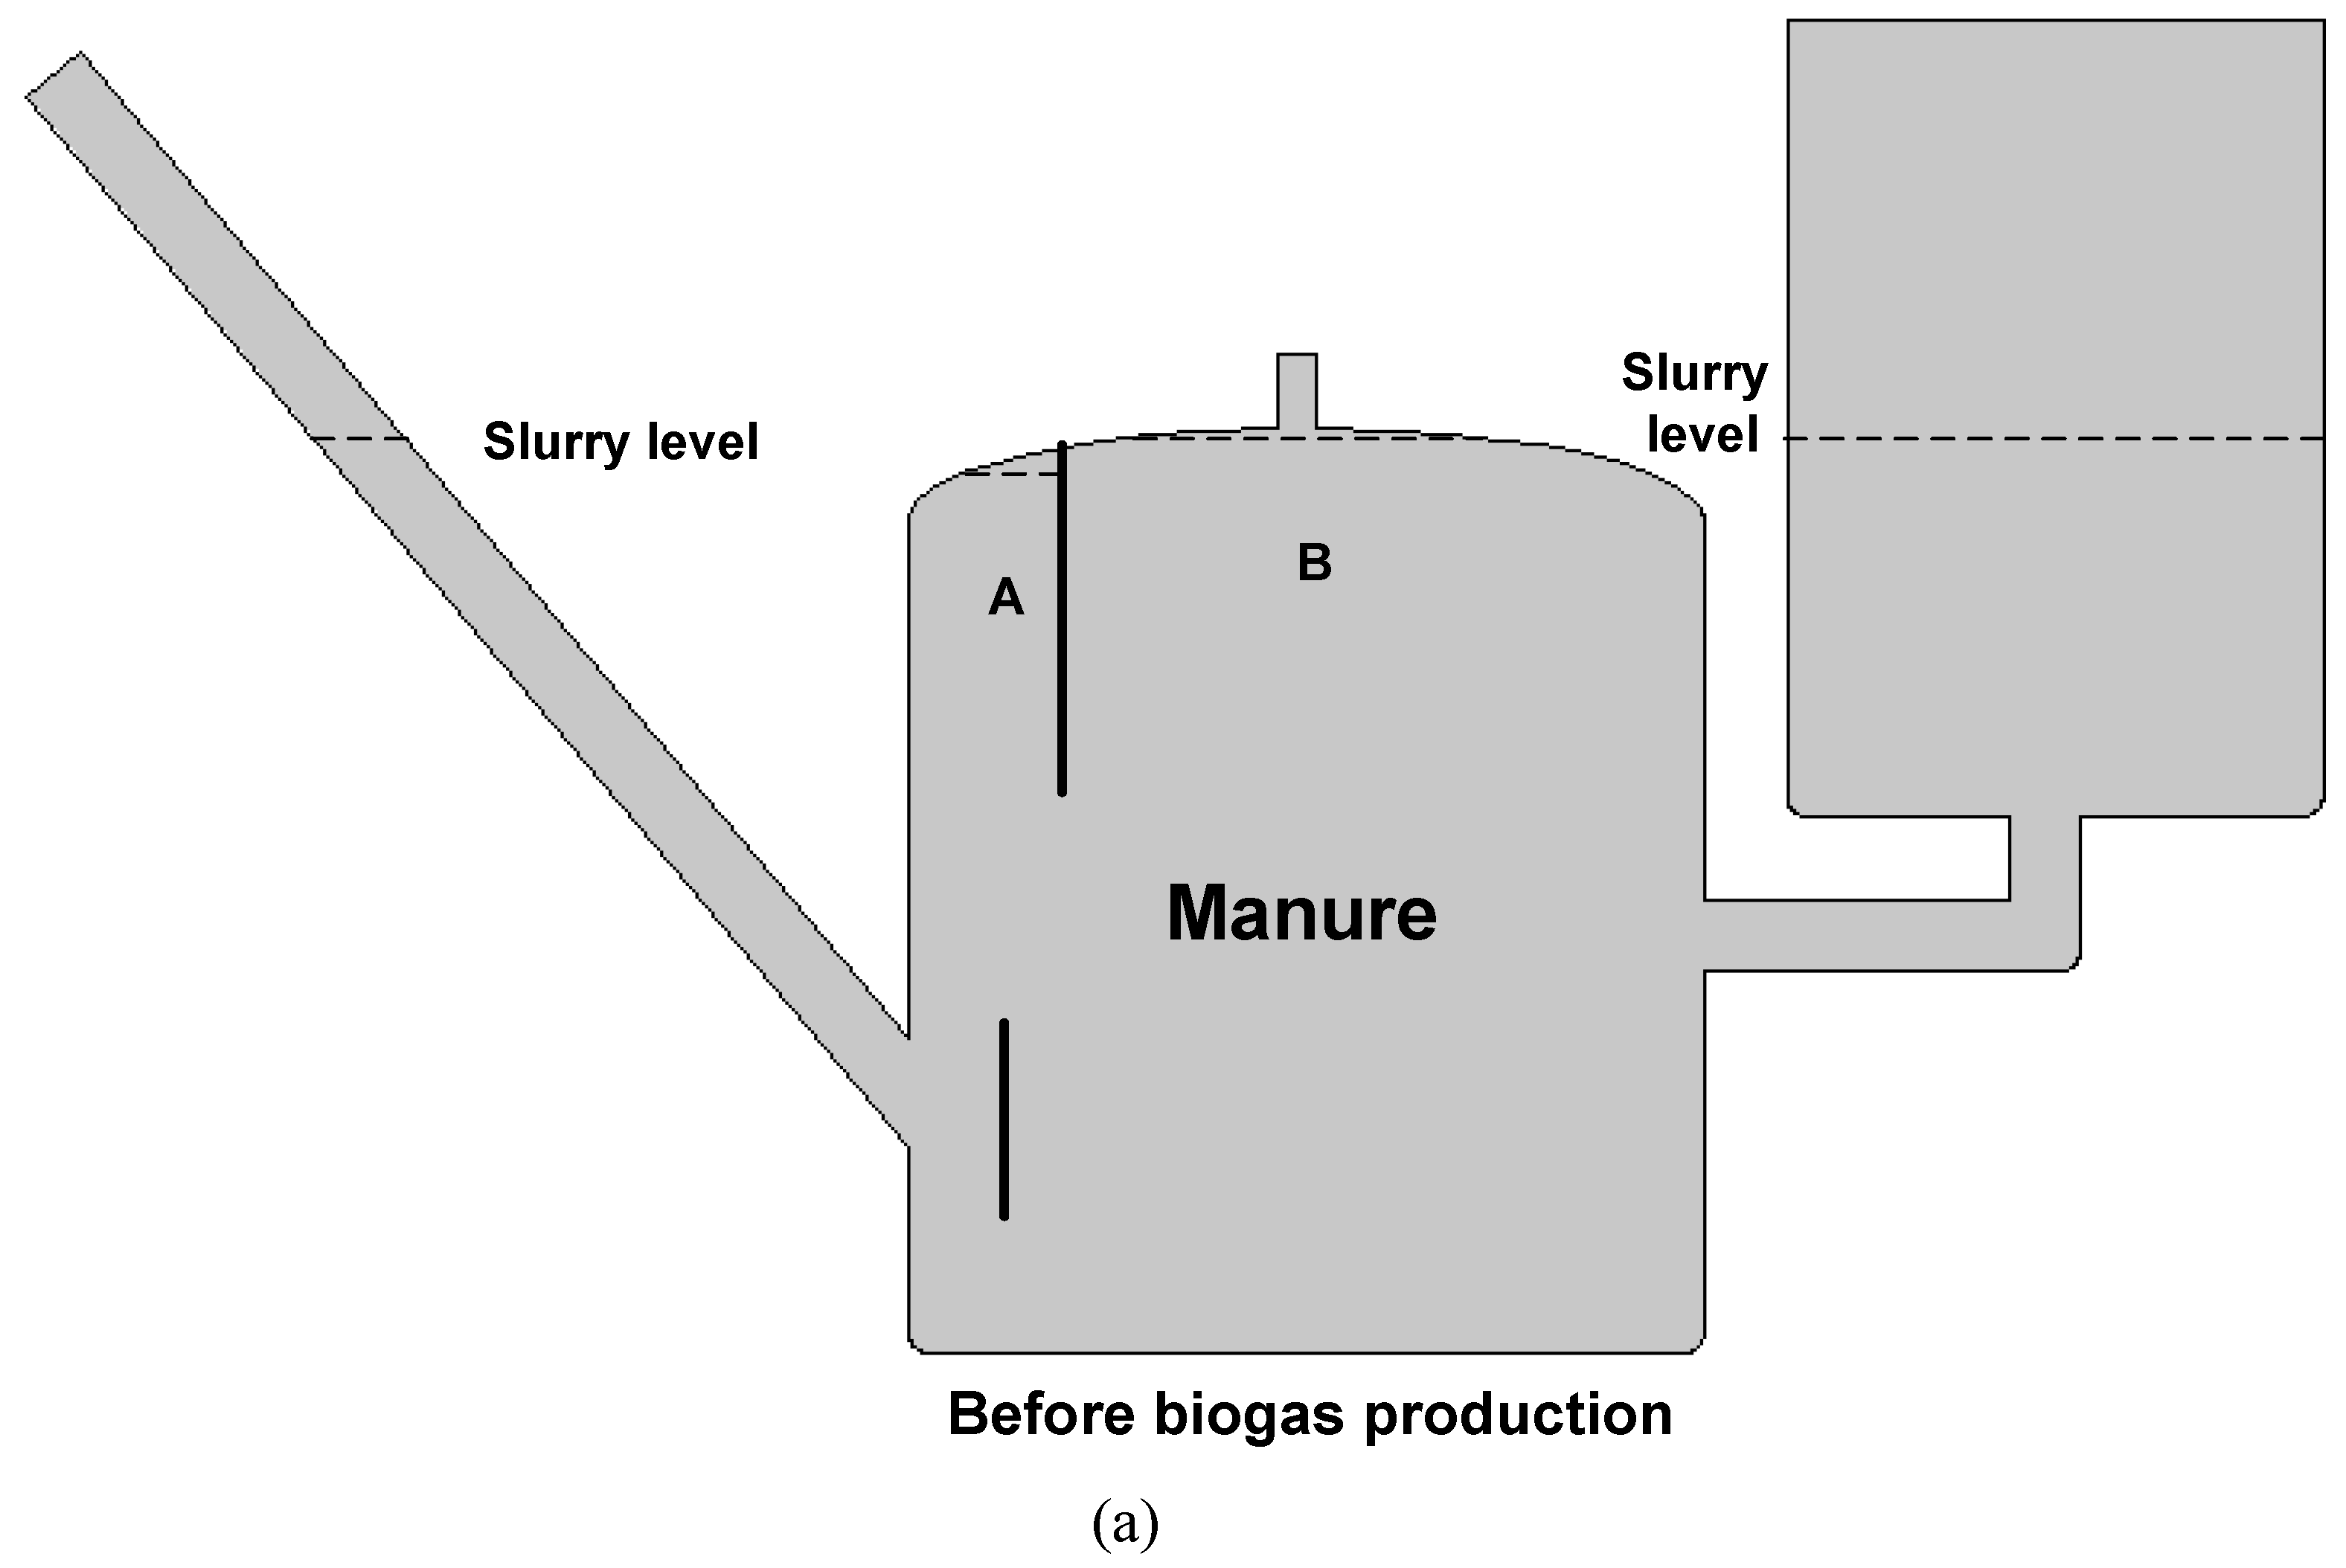
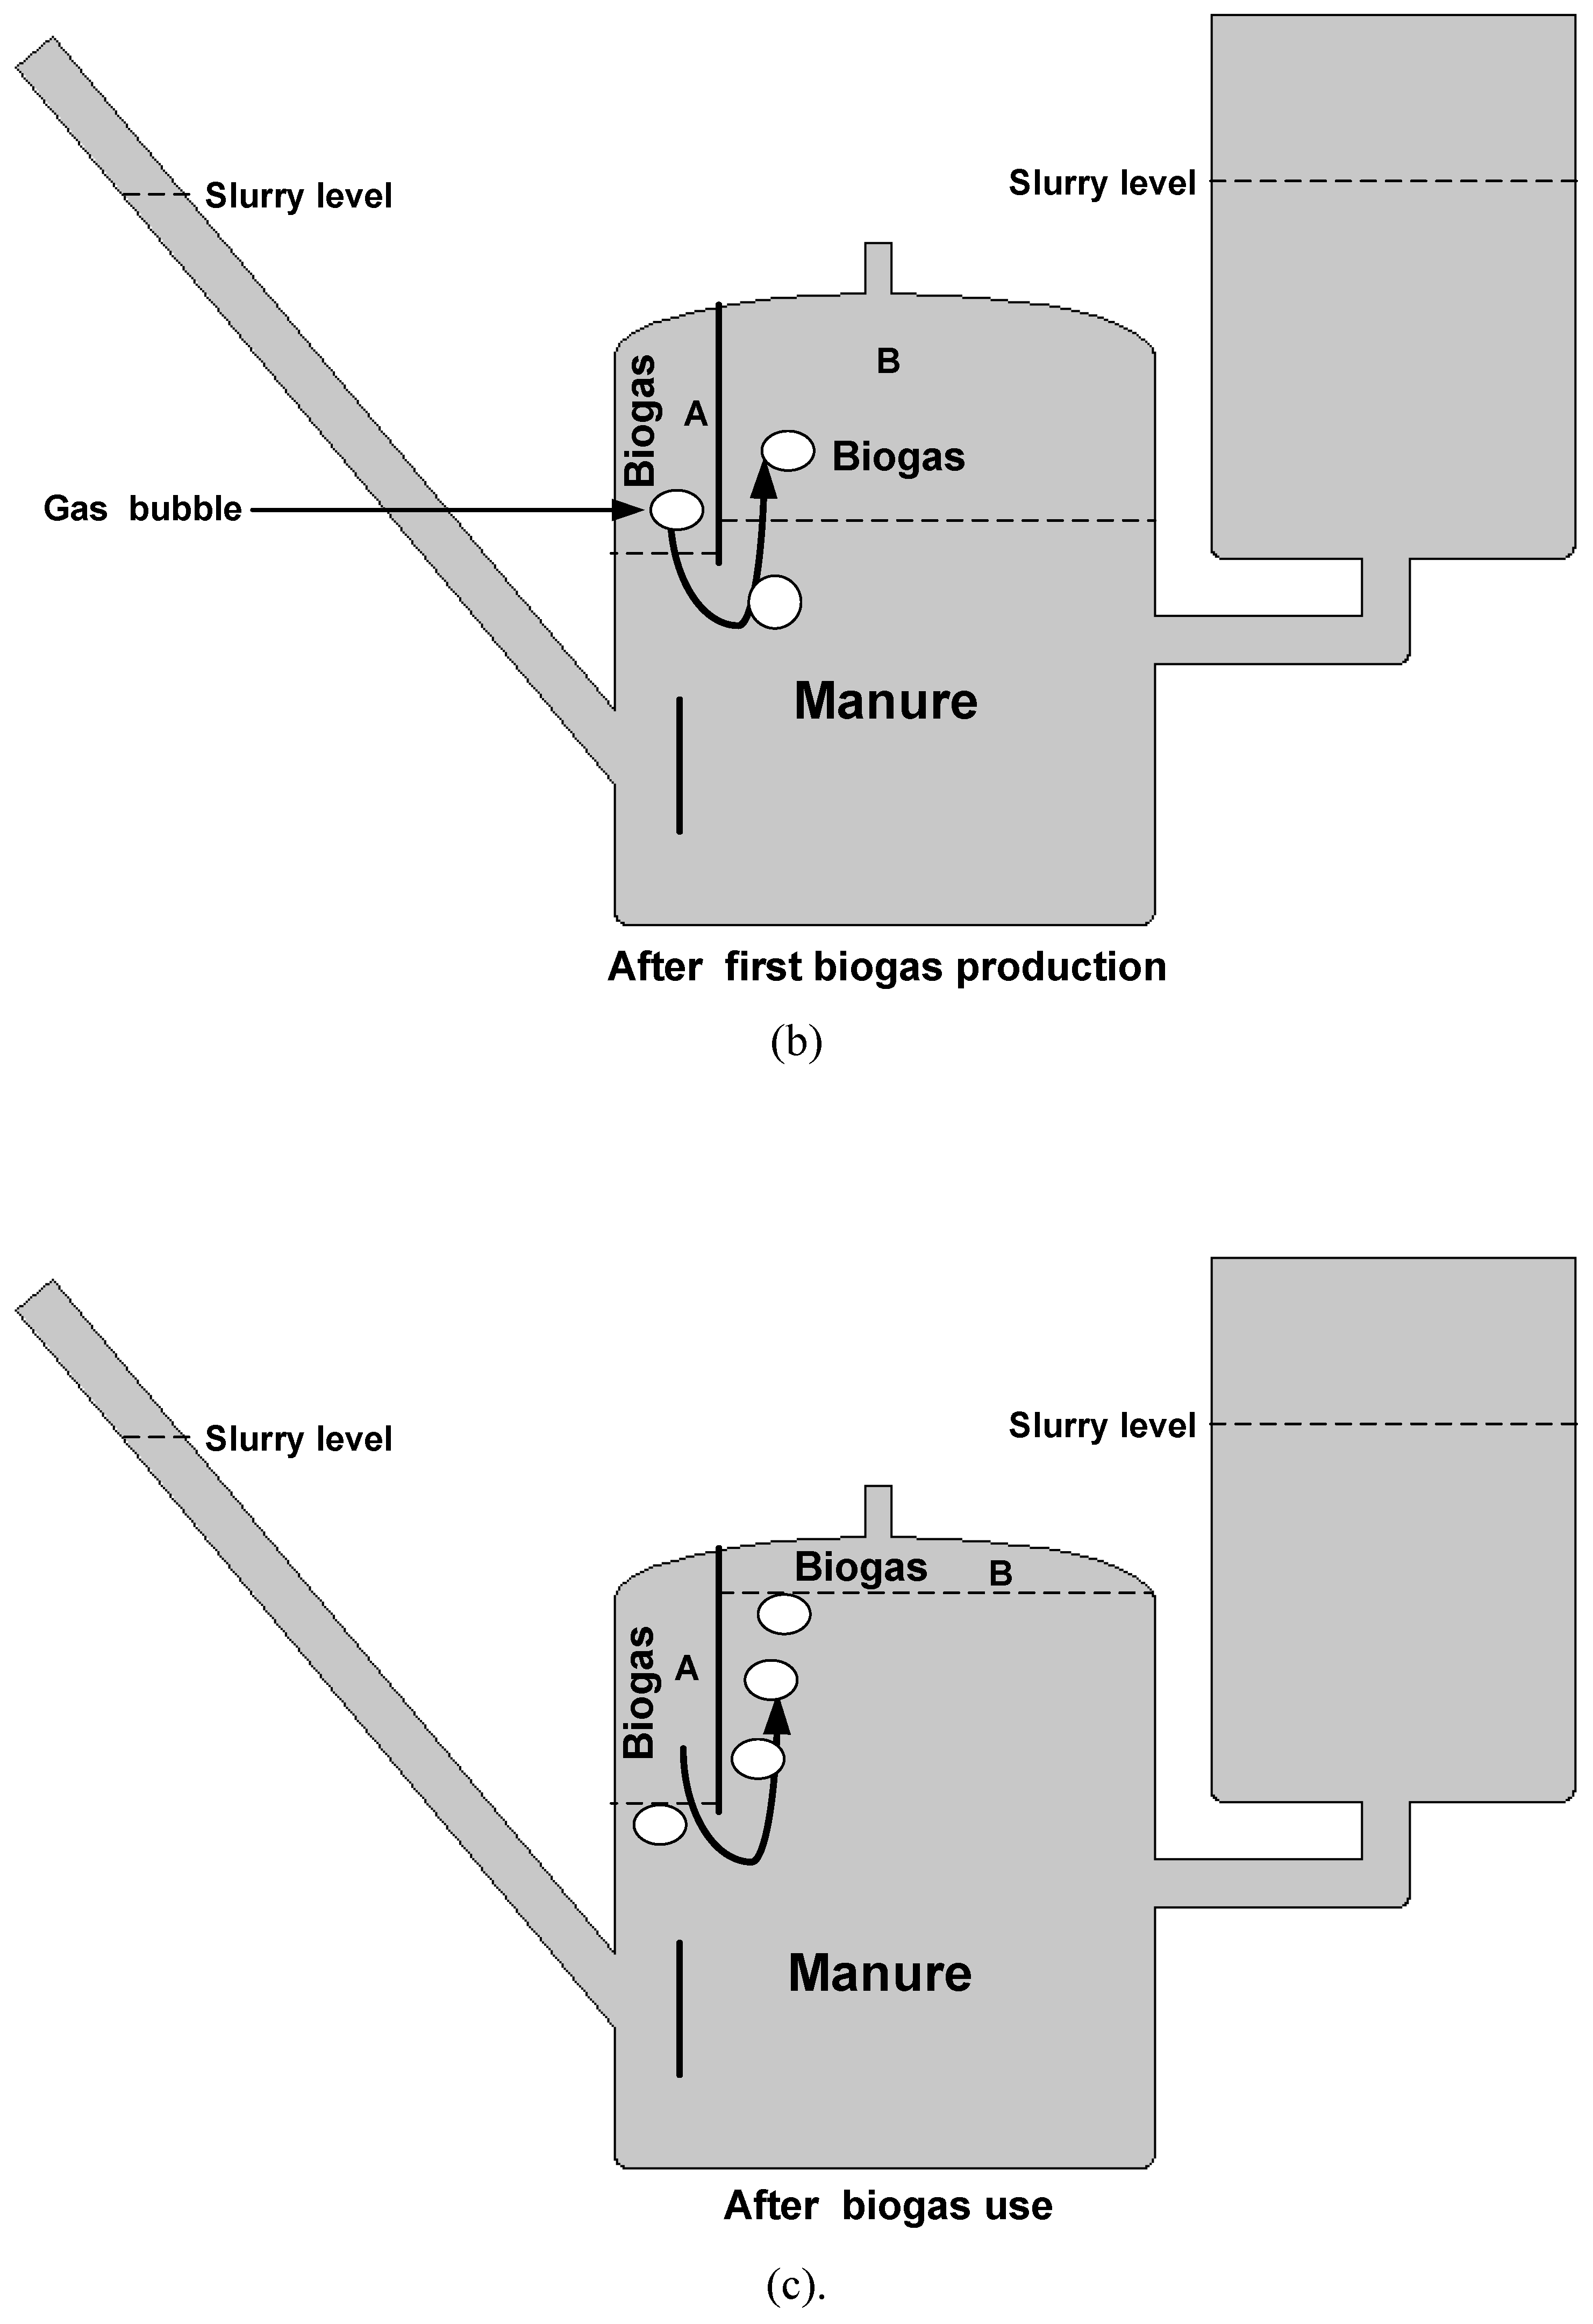
In CDDs, gas pressure is created at the top of the reactor as a result of the biogas produced. The stored biogas pushes part of the slurry into an extension chamber, since the chamber is usually opened. During gas use, pressure is released, and the slurry flows back into the main reactor, creating a mixing regime or cycle (
Figure 1a,b). Therefore, CDD depends on the hydraulic variation, i.e., the change of slurry level in the digester and extension chamber during gas use and could be regarded as intermittent natural mixing [
6]. Mixing is an important process in anaerobic digestion for establishing contact between micro-organisms and feed for homogenisation of temperature throughout the digester and prevention of settling and floating layers [
11].
The effect of mixing on the anaerobic digestion process has been studied by various authors. The requirement for digesters to be adequately and sufficiently mixed has been supported by many authors [
12,
13,
14,
15], and challenged by many other authors [
16,
17,
18,
19]. Lindmark et al. [
20] concluded in a review that an intermittent mixing mode is better than continuous mixing, and shorter mixing durations are preferable for higher biogas production and from an energy point of view. Intermittent mixing can result in a similar quantity of gas to that obtained with continuous mixing. In addition, Chinese dome digesters are generally operated at long hydraulic retention times (>70 days) and low influent total solid (TS) concentrations (≤7%) when compared to mixed reactors (intermittently or continuously). Mixing is limited, leading to a large reactor volume and higher cost [
6].
Operating anaerobic digesters at high TS content (>10%) could present a better alternative to anaerobic digestion (AD) systems operating at lower TS content (< 7%) because of the reduced reactor volume when applying the same HRT [
21,
22]. A major advantage of this approach is the smaller digester and the eventual reduction in reactor cost. Applying this approach to CDD could help in the reduction of both the water required for dilution and the reactor size; however, the mixing in CDDs that can be achieved during feeding, biogas production and use would be limited. In addition, Jegede [
6] investigated the impact of different influent TS (3–15%) concentrations and the related volumetric biogas production on mixing in lab-scale CDDs. The results revealed that mixing in CDDs, due to biogas production and reactor feeding, is not sufficient at high (>10%) TS concentrations. Indeed, the rheological properties of manure are affected by water content or percentage of TS [
23,
24]. The lower the water content, the higher the yield stress, because manure becomes viscoelastic material at high TS. The yield stress is directly proportional to the required force to make manure flow. Because of this property, the increased volumetric biogas production at high (>10%) influent TS is not sufficient for mixing CDDs.
Therefore, to reduce the digester volume viz. reduction of HRT and operation at higher influent concentration rate (ca. 15% TS), the Chinese dome digester has been optimised to improve mixing via a self-agitating mechanism, using the produced gas, while still being simple, cheap, easy to build and maintainable at low cost. The objective of this research was to evaluate the performance of this optimised self-agitating CDD at a pilot scale in continuous operation in comparison to a regular Chinese dome digester at higher organic loading rates (15% TS, corresponding to 2.6–4 g VS/m3/d) at HRTs of 40 and 30 days. To visualise the mechanism of the self-agitating process, a demo was done using a 19 L transparent plastic bottle containing water, and biogas production was simulated with the injection of air.
3. Results and Discussion
3.1. Reactor Performance
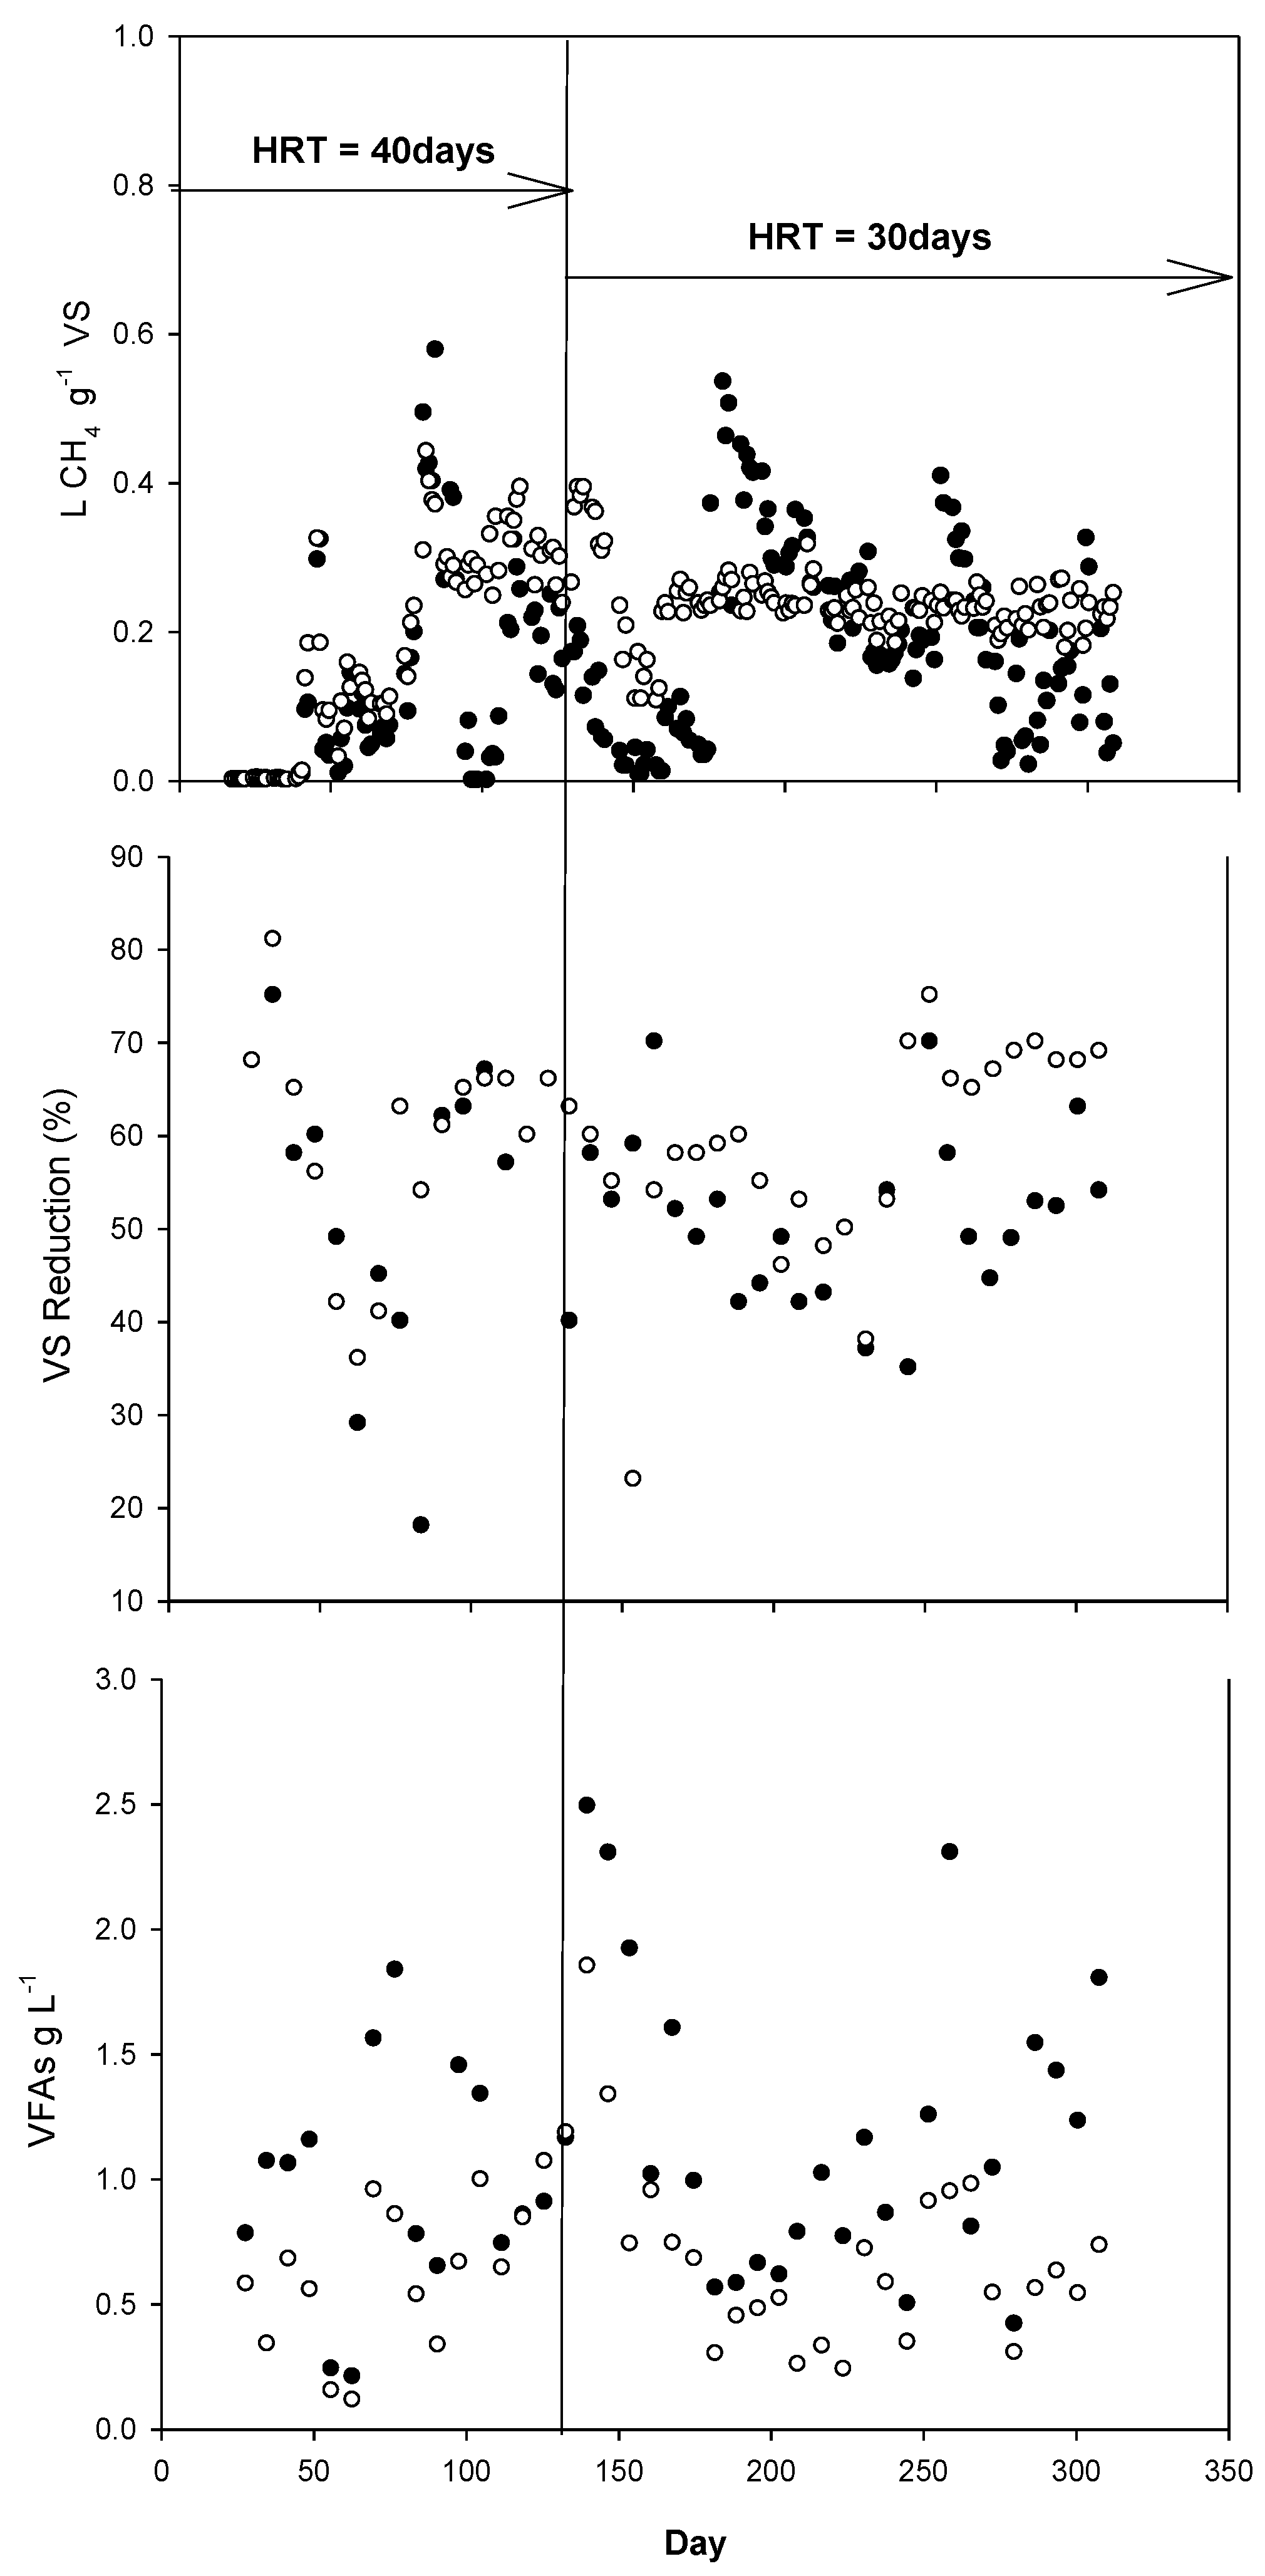
The specific gas production, VFA concentrations and VS reduction in time for both the optimised and blank reactors are presented in
Figure 3, showing a start-up period with relatively low gas production for both reactors up until ca. 80 days of operation. VFA concentrations were relatively low for the whole period in the optimised reactor, while the blank reactor showed much higher VFA concentrations up to 1 g/L.
Steady state at an HRT of 40 days was achieved for the optimised reactor in the period between 82 and 137 days, characterised by an average specific methane production of 0.32 ± 0.05 L CH4/g VS, a VFA concentration of 0.7 ± 0.2 g/L and a VS reduction of 63 ± 4%. Even at a relatively long HRT of 40 days, gas production and VFA concentration in the blank reactor fluctuated considerably, characterised by an average specific methane production of 0.19 ± 0.14 L CH4/g VS, VFA concentration of 1 ± 0.3 g/L and a VS reduction of 54 ± 17% during the period in which the optimised reactor operated rather stably.
The decrease in HRT from 40 to 30 days on day 137 to 309 (end of experiment), resulted in the decline of gas production in both reactors.
In the blank, methane dropped rapidly to approx. 0.01 L CH
4/g VS, while the average VFA concentration increased to about 2.3 g/L, but VS reduction remained high, at an average of 56 ± 3%. This might be a result of inhibition of methanogenesis arising from system’s instability and reactor overload because of an absence of sufficient mixing. Gas production increased once again and peaked at 0.51 L CH
4/g VS on day 182, with VFAs dropping to 0.5 g/L before becoming a bit more stable again from day 183 to day 270. Apart from the instability caused by the change in HRT from 40 to 30 days, the blank digester experienced instability for most of the time except for the period from day 183 to 270. The accumulation of VFAs, mainly acetate, was due to the change in HRT indicating system overloading. The high gas production recorded during short periods, viz., days 80–85, 176–195, and 253–258, might be attributed to the degradation of accumulated VFAs. The VFA concentration observed in the effluents is shown in
Figure 3.
Similarly, a rapid decrease in methane production from 0.35 to 0.10 L CH4/g VS and increase in VFA concentration from 0.7 to approx. 2 g/L was noticed in the optimised reactor when decreasing the HRT to 30 days (days 138–158). Afterwards, the reactor recovered and remained stable until the end of the study (day 309).
3.2. Steady State Period
In
Table 2, the average results of the two reactors are presented over the periods days 82 to 137 (HRT 40 days) and days 160 to 309 (HRT 30 days). Based on the set criteria, ‘steady state’ could be assumed for the optimised reactor for both periods, but not for the blank reactor. The average methane production for the optimised reactor at an HRT of 40 days was 0.32 L CH
4/g VS, with a small variability (std = 0.05), compared to the blank, which had an average methane production of 0.19 L CH
4/g VS, but with a large variability (std = 0.14). Similarly, at an HRT of 30 days (days 160–309), average methane production was 0.23 L CH
4/g VS, with small variability (std = 0.02), compared to 0.21 L CH
4/g VS, large variability (std = 0.12) in the blank digester. This trend also holds for VFAs, as shown in
Table 2. In addition to stability, the optimised digester produced 50% more methane than the blank at an HRT of 40 days.
As expected, some lower gas production was recorded at and HRT of 30 days as compared to 40 days. This is also true for the VS reduction in both reactors. In the optimised digester, the average specific methane production and average percentage of VS reduction during the second steady state period is much lower compared to the first steady state. However, the average VFA concentrations (0.7 ± 0.3 g/L) during the first steady state period is slightly higher than VFA concentrations (0.6 ± 0.2 g/L) during the second. This implies that the change in HRT from 40 to 30 days affected the digester performance. A similar trend was observed by Zeeman [
29] in a continuously stirred tank reactor (CSTR). When HRT was changed from 25 to 10 days during anaerobic digestion of cow manure at 30 °C, the methane production observed was 0.13 and 0.10 L CH
4/g VS for 25 and 10 days, respectively. Also, Ghanimeh et al. [
30] observed a reduction in methane production from 0.32 to 0.21 L CH
4/g VS when HRT was changed from 67 to 40 days during the thermophilic anaerobic digestion of source-sorted organic fraction of municipal solid waste. Indeed, digesters treating slurries and solid wastes might have their HRT similar but not equal to the solid retention time (SRT), depending on how well the reactor is mixed. During the anaerobic digestion process of solid wastes, the hydrolysis stage of particulate matter is usually the rate-limiting step [
31], and therefore long SRT is often required. Long solid retention times are of interest and advantageous because they increase the conversion capacity, giving buffering capacity against shock loadings and toxic compounds [
32,
33]
The lower and more stable VFA concentration in the optimised reactor may be a result of relatively longer SRT in comparison to the blank digester, assuming that Monod kinetics prevailed. The higher gas production in the optimised as compared to the blank reactor is mainly due to improved hydrolysis, as the VFA concentration is relatively low and acidogenesis is generally not limiting in manure digestion [
29]. However, when first-order kinetics are valid, smaller differences in hydrolysis are expected at longer HRTs. The large difference in methane production and therefor hydrolysis at a theoretical HRT of 40 days between the optimised and blank CDD digester suggests a very large difference in real SRT. The blank reactor might suffer from extensive dead zones, as shown in laboratory experiments by Jegede [
6]. It is not clear why these differences are less distinct when operating the CDDs at a theoretical HRT of 30 days. Nonetheless at both theoretical HRTs, the optimised CDD, with inclusion of two baffles, performs better as compared to the blank. Details of the impact of the baffles are discussed in the next section.
3.3. Effect of Baffles on Mixing
3.3.1. Self-Mixing Cycle
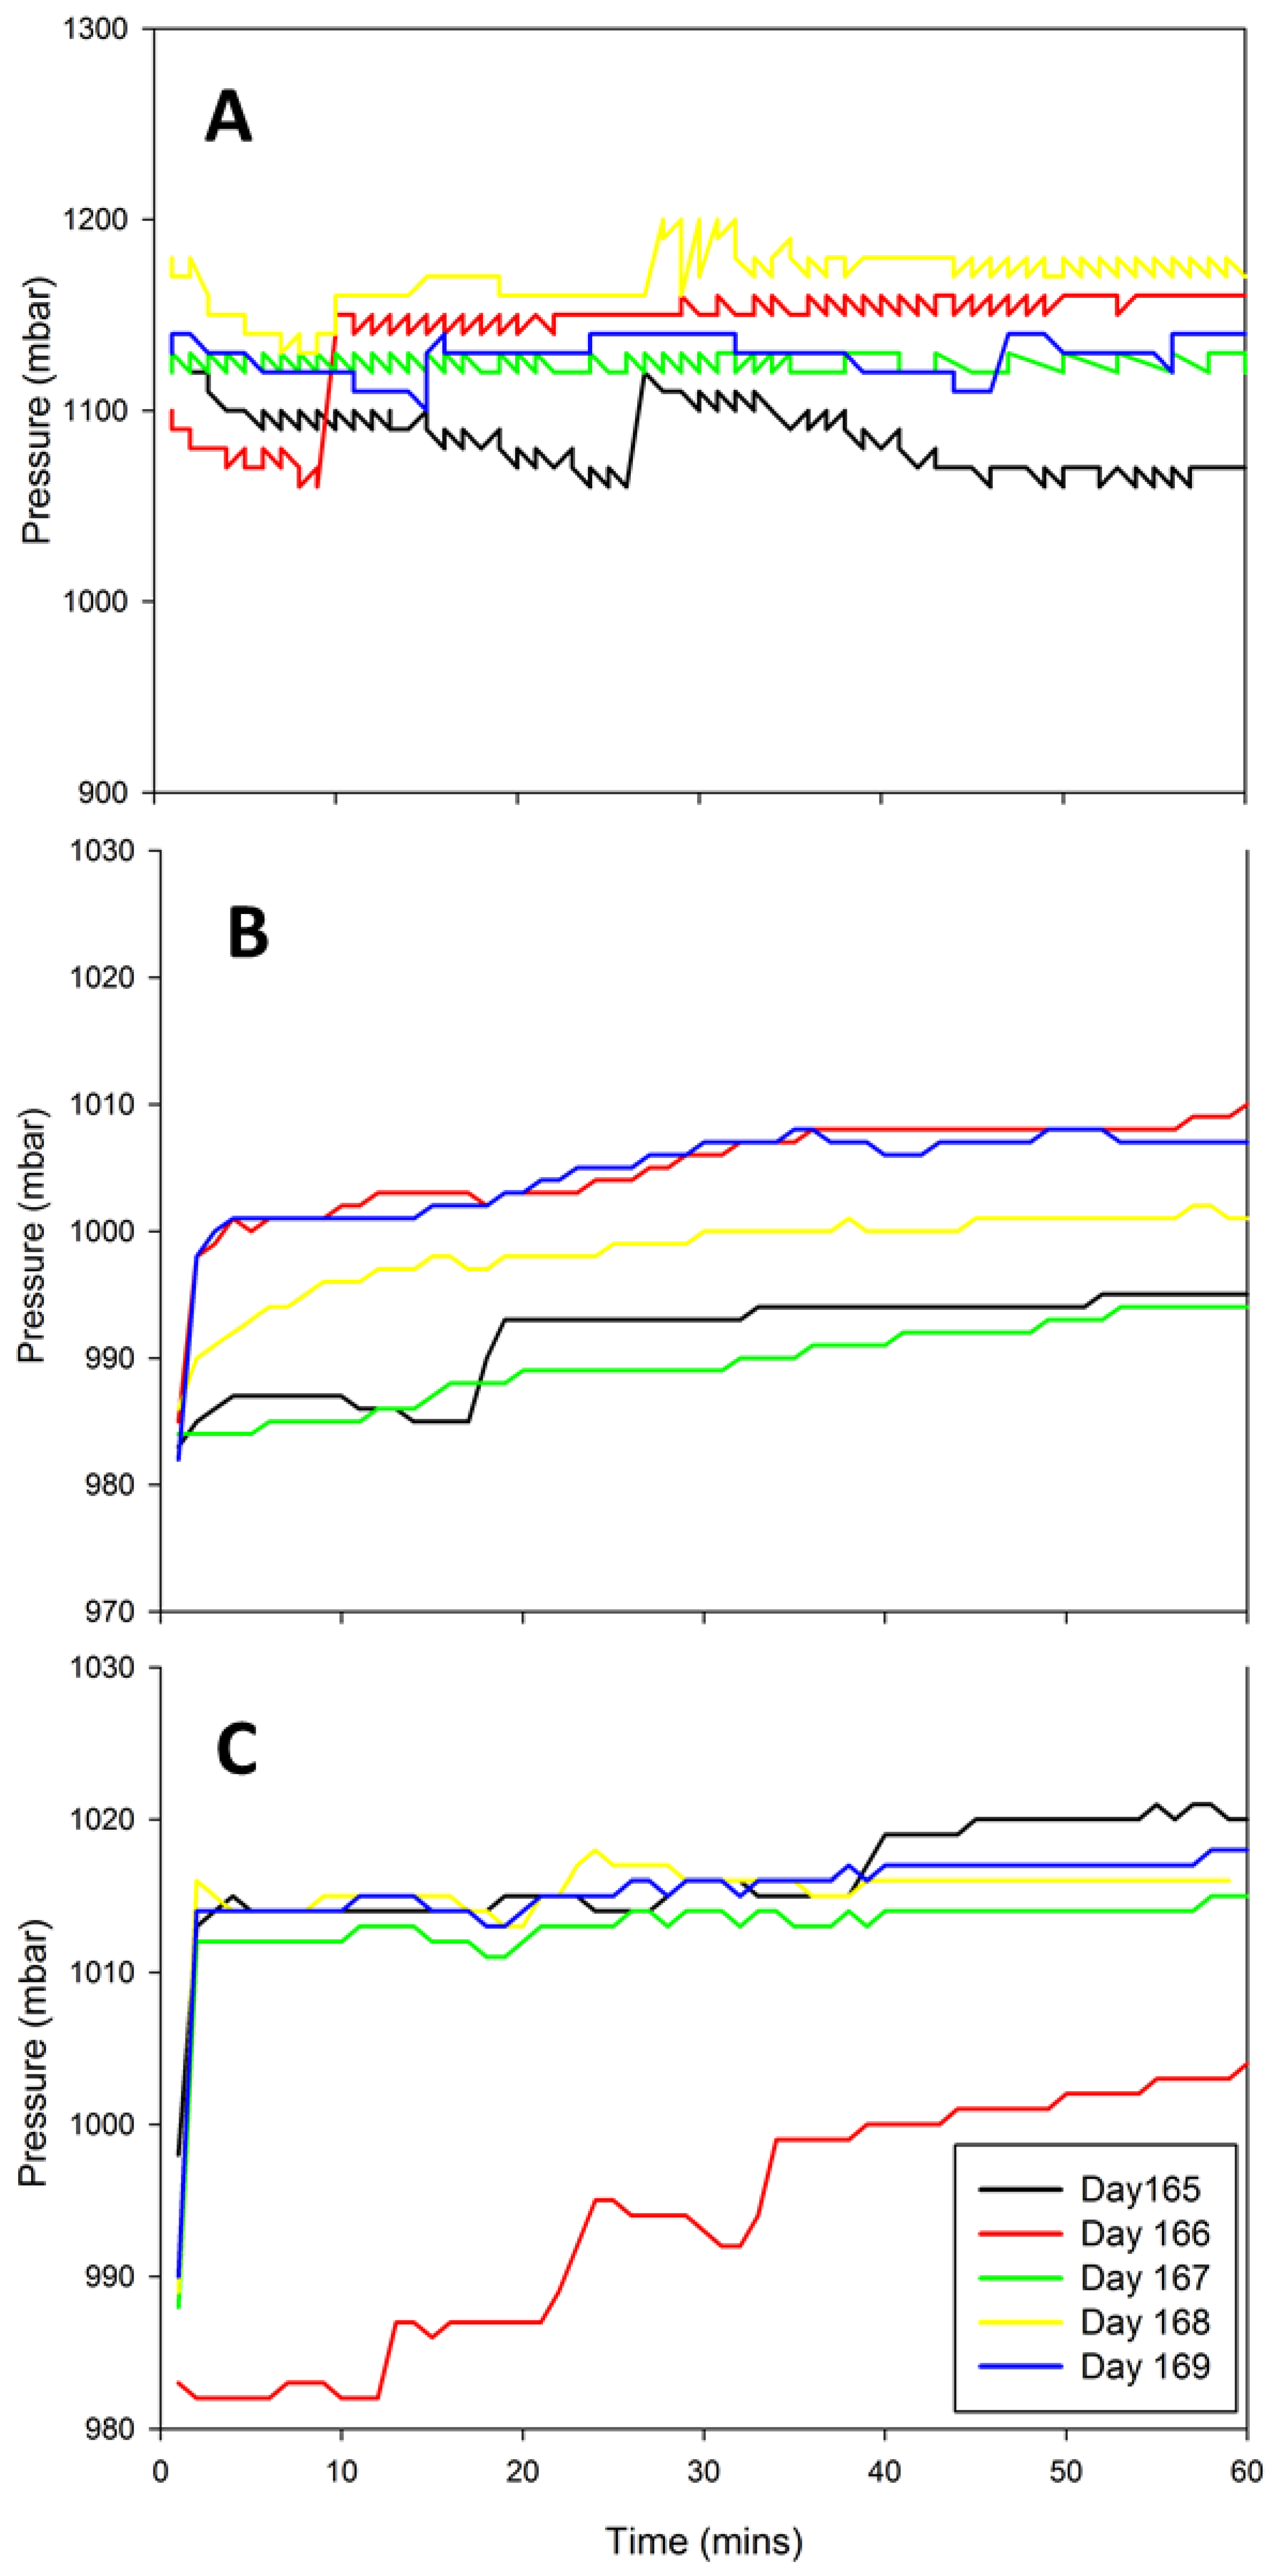
The results of in situ pressure measurement to confirm and evaluate the self-agitating mixing cycles are presented in
Figure 4 for the baffled and unbaffled sides of the optimised and blank digesters. The pressure measurements were performed after the optimised reactor achieved a steady biogas production; however, the gas production in the blank digester did not stabilise throughout the study period. The aim of the pressure measurement was to confirm if the reactor under goes a self-mixing cycle and to determine the frequency of the pressure variation in the reactors.
Figure 4a presents pressure measurements of the baffle side of the optimised reactor on five different days. The pattern for each measurement is almost the same. The patterns show pressure fluctuations at an average of two minutes interval for all measurements indicating a self-agitating mixing cycle when gas flows from compartment A to B. Meanwhile, in
Figure 4b,c, which shows the measurements for the unbaffled side of the optimised and blank digesters, respectively, a gradual step-wise increase of the pressure is noticed. This means a gradual pressure build-up due to biogas production.
3.3.2. Effect of Baffles on Mixing and Reactor Performance
Since the upper baffle of the optimised digester results in self-mixing of the top layer of the reactor, the latter might have improved the overall performance of the digester despite high applied loading rates. In addition, improved mixing was also achieved by prevention of short circuiting of the incoming substrate to the outlet/expansion chamber by the lower baffle. Short circuiting of the incoming substrate will lead to the reduction of the real HRT and eventually low digestion performance. The lower baffle helps the incoming substrate to mix with the reactor content and therefore prevent stratification and eventually mitigating the dead zones at the bottom of the reactor. Dead zones impact negatively on overall digestion performance because the active volume in anaerobic digesters is reduced. For example, in previous studies, Jegede [
6] showed that laboratory-scale conventional CDD systems have dead zones resulting in shorter real HRT as compared to the theoretical HRT at 15% influent TS. 23% dead zone was estimated based on the residence time distribution (RTD) technique, which impacted negatively on the amount of methane generated and digestion efficiency. Furthermore, the improved mixing in the optimised digester prevented the accumulation of scum or floating layers on top of the reactor compared to the blank digester. This might be another reason for the large fluctuations of the biogas production in the blank digester, because the produced gas might be trapped in these floating layers. Chinese dome digesters have a cylinder shape with a large surface area to allow large storage volume of biogas. The large surface area aids the build-up of suspended solids or scum if mixing is limited [
34]. Moreover, mixing is important to (i) provide even temperature distribution and proper diffusion or spread of metabolic intermediates [
13], (ii) enable sufficient contacts between micro-organism and nutrients [
18], and (iii) improve hydrolysis and increase substrate surface area [
15].
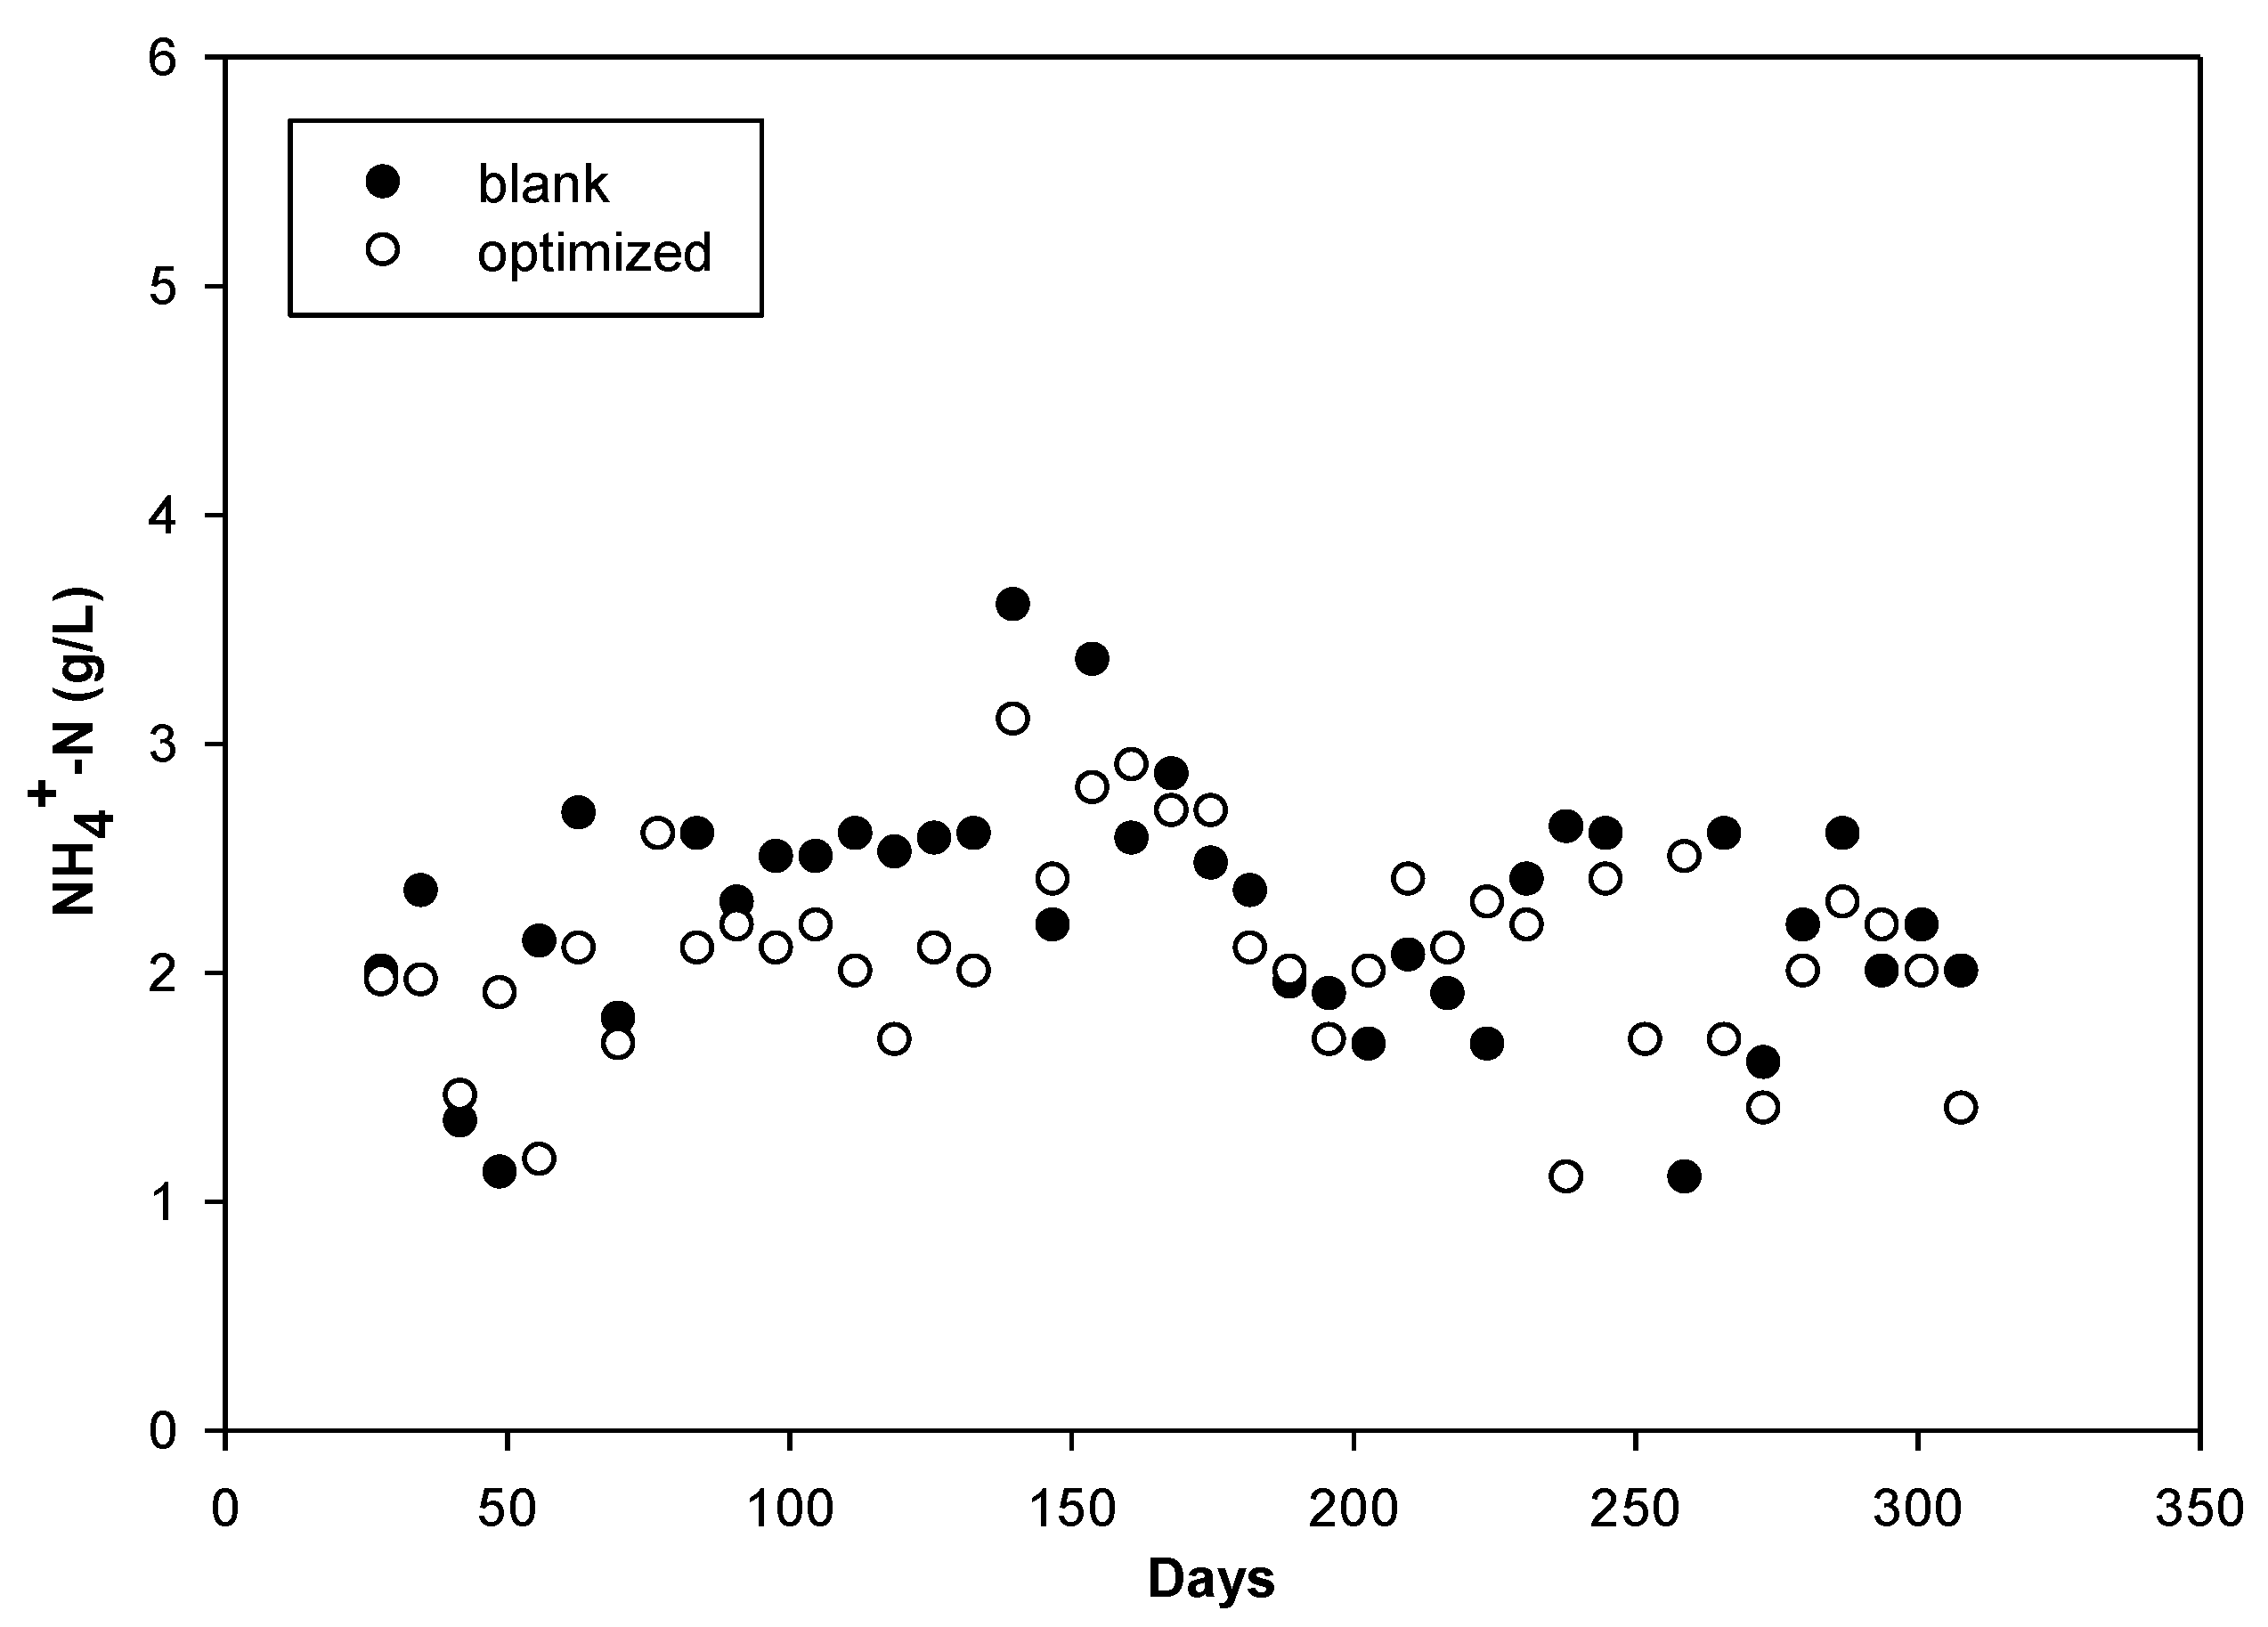
There are no significant differences in the average NH
4+ -N concentrations in the influent and effluent from both digesters; however, concentrations fluctuated over time (shown in
Figure 5). In the blank, the average concentration of NH
4 +-N concentration fluctuated between 1.1 and 2.6 g/L, with an average of 2.3 ± 0.5 g/L at 40 days HRT. The concentration varied between 1.2 and 2.6 g/L and averaged 2 ± 0.3 g/L in the optimised digester. After the change of HRT to 30 days and an increase of OLR, NH
4+-N concentration peaked at 3.6 g/L in the blank and 3.1 g/L on day 140, but later dropped and averaged 2.2 ± 0.5 and 2.1 ± 0.5g/L until the end of the experiments in the blank and optimised digester, respectively. Generally, these moderate NH
4 +N concentrations did not cause adverse inhibition in the digesters because of the acclimatisation of feed and digesters operating temperature (mesophilic). The VFA accumulation (2.5 g/L, day 140) in the blank digester during the experiment might have been induced by moderate inhibition of NH
4+-N concentrations at 3.4 g/L–3.6 g/L. However, overall there is no clear pattern between NH
4+-N and VFA in either digester.
After the change in HRT and the increase in OLR, higher concentrations of NH
4+-N were recorded in both reactors, with 3.6 and 3.1 g/L in the blank and optimised digesters, respectively, but no significant change in the pH. The higher values could be a result of accumulation of NH
4+-N during the hydrolysis of protein after the increase in OLR. This trend is similar to the results of a previous study by the authors [
30], in which an increase in ammonia concentration was recorded with increasing OLRs. Sufficiently high ammonia concentration to result in inhibition was not recorded in this study, because cow manure has an optimum C:N ratio (25-30:1)
The pilot-scale reactors unfortunately could not be tested for mixing behaviour using tracers, but the reactor performance results clearly show the better stability, higher gas yield and lower effluent VFA concentration for the optimised reactor in comparison to the conventional CDD reactor. The letters indicate that the real HRT in the optimised CDD approaches the theoretical HRT predicted in the model study. The latter should be tested in practice in future research.
3.4. Implication of Optimisation on Reactor Size and Cost
The impact of the improved mixing in the optimised Chinese dome digester on size, cost and water reduction is evaluated in this section. The improved Chinese dome digester design parameters and output were compared with the optimal design of a conventional Chinese dome digester for rural Kenyan and Cameroonian households [
35]. The main parameters are presented in
Table 3. Both digesters presented, for Kenya and Cameroon [
35], have similar characteristics, except that the Kenyan digester was operated at a lower OLR. The estimated size for the improved system in this study is based on the reduced HRT (30 days) and increased influent TS. The cost of the improved CDD, using 50% of the Cameroonian reactor volume, was estimated, after consulting W. van Nes of SNV, to be
$450 plus 7.5% for the added baffles.
The two digesters (Kenya and Cameroon) were made from cheap stabilised interlocking soil blocks constructed by the organisation SNV. From the table, it is obvious that the improved mixing created by the addition of baffles made a positive impact on the problems highlighted in the review at the beginning of the article—long hydraulic retention time, high water dilution, reactor size and capital cost of the system.
The size of the improved baffled CDD is half of that of the Kenyan and Cameroonian digesters, while the volumetric biogas production is higher. The major differences between the improved and conventional digester [
35] are the higher OLR, higher biogas production (more than two-fold) and the improved mixing conditions. In addition, the requirement for water is reduced by half. The applied influent VS concentration for the Cameroonian was calculated to be 88.2 g VS/L, while it was 108 g VS/L for the improved CDD, respectively. Assuming the manure was 25% TS and 18% VS (73% of the TS in this study) before water dilution, 1.1 and 0.7 litre dilution water per litre manure is needed for the Cameroonian and improved CDD, respectively. The lower water requirement will positively impact the application of the improved system because of limited water availability in arid regions.
The similar biogas production at a quite different organic loading rates applied in the Kenyan and Cameroonian systems indicates that mixing is limited in the conventional CDD. The results show that the established intermittent mixing cycle in the improved CDD considerably improves the conversion efficiency as compared to that in the conventional CDD.
4. Conclusions
The improved Chinese dome digester with two baffles was evaluated in a pilot study and compared with the conventional (blank) digester in continuous operation at higher organic loading rates (ca. 15% TS, corresponding to 2.6–4 kg VS/m3/d) at HRTs of 40 and 30 days. The optimised Chinese dome digester has a two-minute self-mixing or agitation cycle of the top layer of the digester content, using the produced gas without a moving device. Since the optimised digester is self-mixed with the aid of baffles, the overall performance of the digester did improve and produced 40% more methane than the blank, despite the applied high loading rates. The optimised digester showed superior digestion treatment efficiency and was more stable in terms of VFA concentration than the blank digester, and therefore could be operated at high influent TS (15%) concentration.
The results revealed that mixing becomes important at high influent TS (15% TS influent), because influent rheological property requires more mixing to achieve similar results. The experimental results showed that the self-agitation cycle contributes to the improved performance of the optimised digester. The specific biogas production from the optimised reactor is comparable to results from continuously stirred reactor tanks (CSTR). As a consequence, a smaller reactor volume could be achieved at high loading rate at reduced HRT (≤ 40 days) and eventually reduction in reactor cost as compared with the two digesters (Kenya and Cameroon). High-input TS concentrations mean lower water dilution; therefore, the lower water requirement will positively impact the application of the improved digester because of limited water availability in arid regions where Chinese dome digesters are used for cooking.


