Abstract
In recent decades, growing concerns about global warming and climate change effects have led to specific directives, especially in Europe, promoting the use of primary energy-saving techniques and renewable energy systems. The increasingly stringent requirements for carbon dioxide reduction have led to a more widespread adoption of distributed energy systems. In particular, besides renewable energy systems for power generation, one of the most effective techniques used to face the energy-saving challenges has been the adoption of polygeneration plants for combined heating, cooling, and electricity generation. This technique offers the possibility to achieve a considerable enhancement in energy and cost savings as well as a simultaneous reduction of greenhouse gas emissions. However, the use of small-scale polygeneration systems does not ensure the achievement of mandatory, but sometimes conflicting, aims without the proper sizing and operation of the plant. This paper is focused on a methodology based on vector optimization algorithms and developed by the authors for the identification of optimal polygeneration plant solutions. To this aim, a specific calculation algorithm for the study of cogeneration systems has also been developed. This paper provides, after a detailed description of the proposed methodology, some specific applications to the study of combined heat and power (CHP) and organic Rankine cycle (ORC) plants, thus highlighting the potential of the proposed techniques and the main results achieved.
1. Introduction
In recent decades, the world energy consumption has continuously increased, especially because of the strong economic growth of non-OECD (Organisation for Economic Co-operation and Development) countries [1,2]. Fossil fuels have mostly been used to cope with this increased energy demand, leading to considerable concerns about climate change. Therefore, an increasing use of renewable energy sources and a more efficient exploitation of primary energy sources are indispensable to reduce carbon dioxide emissions and limit global warming effects, as suggested by the chart in Figure 1 [3]. In this figure, the first column represents the world’s total primary energy supply in 2011. The second bar represents the outlook of the primary energy supply at 2050 in the current energy scenario, for which the average global temperature rise is projected to be 6 °C. The third column represents the outlook at 2050 in the 450 Scenario, for which the average global temperature increase should be limited to 2 °C. The figure highlights how the share of renewable energy sources should reach about 40%, while the primary energy consumption should decrease about 25% compared to the 6 °C Scenario (i.e., the energy efficiency should increase by about 25%) to limit the average temperature rise.
Figure 1.
World total primary energy supply detailed by fuel [3].
Due to improvements in energy efficiency and to an increasing use of low-carbon energy and renewable energy sources, energy-related CO2 emissions stalled in 2015, as reported in [4]. However, with the development of innovative technologies in the future [5] in addition to traditional engines [6,7,8,9,10,11], increasing exploitation of energy sources and increasing share of renewable energies in final energy consumption will still be fundamental if we are to cope with the challenges due to the world energy balance and recognized by the Paris Agreement on climate change. In particular, the World Energy Outlook of 2016 (WEO-2016) highlighted how a key player in further emissions reductions is recognized to be the wider use of renewable energy sources in the power sector. The WEO-2016 also highlighted how in the industrial sector alone, an additional investment of about 300 billion dollars could reduce the 2040 global electricity demand by about 5%, thus avoiding investments of about 450 billion dollars in power generation.
In this scenario, a key role for primary energy saving and greenhouse gas emission reduction could be played by polygeneration systems [12,13,14,15,16,17,18,19]. These are mainly cogeneration systems delivering useful electric (or mechanical) and heat output making use of a single primary energy source (often referred to as combined heat and power (CHP) or combined cooling, heat, and power (CCHP) systems) or more complex integrated energy systems providing heat and power from a combination of renewable and non-renewable power plants and equipment (e.g., solar PV systems, wind turbines, biomass boilers, and CHP systems). More precisely, as stated by Serra et al. in [12] and Song et al. in [20], polygeneration could be defined as the combined supply of two or more energy services and/or manufactured products with the aim of maximizing the exploitation of the energy source that supplies the plant. Examples of polygeneration systems are cogeneration and trigeneration plants, dual-purpose power, and desalination plants [12]. In particular, combined heat and power generation can allow for considerable decreases in primary energy consumption, CO2 emissions, and costs [21,22,23,24,25,26].
The strategic role of polygeneration systems in the achievement of the Paris Agreement goals involves leading the transition from centralized energy generation to mature, distributed, small- and medium-scale energy generation. However, due to the decrease in thermal efficiency and the increase in specific investment costs with the reduction in plant size, the actual utilization of the thermal energy provided by a cogeneration plant is essential to optimize energetic and economic performance (for example, fuel utilization factor, net present value, and CO2 emission). Figure 2 clearly shows this concept applied to a CHP plant based on the internal combustion engine. In particular, it shows the primary energy saving (PES) as a function of the plant’s electrical efficiency (i.e., engine size if ON/OFF operation is assumed) for , , and the different ratios of the available nominal thermal power actually exploited by the final user.
Figure 2.
Primary energy saving (PES) as function of the combined heat and power (CHP) plant’s electrical efficiency for different ratios of the nominal thermal power actually exploited (the chart is representative of CHP plants adopting a reciprocating internal combustion engine).
As for the possible energy subsystem of polygeneration plants, an increasingly important role is played by organic Rankine cycle (ORC) plants [27] thanks to the possibility of exploiting low-enthalpy heat sources. ORC plants convert waste heat into electrical energy. However, they often integrate complex polygeneration plants to improve the energetic performance or to adjust the electricity to the thermal energy output ratio of the whole system, as demonstrated in [28,29,30]. In this context, unlike centralized power plants [31,32], ORC technology encourages distributed power generation [33,34]. However, the efficiency and cost optimization of ORC plants is a key issue, due to their high specific investment cost and low thermal efficiency [35]. Therefore, the goal of this research work is to highlight the key role that advanced mathematical methods could have for the optimal configuration of polygeneration plants, also focusing on the optimization of ORC plants given their increasing use within complex polygeneration systems. In particular, evolutionary genetic optimization algorithms could be useful in identifying optimal solutions, even when conflicting goals are pursued. For this purpose, and with reference to the load profiles of an Italian hospital facility, in the first part of this research, the energetic and economic advantages achievable with the use of optimized cogeneration plants ensuring electricity, sanitary hot water, and space heating are addressed. Vector optimization techniques were adopted by coupling an evaluation algorithm developed by the authors with an evolutionary optimization algorithm.
The calculation algorithm includes variable energy demands, variability for the specific investment costs, revenue from selling the exceeding electrical energy to the grid taking into consideration different time periods, different pricing periods based on an Italian three-tier tariff; nominal efficiencies depending on CHP engine size, and all of the main elements of complexity discussed in research activities already published [36,37]. Moreover, the methodology includes other topics that have not yet been addressed, enabling the design of a CHP plant when energetic, economic, or legislative scenarios change. In fact, many research works have ignored uncertainties that could affect the expected results, as stated in [38]. In [39], the development of an operation optimization model for CHP plants is addressed, and the energy prices are forecasted. However, most of the studies have assumed fixed values for tariffs and other quantities, while these values are variable during the plant’s life span. Furthermore, most of the developed methodologies do not identify technical solutions actually available in the market, as stated in [40].
Therefore, the following two key problems were analyzed in this article:
- the instability of the results due to mismatches between the marketed CHP engines and those provided by the calculation procedure;
- the instability of the results due to variations in the reference energetic and electricity tariff scenarios.
In this study, firstly, optimal energetic and economic solutions (i.e., engine number and size) were found. Subsequently, a multi-objective robust design optimization approach was used to find the most stable plant solutions. Although robust design techniques have been rarely adopted within the field of energy systems [41], this research proposes a novel and valid application of such techniques to polygeneration plants. Robust optimization is a methodology addressing uncertainty in the input data of an optimization problem; further details can be found in [42,43,44].
Lastly, a vector optimization problem concerning an ORC plant supplied by biomass [45] was solved. Objectives of the optimization problem were the maximization of the global electric efficiency and the minimization of the overall heat exchangers area, which could be related to the cost of the plant and its size. Most of the research works on ORC power plants focus on the thermodynamic optimization and fluid selection [46,47,48]. However, few studies address the vector optimization of an ORC plant according to specific thermodynamic and economic objective functions, which is a more reasonable approach than single-objective optimization [49].
2. The Proposed Methodology
2.1. The Vector Optimization Approach for CHP System Optimization
Starting from data concerning thermal and electric power required by the reference hospital facility [1], the energetic and economic performance of the plant were calculated over the plant’s life span, which is estimated to be 10 years. In particular, the heat demand curve represented in Figure 3 was obtained by reordering the annual thermal load to ensure its contemporaneity with the duration curve of the electrical load reported in the same figure. A vector optimization process was performed to find the optimized modular plant configurations. Similar methodologies were already adopted in [50,51,52,53]. Vector optimization [54,55,56,57] can be useful to conduct predictive investigations on a high number of plant solutions, also highlighting eventual tradeoffs between energetic and economic results. The vector optimization problem is generally formalized as follows [58]:
where , , , and , where are conflicting functions, is the objectives space, and is the decision variable space. For this reason, vector is a decision variable, while is a vector of objectives. Table 1 shows decision variables and objective functions of the problem. The optimal solutions are identified from the notion of partial ordering. The minimum problem of Equation (1) is based on the Pareto dominance concept and usually provides a set of optimal solutions.
Figure 3.
Annual duration curve of the electrical load and contemporary thermal load profiles of the analyzed hospital facility.
Table 1.
Decision variables and objective functions of the optimization problem. SPB: simple payback period.
The authors developed a specific evaluation algorithm. This algorithm, which will be described in detail in the evaluation algorithm, was coded and coupled to the genetic algorithm MOGA II, according to the logic scheme shown in Figure 4.
Figure 4.
Workflow of the multi-objective optimization process.
Although each evolutionary algorithm proposes a different approach, each of them simulates the evolution of populations through the application of the genetic operators of selection, mutation, and crossover. Genetic algorithms are iteratively executed on a set of coded chromosomes, called the population. Each genetic operator is applied to the current individual according to predefined probabilities. MOGA II is a version of MOGA improved by Poloni [59,60].
However, several inputs to the algorithm can be characterized by uncertain values or can vary during the plant’s life span. Therefore, vector optimization problems were also solved to evaluate the stability of the results to mismatches between calculated and marketed solutions. Possible variations in the energetic and tariff scenarios have also been considered. In particular, a robust design methodology was used. For this reason, some specific decision variables or economic and energetic input quantities to the proposed evaluation algorithm were redefined using a probability distribution. The vector optimization processes were then performed. A stable solution is characterized by a lower sensitivity to fluctuations of unknown variables. However, the most stable solutions may not include the solutions on the Pareto Front. The discrete formulation for the MORDO (multi-objective robust design optimization) problem can be written as [61]
In Equation (2), represents the stochastic description of the variable , represents the probability density function, and represents the cumulative distribution function. The mean value and the variance for the random variable can be calculated as follows:
The uniform and the normal distributions were adopted in this study. More details concerning these probability density functions can be found in [36].
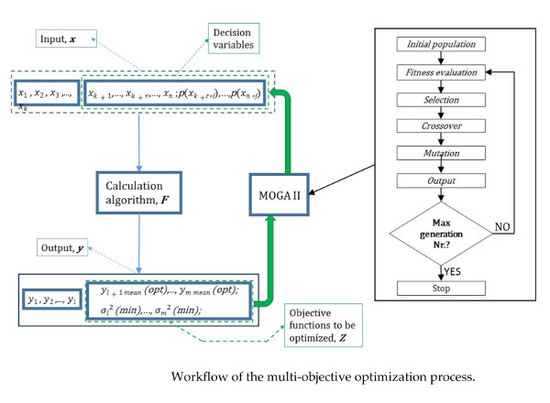
The Evaluation Algorithm
Cogeneration plants based only on natural gas internal combustion engines (ICEs) were considered because of the dominance of ICEs in small- and medium-scale applications. The main input variables to the developed algorithm are as follows:
- -
- annual electrical () and thermal load () of the user;
- -
- nominal electrical power of the CHP gas engine () and their number ();
- -
- reference efficiency for thermo-electric power generation ();
- -
- average boiler efficiency ();
- -
- CHP plant maintenance costs for kWh of generated electrical energy ();
- -
- fuel lower heating value ();
- -
- electrical energy price based on a three-tier time-of-use (TOU) tariff, not including VAT (;
- -
- electricity taxation ;
- -
- electrical energy selling price in the billing periods ();
- -
- the selling price of energy efficiency certificates (EECs) for cogeneration plants to be recognized as highly efficient ();
- -
- natural gas tariff, not including VAT ();
- -
- natural gas taxation ();
- -
- peak demand charge ();
- -
- discount rate ();
- -
- lifetime of the plant ().
The annual electrical () and thermal loads () of the user were determined via hourly average values, providing the possibility to simulate the hourly operation of the entire CHP-user system over an entire year. Further details are discussed in [1].
Total PES (TPES) and simple payback period (SPB) are the main output of the evaluation algorithm, which depend on the specific operation strategies adopted for the CHP engines. An ON/OFF operation was imposed to each cogeneration plant (i.e., the electrical power delivered by the plant depends on the engine size). The engines are switched ON when their operation results in a positive contribution to the PES. Otherwise, when no energetic advantage is achieved, the engines are switched OFF. In particular, according to the management strategy adopted, any hour of the year that is characterized by positive values of the primary energy saving index is included in the operating range of the CHP plant. Variations in the nominal electrical () and thermal () efficiency with the engine size were imposed, according to the curves represented in Figure 5. The efficiency curves in Figure 5 are based on the rated values of some cogeneration natural gas engines currently on the market. Figure 5. also depicts the regression curve adopted to evaluate the specific investment cost of each single cogeneration unit () as a function of its size. The nominal thermal power of the CHP engine is then evaluated as follows:
Figure 5.
Variation in the nominal efficiencies and specific investment cost with the cogeneration plant size.
To calculate the operating costs of the entire CHP-user system, the electrical load profile has been characterized according to a three-tier Italian tariff [1].
Analyses are based on the estimation of the hourly average thermal power actually exploited (), as calculated from thermodynamic considerations. This estimation is then used to define the operating range of the cogeneration system through an hourly primary energy calculation that is performed as follows by assuming the CHP plant is ON over the whole year:
where
The in Equation (6) compares the primary energy consumption that characterizes the interaction among the cogeneration system, the user, the electrical grid, and the auxiliary boilers in the analyzed energy system to the primary energy consumption, which characterizes the separate production of the same amount of energy. Therefore, also considers the thermal energy provided by auxiliary boilers and the electrical energy imported from the grid. Moreover, when considering the separate production, the electrical energy provided by the cogeneration system and exceeding the user load demand must be considered as generated with the average efficiency of thermoelectric power generation (.
Once the vector including the number of CHP engines that are switched ON hourly (N(t)), and thus the actual CHP engine number (NCHP), has been redefined according to the adopted operating strategy, it is possible to evaluate the hourly average electric ( and thermal ( power provided by the CHP plant. Moreover, to perform detailed energetic and economic analyses, the electric loads of the user (), the CHP electric power (, and therefore the rate of self-consumed by the user ( have been characterized according to the considered TOU tariff, allowing for the definition of vectors , , and . The individual contributions in Equations (6) and (7) are calculated through the following equations:
given that the following definitions are assumed:
Once the self-consumed electrical power () is determined, the electrical power imported from the grid is given by:
where is the average power requested from the final user. Once has been evaluated with Equation (18), and can be recalculated before the energetic balance of the whole reference year is performed, and the resulting TPES can finally be determined according to the following equation:
where accounts for transmission and transformation losses on the electrical grid.
The TPES in Equation (19) is the total primary energy savings, which considers all energy flows between user, cogeneration system, and the grid. Finally, detailed economic analyses can be performed, and the ability to comply with the conditions required to be recognized as a high-efficiency cogeneration plant can be verified. Further details are reported in [36].
2.2. The Multi-Objective Approach for ORC System Optimization
The optimization approach described in this paragraph involves the coupling of the thermodynamic model of the ORC system with the evolutionary algorithm MOGA II. Starting from the assigned values of the input parameters and the ORC system model deeply discussed in [35], the optimization process enabled the identification of a set of Pareto dominant solutions for the specific system configuration and application. With reference to the general scheme of the optimization process represented above in Figure 4, analyses were conducted by selecting the following two objective functions:
Although there is a shortage of reliable cost data for ORC plants already installed [62], the energetic and economic optimization of these plants is a fundamental issue to be addressed. Therefore, to overcome this limitation, the plant investment cost was related to the total exchange area of the heat exchangers as defined in Equation (21). The total heat transfer area was then set as the objective function (to be minimized) to indirectly optimize the economic performance of the ORC. Actually, it should be noted that the investment cost of these systems is dominated by the cost of the heat exchangers rather than that of the pump and turbine [63]. Wang et al. [63], instead, considered the ratio between the net power output and the total heat transfer area as a single objective function to achieve both thermodynamic and economic optimization. Important information about the cost for ORC plants is reported in [64]. At any rate, if the type and technological level of the heat exchanger are defined through a fixed value of the surface/volume ratio, and the cost of the heat exchanger is proportional to its mass, then the ORC investment cost increases proportionally to the overall exchange area. This indirect approach to the cost estimation also enables more general results that are independent of the technology maturity level, which characterizes each specific application.
The following parameters were selected as decision variables of the optimization problem: minimum and maximum pressure (pmin and pmax) of the thermodynamic cycle, regenerator efficiency (εreg), superheating at the evaporator outlet (ΔTsuper), and sub-cooling at the condenser outlet (ΔTsub). The range of definition for the pressure in the decision variable space (Table 2) was limited according to the thermodynamic restrictions imposed by the hot and cool sources. More details are reported in [35].
Table 2.
Range of definition for the decision variables.
The overall heat exchangers area and the global electric efficiency were evaluated via a 0D model of the ORC system, which became the calculation algorithm coupled with the optimization algorithm MOGA II according to the scheme shown in Figure 4.
3. Analyses and Results
3.1. CHP Plant Configuration Optimization
Figure 6 shows, on the objective function plane, the distribution of the calculated solutions obtained through the maximization of the TPES and the minimization of the payback period (SPB). Specifically, the bubble chart includes, for each numerical solution, details concerning the number CHP engine adopted and the electrical power output provided by each CHP engine (i.e., CHP engine size). The Pareto optimal front was also depicted, highlighting how solutions that maximize the total energy savings are characterized by an increased payback period. Moreover, this result is in agreement with other analyses available in the literature [59,65].
Figure 6.
Bubble chart with details concerning CHP engine number and size.
It should also be noted that low TPES increases can be achieved with a high worsening of the payback period. Dominant solutions show primary energy saving exceeding 16.5%, payback periods of 2.9–4.6 years, and the adoption of one to three CHP engines with sizes in the range of 260 to 570 kW for each engine. In particular, the plant solution ensuring the minimum payback period is characterized by one CHP engine providing 554 kW of electric power while the maximum PES solution (highlighted by a black circle in Figure 6.) consists of three CHP engines providing about 350 kW of electric power. This solution allows for a TPES of over 17% and a SPB of just over 4.5 years. Figure 6. also shows how modular plants consisting of two or three CHP engines ensure a reasonable compromise between energetic and economic objectives. Figure 7 shows how, unlike heuristic or random techniques, the statistical genetic optimization algorithm MOGA II provides fast convergence toward global optimum solutions starting from the initial set of solutions belonging to the DoE (Design of Experiment). Specifically, solutions in the objective functions space are labeled according to their iteration number, while DoE solutions are depicted with green circles. After DoE methods were performed and solution number 67 identified, it should be noted that only three subsequent iterations were required by MOGA II to find a solution reasonably close to the Pareto dominant solutions (i.e., close to the minimum SPB solution).
Figure 7.
MOGA II’s fast convergence toward Pareto dominant solutions.
Finally, Figure 8 shows the electric power delivered by the CHP plant and the electrical load demand of the user with reference to the minimum SPB solution (i.e., one CHP engine providing 554 kW of electric power output) and a specific day of the year. Figure 9 shows the difference between the thermal power provided by the same system configuration and the thermal power required by the user.
Figure 8.
The electric power required by the user and that provided by the CHP plant.
Figure 9.
The thermal power provided by the CHP plant and that required by the user.
To estimate the robustness of the results to the possible unavailability on the market of CHP systems whose sizes are quite close to the calculated optimal plants, a second vector optimization problem was solved. The cogeneration engine size was defined through a stochastic decision variable described by a uniform distribution. A set of 25 sample solutions was adopted to describe this distribution. The sample designs are spread over an interval of 60 kW. Moreover, they were centered around the mean value currently evaluated by the optimization algorithm. Figure 10 shows, in the (SPB) − (TPES) plane, the obtained dominant solutions, where is the standard deviation of the quantity under consideration, and is its mean value.
Figure 10.
Pareto dominant solutions obtained through the first robust design analysis.
Figure 10 shows that the standard deviation accounts for up to 7% of its mean value for the payback period. The ratio for the TPES is always under 3%. Solutions were also ranked according to the arcs of circumference, defined as equal-stability curves, and are represented in Figure 10. The most stable solution is highlighted in red and its main characteristics are summarized in Table 3. It should be noted that this Pareto solution obtained through the robust design approach becomes a dominated solution if a deterministic approach is adopted for the optimization process, as demonstrated in Figure 6, where this solution is highlighted with a red circle. Figure 10 also shows that the most stable solutions include the best energetic performance solution obtained through the deterministic approach (i.e., three CHP engines—354 kW of electric power highlighted in Figure 6). In this last configuration, the uncertainties related to the actual commercial availability of the CHP engine size under consideration have a greater effect on the economic sensitivity, while the ratio for the TPES is around 1%, showing high energetic stability.
Table 3.
The main characteristics of the most stable solution.
Figure 11 demonstrates that the results, achievable when a deterministic definition of the decision variables is adopted, may lead to an overestimation of the objective functions if they are compared to the values achievable through the MORDO.
Figure 11.
Deterministic and probabilistic approaches to vector optimization.
In fact, the red circle highlights the maximum TPES solution (three engines with 354 kW of electric power output) represented in Figure 6. The blue crosses represent 25 sample solutions that belong to a single statistical distribution for the CHP engine size (i.e., the same robust design solution) whose mean value is just 354 kW, which characterizes the maximum TPES solution represented in red. Figure 11 shows that the SPB can range from 4.3 to 5.3 years, while the TPES could vary in the range 16.7–17.1 when the robust design approach is adopted. These energetic and economic fluctuations are due to the uncertainties related to the actual commercial availability of the considered engine size. To estimate the performance fluctuations due to eventual variations in the energetic and economic scenarios, a further MORDO problem was solved. Specifically, the selling price of the electricity in the three price periods, the efficiency of the Italian thermoelectric generation, and the selling price of the EECs granted in Italy to high-efficiency CHP plants were represented through normal probability distributions (Table 4).
Table 4.
Probabilistic decision variables adopted in the second MORDO problem.
Figure 12 summarizes, in the (SPB) − (TPES) plane, the expected energetic and economic stability for the dominant solutions.
Figure 12.
Pareto dominant solutions obtained through the second robust design analysis.
The standard deviation for the payback period is always lower than 3.5% of its mean value. This percentage, that provides an estimation of the variations of the objective functions during the plant’s life span, assumes values up to 7% for the total primary energy saving. The most stable solution is highlighted with a red circle in Figure 12, and its characteristics are summarized in Table 5.
Table 5.
Main characteristics of the most stable energetic and economic solution.
This plant configuration is somehow similar to the best TPES solution represented in Figure 6. For this reason, further analysis will be conducted in future works to investigate if the maximum energy-saving solutions belonging to the Pareto frontier and calculated with a deterministic approach to the definition of the decision variables generally lead to more stable economic and energetic results, in comparison to the other dominant solutions.
3.2. ORC System Optimization
The vector optimization process generated over 3500 different solutions. Figure 13 shows, among Pareto dominant solutions, a clear tradeoff between the two objectives functions. Therefore, an increase in the global electric efficiency (due to the improvement of the thermal efficiency) was associated with an increased overall heat exchange area, and thus with an increase in the investment cost, as also confirmed in [65]. The increase of the electrical efficiency is mainly correlated with increased values of the degree of regeneration, as highlighted in Figure 14.
Figure 13.
Pareto optimal front and clustering of the calculated solutions. In this figure, the comma is used as a symbol to separate the integer part from the fractional part of a number.
Figure 14.
Pareto history chart of the degree of regeneration.
Pareto optimal solutions are characterized by electric efficiencies between 14.1 and 18.9% and an overall heat exchangers area from 446 to 1079 m2. Solutions characterized by higher values of the global electric efficiency show higher values of the regenerator efficiency and higher values of the thermal power recovered by the regenerator.
Figure 15 shows, for the same Pareto dominant solutions, the history chart for the minimum and maximum pressures of the thermodynamic cycle. Minimum pressure values are concentrated in a small range between 12.7 (Solution 6) and 20.7 kPa (Solution 0), whose saturation temperatures are 88.1 °C and 100.9 °C, respectively.
Figure 15.
History chart for the minimum and maximum pressures of the thermodynamic cycle.
Almost all of the optimal solutions show a superheating phase (Figure 16) that is mostly under 5 °C, except for the solutions identified by the numbers 13, 15, 21, and 36. However, due to the negligible superheating phase, the maximum temperature of the thermodynamic cycle mainly coincides with the saturation temperature at the maximum cycle pressure for all of the Pareto solutions. Figure 16 also shows that the sub-cooling phase can be neglected.
Figure 16.
History chart of the superheating and sub-cooling temperatures.
Table 6 summarizes some important details concerning three specific solutions belonging to the three zones highlighted in Figure 13.
Table 6.
Characteristics of three solutions belonging to the three zones identified in Figure 13.
Finally, with reference to Solution 0 and Solution 41, Figure 17 provides more detailed information for comparison. It should be noted that Solution 41 is characterized by a higher heat recovery through the regenerator. This higher thermal power is due to an increased heat exchange area for the regenerator, which was indirectly related to an increased investment cost in this study. These conditions enable the increase of the electric efficiency of the ORC power plant.
Figure 17.
Scheme of the studied ORC power plant with details of the thermodynamic conditions for Solution 0 and Solution 41. (a) Solution 0@Zone 1; (b) Solution 41@Zone 31.
4. Conclusions
The increasingly stringent requirements for carbon dioxide reduction have led to a more widespread adoption of distributed energy systems. One of the most effective techniques employed to face the energy-saving challenges is the adoption of polygeneraton systems. These plants can provide a relevant increase in overall efficiency and cost savings. For this reason, a simultaneous reduction of greenhouse gas emissions can be also achieved. However, the use of small-scale polygeneration systems does not ensure the achievement of mandatory, but sometimes conflicting, aims without the proper sizing and operation of the plant. Advanced mathematical techniques such as vector optimization based on evolutionary genetic algorithms and the robust design approach could play a key role in identifying optimal solutions. After a detailed description of these techniques, some specific applications to the study of CHP and ORC systems were presented in this research paper to highlight the potential of these methods and the main results achieved. In particular, the stability of the results to possible mismatches between the cogeneration engine size actually marketed and that calculated was evaluated. Then, the robustness of the achievable results to the eventual variation in the reference energetic scenario and electricity tariffs was also analyzed.
Finally, a vector optimization technique was adopted to simultaneously optimize the electric efficiency and the plant investment cost of a specific ORC system. The genetic optimization algorithm MOGA II and an indirect approach to the evaluation of the plant cost were adopted. This study clearly highlighted how vector optimization techniques based on evolutionary genetic algorithms and the robust design approach provide effective mathematical tools that can support and promote original investigations concerning polygeneration and energy systems in general. In particular, the insertion of robust design procedures in the vector optimization methodology proposed by the authors enables the minimization of the effects of uncertainties on the expected results provided by the energy system under investigation.
Author Contributions
Both authors played an equal role in the development of the methodology and its applications, the analyses of the results, and the writing of the manuscript in the present research work.
Conflicts of Interest
The authors declare no conflict of interest.
Nomenclature
| discount rate | |
| area [m2] | |
| total area for the heat exchange [m2] | |
| hourly electrical energy delivered by the CHP plant and self-consumed by the user [kWh] | |
| primary energy [kWh] | |
| yearly electrical energy supplied by the CHP plant [kWh] | |
| yearly electrical energy supplied by the CHP plant exceeding the user needs [kWh] | |
| yearly electrical energy integrated by the electrical grid [kWh] | |
| yearly primary energy supplied to the CHP plant [kWh] | |
| yearly thermal energy supplied by the CHP plant [kWh] | |
| yearly thermal energy integrated by auxiliary boilers [kWh] | |
| factor representative of transmission and transformation losses on the electrical grid [-] | |
| actual thermal power provided by the CHP plant [kW] | |
| nominal thermal power of a single CHP gas engine [kW] | |
| average power output of the CHP during the tth time interval | |
| average electrical load of the user during the tth time interval of the year | |
| electrical power to be integrated from the electrical grid during the tth time interval | |
| nominal electrical power of each CHP gas engine [kW] | |
| std dev | standard deviation of the considered quantity |
| CHP | combined heat and power |
| CCHP | combined cooling, heat, and power |
| DoE | design of experiment |
| EEC | energy efficiency certificates |
| ICE | internal combustion engine |
| MOGA | multi-objective genetic algorithm |
| MORDO | multi-objective robust design optimization |
| PES | primary energy savings |
| PS | proposed system (CHP) |
| PV | photovoltaic |
| RDO | robust design optimization |
| RS | reference system (separate production of electrical and thermal energy demand) |
| SPB | simple payback period |
| TPES | total (or technical) primary energy savings |
| duration of the time interval (1 h in this paper) | |
| superheating at the evaporator outlet [°C] | |
| subcooling at the condenser outlet [°C] | |
| regenerator efficiency or degree of regeneration [-] | |
| average boiler efficiency [-] | |
| nominal electrical efficiency of the CHP gas engine [-] | |
| global electric efficiency [-] | |
| reference efficiency for thermo-electric power generation [-] | |
| average efficiency of the Italian thermoelectric power generation [-] | |
| actual thermal efficiency of the cogeneration plant () [-] | |
| nominal thermal efficiency of the cogeneration plant [-] | |
| reference efficiency for thermal energy production [-] | |
| cond | condenser |
| eva | evaporator |
| reg | regenerator |
References
- Gimelli, A.; Muccillo, M. Optimization Criteria for Cogeneration Systems: Multi-Objective Approach and Application in a Hospital Facility. Appl. Energy 2013, 104, 910–923. [Google Scholar] [CrossRef]
- International Energy Agency. Key World Energy Statistics; International Energy Agency: Paris, France, 2016. [Google Scholar]
- International Energy Agency. Energy Technology Perspectives; International Energy Agency: Paris, France, 2014; ISBN 978-92-64-20800-1. [Google Scholar]
- International Energy Agency. World Energy Outlook; International Energy Agency: Paris, France, 2016. [Google Scholar]
- Stambouli, A.B.; Traversa, E. Solid oxide fuel cells (SOFCs): A review of an environmentally clean and efficient source of energy. Renew. Sustain. Energy Rev. 2002, 6, 433–455. [Google Scholar] [CrossRef]
- Fontanesi, S.; Severi, E.; Bozza, F.; Gimelli, A. Investigation of Scavenging, Combustion and Knock in a Two-Stroke SI Engine Operated with Gasoline and CNG. Int. J. Automot. Eng. 2012, 3, 97–105. [Google Scholar]
- De Simio, L.; Gambino, M.; Iannaccone, S.; Borrelli, L.; Gimelli, A.; Muccillo, M. Experimental Analysis of a Natural Gas Fueled Engine and 1-D Simulation of VVT and VVA Strategies. In Proceedings of the ICE2013—11th International Conference on Engines & Vehicles, Capri, Italy, 15–19 September 2013. SAE Technical Paper number 2013-24-0111. [Google Scholar] [CrossRef]
- Gimelli, A.; Muccillo, M.; Pennacchia, O. The Study of a New Mechanical VVA System. Part I: Valve Train Design and Friction Modeling. Int. J. Res. Engines 2015, 16, 750–761. [Google Scholar] [CrossRef]
- Gimelli, A.; Muccillo, M.; Pennacchia, O. Study of a New Mechanical VVA System. Part II: Estimation of the Actual Fuel Consumption Improvement through 1D Fluid Dynamic Analysis and Valve Train Friction Estimation. Int. J. Engine Res. 2015, 16, 762–772. [Google Scholar] [CrossRef]
- De Nola, F.; Giardiello, G.; Gimelli, A.; Molteni, A.; Muccillo, M.; Picariello, R. A Model-Based Computer Aided Calibration Methodology Enhancing Accuracy, Time and Experimental Effort Savings through Regression Techniques and Neural Networks. In Proceedings of the ICE2017—13th International Conference on Engines and Vehicles, Capri, Italy, 10–14 September 2017. SAE Technical Paper # 2017-24-0054. [Google Scholar] [CrossRef]
- De Bellis, V.; Gimelli, A.; Muccillo, M. Effects of Pre-Lift Intake Valve Strategies on the Performance of a DISI VVA Turbocharged Engine at Part and Full Load Operation. Energy Procedia 2015, 81, 874–882. [Google Scholar] [CrossRef]
- Serra, L.M.; Lozano, M.A.; Ramos, J.; Ensinas, A.V.; Nebra, S.A. Polygeneration and efficient use of natural resources. Energy 2009, 34, 575–586. [Google Scholar] [CrossRef]
- Calise, F.; Figaj, R.D.; Massarotti, N.; Mauro, A.; Vanoli, L. Polygeneration system based on PEMFC, CPVT and electrolyzer: Dynamic simulation and energetic and economic analysis. Appl. Energy 2017, 192, 530–542. [Google Scholar] [CrossRef]
- Calise, F.; Cipollina, A.; Dentice D’Accadia, M.; Piacentino, A. A novel renewable polygeneration system for a small Mediterranean volcanic island for the combined production of energy and water: Dynamic simulation and economic assessment. Appl. Energy 2014, 135, 675–693. [Google Scholar] [CrossRef]
- Guo, Z.; Wang, Q.; Fang, M.; Luo, Z.; Cen, K. Thermodynamic and economic analysis of polygeneration system integrating atmospheric pressure coal pyrolysis technology with circulating fluidized bed power plant. Appl. Energy 2014, 113, 1301–1314. [Google Scholar] [CrossRef]
- Buonomano, A.; Calise, F.; Ferruzzi, G.; Vanoli, L. A novel renewable polygeneration system for hospital buildings: Design, simulation and thermo-economic optimization. Appl. Therm. Eng. 2014, 67, 43–60. [Google Scholar] [CrossRef]
- Bracco, S.; Delfino, F.; Pampararo, F.; Robba, M.; Rossi, M. A dynamic optimization-based architecture for polygeneration microgrids with tri-generation, renewables, storage systems and electrical vehicles. Energy Convers. Manag. 2015, 96, 511–520. [Google Scholar] [CrossRef]
- El-Emam, R.S.; Dincer, I. Assessment and Evolutionary Based Multi-Objective Optimization of a Novel Renewable-Based Polygeneration Energy System, ASME. J. Energy Resour. Technol. 2016, 139, 012003. [Google Scholar] [CrossRef]
- Calise, F.; D’Accadia, M.D.; Libertini, L.; Quiriti, E.; Vicidomini, M. A novel tool for thermoeconomic analysis and optimization of trigeneration systems: A case study for a hospital building in Italy. Energy 2017, 126, 64–87. [Google Scholar] [CrossRef]
- Song, H.; Starfelt, F.; Daianova, L.; Yan, J. Influence of drying process on the biomass-based polygeneration system of bioethanol, power and heat. Appl. Energy 2012, 90, 32–37. [Google Scholar] [CrossRef]
- D’Accadia, M.D.; Sasso, M.; Sibilio, S.; Vanoli, L. Micro-combined heat and power in residential and light commercial applications. Appl. Therm. Eng. 2003, 23, 1247–1259. [Google Scholar] [CrossRef]
- Muccillo, M.; Gimelli, A. Experimental Development, 1D CFD Simulation and Energetic Analysis of a 15 kW Micro-CHP Unit based on Reciprocating Internal Combustion Engine. Appl. Therm. Eng. 2014, 71, 760–770. [Google Scholar] [CrossRef]
- Merkel, E.; McKenna, R. Wolf Fichtner, Optimisation of the capacity and the dispatch of decentralised micro-CHP systems: A case study for the UK. Appl. Energy 2015, 140, 120–134. [Google Scholar] [CrossRef]
- Monteiro, E.; Moreira, N.A.; Ferreira, S. Planning of micro-combined heat and power systems in the Portuguese scenario. Appl. Energy 2009, 86, 290–298. [Google Scholar] [CrossRef]
- Sannino, R. Thermal characterization of CHP-User Needs interaction and optimized choice of the Internal Combustion Engines in the CHP plants. Energy Procedia 2015, 82, 929–935. [Google Scholar] [CrossRef]
- Xie, D.; Lu, Y.; Sun, J.; Gu, C.; Yu, J. Optimal Operation of Network-Connected Combined Heat and Powers for Customer Profit Maximization. Energies 2016, 9, 442. [Google Scholar] [CrossRef]
- Ahmadi, P.; Marc Rosen, A.; Dincer, I. Multi-objective exergy-based optimization of a polygeneration energy system using an evolutionary algorithm. Energy 2012, 46, 21–31. [Google Scholar] [CrossRef]
- Calise, F.; D’Accadia, M.D.; Macaluso, A.; Piacentino, A.; Vanoli, L. Exergetic and exergoeconomic analysis of a novel hybrid solar-geothermal polygeneration system producing energy and water. Energy Convers. Manag. 2016, 115, 200–220. [Google Scholar] [CrossRef]
- Maraver, D.; Uche, J.; Royo, J. Assessment of high temperature organic Rankine cycle engine for polygeneration with MED desalination: A preliminary approach. Energy Convers. Manag. 2012, 53, 108–117. [Google Scholar] [CrossRef]
- Fang, F.; Wei, L.; Liu, J.; Zhang, J.; Hou, G. Complementary configuration and operation of a CCHP-ORC system. Energy 2012, 46, 211–220. [Google Scholar] [CrossRef]
- Gimelli, A.; Muccillo, M. Regulation Problems of Combined Cycle Gas-Steam Turbine Power Plant in a Liberalized Market: Part I—Experimental Investigation and Energetic Analysis. Int. Rev. Modell. Simul. 2016, 9, 1974–9821. [Google Scholar] [CrossRef]
- Gimelli, A.; Muccillo, M. Regulation Problems of Combined Cycle Gas-Steam Turbine Power Plant in a Liberalized Market: Part II—Thermodynamic Analysis. Int. Rev. Modell. Simul. 2016, 9, 348–354. [Google Scholar] [CrossRef]
- Cameretti, M.C.; Muccillo, M. Combined MGT-ORC solar—Hybrid system. PART A: Plant optimization. Energy Procedia 2015, 81, 368–378. [Google Scholar] [CrossRef]
- Cameretti, M.C.; Ferrara, F.; Gimelli, A.; Tuccillo, R. Combined MGT-ORC solar-hybrid system. PART B: Component analysis and prime mover selection. Energy Procedia 2015, 81, 379–389. [Google Scholar] [CrossRef][Green Version]
- Gimelli, A.; Luongo, A.; Muccillo, M. Efficiency and cost optimization of a regenerative Organic Rankine Cycle power plant through the multi-objective approach. Appl. Therm. Eng. 2017, 114, 601–610. [Google Scholar] [CrossRef]
- Gimelli, A.; Muccillo, M.; Sannino, R. Optimal design of modular cogeneration plants for hospital facilities and robustness evaluation of the results. Energy Convers. Manag. 2017, 134, 20–31. [Google Scholar] [CrossRef]
- Gimelli, A.; Muccillo, M.; Sannino, R. Effects of uncertainties on the stability of the results of an optimal sized modular cogeneration plant. Energy Procedia 2017, 126, 369–376. [Google Scholar] [CrossRef]
- Akbari, K.; Nasiri, M.M.; Jolai, F.; Ghaderi, S.F. Optimal investment and unit sizing of distributed energy systems under uncertainty: A robust optimization approach. Energy Build 2014, 85, 275–286. [Google Scholar] [CrossRef]
- Gu, C.-H.; Xie, D.; Sun, G.-B.; Wang, X.-T.; Ai, Q. Optimal operation of combined heat and power system based on forecasted energy prices in real-time markets. Energies 2015, 8, 14330–14345. [Google Scholar] [CrossRef]
- Alvarado, D.C.; Acha, S.; Shah, N.; Markides, C.N. A Technology Selection and Operation (TSO) optimisation model for distributed energy systems: Mathematical formulation and case study. Appl. Energy 2016, 180, 491–503. [Google Scholar] [CrossRef]
- Piacentino, A.; Cardona, F. EABOT—Energetic analysis as a basis for robust optimization of trigeneration systems by linear programming. Energy Convers. Manag. 2008, 49, 3006–3016. [Google Scholar] [CrossRef]
- Bertsimas, D.; Sim, M. The Price of Robustness. Oper. Res. 2004, 52, 35–53. [Google Scholar] [CrossRef]
- Büsing, C.; D’Andreagiovanni, F. New Results about Multi-band Uncertainty in Robust Optimization. In International Symposium on Experimental Algorithms; Klasing, R., Ed.; Springer: Berlin/Heidelberg, Germany, 2012; Volume 7276, ISBN 978-3-642-30849-9. [Google Scholar]
- Yu, X.; Jin, Y.; Tang, K.; Yao, X. Robust optimization over time—A new perspective on dynamic optimization problems. In Proceedings of the IEEE Congress on Evolutionary Computation, Barcelona, Spain, 18–23 July 2010; pp. 1–6. [Google Scholar]
- Ferrara, F.; Gimelli, A.; Luongo, A. Small-scale concentrated solar power (CSP) plant: ORCs comparison for different organic fluids. Energy Procedia 2013, 45, 217–226. [Google Scholar] [CrossRef]
- Tchanche, B.F.; Lambrinos, G.; Frangoudakis, A.; Papadakis, G. Low-grade heat conversion into power using organic Rankine cycles—A review of various applications. Renew. Sustain. Energy Rev. 2011, 15, 3963–3979. [Google Scholar] [CrossRef]
- Schuster, A.; Karellas, S.; Kakaras, E.; Spliethoff, H. Energetic and economic investigation of Organic Rankine Cycle applications. Appl. Therm. Eng. 2009, 29, 1809–1817. [Google Scholar] [CrossRef]
- Özkaraca, O.; Keçebas, P.; Demircan, C.; Keçebas, A. Thermodynamic Optimization of a Geothermal-Based Organic Rankine Cycle System Using an Artificial Bee Colony Algorithm. Energies 2017, 10, 1691. [Google Scholar] [CrossRef]
- Pezzuolo, A.; Benato, A.; Stoppato, A.; Mirandola, A. The ORC-PD: A versatile tool for fluid selection and Organic Rankine Cycle unit design. Energy 2016, 102, 605–620. [Google Scholar] [CrossRef]
- Sayyaadi, H. Multi-objective approach in thermoenvironomic optimization of a benchmark cogeneration system. Appl. Energy 2009, 86, 867–879. [Google Scholar] [CrossRef]
- Wang, J.-J.; Jing, Y.-Y.; Zhang, C.-F. Optimization of capacity and operation for CCHP system by genetic algorithm. Appl. Energy 2010, 87, 1325–1335. [Google Scholar] [CrossRef]
- Gimelli, A.; Sannino, R. A multi-variable multi-objective methodology for experimental data and thermodynamic analysis validation: An application to micro gas turbines. Appl. Therm. Eng. 2018, 134, 501–512. [Google Scholar] [CrossRef]
- Toffolo, A.; Lazzaretto, A. Evolutionary algorithms for multi-objective energetic and economic optimization in thermal system design. Energy 2002, 27, 549–567. [Google Scholar] [CrossRef]
- Das, I.; Dennis, J. Normal boundary intersection, Alternate method for generating Pareto optimal points in multicriteria optimization problems. Available online: http://www.dtic.mil/dtic/tr/fulltext/u2/a320782.pdf (accessed on 18 February 2018).
- Coello, C.A.; Van Veldhuizen, D.A.; Lamont, G.B. Evolutionary Algorithms for Solving Multi-Objective Problems; Springer: New York, NY, USA, 2007. [Google Scholar]
- Lotov, A.V.; Bushenkov, V.A.; Kamenev, G.K. Interactive Decision Maps: Approximation and Visualization of Pareto Frontier; Kluwer Academic Publishers: Boston, MA, USA, 2004. [Google Scholar]
- Ngatchou, P.; Zarei, A.; El-Sharkawi, M.A. Pareto multi-objective optimization. In Proceedings of the 13th International Conference on Intelligent Systems Application to Power Systems, Arlington, VA, USA, 6–10 November 2005; pp. 84–91. [Google Scholar]
- Branke, J.; Deb, K.; Miettinen, K.; Slowinski, R. Multiobjective Optimization. Interactive and Evolutionary Approaches; Springer: Berlin, Germany, 2008; ISBN 978-3-540-88908-3. [Google Scholar]
- Poloni, C.; Giurgevich, A.; Onesti, L.; Pediroda, V. Hybridization of a multi-objective genetic algorithm, a neural network and a classical optimizer for a complex design problem in fluid dynamics. Comput. Methods Appl. Mech. Engrgy 2000, 186, 403–420. [Google Scholar] [CrossRef]
- Poloni, C.; Pediroda, V. GA coupled with computationally expensive simulations: Tools to improve efficiency. In Genetic Algorithms and Evolution Strategies in Engineering and Computer Science; John Wiley and Sons: Chichester, NH, USA, 1997; pp. 267–288. ISBN 0471977101. [Google Scholar]
- Padovan, L.; Pediroda, V.; Poloni, C. Multi objective robust design optimization of airfoils in transonic field (M.O.R.D.O.). In Proceedings of the International Congress on Evolutionary Methods for Design, Optimization and Control with Applications to Industrial Problems EUROGEN 2003, Barcelona, Spain, 15–17 September 2003. [Google Scholar]
- Vélez, F.; Segovia, J.J.; Martín, M.C.; Antolín, G.; Chejne, F.; Quijano, A. A technical, economical and market review of organic Rankine cycles for the conversion of low-grade heat for power generation. Renew. Sustain. Energy Rev. 2012, 16, 4175–4189. [Google Scholar] [CrossRef]
- Wang, J.; Yan, Z.; Wang, M.; Ma, S.; Dai, Y. Thermodynamic analysis and optimization of an (organic Rankine cycle) ORC using low grade heat source. Energy 2013, 49, 356–365. [Google Scholar] [CrossRef]
- Lemmens, S. Cost Engineering Techniques and Their Applicability for Cost Estimation of Organic Rankine Cycle Systems. Energies 2016, 9, 485. [Google Scholar] [CrossRef]
- Wang, J.; Yan, Z.; Wang, M.; Li, M.; Dai, Y. Multi-objective optimization of an organic Rankine cycle (ORC) for low grade waste heat recovery using evolutionary algorithm. Energy Convers. Manag. 2013, 71, 146–158. [Google Scholar] [CrossRef]
© 2018 by the authors. Licensee MDPI, Basel, Switzerland. This article is an open access article distributed under the terms and conditions of the Creative Commons Attribution (CC BY) license (http://creativecommons.org/licenses/by/4.0/).