Abstract
Population ageing will accelerate in the coming decades in China. This ageing may have considerable impact on the economy and energy-related emissions, potentially affecting the global economy and global climate. By using a global computable general equilibrium (CGE) model we explore the impact caused by the population ageing through imposing the expected 2050 age structure on the economy and population size of 2011. Results show that gross domestic product (GDP) of China is reduced by nearly 10% as the ageing reduces consumption, labor supply and investments. However, increasing returns to capital abroad adds support to domestic demand. Ageing process in other countries can double ageing impacts on domestic consumption and encourage only a few production sectors in China. Global energy-related emissions is reduced by 700 Mt carbon dioxide (or about 70% of the 2011 emissions in Japan) due to the population ageing in China.
1. Introduction
In China, population ageing is accelerating. In 2016, the elderly (65 year and above) accounted for 10.5% of total population [1]. In 2050, the share of the elderly is expected to reach 27.6%, or three times the share in 2010 [2]. This rapid ageing has caused considerable concerns about its impact on the economy, environment and society. This study will explore the ageing impact on the economy and emissions in China by using a global computable general equilibrium (CGE) model with a specific module for China.
Previous studies have argued that population ageing can affect an economy both positively and negatively. The final effect may depend on, among others, the influence of the population ageing on marginal propensity to consume of the whole society [3]. According to a review by Sukpaiboonwat et al. [4], population ageing can enhance human capital accumulation and promote economic growth. On the contrary, population ageing can weaken economic growth through several channels such as high public spending on healthcare and reduction in labor supply, consumption, and investments. In this study, while acknowledging human capital accumulation possibly will accompany the ageing process, we explore how a relative increase of the elderly in a population affects economic growth, consumption and energy-related emissions in the case of China.
The impact of ageing in China has been studied from various aspects such as the economic impact of pension reform options in China [5,6]; the ageing impact on economic growth through influence in labor market [7,8,9,10,11,12,13]; the population ageing impact on poverty and income inequality [14,15]; and the ageing impact on household consumption [16,17]. These studies focus on the ageing impact in China while the interplay between China and other countries is largely overlooked. To fill the gap, Yan et al. [18] have discussed the global implications of China’s healthcare reform.
In the literature, the impacts of ageing population in China on economic growth have been studied by both econometric and CGE models. Existing CGE modeling studies have investigated the economic influences of the ageing labor supply and certain population policies in China, and simulated the effect of relevant institutional arrangements on economic growth [10,19,20,21,22]. These studies have mainly focused on available labor supply related to population age structure, labor force participation rates, and labor efficiency, abstracting from age-specific residential consumption accompanying with the population ageing. To distinguish consumption behaviors among different age groups, some studies have used the age of the head of a household to represent the ages of all household members (e.g., [23,24]), where the consumption characteristics of individuals of different ages are usually blurred by the household consumption pattern, particularly the consumption information of children and the elderly [17]. In order to remedy this deficiency, it is necessary to take individual age-specific consumption pattern into account in a synthetical study on the economic impact of population ageing.
To mitigate the impact of ageing, we consider how population ageing affects the whole economy and further emissions. As identified by previous studies mentioned above, population ageing can lead to reduced labor supply, consumption, and affect income inequality. In this study, we will consider how the economy in China is influenced by population ageing via reduced labor supply, consumption, and investments. Basically, we ask the question: To what extent and why would the economy in China differ from the historical record if the age structure of population in 2050 occur in a previous year, e.g., 2011? To answer this question, we isolate the effect of population ageing from other demographic factors like population size and gender distribution. In order to explore the potential ageing impact of other countries on the economy of China, we adopt a global CGE model since such a model takes into account the interactions between the economies of China and other countries including China’s dominant trading partners such as the United States, European Union, and Japan, which are also ageing.
2. Methods
The final purpose of economic activities is providing consumption goods and services for a society. Population ageing refers to the phenomenon of relatively more elderly and less young people of working age in a society. The relative reduction in the working-age population implies shortage of workers to produce consumption goods and services. This may lead to lower economic output than a younger society although they have the same population size.
On the other hand, the whole population including the elderly needs consumption goods and services to satisfy their daily needs. If we assume constant consumption level per capita and age group in a society, total consumption demand is determined by population size by age group and their age-specific consumption patterns. Hence, an ageing society implies that consumption patterns of the elderly play an important role in total consumption.
To identify the economic impact of population ageing, we compare two cases where population ageing is the only difference in the economic system. It is impossible to find such cases in real life since many other factors evolve together with population ageing, such as population size, economic policy, production technology, capital assets, and consumption patterns. Hence, in this study, we first reproduce the economic output and activities in China and other countries in 2011 in a consistent framework described by a global CGE model. The model describes economic activities in both China and other countries, which allows us to examine how the interactions between economies in China and other countries contribute to the impact of population ageing. In the model, we develop a specific module describing the age structure of labor supply in both China and other countries, and the consumption patterns by age group in China. Second, we assume the population ageing in 2050 occurs in the 2011 economy while all other settings such as population size, technology, economic policy, and capital assets are the same as in 2011. In the model, the economic activities would adjust to the ageing, which can reduce labor supply, total consumption, and available investments. Finally, we compare the economic results in 2011 with and without population ageing expected by 2050, and identify the impact of population ageing by answering the question: To what extent and why would the 2011 economy in China differ from the historical record if the age structure of population in 2050 occur in the 2011 economy?
To facilitate understanding of the analysis in this study, we illustrate the key elements in the mechanism by a mathematical description of the aggregate economic activities below. In an open economy, aggregate economic output in a country like China can be expressed by a general production function:
where is output, is capital input, and is labor input. National income includes domestic value added and net income of transboundary factors. When assuming net capital abroad with no labor flows between countries, we have national income:
where is the rate of returns to capital abroad (). The national income is used for domestic consumption and investments, import, and increase in capital assets abroad:
where is domestic consumption, is domestic investments, is imports, and is exports. Labor input is determined by total labor supply, which is related to working-age (15 years old and above) population and their participation rates in economic activities:
where is population size, is labor force participation rate of age group , and is the share of age group in total population.
Meanwhile, the age-specific consumption can be expressed by:
where is per capita consumption of age group .
Population ageing results in changes in the shares of age groups in total population. The changes affect labor supply (Equation (4)) and total consumption (Equation (5)), and further the whole economy. Particularly, the change in labor supply affects marginal returns to both domestic capital and capital assets abroad.
2.1. GRACE Model
This analysis uses a model of Global Responses to Anthropogenic Change in the Environment (GRACE), which is a global CGE model [22,25]. GRACE divides the world into China and seven other regions: the European Union, United States, Japan, Russia, Brazil, India, and the Rest of the World. The economy of a region describes 21 production activities as shown in Table 1.

Table 1.
GRACE sectors and relations to categories of consumer expenditure in Zhu and Wei [17].
In this study we use the static version of the GRACE model, which follows the assumptions of a standard CGE model. Representative producers (or consumers) maximize their profits (or utility). Bilateral trade allows for substitution among regional products. Regional income including the remuneration for productive resources and taxes is allocated proportionally to private and public consumption and regional savings, which together with savings from other regions are invested globally to obtain region-specific rates of return to capital.
Within each region, we assume exogenous supply of labor, capital and natural resources. All the three resources are fully used for production, where capital and natural resources are activity-specific, and labor is mobile across activities to achieve a uniform index of wage rate. Regional labor supply is the sum across age groups of population above 15 years multiplied by age-specific labor force participation rates. More details about the model specification is provided in Wei et al. [22].
2.2. Data
In the GRACE model, the global economic data in 2011 are taken from Global Trade Analysis Project (GTAP) v9 database [26]. Population by age group 2010 and 2050 is taken from the medium fertility scenario of UNPD [2] and age-specific labor force participation rates are taken from OECD Statistics (http://stats.oecd.org). For China, we further distinguish rural and urban population by age group based on the 2010 data from the 6th Population Census in China [27].
The population ageing in China is illustrated by the shares by age group in total population in 2010 and 2050 (Figure 1). According to the medium fertility scenario of UNPD [2], the population peak is in 2028, reaching 1.42 billion. Thereafter, it decreases to 1.35 billion in 2050. We assume that both rural and urban 2050 population have the same age structure as described in the medium fertility scenario of UNPD [2]. As shown in Figure 1, the 2050 population is markedly lower among the young groups below 64 years, particularly the youngest rural groups below 14 years and working age urban groups between 15–49 years. The elderly population above 60 years increases dramatically, particularly the eldest group above 80 years, indicating a deeply ageing society. Population in the elderly groups above 65 years increases from 119 million in 2010 to 371 million in 2050, accounting for 27.6% of total population in 2050 while only 8.9% in 2010.
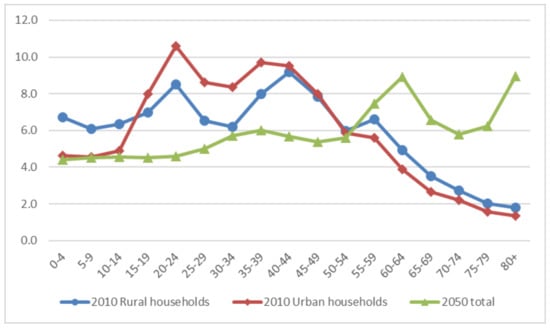
Figure 1.
Shares of age groups in total population in China. Percent. Sources: UNPD [2] and NBSC [27].
Zhu and Wei [17] have identified the consumption patterns by age group derived from the 2010 baseline survey database of Chinese Family Panel Studies (CFPS), a national and comprehensive social follow-up survey project tracking and collecting data at three levels of individuals, households and communities [28]. The consumption by an age group in Zhu and Wei [17] is divided into eight categories: Food, Clothing, Housing, Appliance & HH services, Health, Culture/Education, Transport & Communication, and Others. Table 1 shows the explanation and relations between the sectors in GTAP database and categories in Zhu and Wei [17]. We derive the initial consumption structure by age group in China (Table 2) from the results of Zhu and Wei [17], where 75% of the consumption category “Others” is allocated to the sum of the categories “Health” and “Culture/Education” (or “Services” in the GRACE model) and the remaining 25% is allocated to the category “Transport & Communicaton.”. After the re-allocation of the “Others” category, the shares of “Services” and “Transport & Communicaton” in total consumption are close to that shown in the GTAP database adopted by the GRACE model. The derived consumption structure is quite similar across age groups, implying trivial effect of ageing on consumption structure at such an aggregated sectoral level.
Table 2.
Consumption Structure by Age Groups.
The initial total consumption by age group is calculated as the consumption per capita from Zhu and Wei [17] multiplied by population in the age group. The initial consumption by age group is then adjusted by the RAS method described by Toh [29] to make the sum of consumption across age groups equal to that in the GTAP database (Table 3). Per capita consumption is almost the same across all age groups. Combining with similar consumption structure across age groups, we would not expect that population ageing lead to dramatic changes in total consumption. Notice that the ageing impact may be considerable within an aggregated sector although it is not observable in our simulation.
Table 3.
National Consumption adopted in GRACE.
2.3. Scenarios
A BAU scenario is calibrated around the 2011 economy described by the GTAP database v9. Particularly in the BAU scenario, the labor supply and age specific consumptions are calculated according to the age structure in 2011.
To examine the ageing impact on the economy and emissions in China, we consider four alternative scenarios. In all the alternative scenarios, we assume that per capita consumption by age group in China changes proportional to national income, i.e., if national income deviates from BAU, then per capita consumption shifts up/down at the same rate for all households as national income.
2.3.1. Scenario SN1
Only consider the ageing impact on final demand in China. In SN1, We assume the BAU national income in China is re-allocated between household consumption and savings. Keeping per capita consumption by age group as in BAU, we adjust consumption by age group as in the 2050 age structure for both rural and urban households in China, assuming the same population size as in the base year 2011. Hence, considerable share of total consumption shifts to elderly groups in the 2050 ageing case, where savings in China is reduced by the same amount to meet the increase in household consumption while keeping the initial national income as in BAU. The adjustment implies an external disturbance to the BAU economic system, which would invoke series of responses in the system to achieve another state of equilibrium. Consequently, national income might deviate from the BAU level, resulting in proportional changes in consumption and savings. Hence, only if national income is the same as BAU, the per capita consumption by age groups would stay the same level as the BAU case. If national income is lower than BAU, then the per capita consumption by age will shift down proportionally to national income, lower than the BAU consumption level.
In SN1, we would expect that the increased consumption demand results in higher consumer price level and lower cost of investment in the 2011 economic system. Notice that our simulation cannot distinguish the demand by the elderly from demand by the younger population within a sector, e.g., we do not distinguish clothes for elderly from that for young people.
2.3.2. Scenario SN2
Only consider the reduced labor supply due to the ageing in China, assuming the same population size as the base year 2011. In this scenario, the age structure in 2050 is imposed on the 2011 economy to affect labor supply alone. The labor supply in other countries is assumed the same as BAU. This scenario compared to BAU can indicate how ageing in 2050 could affect the economy and emissions through reduced labor supply.
2.3.3. Scenario SN3
Both ageing impacts on consumption in SN1 and on labor supply in SN2 are considered simultaneously. This scenario illustrates ageing impact on the economy of China when assuming no ageing in other countries.
2.3.4. Scenario SN4
Ageing and reduced labor supply in other countries are considered jointly with the ageing impact in SN3, still assuming the same population size as the base year 2011 for all countries. The age structure in 2050 in other countries is assumed for the 2011 economy to affect labor supply alone. We could not consider the ageing impact on consumption in other countries due to data availability.
3. Results and Discussion
To compare deviations of alternative scenarios from BAU, all prices and monetary values are expressed as real prices [30,31] by using the consumer price index (CPI) as a deflator, meaning in each scenario, all prices are adjusted by a CPI index such that one can pay the same price in alternative scenarios as in BAU to buy all the BAU commodities for domestic final consumption.
3.1. Gross Domestic Product (GDP) and Final Demand in China
Table 4 shows the deviations of simulated GDP and final demand of China in alternative scenarios from BAU. In all the ageing scenarios, China reduces investments and net export to let household consumption increased or fall much less than GDP. In all the ageing scenarios particularly SN2-4, the population ageing results in reduction in labor supply and household consumption, leading to reduced returns to capital in China. As other countries are less affected by the population ageing, capital assets abroad owned by China receives relatively higher returns, which serves as an additional source of income to support domestic consumption and investments. Hence, China can reduce net export to satisfy domestic consumption and investments. Domestic consumption and investments are reduced less than 2% although GDP declines by 9% compared to BAU in Scenarios SN2 and SN3 (Table 4). China reduces export dramatically but import modestly due to the lower purchasing power as indicated by GDP in Scenarios SN2-4.
Table 4.
GDP and final demand in China in 2050, deviations from BAU. Percent.
Not surprisingly, the ageing has little effect on the aggregate economy from the consumption side as illustrated by Scenario SN1. GDP keeps almost the same as in BAU and total consumption increases by 0.2% while investments decrease by 0.1%. The increase in consumption is satisfied by the reduction in net export besides investments. The ageing impact in the scenario SN1 is small compared to other scenarios SN2-4, where GDP is reduced by 9.0% since these scenarios also consider the reduced labor supply by the population ageing.
Compared to SN2-3, the ageing impact in SN4, indicating ageing impact on labor supply in other countries, doubles for consumption and investments, although the net export is reduced and GDP is largely unaffected. This indicates that the ageing in other countries may reduce welfare of households in an ageing China, while the economy in China benefits slightly from the ageing in other countries.
China has enjoyed positive net export for decades and accumulated marked capital assets abroad [32]. In the coming decades, the population ageing in China is faster than in any other regions, implying shortage of labor supply and high labor cost, worsening the terms of trade. Hence, China tends to export less and import more to become a net import country. Our results highlight the tendency and urges the government to take actions to deal with the challenge.
3.2. Consumption by Age Group
The population ageing leads to changes in consumption by age groups (Figure 2). The consumption by age group is almost the same in BAU and SN2, indicating the ageing impact on labor supply alone has a trivial effect on age-specific consumption. The other three scenarios (SN1, SN3 and SN4) have the same pattern of changes in consumption by age group, showing more consumption by the elderly, since the ageing impact on consumption is considered. For both rural and urban households, the consumption of the groups aged 20–24 and 40–44 years is reduced the most among all the groups. In rural households, the youngest groups also reduce their consumption much more than their counterpart urban groups. The increase in consumption in both rural and urban households is strongest for the elderly groups, particularly the eldest groups above 80 years. Although the changes in consumption show the same age pattern, the changes in consumption of urban groups are generally more than double the corresponding change for rural groups, except the youngest groups below 14 years. Both urban and rural households consume the least in SN4, where the ageing impact on labor supply in other countries is additionally considered.
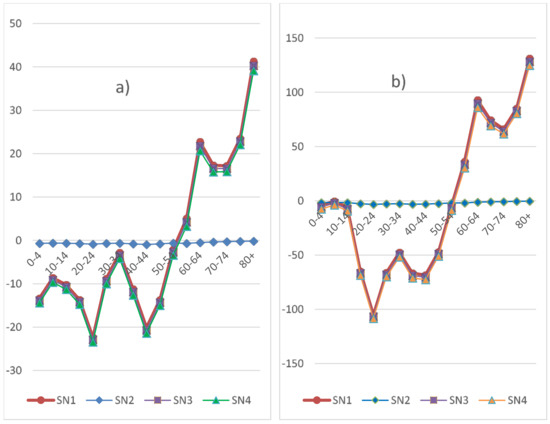
Figure 2.
Consumption by age group, deviations from BAU for rural households (a) and urban households (b). Billion USD2011. Sources: The authors.
3.3. Sectoral Production
Figure 3 shows the deviations of sectoral output from BAU in China. Almost all sectors reduce their activities in response to the population ageing in all alternative scenarios, although the reduction in SN1 is much less than the other three scenarios considering the ageing effect on labor supply. In SN1 where only ageing effect on consumption is considered, Agriculture, food production, and services is encouraged to produce more since the elderly consumes relatively higher shares from these sectors. In other scenarios, the small positive impact is cancelled out by the stronger negative impact of the reduced labor supply. In SN2-3, only Dwellings sector, where labor and capital costs account for over 75% of total output in BAU, is encouraged to provide more services due to, compared to other sectors, relatively lower marginal cost of production induced by reduction in labor supply, while this advantage disappears in SN4 when the population ageing in other countries is considered.
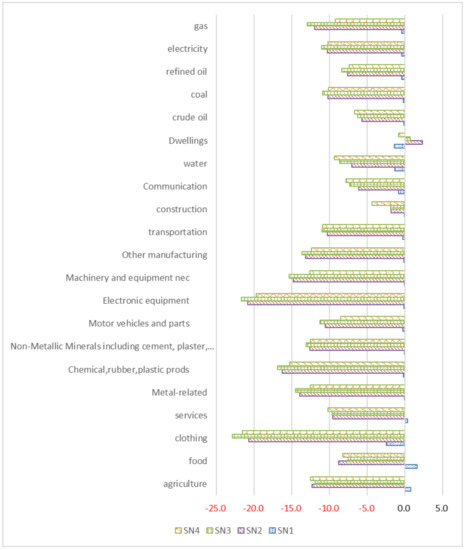
Figure 3.
Sectoral production in China: Deviations from BAU. Percent. Source: The authors. In SN4, all sectors reduce activity levels compared to BAU due to additional negative ageing impact from other countries. The reduction is modified compared to SN3 for all sectors but agriculture, food, services, construction, communication, water supply, dwellings, and crude oil, indicating the ageing impact in other countries on China’s economy via international trade.
3.4. Emissions from Fossil Fuels
The population ageing results in reduction in global carbon dioxides (CO2) from fossil fuels in all the four alternative scenarios (Figure 4). In the case of only ageing effect on consumption patterns considered (SN1), the reduction in global emissions is negligible compared to BAU. When China’s ageing effect on labor supply is included (SN2-3), the reduction in global emissions becomes considerable, ranging from 650 to 700 Mt CO2, equivalent to 65–70 percent of the 2011 emissions in Japan. If the ageing effect of other countries is also considered (SN4), then the reduction in global emissions reaches 1150 Mt CO2, equivalent to the whole 2011 emissions in Japan.
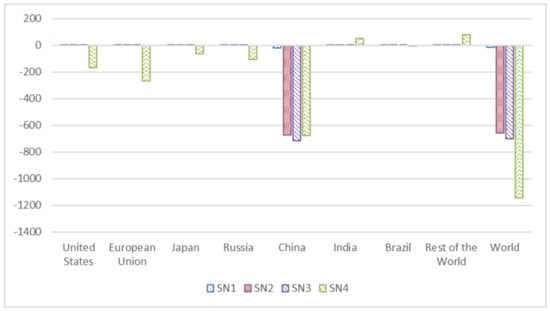
Figure 4.
CO2 emissions from fossil fuels: Deviations from BAU. Mt CO2. Source: The authors.
Almost all the reductions in global emissions are generated by China in scenarios considering only domestic ageing effect in China (SN1-3). Even in the scenario also considering the ageing effect of other countries (SN4), China also contributes 60% to the global emission reduction, indicating heavier impact of population ageing on emissions in China than other countries.
4. Limitations
In this study, we assume that one-unit labor in 2050 is of the same productivity as that in 2011. The assumption will clearly not hold since the human capital is accumulated over time supposing better educated and more skilled labor in China. The longer life expectancy of the elderly may improve human capital transformation. The accumulated human capital may contribute positively to economic growth and alleviate the negative impact on GDP of the population ageing. However, our study shows that ageing in China and the world will require substantial technological change just to compensate for population ageing.
The impact on consumption seems trivial according to our simulation. At the aggregate level, this could be close to the truth only if the social security system is well established to ensure the well-being of the elderly. However, the industry must supply more products and services for the elderly instead of for the youth. The shift always happens within the aggregate sectors and thus we could not observe it from our simulation. The transition may require considerable efforts and face great challenge; particularly considerable investments would be required for building up new infrastructure to satisfy the needs of the elderly population. There is a tradeoff between investment needs and keeping the consumption level of the elderly and other population groups.
The reallocation of more income to the elderly may also discourage workers’ involvement in economic activities. The impact on consumption might become considerable particularly if social security system changes such that the elderly receives less or more benefits.
We also used a static model, where the development path over time is abstracted. While the simplification allows us to isolate the impact of the changes in age structure, we ignore the changes of the external settings of the economy that are relevant to the ageing process, such as population size, human and physical capital assets, policy implementation, technology, and urbanization. The negative ageing impact on the economy can be reduced or even canceled out if these factors are taken into account.
5. Conclusions
Our simulation results indicate that population ageing discourages economic activities if we consider the ageing effect on both consumption and labor supply. GDP is reduced by nearly 10% if age structure in 2050 is assumed for the 2011 economy. However, consumption and investments are reduced by less than 2% due to changes in relative prices and additional income from returns to capital assets abroad owned by Chinese. Returns to domestic capital in China are reduced and prices of investment goods are lowered. On the contrary, prices of consumption goods increase since the economic production is reduced relatively more than the reduced consumption. All these changes imply that the returns to capital assets that Chinese own abroad become relatively high as a potential source of finance for domestic consumption and investments. As concluded by Ma and Zhou [32], China’s foreign assets will become large and keep rising in the coming decade although population becomes old. Hence, the returns to these assets can serve as one important source of income to support domestic consumption.
Global CO2 emissions from fossil fuels are reduced corresponding to around 70% of the 2011 emissions in Japan just by China’s ageing effect mainly via the reduction of labor supply. When the ageing effect of other countries is considered, the reduction in global emissions can be equivalent to the whole 2011 emissions in Japan. Certainly this does not mean that early retirement is an attractive climate policy choice, as the cost of avoided CO2 in terms of GDP loss from labor reduction would be rather high. A direct effect of reduced labor supply is higher wage level, harming the labor intensive industries (e.g., service sector) more than the capital and energy-carbon intensive ones [22]. Hence, it would be wise to promote technological progress and optimize industrial structure for China and the world to compensate for population ageing.
There are several limitations related to the assumptions in this study. For example, we assume human capital accumulation per capita is not affected by the population ageing. We also assume a perfect social security system to keep the consumption level of the elderly. The model we adopted is static, which may overlook the joint effect of ageing with other factors such as technological improvement and urbanization.
Acknowledgments
This study has been funded by the Research Council of Norway (Grant 244119 and 209701). Qin Zhu is also grateful for the financial support from the Major Program of the National Natural Science Foundation of China (Grant 71490735), the Shanghai Pujiang Program (Grant 16PJC019), and the Research Fund of the School of Social Development and Public Policy at Fudan University.
Author Contributions
Taoyuan Wei and Qin Zhu conceived and designed the study; Taoyuan Wei built the model; Taoyuan Wei and Qin Zhu handled the data; Solveig Glomsrød proposed to work on the topic; and all the authors analyzed the results and wrote the article.
Conflicts of Interest
The authors declare no conflict of interest.
References
- National Bureau of Statistics of China (NBSC). Data Bulletin of Sample Survey of 1% Population in China 2015. 2016. Available online: http://www.stats.gov.cn/tjsj/zxfb/201604/t20160420_1346151.html (accessed on 25 October 2017).
- United Nations Population Division (UNPD). World Population Prospects: The 2015 Revision; UNPD: New York, NY, USA, 2015; Available online: http://esa.un.org/unpd/wpp/index.htm (accessed on 29 January 2017).
- Guo, Z.; Liu, L.; Liu, X. Population Aging, Marginal Propensity to Consume, and Economic Growth. Asian Econ. Financ. Rev. 2016, 6, 534–546. [Google Scholar] [CrossRef]
- Sukpaiboonwat, S.; Plyngam, S.; Jaroensathapornkul, J. Does an Ageing Population Diminish or Enhance Economic Growth?: A Survey of Literature. Meiji J. Political Sci. Econ. 2014, 3, 1–10. [Google Scholar]
- Wang, Y.; Xu, D.; Wang, Z.; Zhai, F. Options and impact of China’s pension reform: A computable general equilibrium analysis. J. Comp. Econ. 2004, 32, 105–127. [Google Scholar] [CrossRef]
- Li, S.; Lin, S. Population aging and China’s social security reforms. J. Policy Model. 2016, 38, 65–95. [Google Scholar] [CrossRef]
- Peng, X.; Mai, Y. Population Ageing, Labour Market Reform and Economic Growth in China: A Dynamic General Equilibrium Analysis. 2008. Available online: http://www.gtap.agecon.purdue.edu/resources/download/3856.pdf (accessed on 20 February 2018).
- Cai, F.; Lu, Y. Population change and resulting slowdown in potential GDP growth in China. China World Econ. 2013, 21, 1–14. [Google Scholar] [CrossRef]
- Du, Y.; Yang, C. Demographic transition and labour market changes: Implications for economic development in China. J. Econ. Surv. 2014, 28, 617–635. [Google Scholar] [CrossRef]
- Zhu, Q.; Wei, T. Implications of population aging for labor supply and economic growth in China: A CGE Analysis. Popul. Res. 2017, 41, 8–21. [Google Scholar]
- Peng, X. Population ageing, human capital accumulation and economic growth in China: An applied general equilibrium analysis. Asian Popul. Stud. 2005, 1, 169–188. [Google Scholar] [CrossRef]
- Peng, X. Demographic shift, population ageing and economic growth in China: A computable general equilibrium analysis. Pac. Econ. Rev. 2008, 13, 680–697. [Google Scholar] [CrossRef]
- Nankervis, A.; Prikshat, V. Interesting times—The challenges of China’s demographic deficit. Labour Ind. 2015, 25, 265–277. [Google Scholar] [CrossRef]
- Wang, X.; Chen, K.Z.; Robinson, S.; Huang, Z. Will China’s demographic transition exacerbate its income inequality?–CGE modeling with top-down microsimulation. J. Asia Pac. Econ. 2017, 22, 227–252. [Google Scholar] [CrossRef]
- Zhong, H. The impact of population aging on income inequality in developing countries: Evidence from rural China. China Econ. Rev. 2011, 22, 98–107. [Google Scholar] [CrossRef]
- Li, M.; Shen, K. Population aging and housing consumption: A nonlinear relationship in China. China World Econ. 2013, 21, 60–77. [Google Scholar] [CrossRef]
- Zhu, Q.; Wei, T. Future Impacts of Population Aging and Urbanization on Household Consumption in China. Popul. Res. 2016, 40, 62–75. [Google Scholar]
- Yan, F.; Tang, S.; Zhang, J. Global implications of China’s healthcare reform. Int. J. Health Plan. Manag. 2016, 31, 25–35. [Google Scholar] [CrossRef] [PubMed]
- Peng, X. Macroeconomic Consequences of Population Ageing in China: A Computable General Equilibrium Analysis. Popul. Res. 2006, 30, 12–22. [Google Scholar]
- Ni, H.; Li, S.; He, J. Analysis of the Choice of Population Policy by CGE Model. Popul. Dev. 2013, 19, 46–54. [Google Scholar]
- Huang, Z.; Wang, X.; Chen, K.; Chen, J. China’s Economic Growth in the Context of Demographic Transition: Simulation with Dynamic Computable General Equilibrium Model. J. Zhejiang Univ. Humanit. Soc. Sci. 2014, 44, 168–183. [Google Scholar]
- Wei, T.; Zhu, Q.; Glomsrød, S. How Will Demographic Characteristics of the Labor Force Matter for the Global Economy and Carbon Dioxide Emissions? Ecol. Econ. 2018, 147, 197–207. [Google Scholar] [CrossRef]
- O’Neill, B.; Chen, B. Demographic Determinants of Household Energy use in the United States. Popul. Dev. Rev. 2002, 28, 53–88. [Google Scholar]
- Dalton, M.; O’Neill, B.; Prskawetz, A.; Jiang, L.; Pitkin, J. Population Aging and Future Carbon Emissions in the United States. Energy Econ. 2008, 30, 642–675. [Google Scholar] [CrossRef]
- Aaheim, A.; Rive, N. A Model for Global Responses to Anthropogenic Changes in the Environment (GRACE); Report; CICERO: Oslo, Norway, 2005; Volume 5. [Google Scholar]
- Aguiar, A.; Narayanan, B.; McDougall, R. An overview of the GTAP 9 data base. J. Glob. Econ. Anal. 2016, 1, 181–208. [Google Scholar] [CrossRef]
- National Bureau of Statistics of China (NBSC). Tabulation on the 2010 Population Census of the People’s Republic of China. 2012. Available online: http://www.stats.gov.cn/tjsj/pcsj/rkpc/6rp/indexch.htm (accessed on 10 October 2017).
- Xie, Y. China Family Panel Studies (2010) User’s Manual (中国家庭追踪调查 (2010) 用户手册). 2012. Available online: http://www.isss.edu.cn/cfps (accessed on 9 October 2017).
- Toh, M.-H. The RAS Approach in Updating Input–Output Matrices: An Instrumental Variable Interpretation and Analysis of Structural Change. Econ. Syst. Res. 1998, 10, 63–78. [Google Scholar] [CrossRef]
- Wei, T. Comparing approaches to valuing sectoral net investments. Resour. Energy Econ. 2013, 35, 316–328. [Google Scholar] [CrossRef]
- Asheim, G.B.; Wei, T. Sectoral Income. Environ. Resour. Econ. 2009, 42, 65–87. [Google Scholar] [CrossRef]
- Ma, G.; Zhou, H. China’s large and rising net foreign asset position. China World Econ. 2009, 17, 1–21. [Google Scholar] [CrossRef]
© 2018 by the authors. Licensee MDPI, Basel, Switzerland. This article is an open access article distributed under the terms and conditions of the Creative Commons Attribution (CC BY) license (http://creativecommons.org/licenses/by/4.0/).