1. Introduction
Electrical insulator plays a vital role in the electrical transmission and distribution system [
1]. Outdoor insulators are monitored and evaluated to know the aging performance of insulators thereby assuring continuous delivery of power. High voltage polymeric insulators are preferred nowadays due to its high hydrophobic surface, faster hydrophobicity recovery, and lower weight over the glass and ceramic insulators [
2]. Hydrophobicity reduces with aging, temperature, and pollution deposits on the surface [
3,
4,
5], which leads to a flow of more leakage current, arcing on the surface, and flashover phenomena [
6,
7,
8]. Therefore, periodic hydrophobicity measurement is essential to protect and safely operate the transmission lines.
Various methods are available in the literature to evaluate the hydrophobic condition of insulators [
9,
10]. Contact angle, surface tension, and spray method are the three widely used methods according to the standard IEC 62073 [
11]. In the contact angle method, the contact angle between the water droplet and the insulator surface is measured, which is a direct marker of hydrophobicity. Surface tension of the water droplets over the insulator is measured to evaluate its hydrophobicity condition. These two methods demand sophisticated apparatus and laboratory conditions making it not suitable for field studies.
In the spray method, water is sprayed on the insulator surface, and the dispersion of water droplets is analyzed. It makes this method simple, with low hardware requirements. It is a widely adopted method for both laboratory and field studies. Dispersion of water droplets is analyzed using a digital image processing method [
12]. It involves pre-processing, feature extraction and classification. Pre-processing prepares and enhances the digital image to show the water dispersion pattern in a better way. In the literature, histogram equalization and top-hat filters [
13,
14] are used to process the image to compensate for ambient light and to remove noise respectively. Features such as fractal dimension, shape factor of the droplet, area ratio, haralick texture descriptors and static contact angle [
15,
16,
17] are extracted from the digital image. As these features are an indirect marker of hydrophobicity, the literature shows that researchers have extracted more features from the image to increase accuracy. It leads to the extraction of dependent and highly correlated features, which increases the computational overhead and coveys no new information. Thus, selection of optimal and independent features is vital and a challenging problem.
Hydrophobicity classification employs both classical methods and learning techniques. Classical methods include linear discriminant analysis, support vectors, decision trees and nearest neighborhood based classifiers which are designed based on the variations in features [
18,
19,
20,
21]. Neural networks (NN) and fuzzy clustering are widely adopted intelligent techniques. NN has a learning capability to learn the correlation between the features and its corresponding hydrophobicity class. However, the unbounded nature of NN demands tightly bounded features for stable operation. As the images are acquired from various locations, variations in the ambient environment are inevitable. This causes features to have a broader range of variations, which causes NN to be unstable. On the other hand, fuzzy systems are robust and produce stable outputs. However, they require manual tuning of rules, which demands expert’s knowledge.
This problem can be overcome by employing ANFIS for hydrophobicity classification. ANFIS combines the learning capability of NN and the efficient knowledge representation potential of a Fuzzy Inference System (FIS). NN is used to learn the nature of feature variation across the different class of insulators. This learning is imposed into the FIS in the form of the rule base, and parameters are tuned in accordance. Thus, the robustness of FIS in combination with the learning nature of neural networks makes the ANFIS the optimal tool for hydrophobicity classification [
22].
To the best of our knowledge, this is a first attempt to use ANFIS to classify hydrophobicity. Hydrophobicity of the insulator is evaluated in terms of its water retention capability. The experimental setup to evaluate water retention capability is shown in
Figure 1. Initially, the distilled water is sprayed on the surface of insulator uniformly. Images are captured after the spraying is over (first frame). Acquired images are pre-processed to extract the region of interest and to compensate for ambient disturbances. First and second order statistical features are extracted from the pre-processed image [
23]. A trained ANFIS classifier is used to classify the hydrophobicity based upon the features. The ANFIS represents a class of hydrophobicity as numeric. This numeric value is quantized to a particular class of hydrophobicity in post-processing.
Significant contribution of the research article is as follows: (i) Pre-design stage feature reduction using PCA. (ii) Design and analysis of various ANFIS classifiers. (iii) Post-design stage feature reduction using accumulation effect. (iv) Hydrophobicity classification for laboratory and field operation insulator. (v) Field deployment using GUI to facilitate the operator.
The research article is organized as follows:
Section 2 describes the experimental procedure and image acquisition techniques,
Section 3 describes the design of various ANFIS classifier and feature reduction techniques,
Section 4 describes the performance evaluation and results for laboratory and field specimens and
Section 5 concludes the work with a summary and future directions.
2. Experimental Setup
In this experimental setup, a camera was employed to capture the image of the polymer insulator. Insulator material considered in this study was grey of type HTVSIR (High-Temperature Vulcanized Silicone Rubber). Samples were cut off from the new polymer insulator. A solution prepared with the different concentration of isopropyl alcohol mixed with distilled water [
24] was sprayed on the surface of a new polymer insulator. It closely replicates the aging behavior of the polymeric insulator deployed in the field. As the polymer ages, its hydrophobic property degrades, and the same phenomena occur with the fresh polymer insulator when the concentration of isopropyl alcohol is increased.
Experiments were carried out as per the Swedish Transmission Research Institute (STRI) guide [
25] as follows. In the proposed work, a common spray bottle was chosen to produce a fine mist of water. A square surface of the insulator with a side 8 cm was chosen, which gives the test area of 64 cm
2. About 20 sprays in the span of 20 s were sprayed over the insulator surface. After 5 s, the images were acquired, and features were extracted for hydrophobicity classification.
The camera was mounted vertically over the insulator at a distance of 25 ± 2 cm and set on normal mode. This set up was maintained for acquisition of all images in the laboratory and field test. It enables the capture of images with clear visibility of the insulator surface with solution droplets with uniform scaling.
Image Acquisition and Pre-Processing
The spraying solutions were prepared with different levels of concentration ranging from 0% to 100% for every 10% step of isopropyl alcohol. This gives about 10 different classes of solution concentration. A minimum of 30 images from each class of concentration were acquired, and a total of 681 images were captured. These images were converted to grey scale, which enables the solution droplets to be more visible over the insulator surface. Then, the images were cropped to select the region of interest (ROI) and to maintain uniform image size.
Figure 2 shows the grey converted and cropped image for 0% to 100% volume of alcohol with distilled water solution and its corresponding HC (Hydrophobicity Class). It was observed that the solution droplets are more distinct for the low level of alcohol concentration and that they get dispersed at a higher concentration. This indicates that the solution sprayed acts as an excellent marker for hydrophobicity classification.
An experienced inspector is able to classify the wettability of the insulator by comparing the reference image with the acquired image as in
Figure 2 and description provided in the STRI guide as described in
Table 1. Lack of experienced inspectors and the need for periodic inspection of insulators demands an automation tool to determine the hydrophobicity class. The uncertain nature in the dispersion of solution demands intelligent techniques to extract inferences about the insulator quality. On the other hand, the features extracted from images can provide valuable information and need machine learning techniques to understand variations in features across different class of hydrophobicity. This makes ANFIS to be ideal for hydrophobicity classification using image processing technique.
3. Design of ANFIS Classifier
The design of the ANFIS classifier involves various processes as shown in
Figure 3. Images are acquired and pre-processed as explained in the previous section. In this section, other design steps are explained briefly.
3.1. Extraction of Feature
A total of ten, first and second order statistical features were extracted from the grey scale image. First order features provide inferences about the characteristics of individual pixels cumulatively. Average intensity, standard deviation, variance, skewness, and kurtosis are the first order features considered in this study. Second order features like entropy, homogeneity, contrast, correlation, and energy were also extracted. These features provide inferences about the variations of pixels in contrast with its neighborhood, which is vital for determining the distribution of droplets.
3.2. Pre-Stage Feature Reduction Using PCA
From the features mentioned, best features are selected by principal component analysis (PCA). The best features are characterized by the quality of inference and the correlation across the other features. PCA is a widely used technique to reduce the dimensionality of the feature set by maintaining the correlation structure [
26]. This enables the classifier to classify hydrophobicity with reduced features and minimizing computational overheads.
Eigen analysis of the correlation matrix has been carried out as described in
Table 2. The proportional Eigen value demonstrates the importance of a particular principal component (PC). It also describes the proportion of the feature data set covered by the corresponding PC. For instance, the PC1 and PC2 covers up 60.06% and 17.29% of data set, respectively. This makes the first two principal components (PC1 and PC2) account for 0.7735 (77.35%) of total data set as described by cumulative Eigen values in
Table 2. Therefore, Eigen vectors corresponding to the first two PC’s are considered as described in
Table 3 and other PC’s are made obsolete because of being inferior and interdependencies. Best features were selected based on a magnitude threshold as highlighted in
Table 3. A scree plot shown in
Figure 4 illustrates the distribution of Eigen values for the feature set used in this study. Thus, the use of PCA reduces the features required for hydrophobicity classification from 10 to six features.
3.3. Training of the ANFIS Classifier
A total of 681 images under the various classes of hydrophobicity were used in this study. Six best features were extracted for these images, and the corresponding hydrophobicity class was assigned to them. A total of 591 images were used to generate features for training the ANFIS classifier, and 90 images were considered for the testing phase. ANFIS is a hybridization of the neural and fuzzy system. Takagi-Sugeno type fuzzy inference system (FIS) is used in ANFIS [
27,
28]. ANFIS uses the artificial neural network (ANN) to learn knowledge from the feature set, and the learning is imposed into the FIS. It is composed of five layers, as shown in
Figure 5 and the operation of each layer is described in
Table 4. Out of five layers, two layers namely ‘Input Layer’ and ‘Defuzzification Layer’ were considered as an adaptive layer. The parameters of these adaptive layers are tuned using the ANN to represent the knowledge learned from the training dataset [
29].
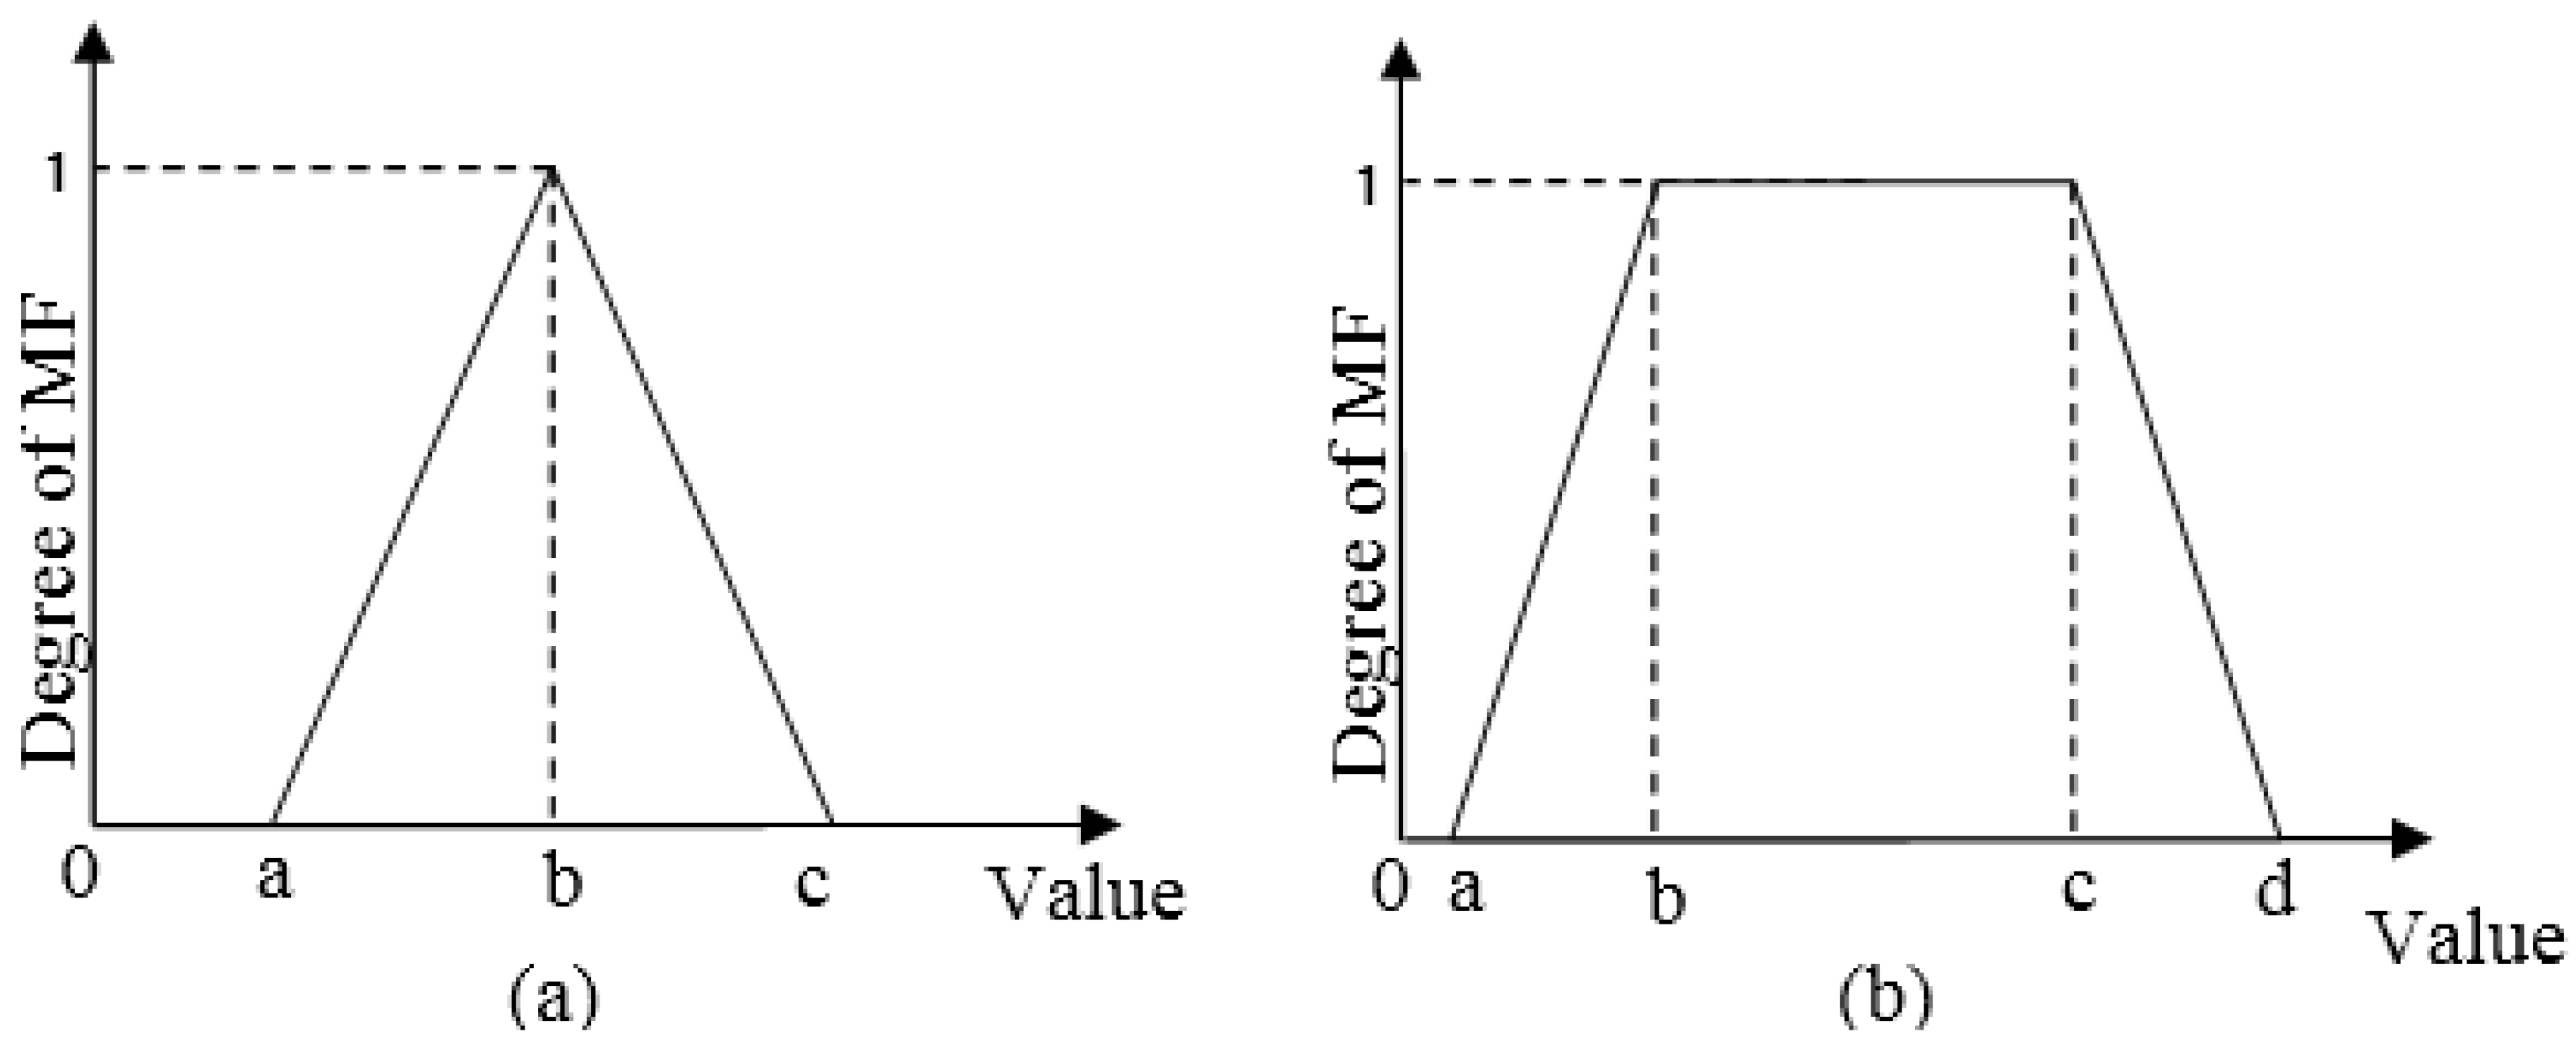
The input layer corresponds to the fuzzification operation of the inputs. It is responsible for the assignment of degree of membership to the crisp value of features, which is a critical parameter in classification problems. From the literature, it is observed that triangular and trapezoidal membership functions (MF) are widely deployed for classification problems [
30]. Triangular membership function has a peak membership for a single value of the variable, and the degree of membership degrades as the value of variable deviates. The degradation in membership function can be controlled by three tunable parameters (a, b, c), which determine the shape of the membership function as shown in
Figure 6a. These parameters are tuned by the learning algorithm based on the variations of the features.
Like triangular membership functions, trapezoidal MF also has a linearly degrading membership, and they also have a stable membership degree to a certain range of features. The stable range is determined by the parameters (b, c) and the degradation in membership is determined by (a, d) parameters as in
Figure 6b. This makes the triangular MF an ideal tool for classifier with the quantized class of hydrophobicity. Thus, in the proposed work, triangular and trapezoidal membership functions are considered for designing ANFIS classifier.
The defuzzification layer is responsible for the integration of all the fired rules and conversion of fuzzy value to a crisp value corresponding to hydrophobicity class. Two types of defuzzification functions namely constant and linear functions were investigated in this work as described in
Table 5. The constant function produces a constant value when the corresponding rule is fired whereas the linear function evaluates the linear combination of all the input membership values to produce a crisp output. The design procedure involves preparation and loading of a feature set, selection of ANFIS structure (type and number of MF’s), selection of training algorithms, and execution of the training algorithm with stopping criteria as illustrated in
Figure 7.
The hybrid learning algorithm [
31] was employed for training the ANFIS classifier. It is a combination of back propagation algorithm (BPA) and the least-squares method. The least-squares method uses forward propagation error to estimate initial parameters of layer-1 and 4 (as in
Table 4). BPA back-propagates the error to optimize the parameters, which minimize the mean square error (MSE) between the actual and predicted class. Thus, the hybrid learning algorithm can train in a lesser number of iterations (epochs) as compared to BPA alone as shown in
Figure 8.
It was observed that an initial guess of parameters brings the MSE to 0.72 in hybrid learning whereas 4.5 MSE is observed in BPA. For 40 epochs, the hybrid learning algorithm tends to converge towards optimal parameters reducing the MSE to 0.28. BPA shows a minimal descending MSE from 4.5 to 4.17 for the same 40 epochs.
3.4. Testing of ANFIS Classifier
The performance of the proposed hydrophobic classifier was evaluated using the training dataset and testing dataset as illustrated in
Figure 9.
The outputs of the classifier were designated to be integers ranging from 1 to 7 indicating the hydrophobicity class. Though the outputs were quantized, the ANFIS classifier produces decimal points as output (as in
Figure 9), and it has to be rounded off to the nearest class of hydrophobicity. It was observed that the classifier is accurate at a lower class of hydrophobicity and a significant perturbation is observed across class 5 and 6 for the training dataset. Similar perturbation was also observed in a testing dataset with minimal loss of accuracy at lower classes.
3.5. Post-Stage Feature Reduction Using the Accumulation Effect
The accumulation effect on classification accuracy is evaluated to investigate further feature reduction. Classification accuracy was evaluated using a confusion matrix. The classification accuracy was calculated from the ratio of a number of correct prediction (
NC), which is expressed in Equation (1) to the total number of samples (
NS). It is expressed in terms of percentage from the confusion matrix as in Equation (2).
ANFIS classifiers are designed by introducing the features in the order as illustrated in
Table 3. Initially, the most robust feature (Average Intensity with
PC of 0.5761) alone is used as input for hydrophobicity classifier and its accuracy was evaluated using a confusion matrix. Subsequently, the strong feature was added cumulatively to design classifiers. This results in six different input combination with increasing accumulated features (n
f). This type of feature accumulation was implemented on all the four types of classifiers as described in
Table 5. It leads to a total of 24 classifiers (6 × 4) whose classification accuracies are evaluated for training and testing feature sets as illustrated in
Figure 10a,b respectively.
It was observed that improvement in classification accuracy becomes insignificantly small with the addition of 5th and 6th features (standard deviation and contrast). The classification accuracy saturates beyond using four features. This implies a possibility of a reduction in features to four without compromising classification accuracy. This reduction in features reduces the computational requirements and processing time. It also facilitates removal of ambiguous features and selection of features in coherence to improve the classification accuracy.
4. Results and Discussion
The proposed ANFIS classifier was used to analyze both laboratory and field specimens to identify its hydrophobicity class. The performance of the classifier was analyzed using standard metrics such as Confusion Matrix, Mean Absolute Error (MAE), Mean Absolute Percentage Error (MAPE), Root Mean Square (RMS) value and R
2 (Regression) [
32,
33,
34]. These error metrics were calculated between the predicted class (
) of the ANFIS classifier and the actual class (
) designated by the standards/expert inspector. The description and formulae for calculating these measures are given in
Table 6.
4.1. Laboratory Test
In the laboratory, a total of 591 images were used as training data, and 90 images were used as testing data. Classification error was analyzed using a confusion matrix for all the types of input MF’s (triangular and trapezoidal) and output functions (constant and linear) considered in this study. The distribution of classes in the confusion matrix for training and testing data of this ANFIS classifier is also shown in
Table 7.
Table 8 illustrates the classification accuracy for all the ANFIS designs, and it is observed that ANFIS with triangular MF and linear function (Classifier-2) exhibits a higher degree of accuracy. Further, the performance of the designed ANFIS classifier was also evaluated in terms of standard metrics as illustrated in
Table 8. The obtained results illustrate a minimal error in classification for Classifier-2. The regression (R) is also approaching one indicating a minimal deviation between the predicted and actual class.
4.2. Field Test
The performance of the proposed classifier was also evaluated in insulators installed in the live transmission lines. The test is carried out in ‘Orathanadu Taluk’ of Thanjavur district, Tamil Nadu, India. Three different sites in the same region with outdoor polymeric insulators operating for one year (Site-1) and two years (Site-2 and 3) were considered for this study. Each pole in the test sites has three polymeric insulators installed, and one of the three insulators were taken for hydrophobicity analysis.
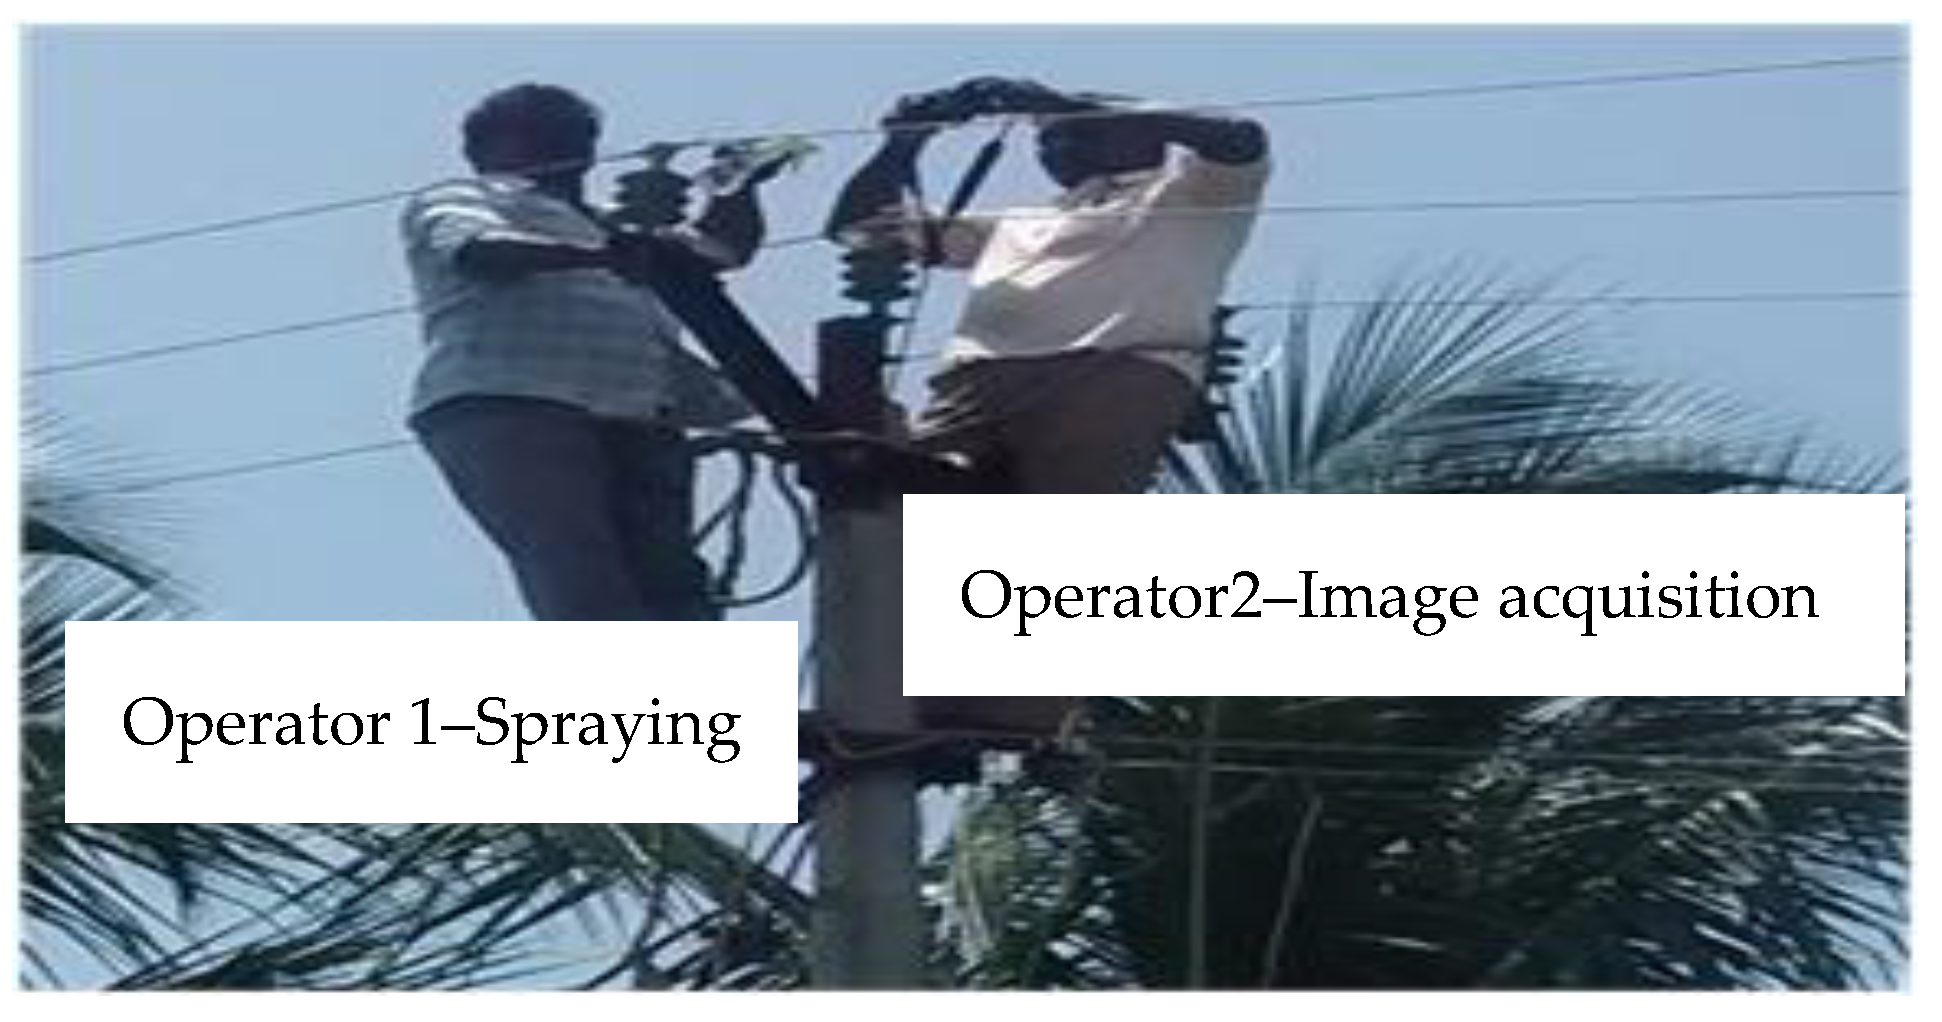
Field tests were carried out during the scheduled maintenance shut down. Two field operators were made to climb up the poles near the insulator. One operator was assigned to spraying the distilled water and other to capture the image using a digital camera as illustrated in
Figure 11. Distilled water was sprayed on the surface of insulator using a sprayer and recorded by the digital camera. Images were captured after the spraying process under three trials. For analysis, five images were captured for each trial providing 15 images for each test site. In these frames, only the top layer of insulator was considered for hydrophobicity analysis. As these images were acquired in an outdoor environment, they were pre-processed with histogram equalization [
20] to reduce the variations in ambient light illumination.
Classifier-2, which has higher classification accuracy, was used to classify the hydrophobicity class of these field insulators. After the spraying was done by Operator-1, images of the insulator surface were acquired by Operator-2. These images were given to an experienced inspector and the actual class of hydrophobicity was determined by visual inspection. The field insulators were categorized with hydrophobicity Class 2, 3 and 3 for the samples collected at Sites-1, 2 and 3 respectively. The predicted hydrophobicity classes of these insulators are illustrated in
Figure 12. It was observed that the proposed system can classify the field samples accurately with minimal variance and reliable accuracy.
4.3. Design of GUI for Field Deployment
A GUI was designed using MATLAB Graphical User Interface Development Environment (GUIDE) to facilitate the use of the proposed classifier for field testing of insulators as illustrated in
Figure 13. It provides easy access to the functionalities used in the proposed system to the operator. The image of the insulator was acquired either from the laboratory test condition or field test. The image can be loaded by the ‘Load Button’ available in the GUI. This ‘Load Image’ button opens a browser window to select the corresponding image file. Once the image file is successfully loaded, the image is displayed in the ‘Original Image’ section. It also provides the operator with a facility to crop the region of interest (ROI) which can be used for analysis of hydrophobicity.
The operator can confirm the ROI by using the ‘Crop Image’ button. The cropped image is displayed in the ‘Cropped Image’ section for confirmation with the operator. The operator can also crop the image again, in case of improper selection of ROI. Once the cropped image is finalized, the class of hydrophobicity is determined using the ‘Classify’ button. The ‘Classify’ button is used to activate the feature extraction process and evaluation of ANFIS classifier using these extracted features. The ‘output’ section provides the class of hydrophobicity of the insulator and also remarks about the condition of the insulator. Thus, the GUI facilities provide easy access to the operator without any need to learn programme using the proposed ANFIS classifier.
5. Conclusions
This work proposes a design of intelligent ANFIS to classify hydrophobicity of polymer insulators. Dispersion of water droplets was used as a marker for classification and was evaluated using features extracted from its image. A total of 10 statistical image features were used in this study, and the best features were investigated using PCA. The six best features were selected before the design of the ANFIS classifier. The accumulation effect on classification accuracy was evaluated after designing the ANFIS classifier. This reduces the number of features required for classification to be four, from the six best features identified by PCA.
The four best features namely average intensity, correlation, skewness and homogeneity, were found to be optimal for the proposed work. Triangular and trapezoidal MF’s with linear and constant output functions were used for the ANFIS classifier, and their performances were evaluated. Experimental results illustrate a reliable classification accuracy of 94.85% when triangular MF’s and linear functions are employed in ANFIS design. Field tests were also carried out in three identified, different sites. Field insulators were to be cleaned before acquiring images and required additional pre-processing to reduce the illumination effects. Field results also exhibit 91.12%, which is a satisfactory level of classification accuracy. A GUI was designed and deployed to facilitate the operators to use the proposed hydrophobicity classifier.
The proposed procedure can be applied for applications demanding image based classification. Applications such as thermographic inspection of electrical installations, flash over characterization in contaminated insulators, and electrical fault detection using thermal images can be carried out using the proposed technique. Use of unmanned aerial vehicles to acquire the images and classify hydrophobicity online by the proposed classifier can be investigated in future. Incorporation of environmental and pollution conditions on the surface of polymeric insulators in this classifier can make it robust and can improve classification accuracy.


