Dynamic Analysis of a Permanent Magnet DC Motor Using a Buck Converter Controlled by ZAD-FPIC


Abstract
1. Introduction
2. Materials and Methods
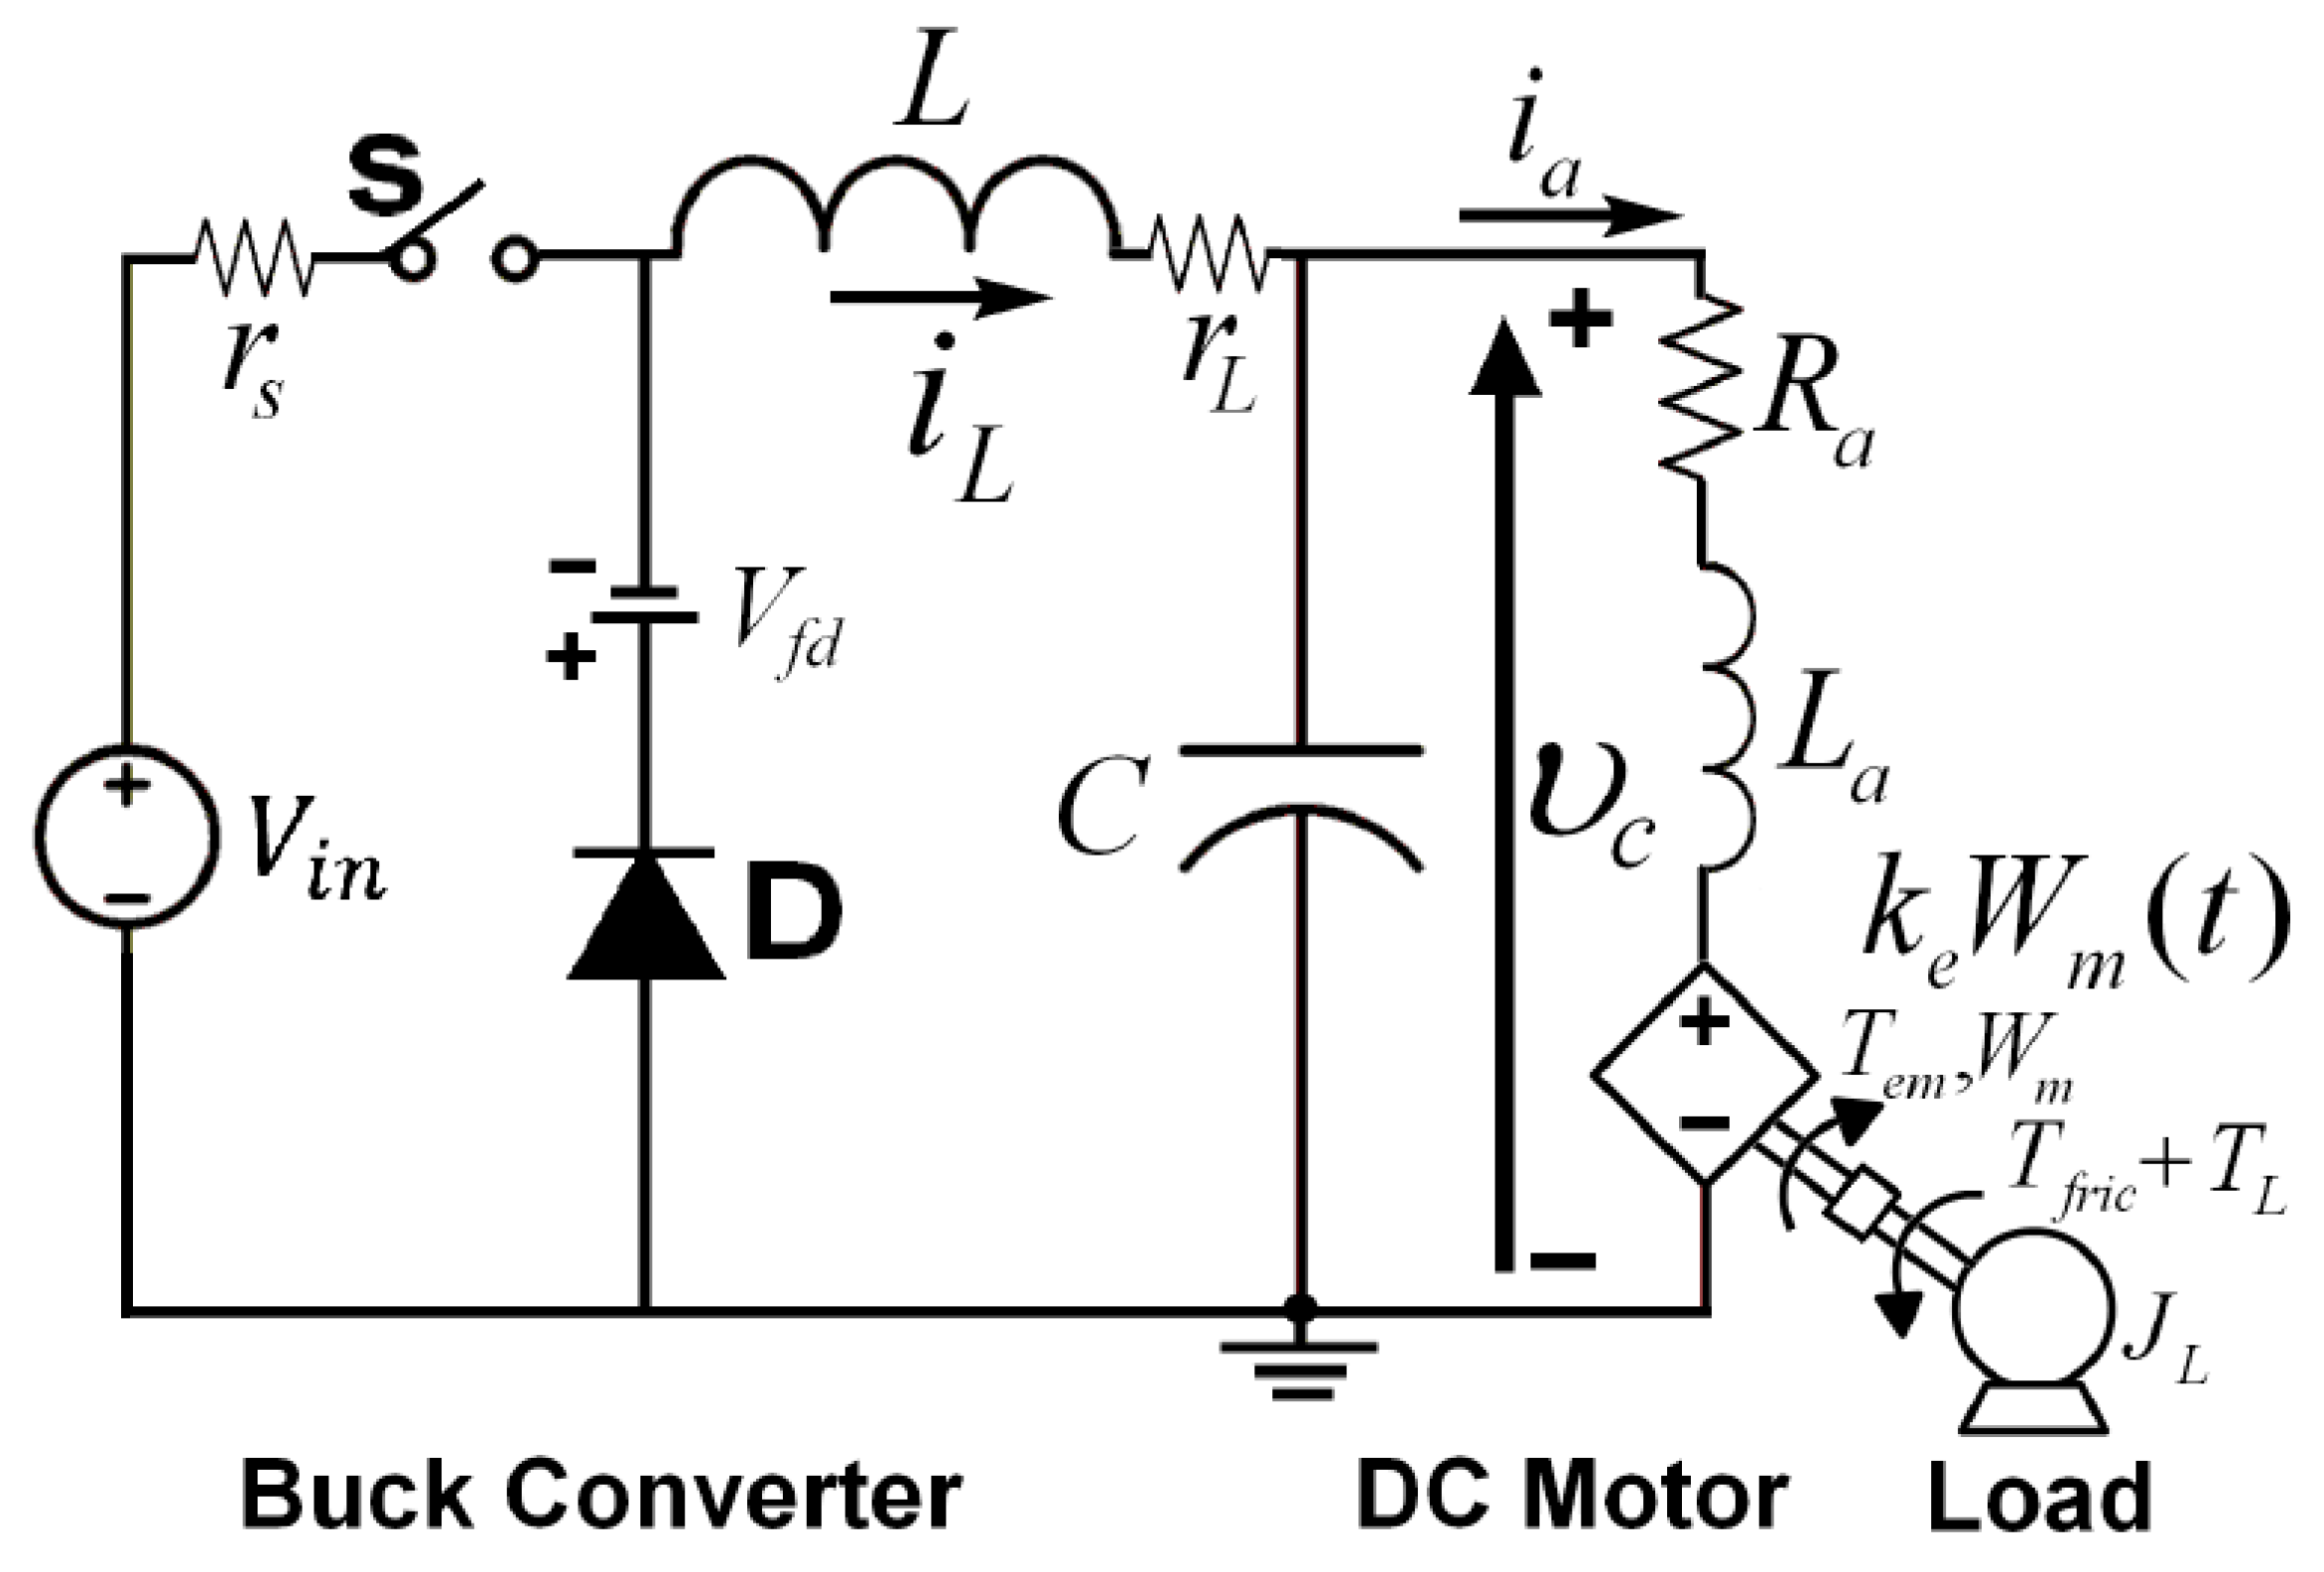
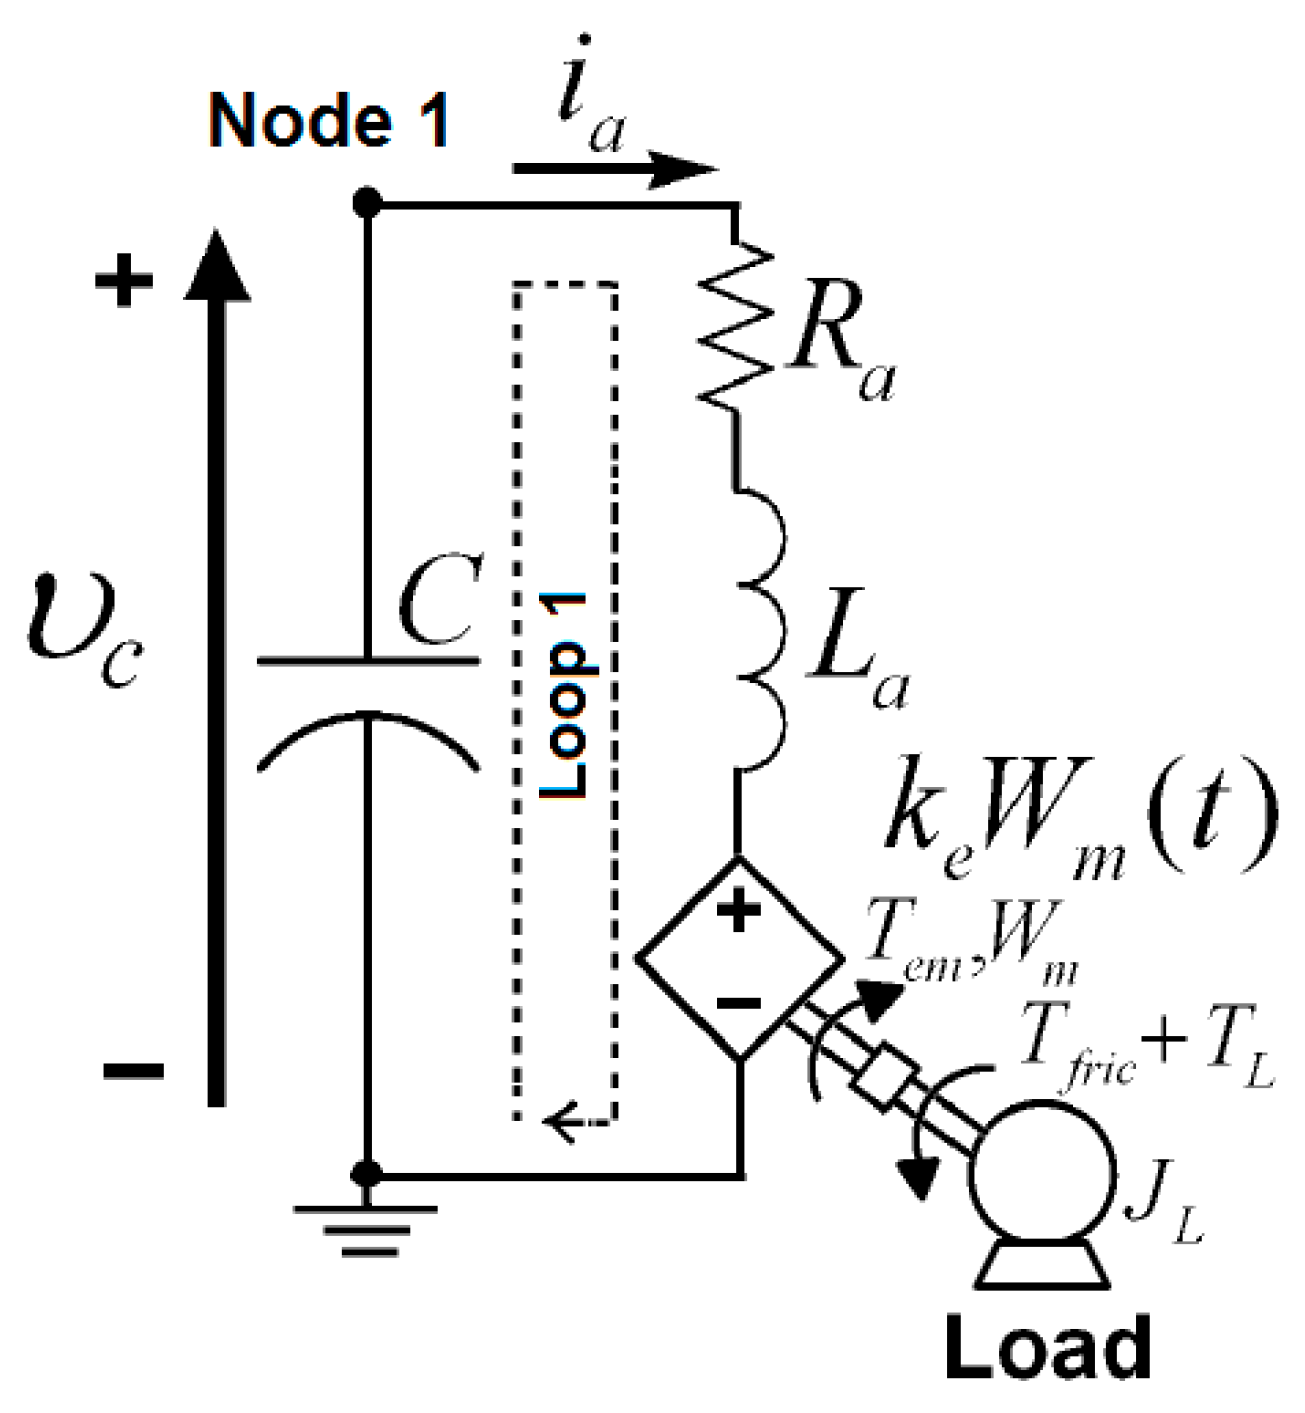
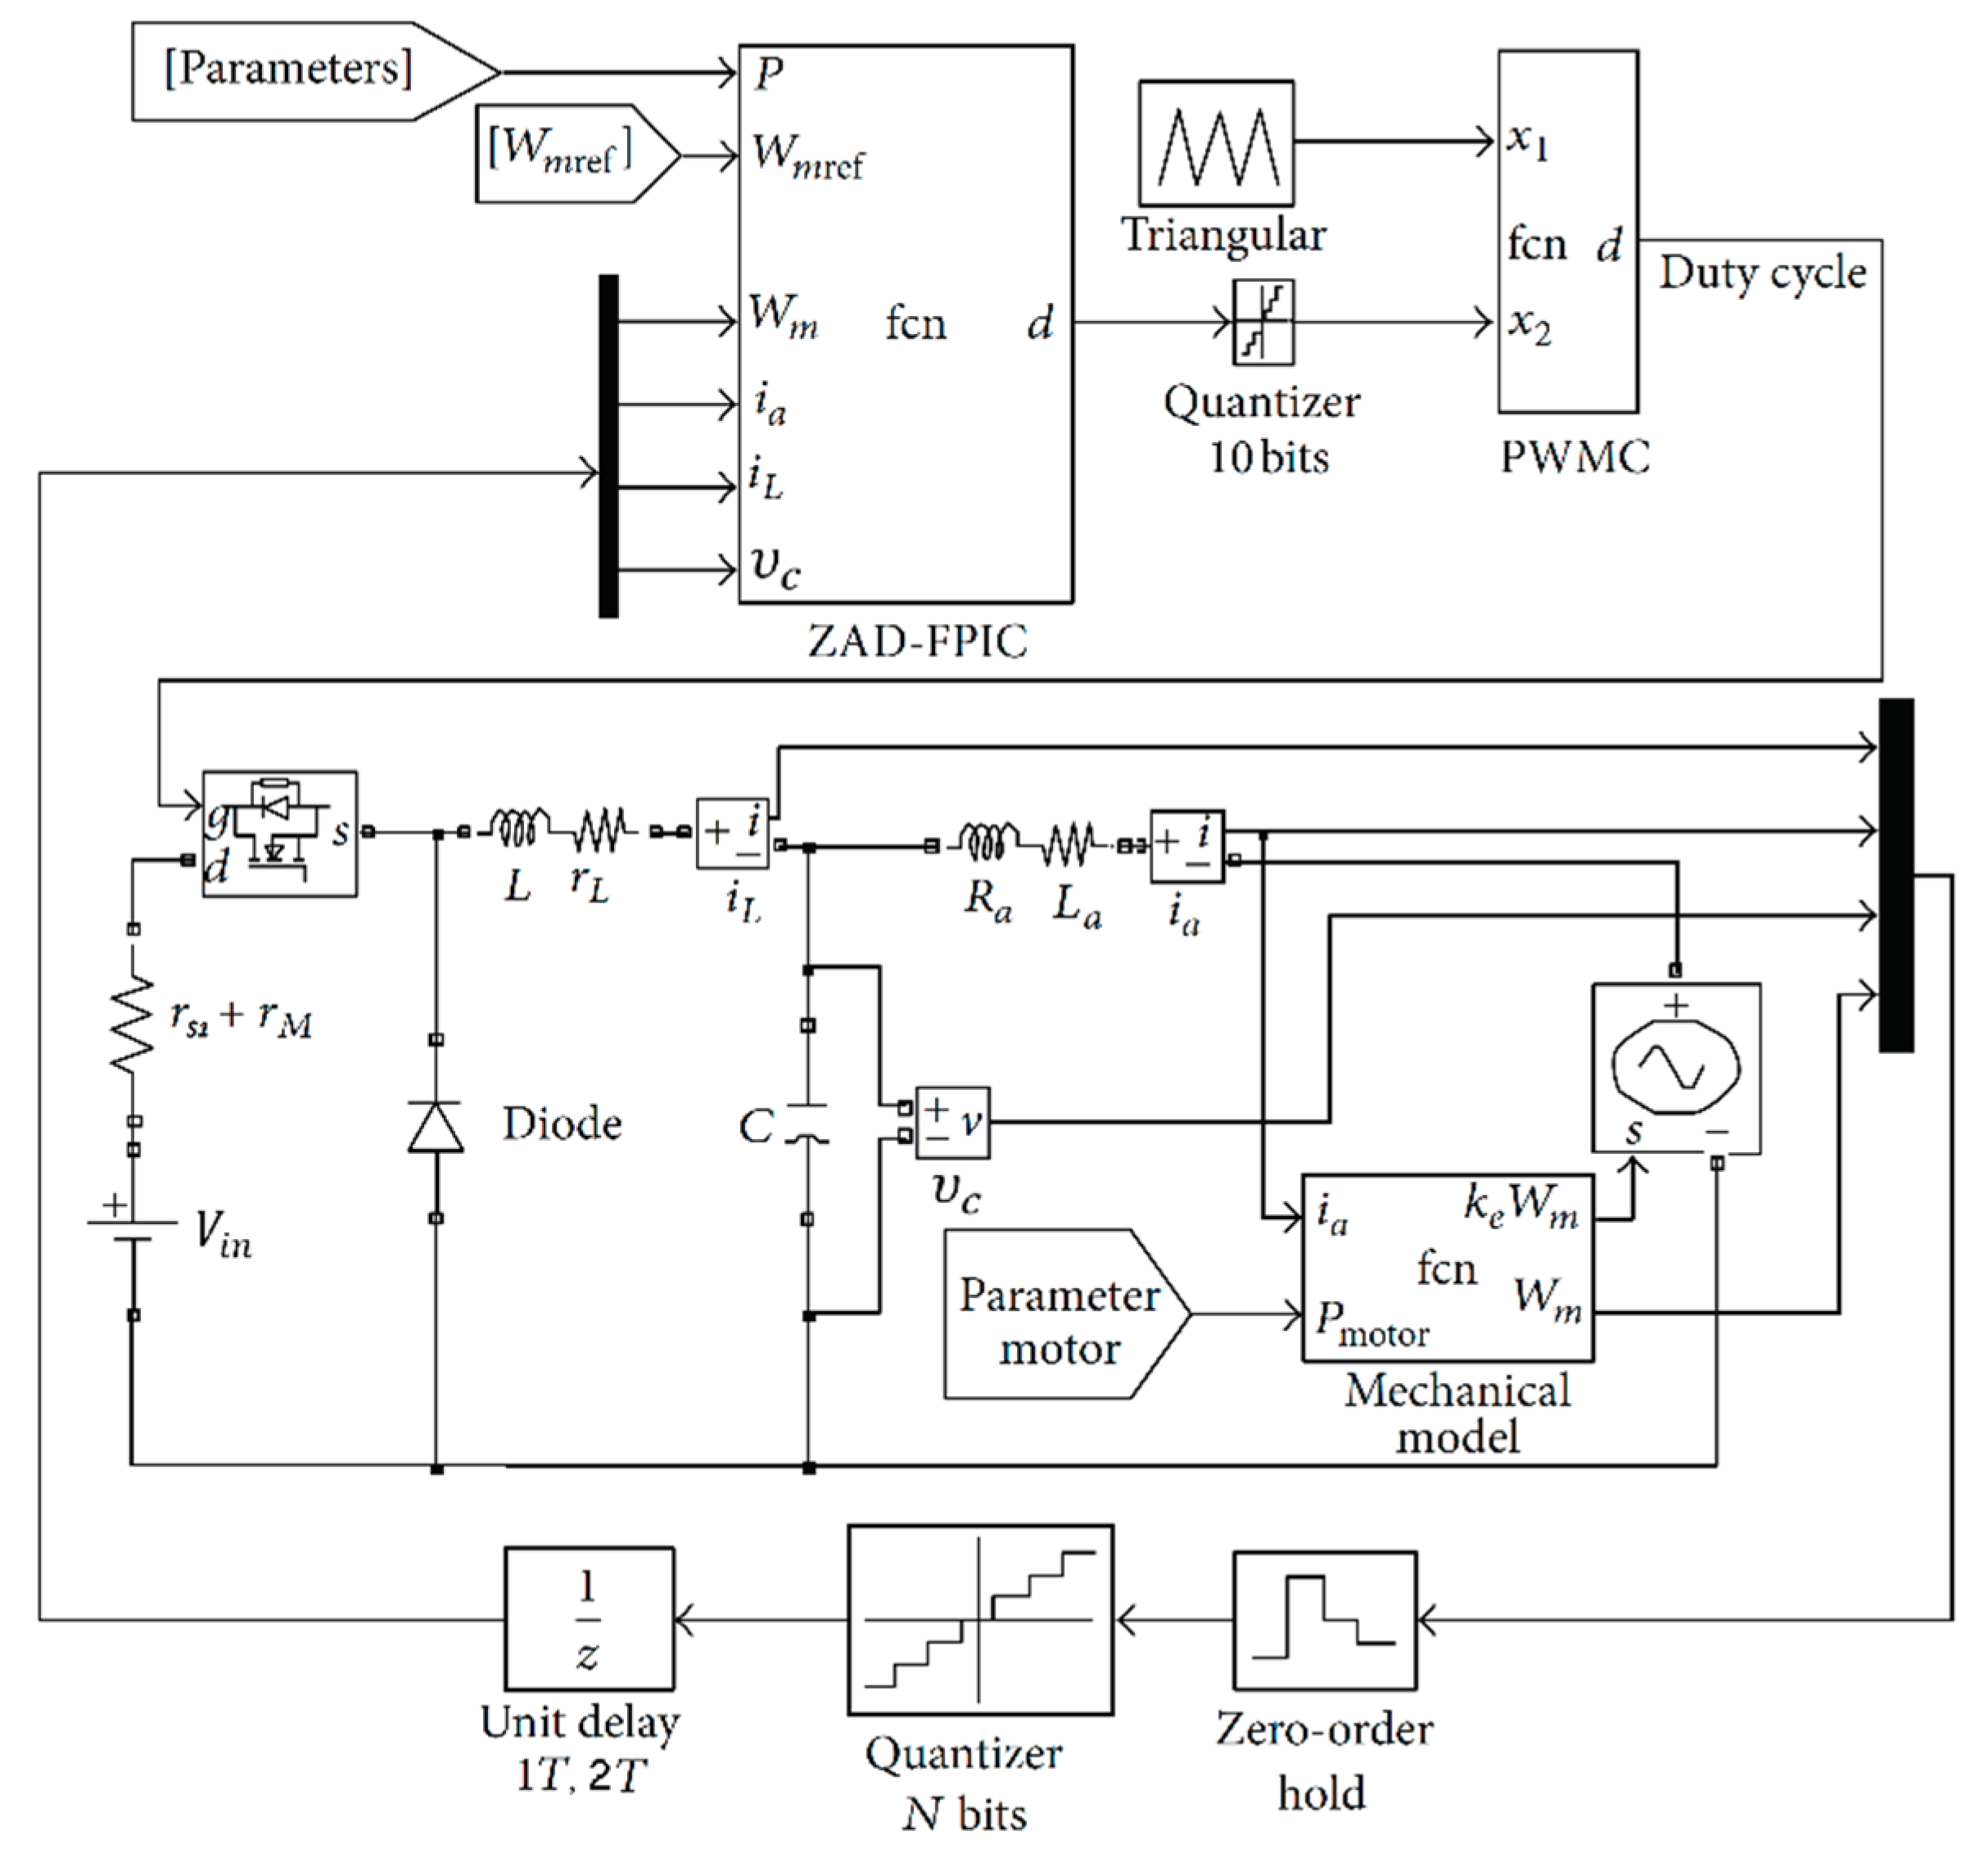
2.1. Model of the Buck Motor System
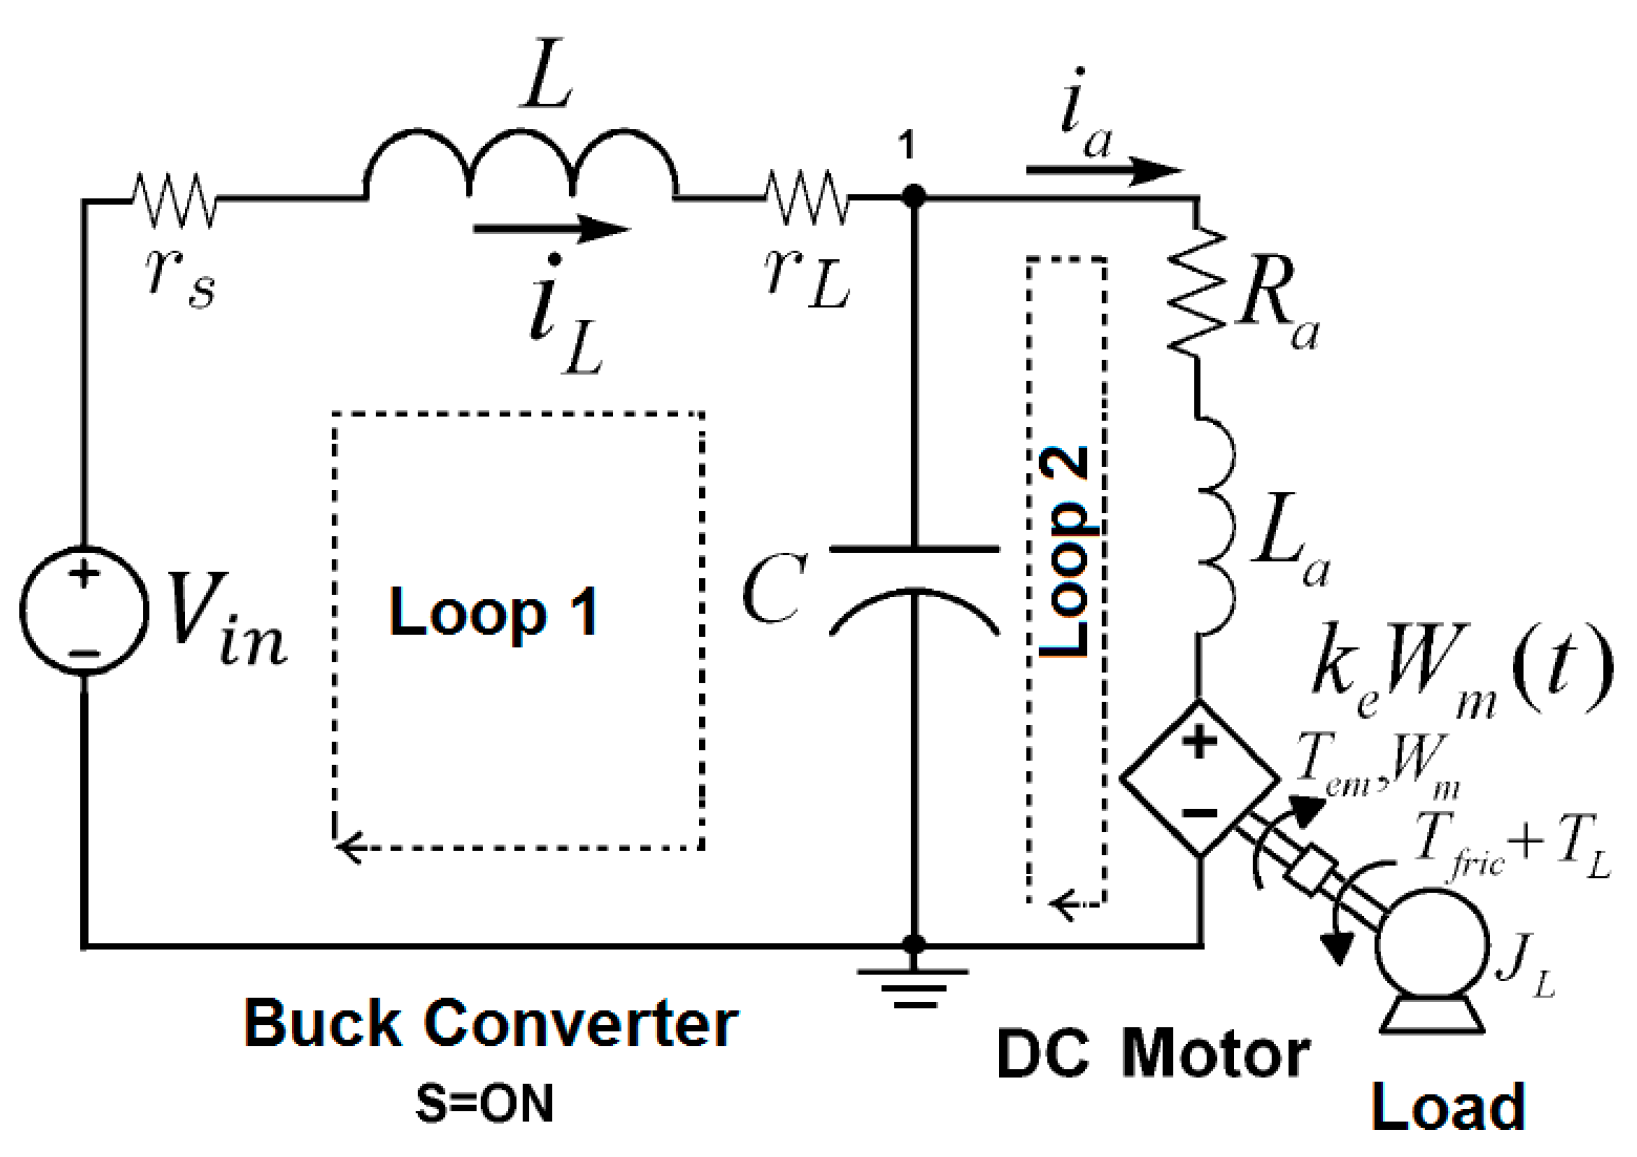
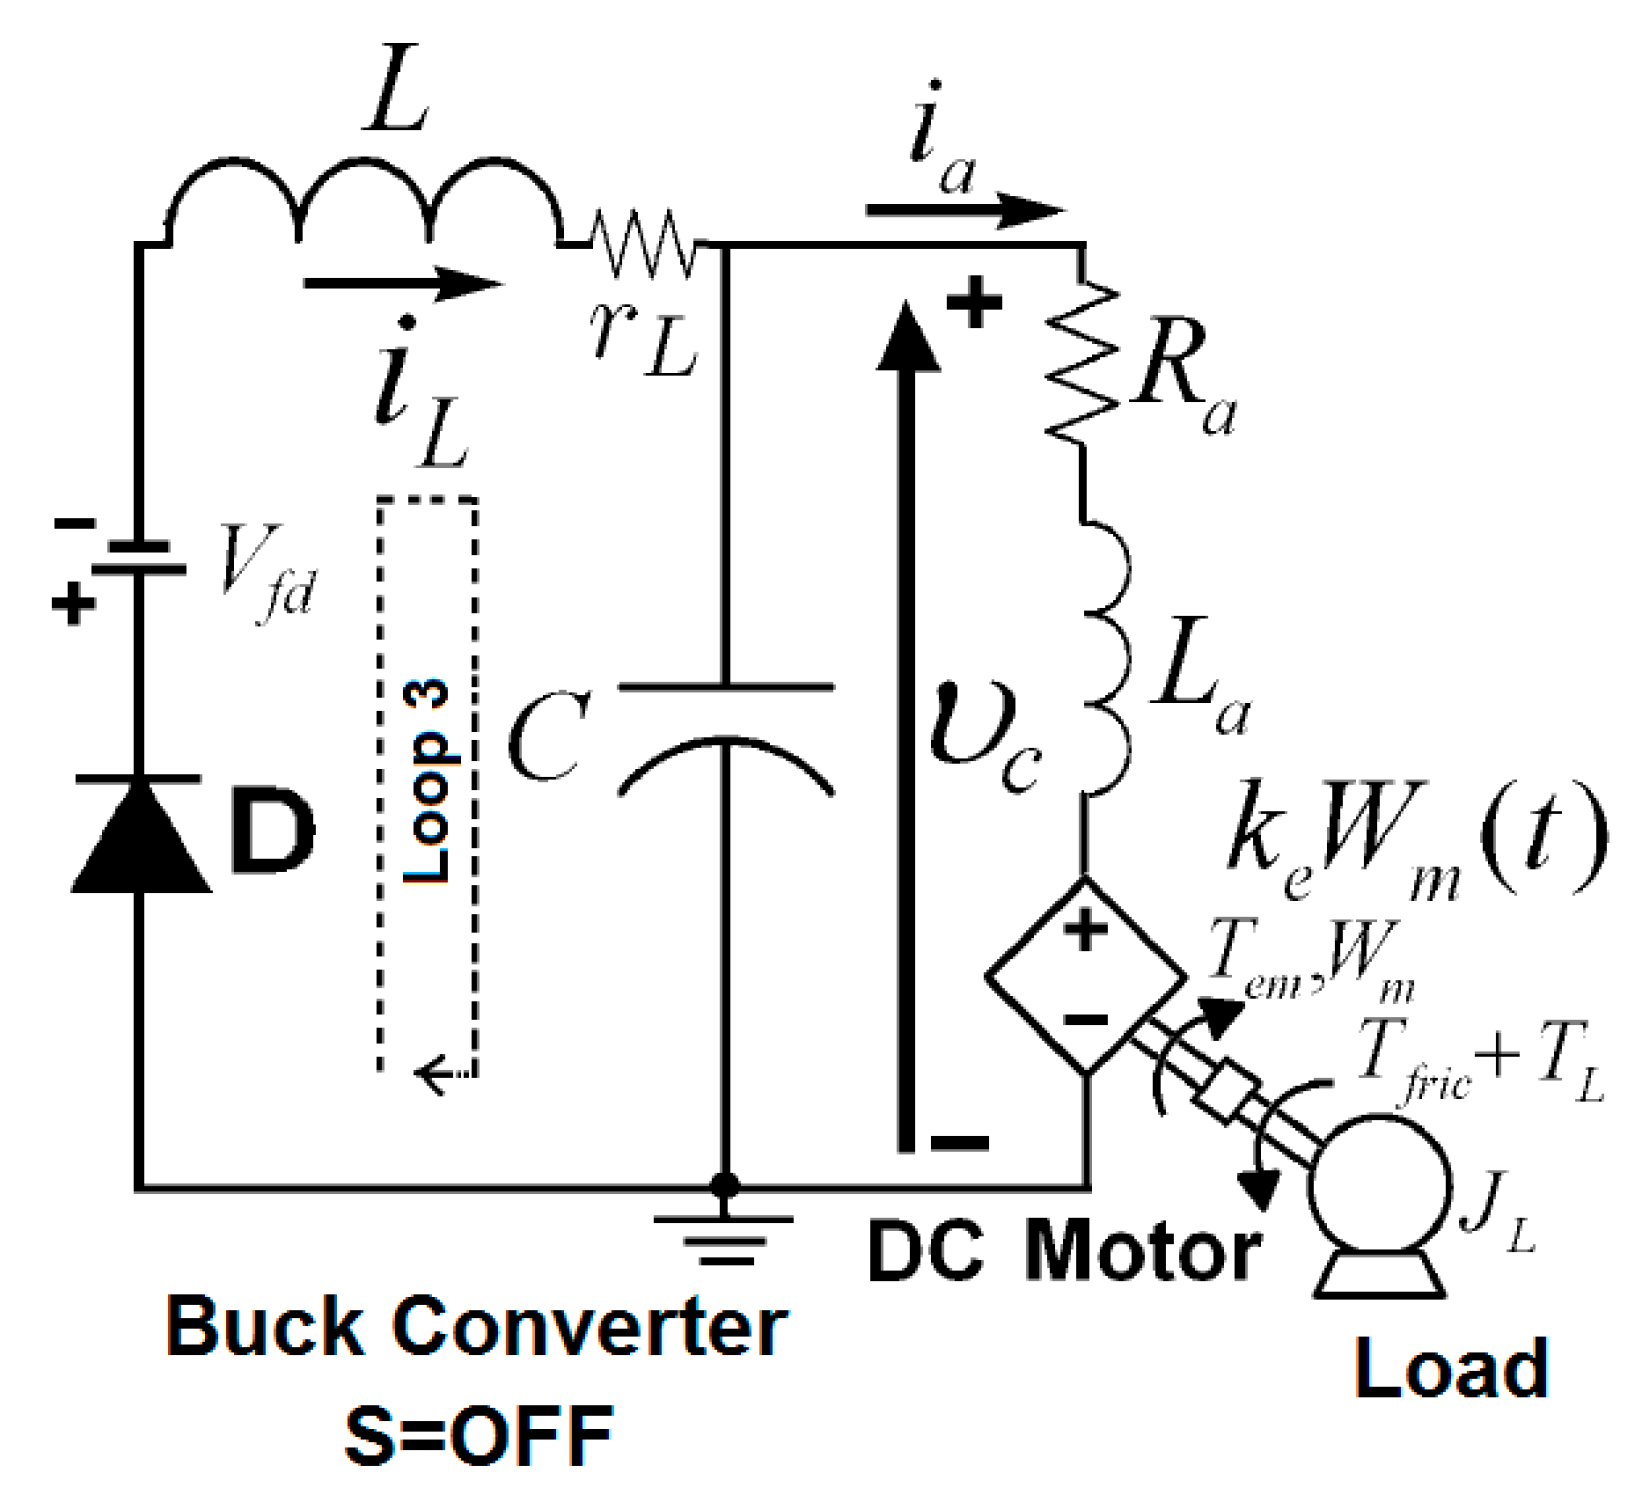
2.2. Analytical Solution of the Buck-Motor System
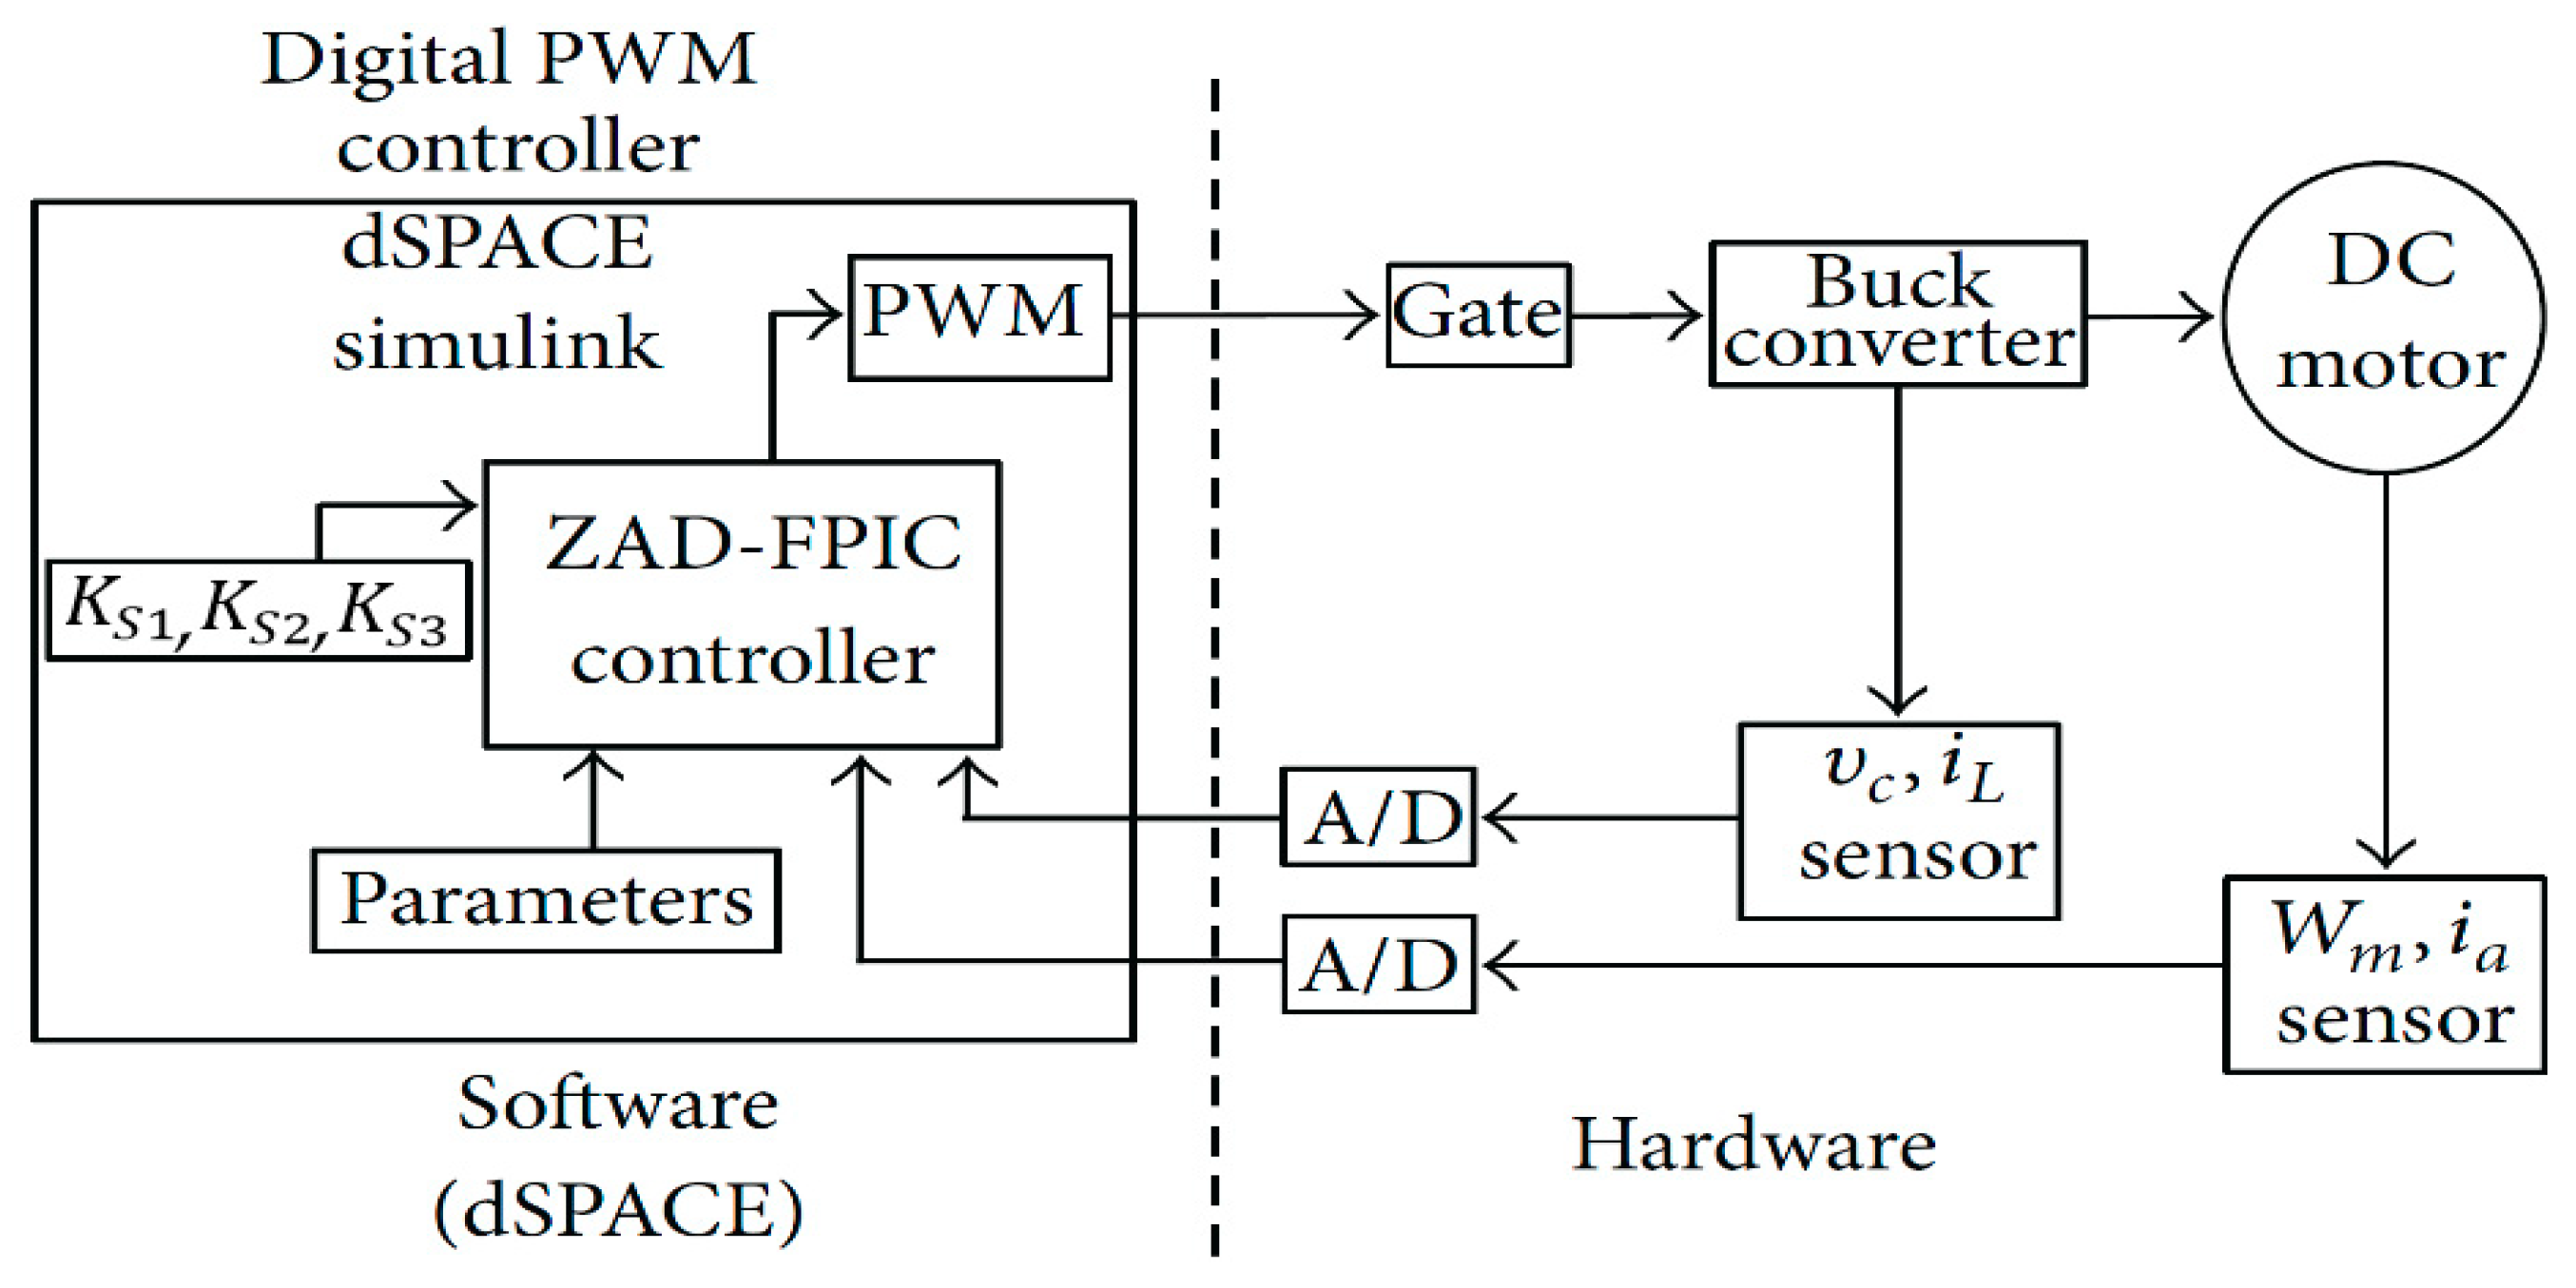
2.3. Strategies to Control the Speed of the DC Motor
3. Results and Analysis
3.1. Parameters of the Controller
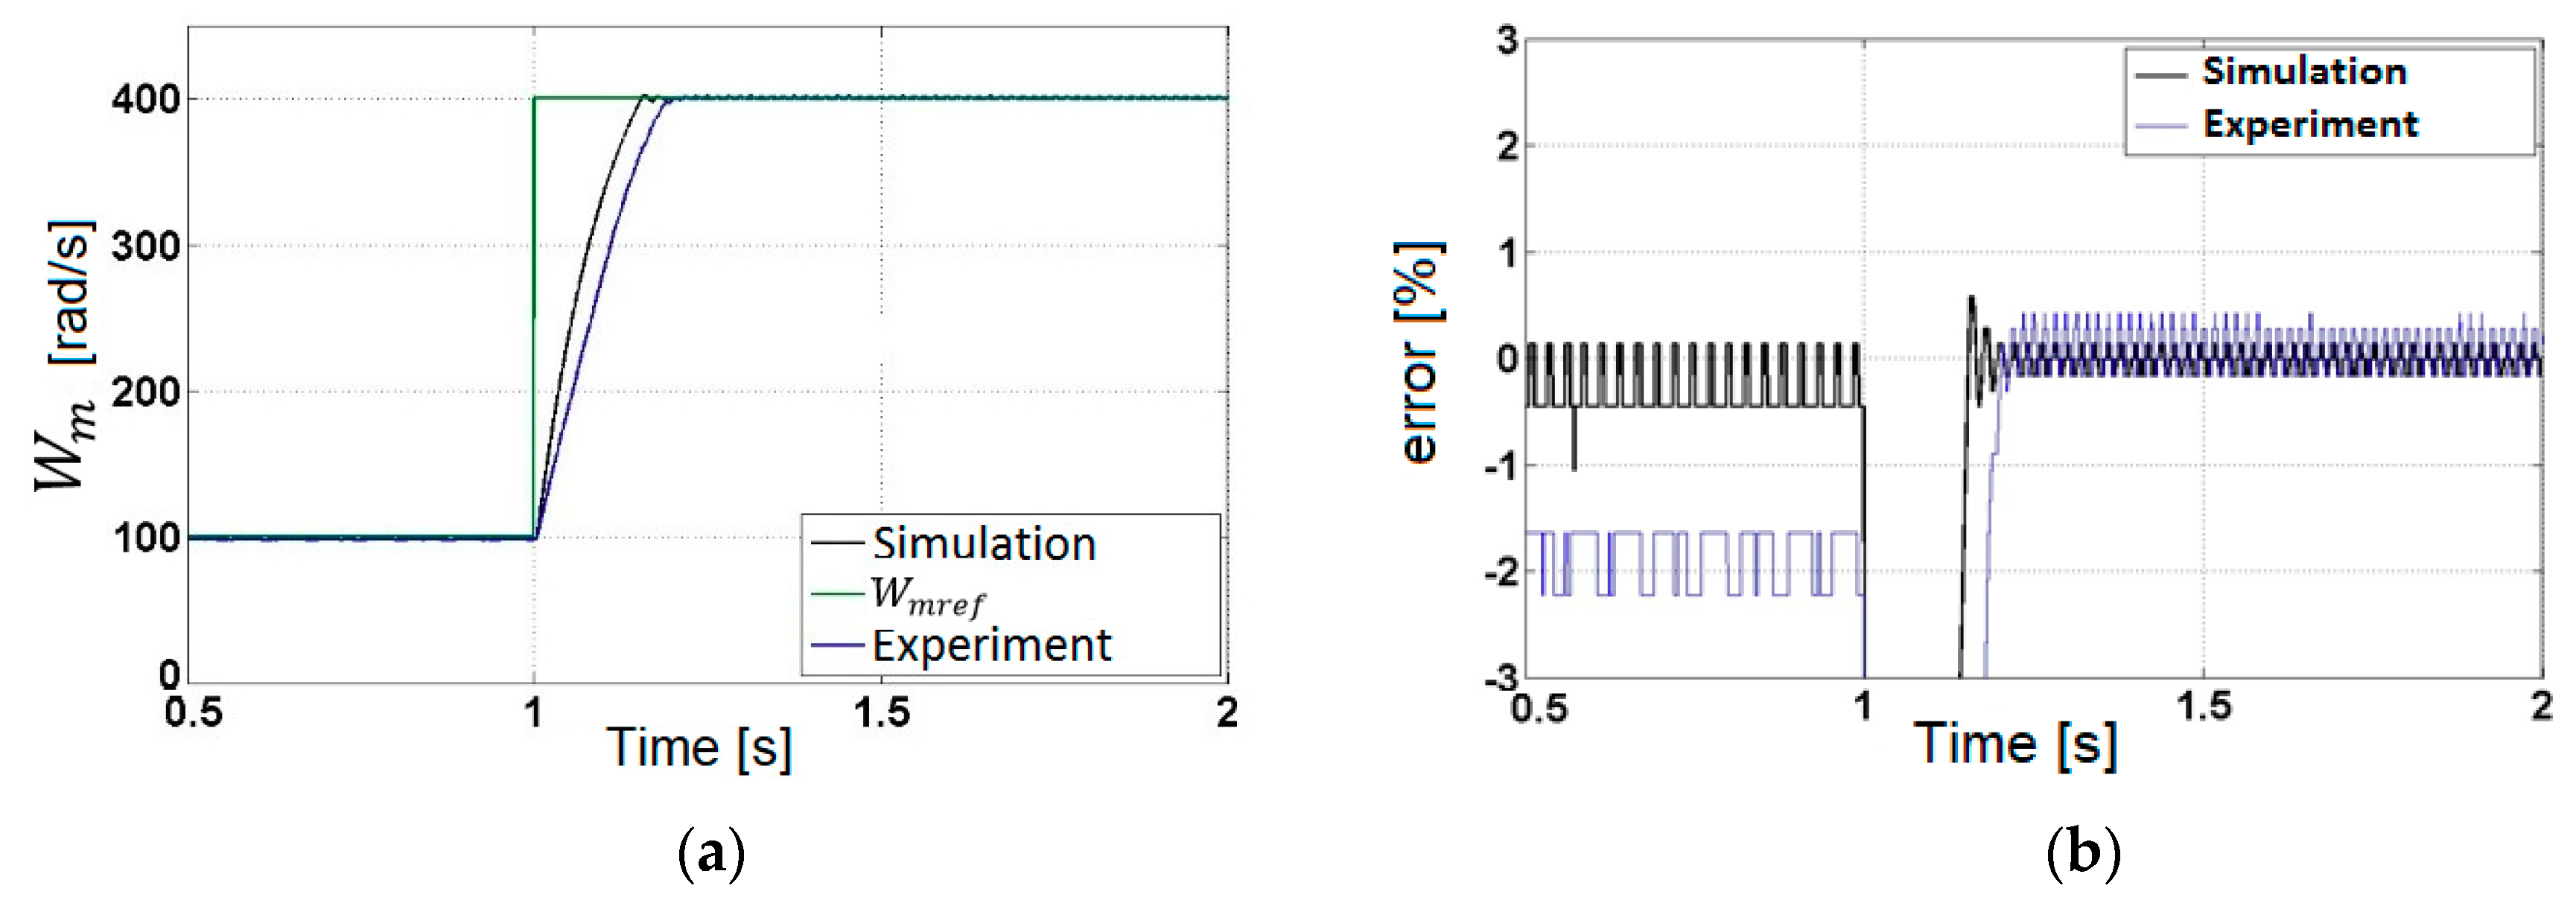
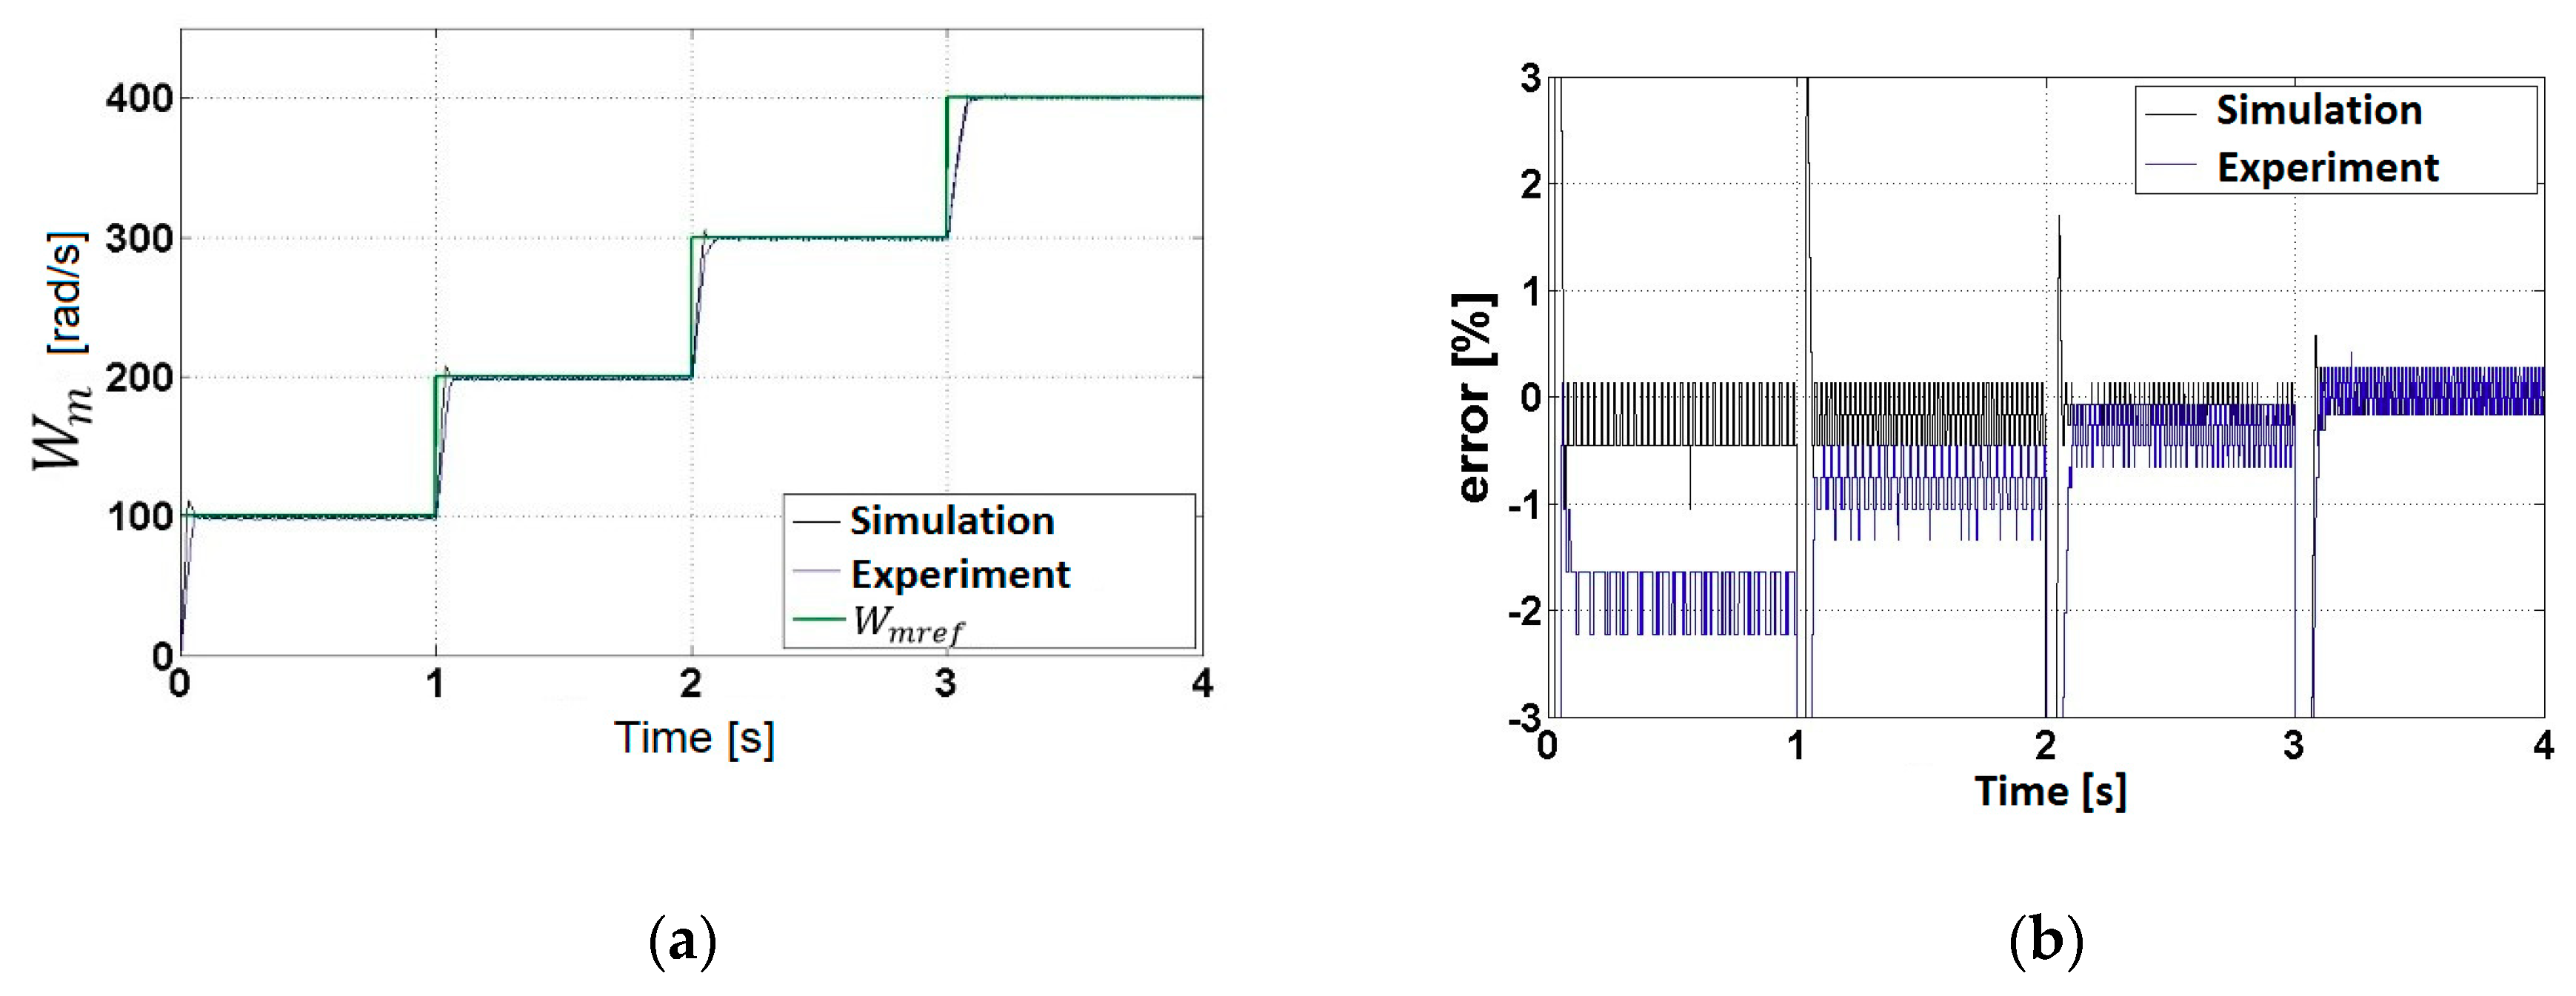
3.2. Behavior of the Buck-Motor System in Closed Loops
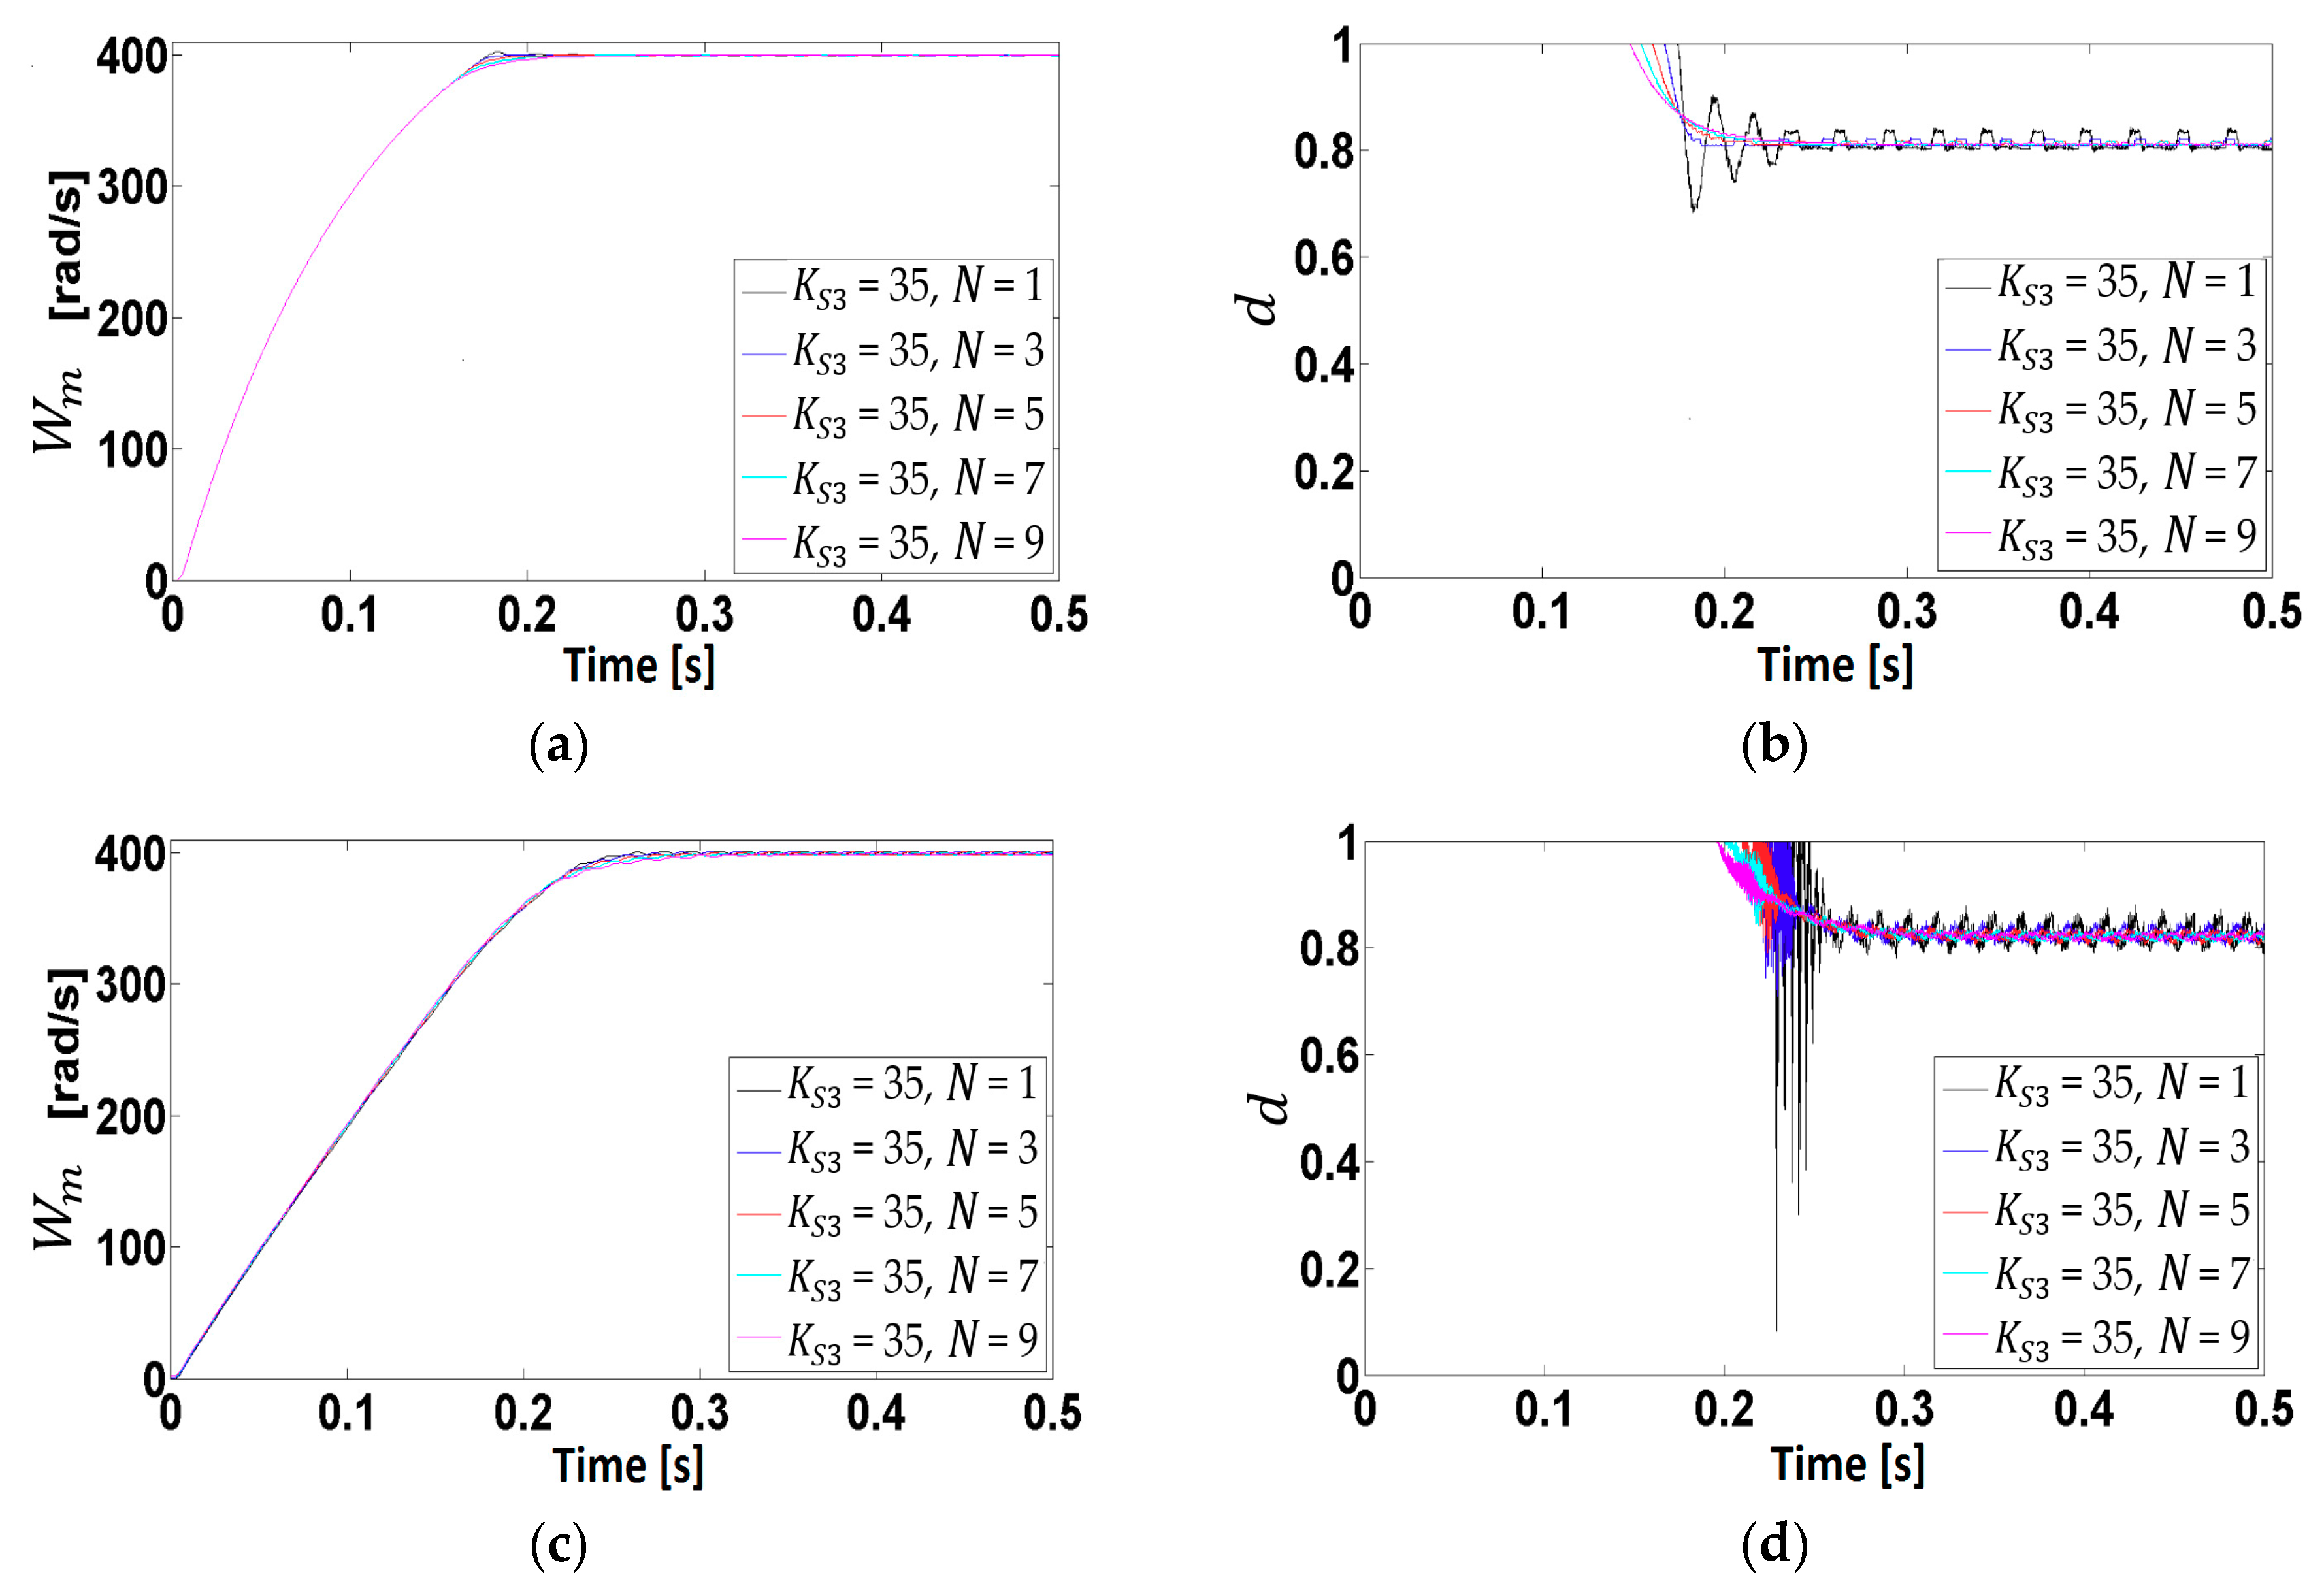
3.3. Transient Response Changing the Control Parameter with Parameter = 35
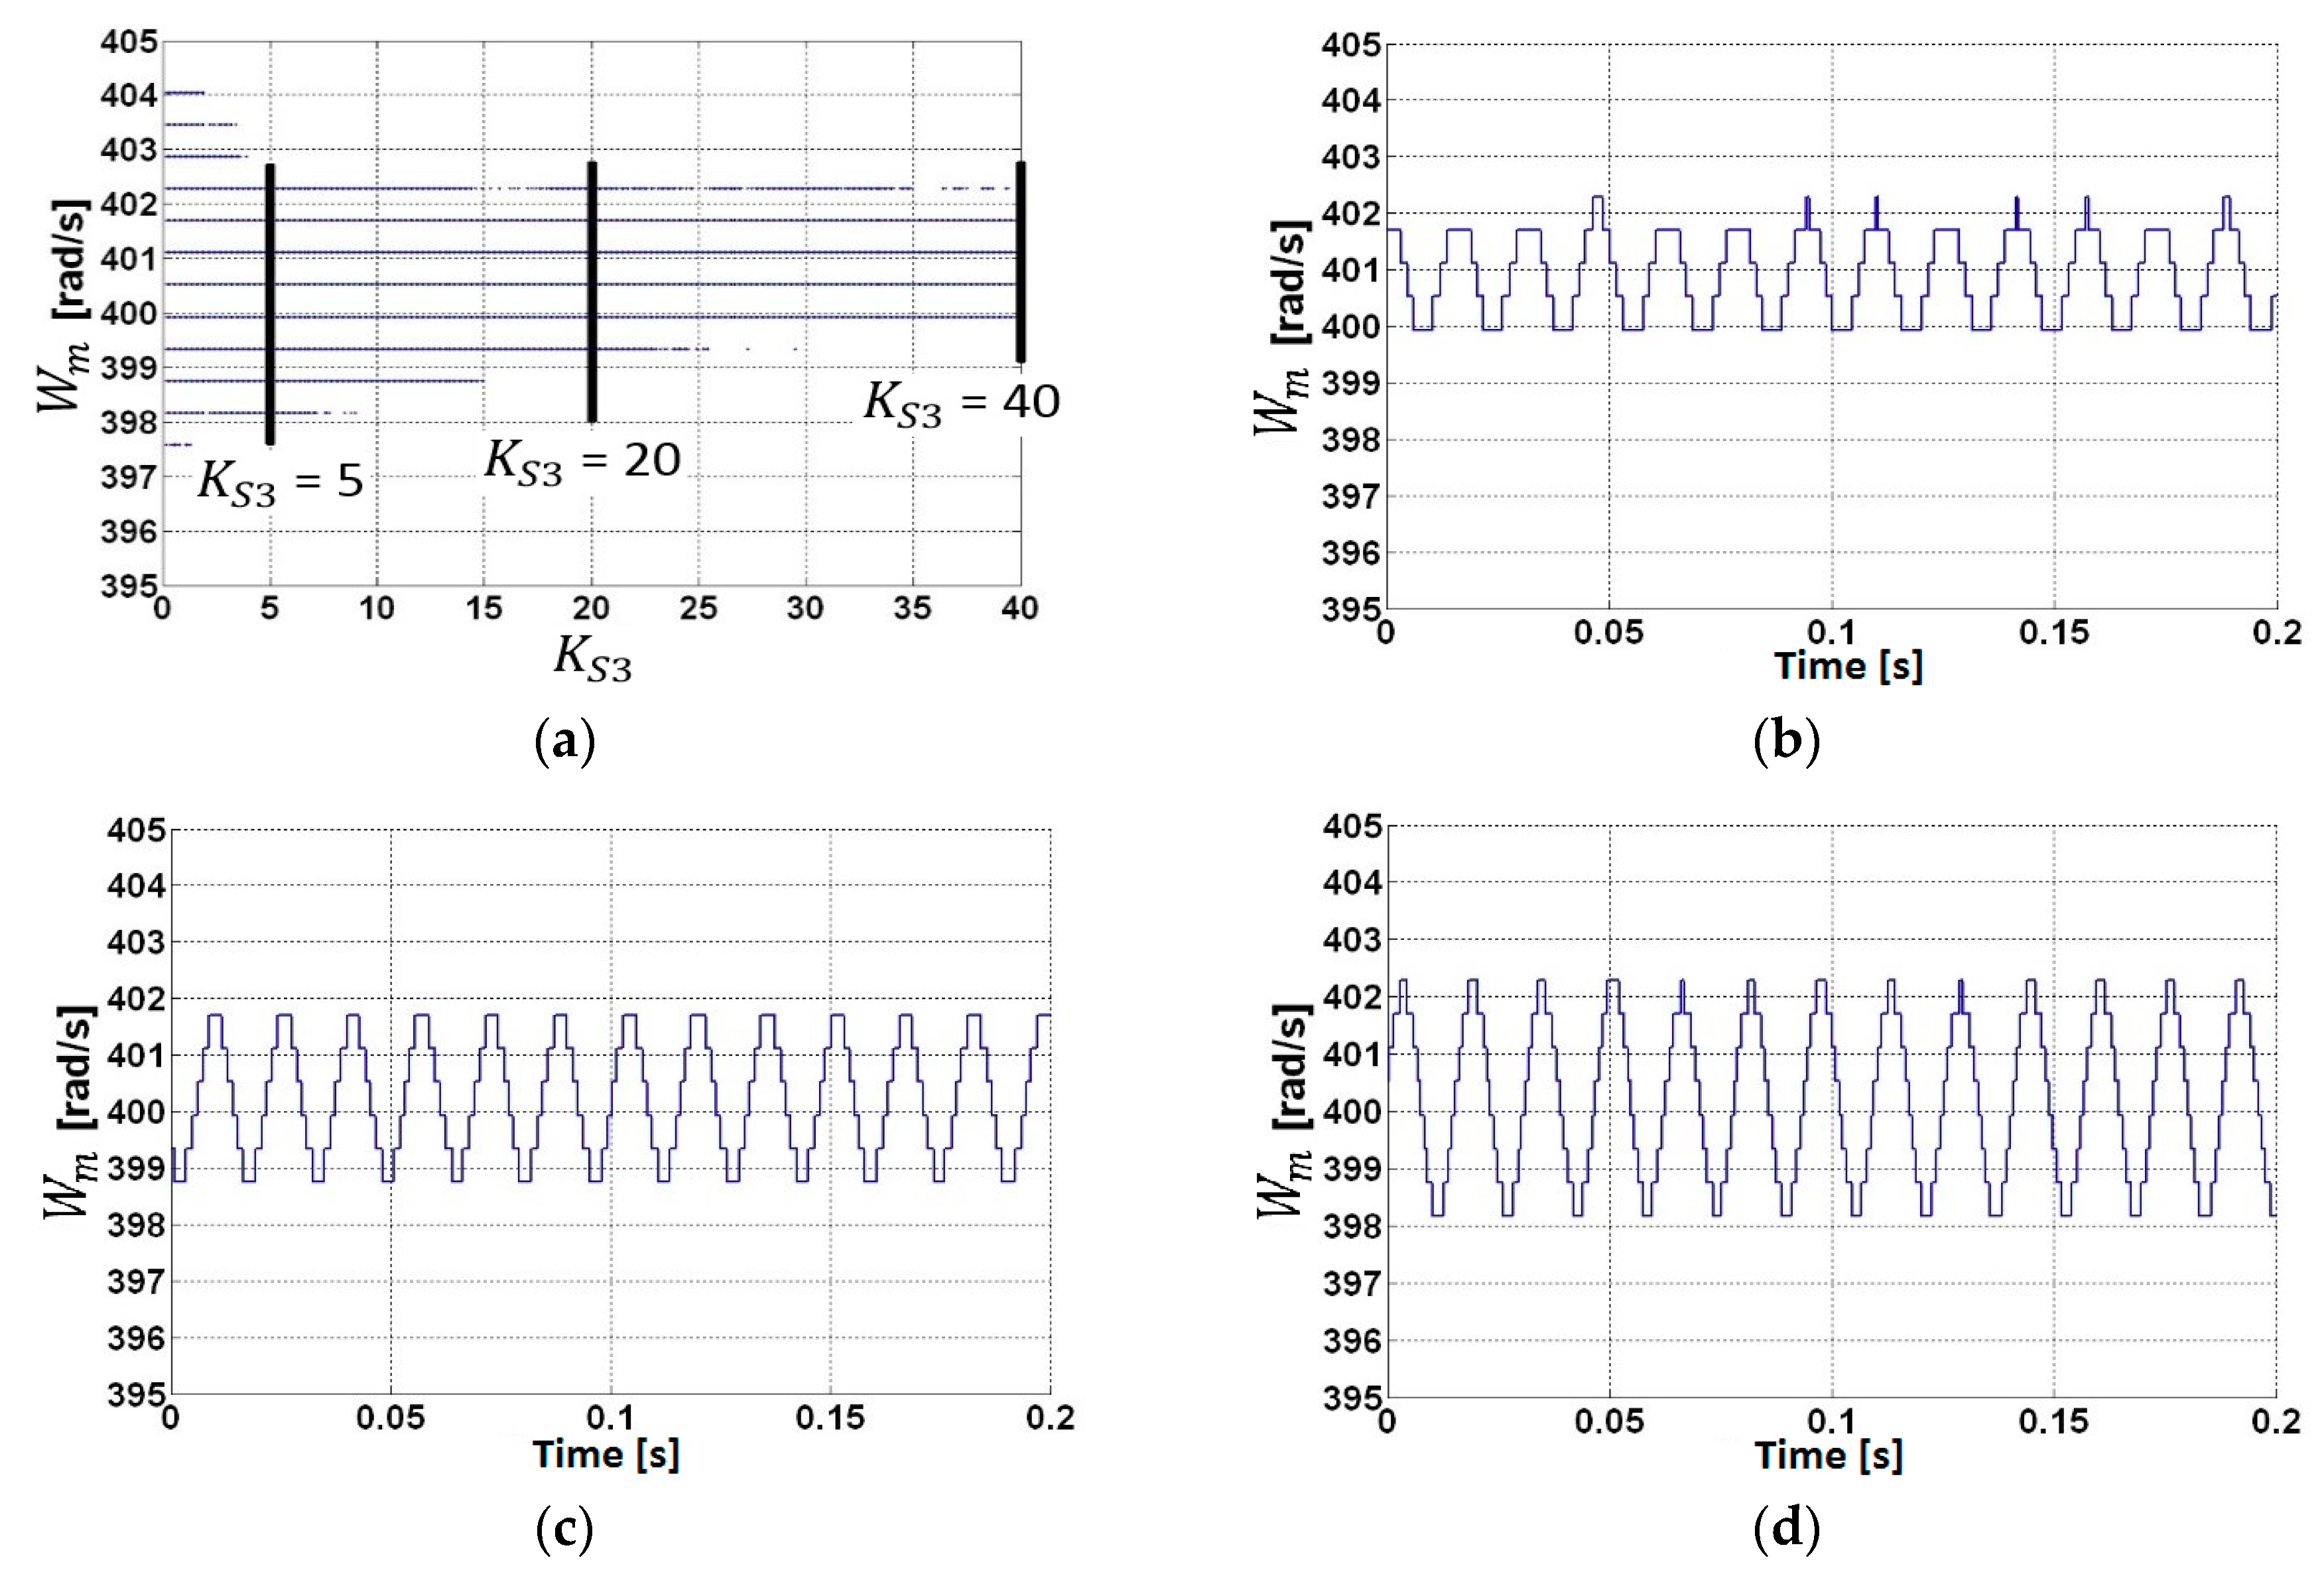
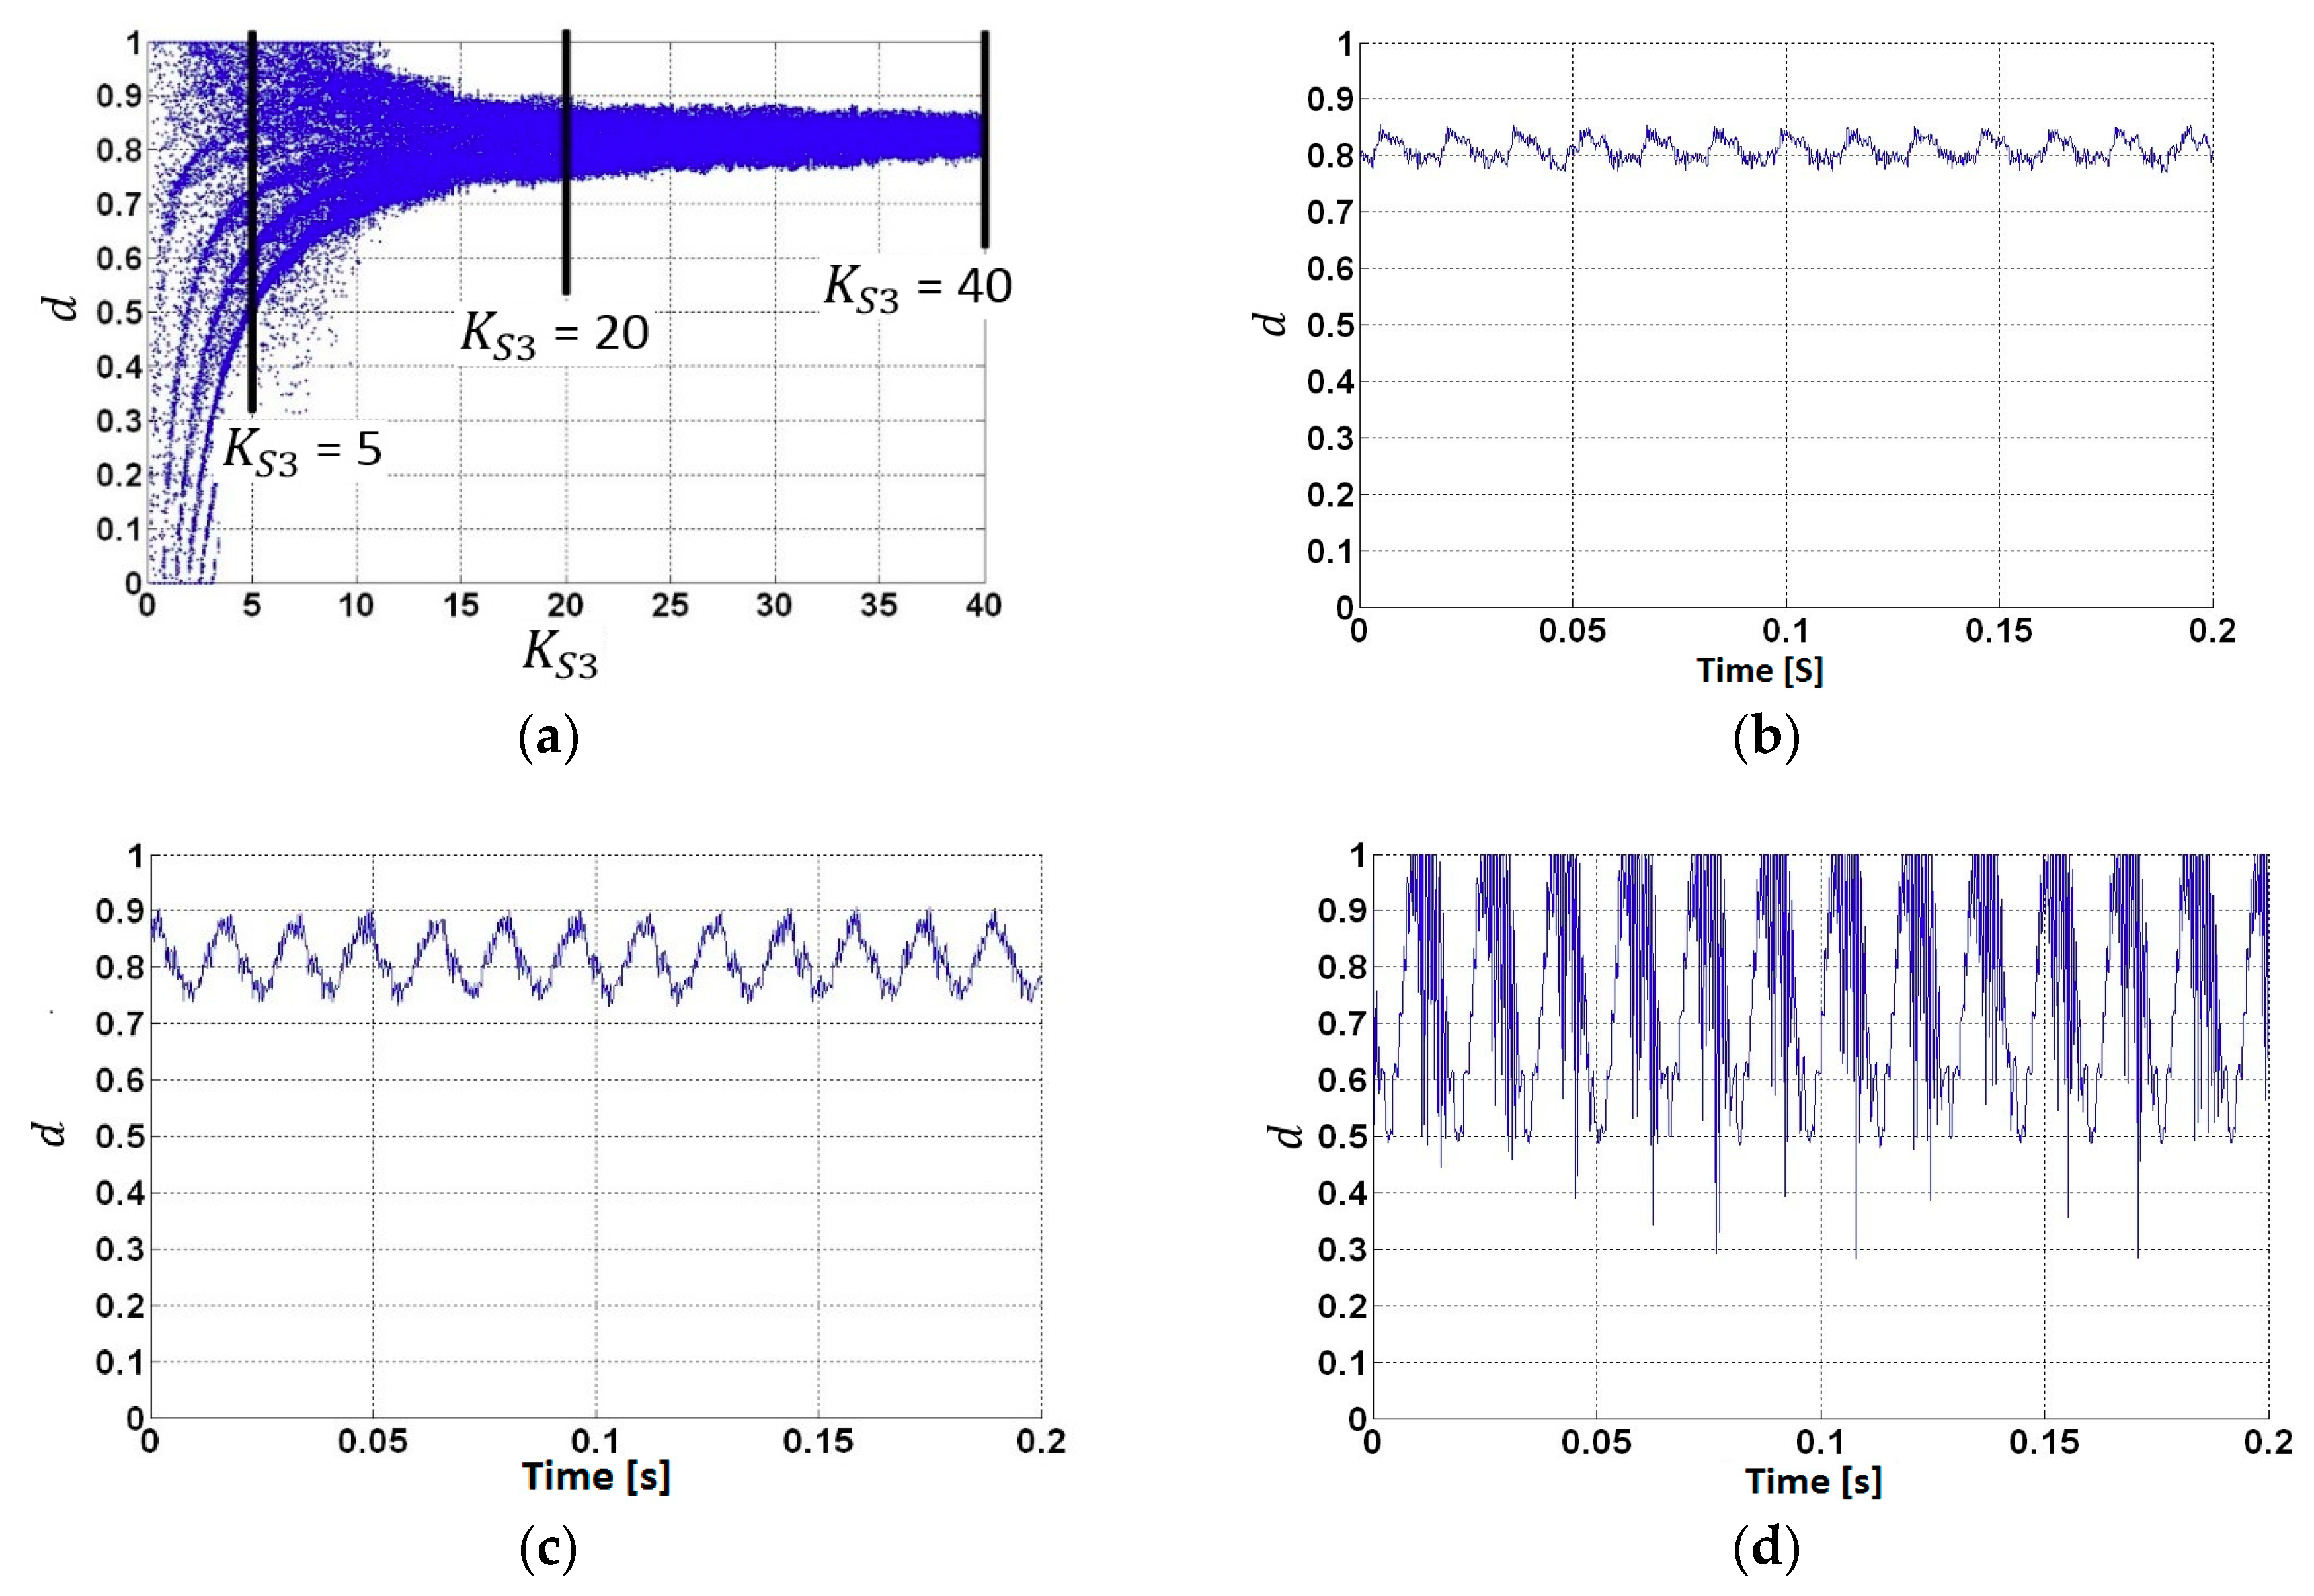
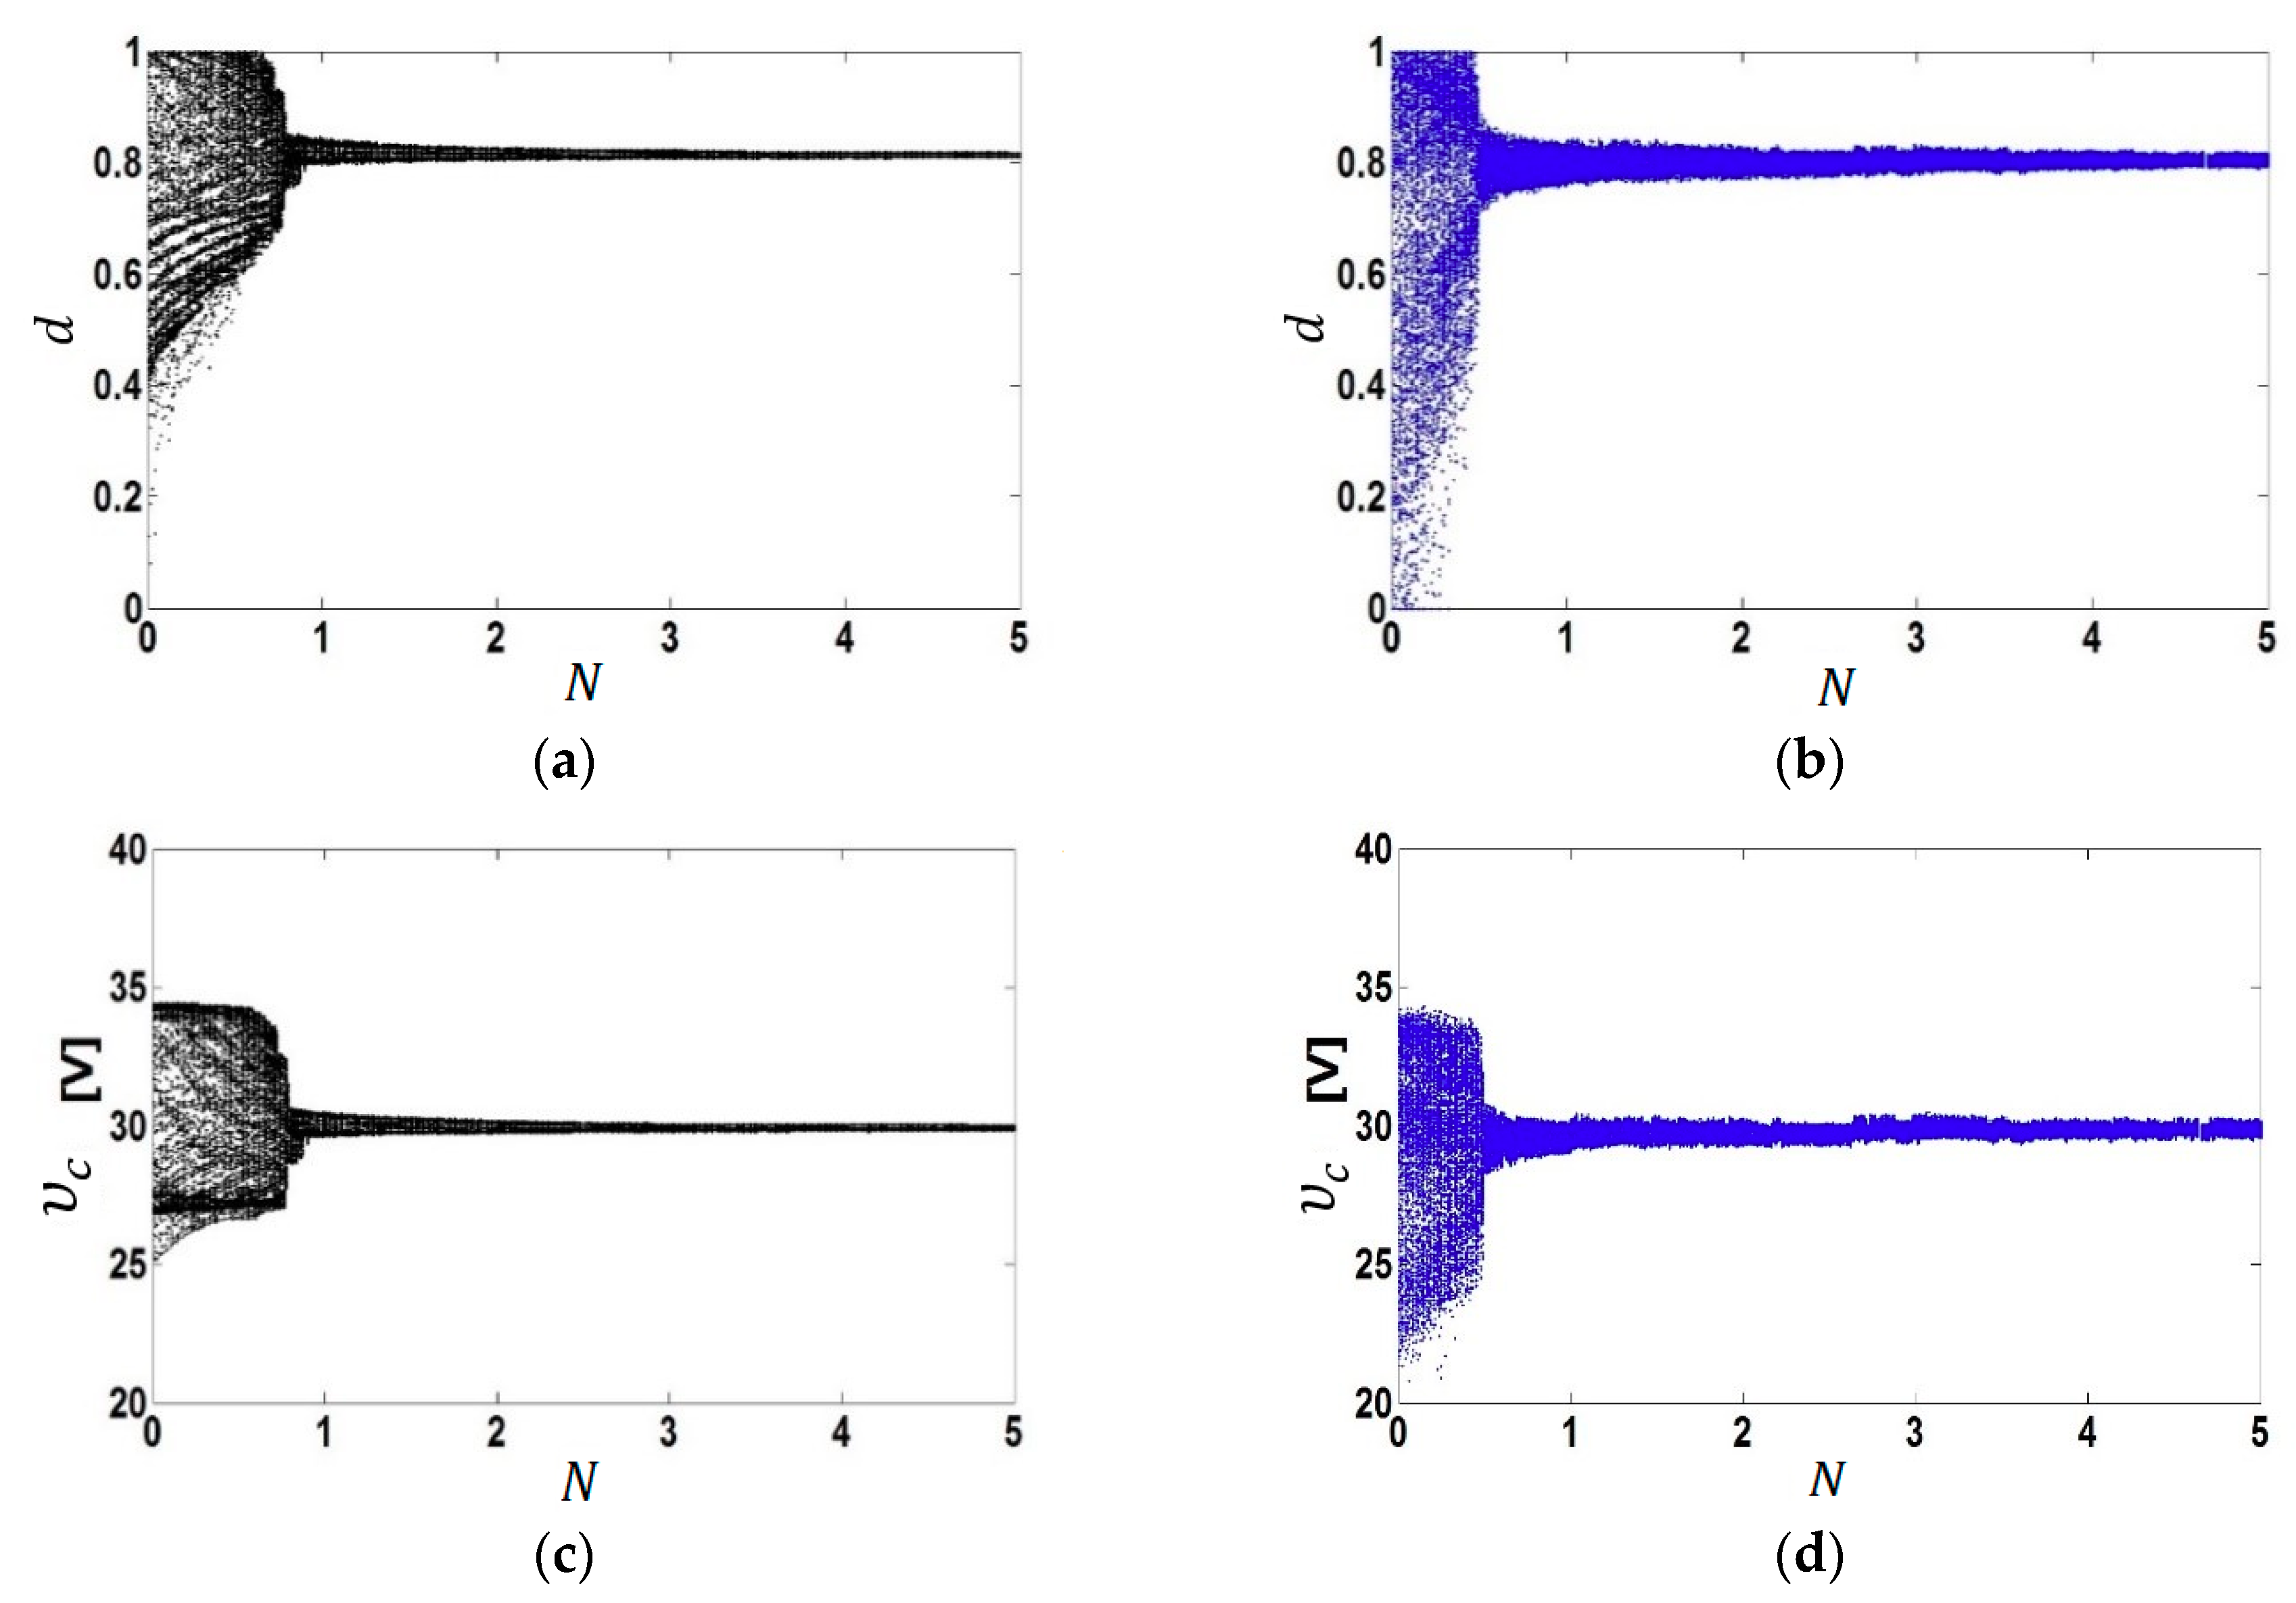
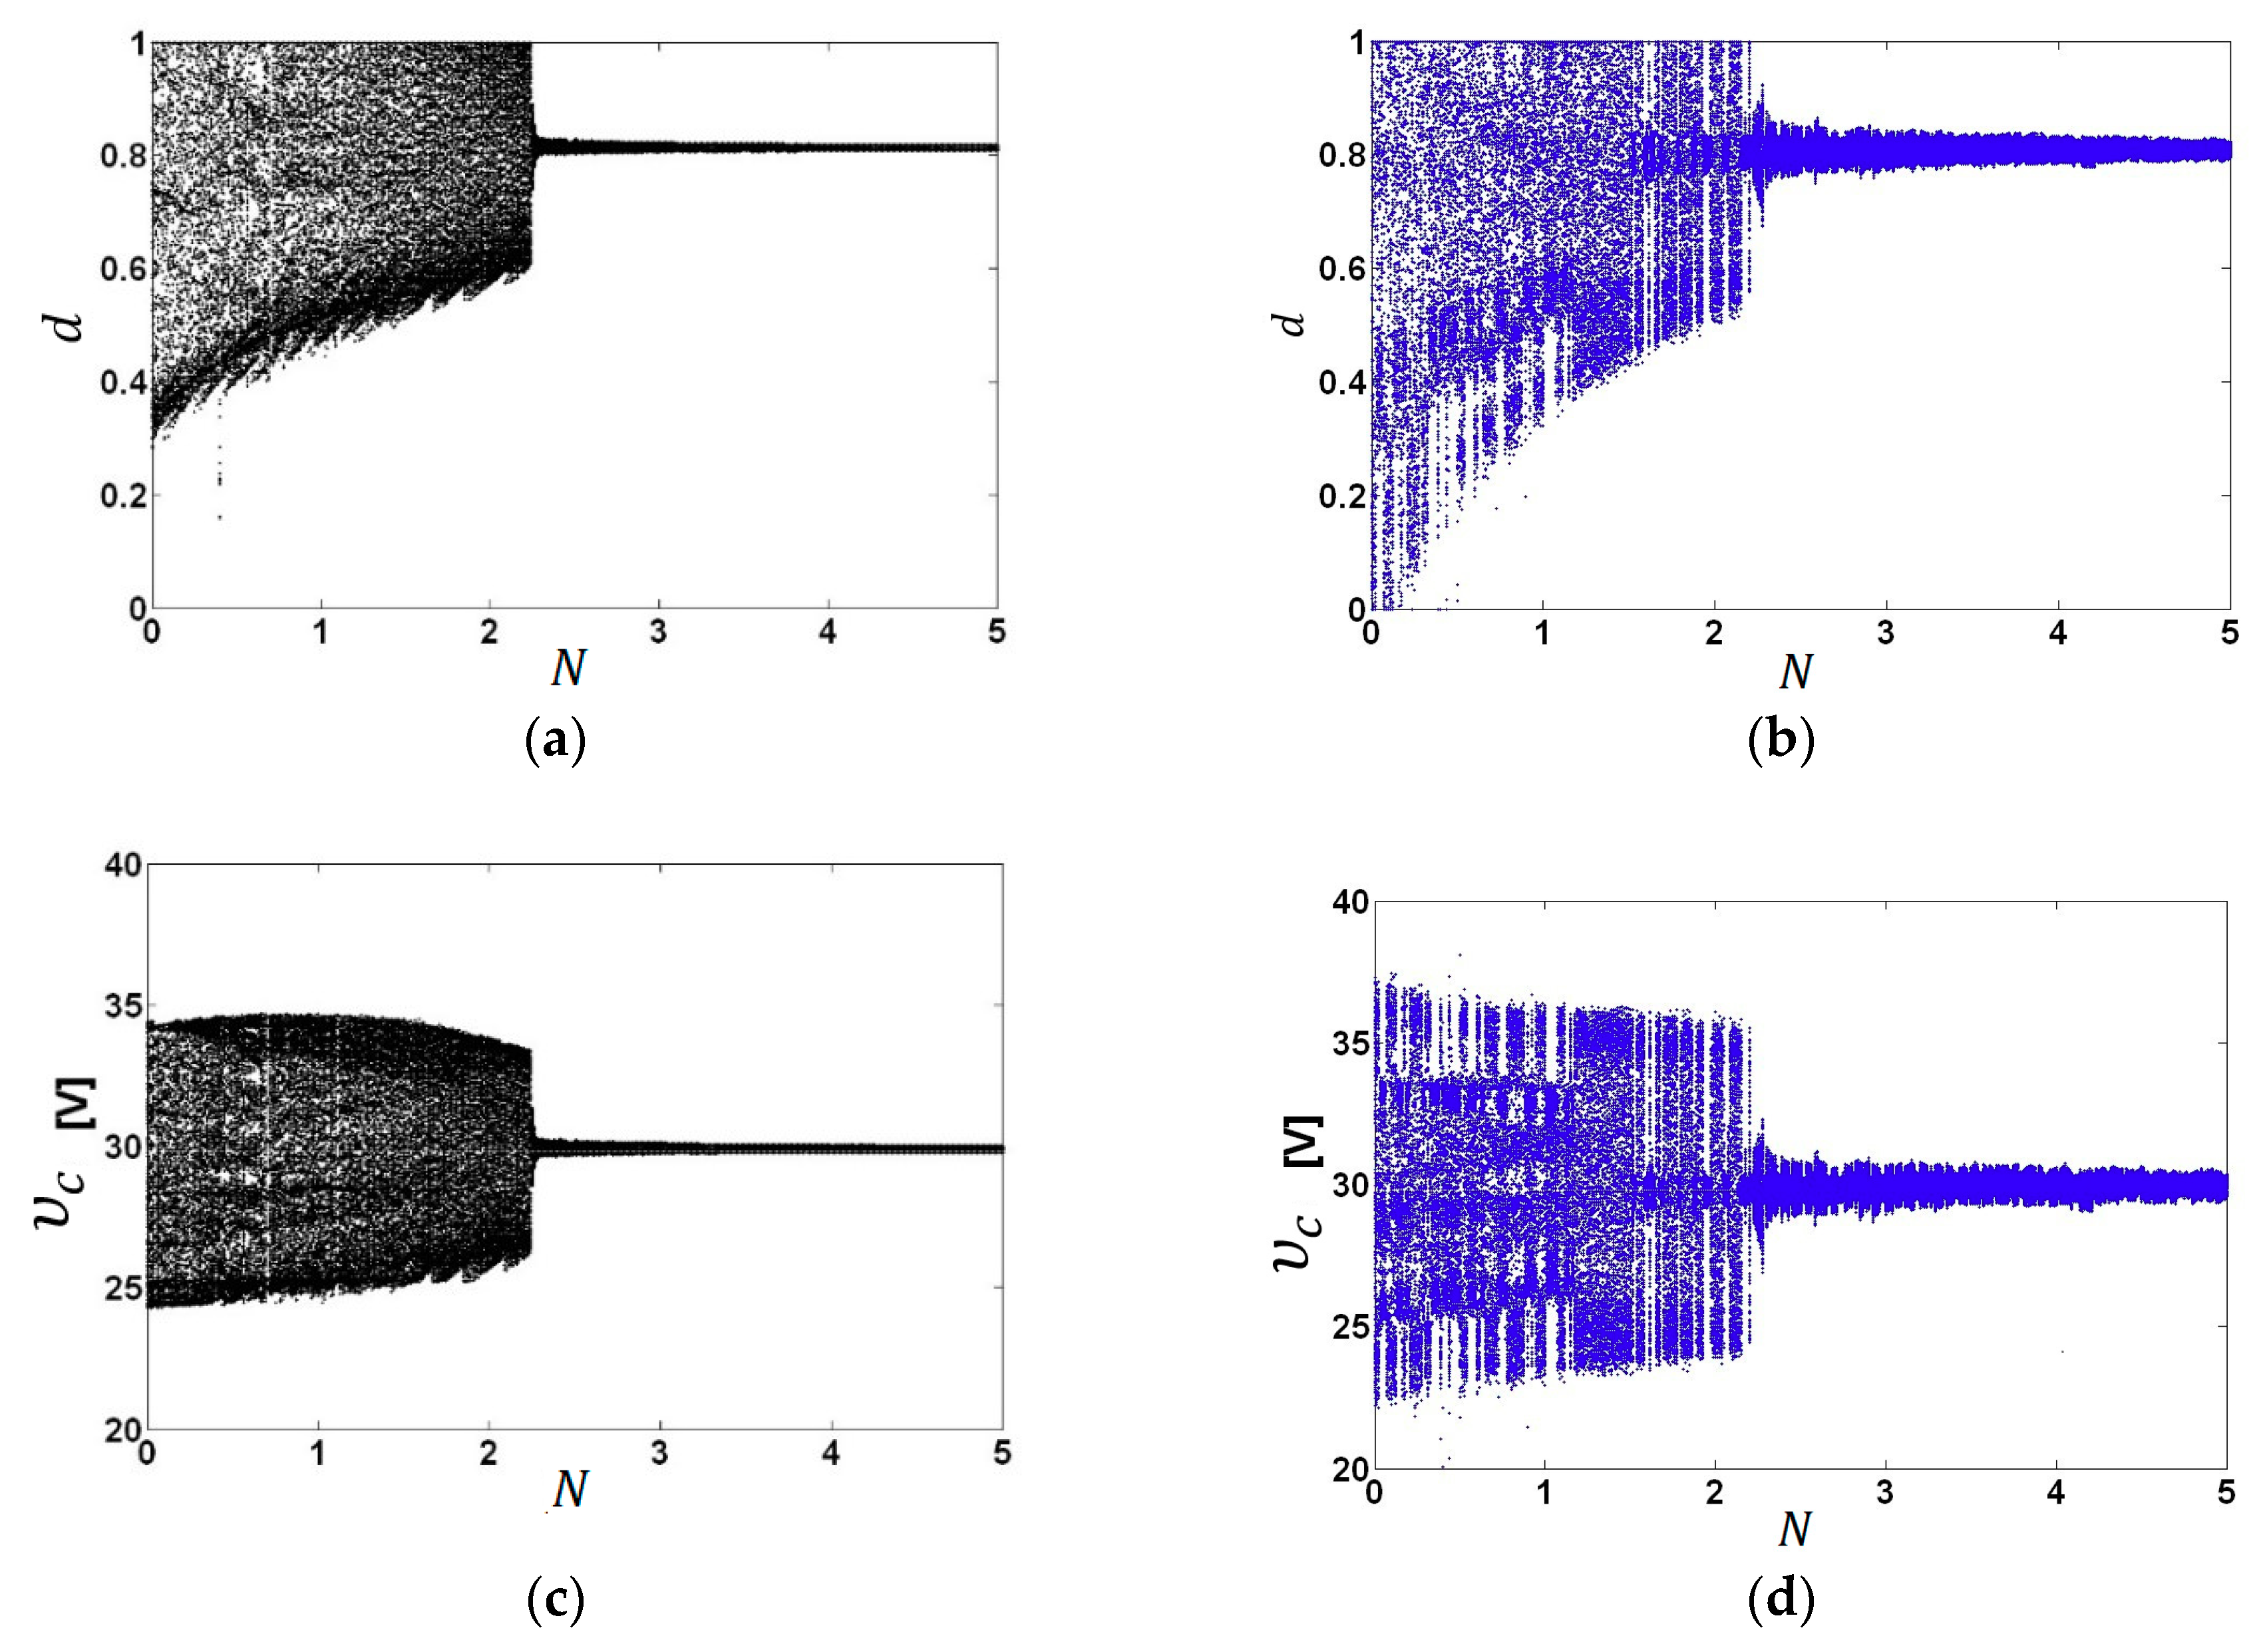
3.4. Variation of the Parameter
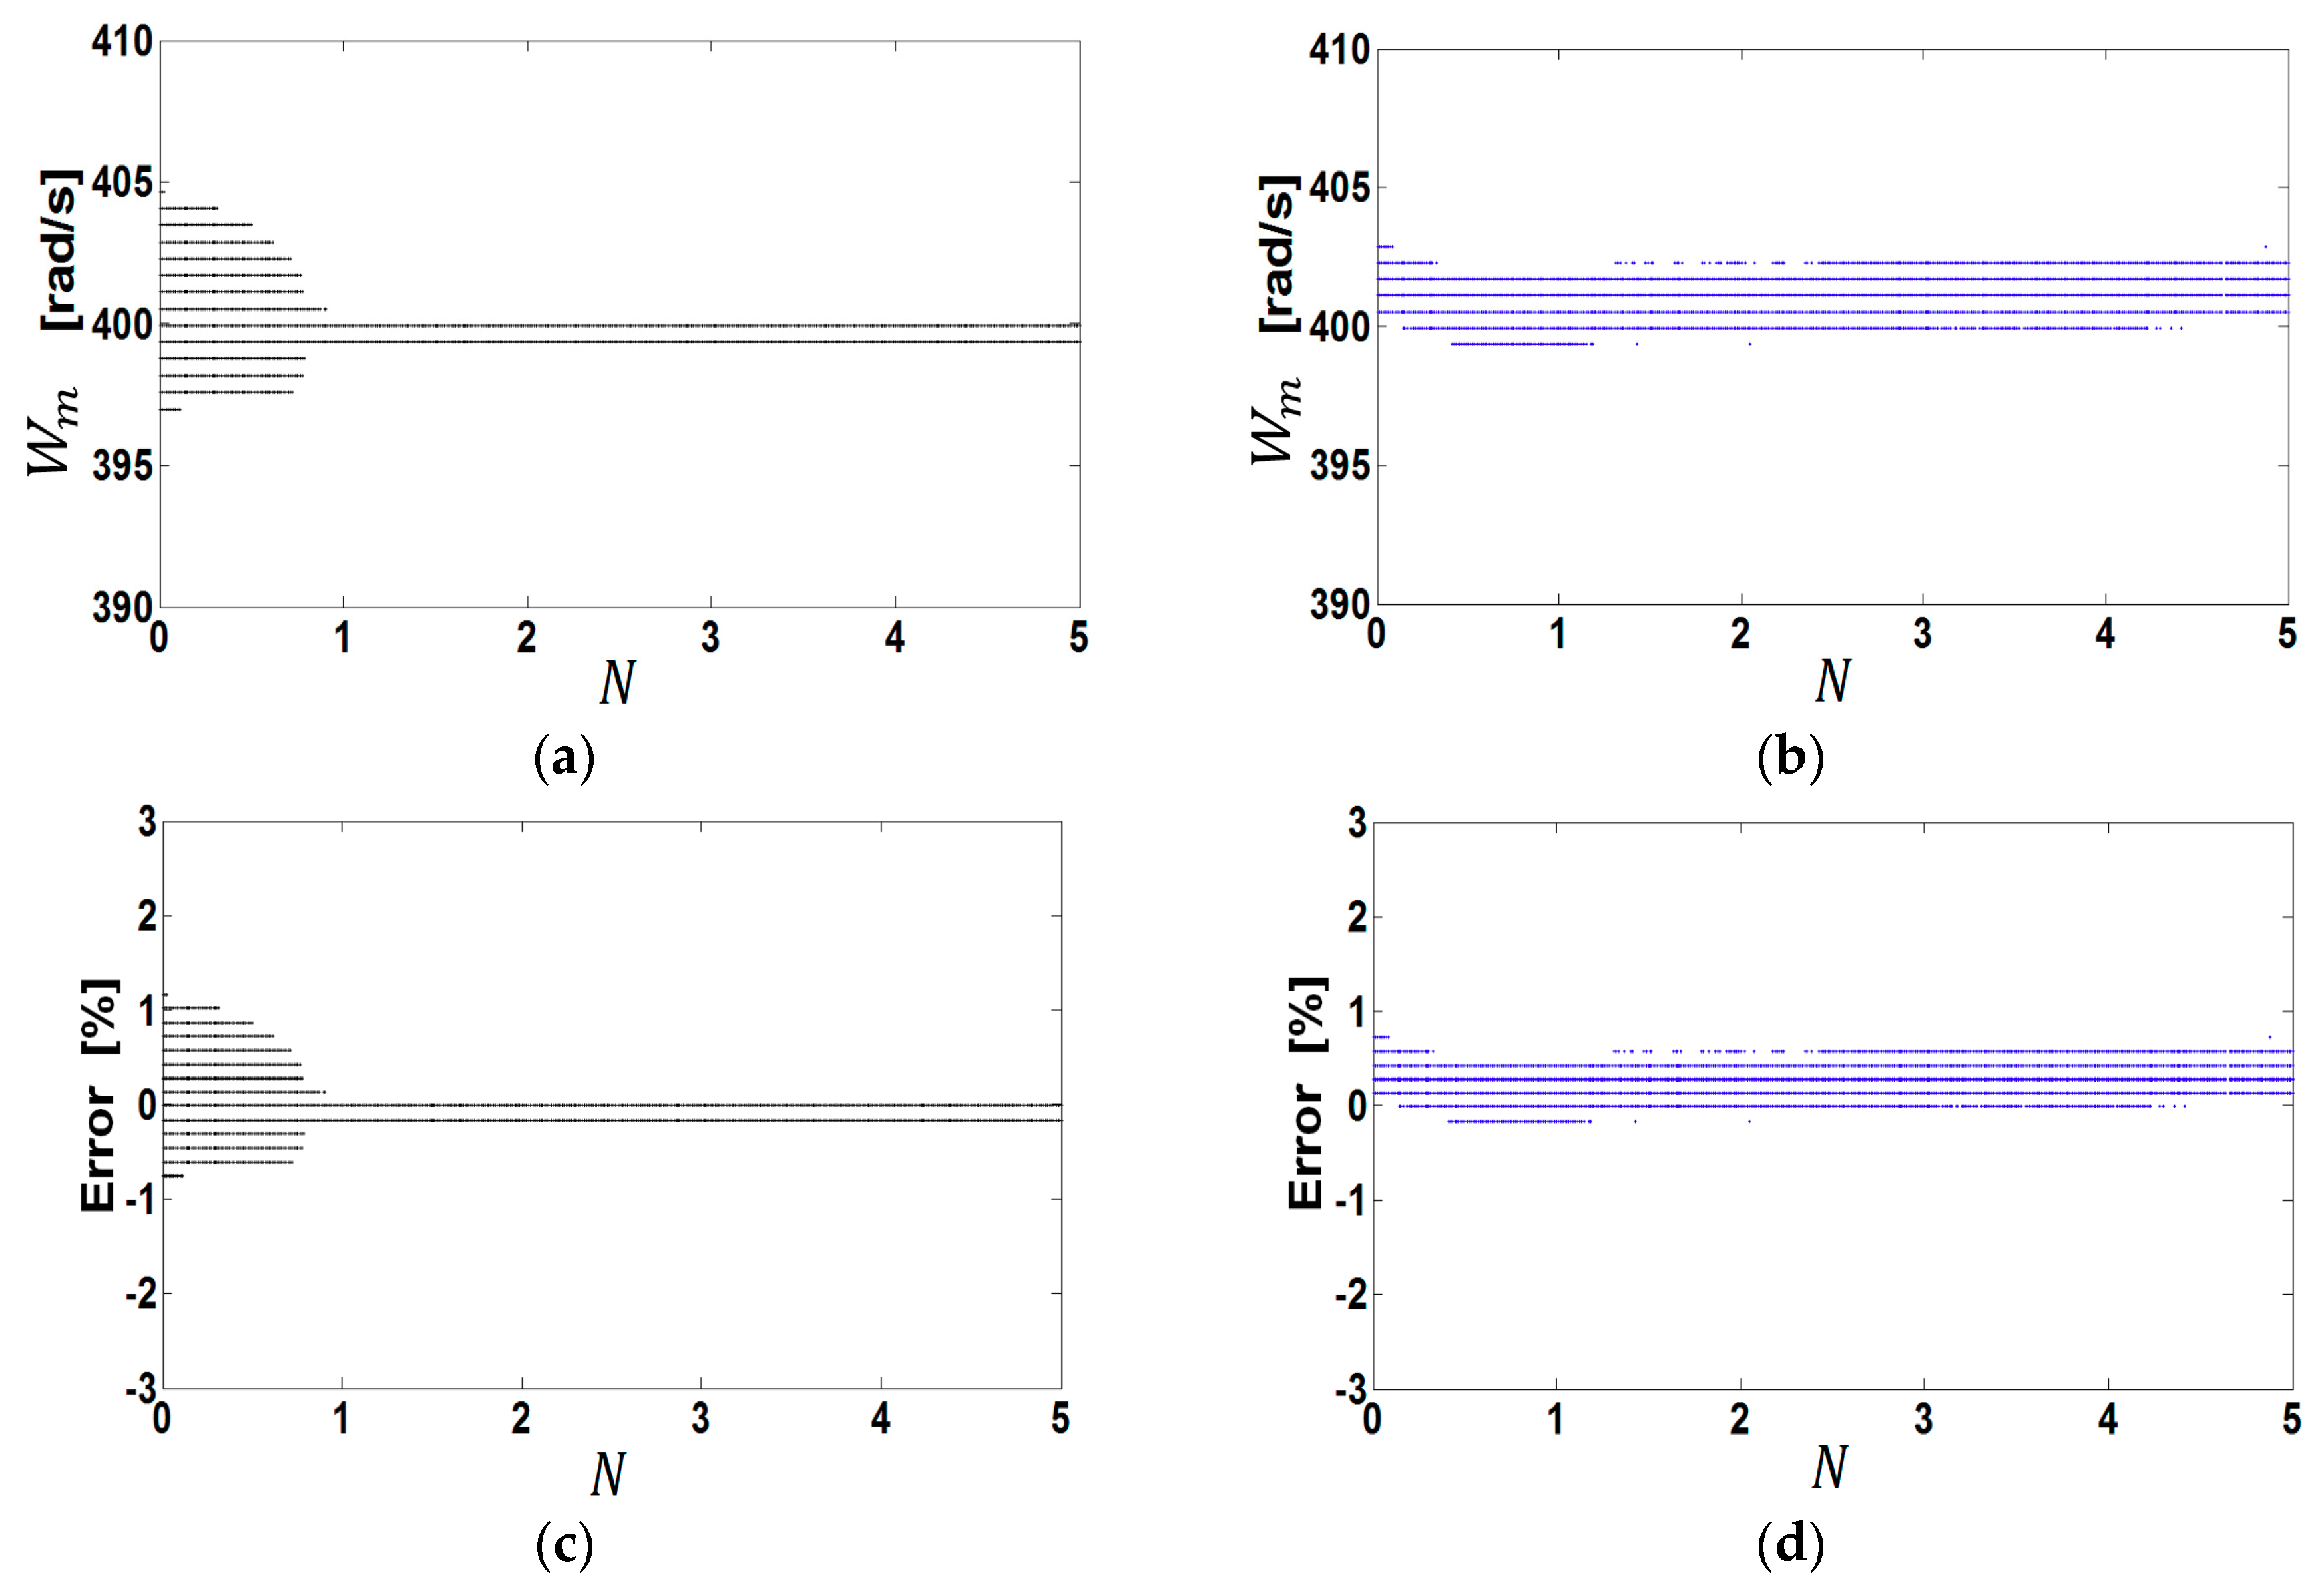
3.5. Behavior of the System When the Control Parameter of the FPIC Is Changed
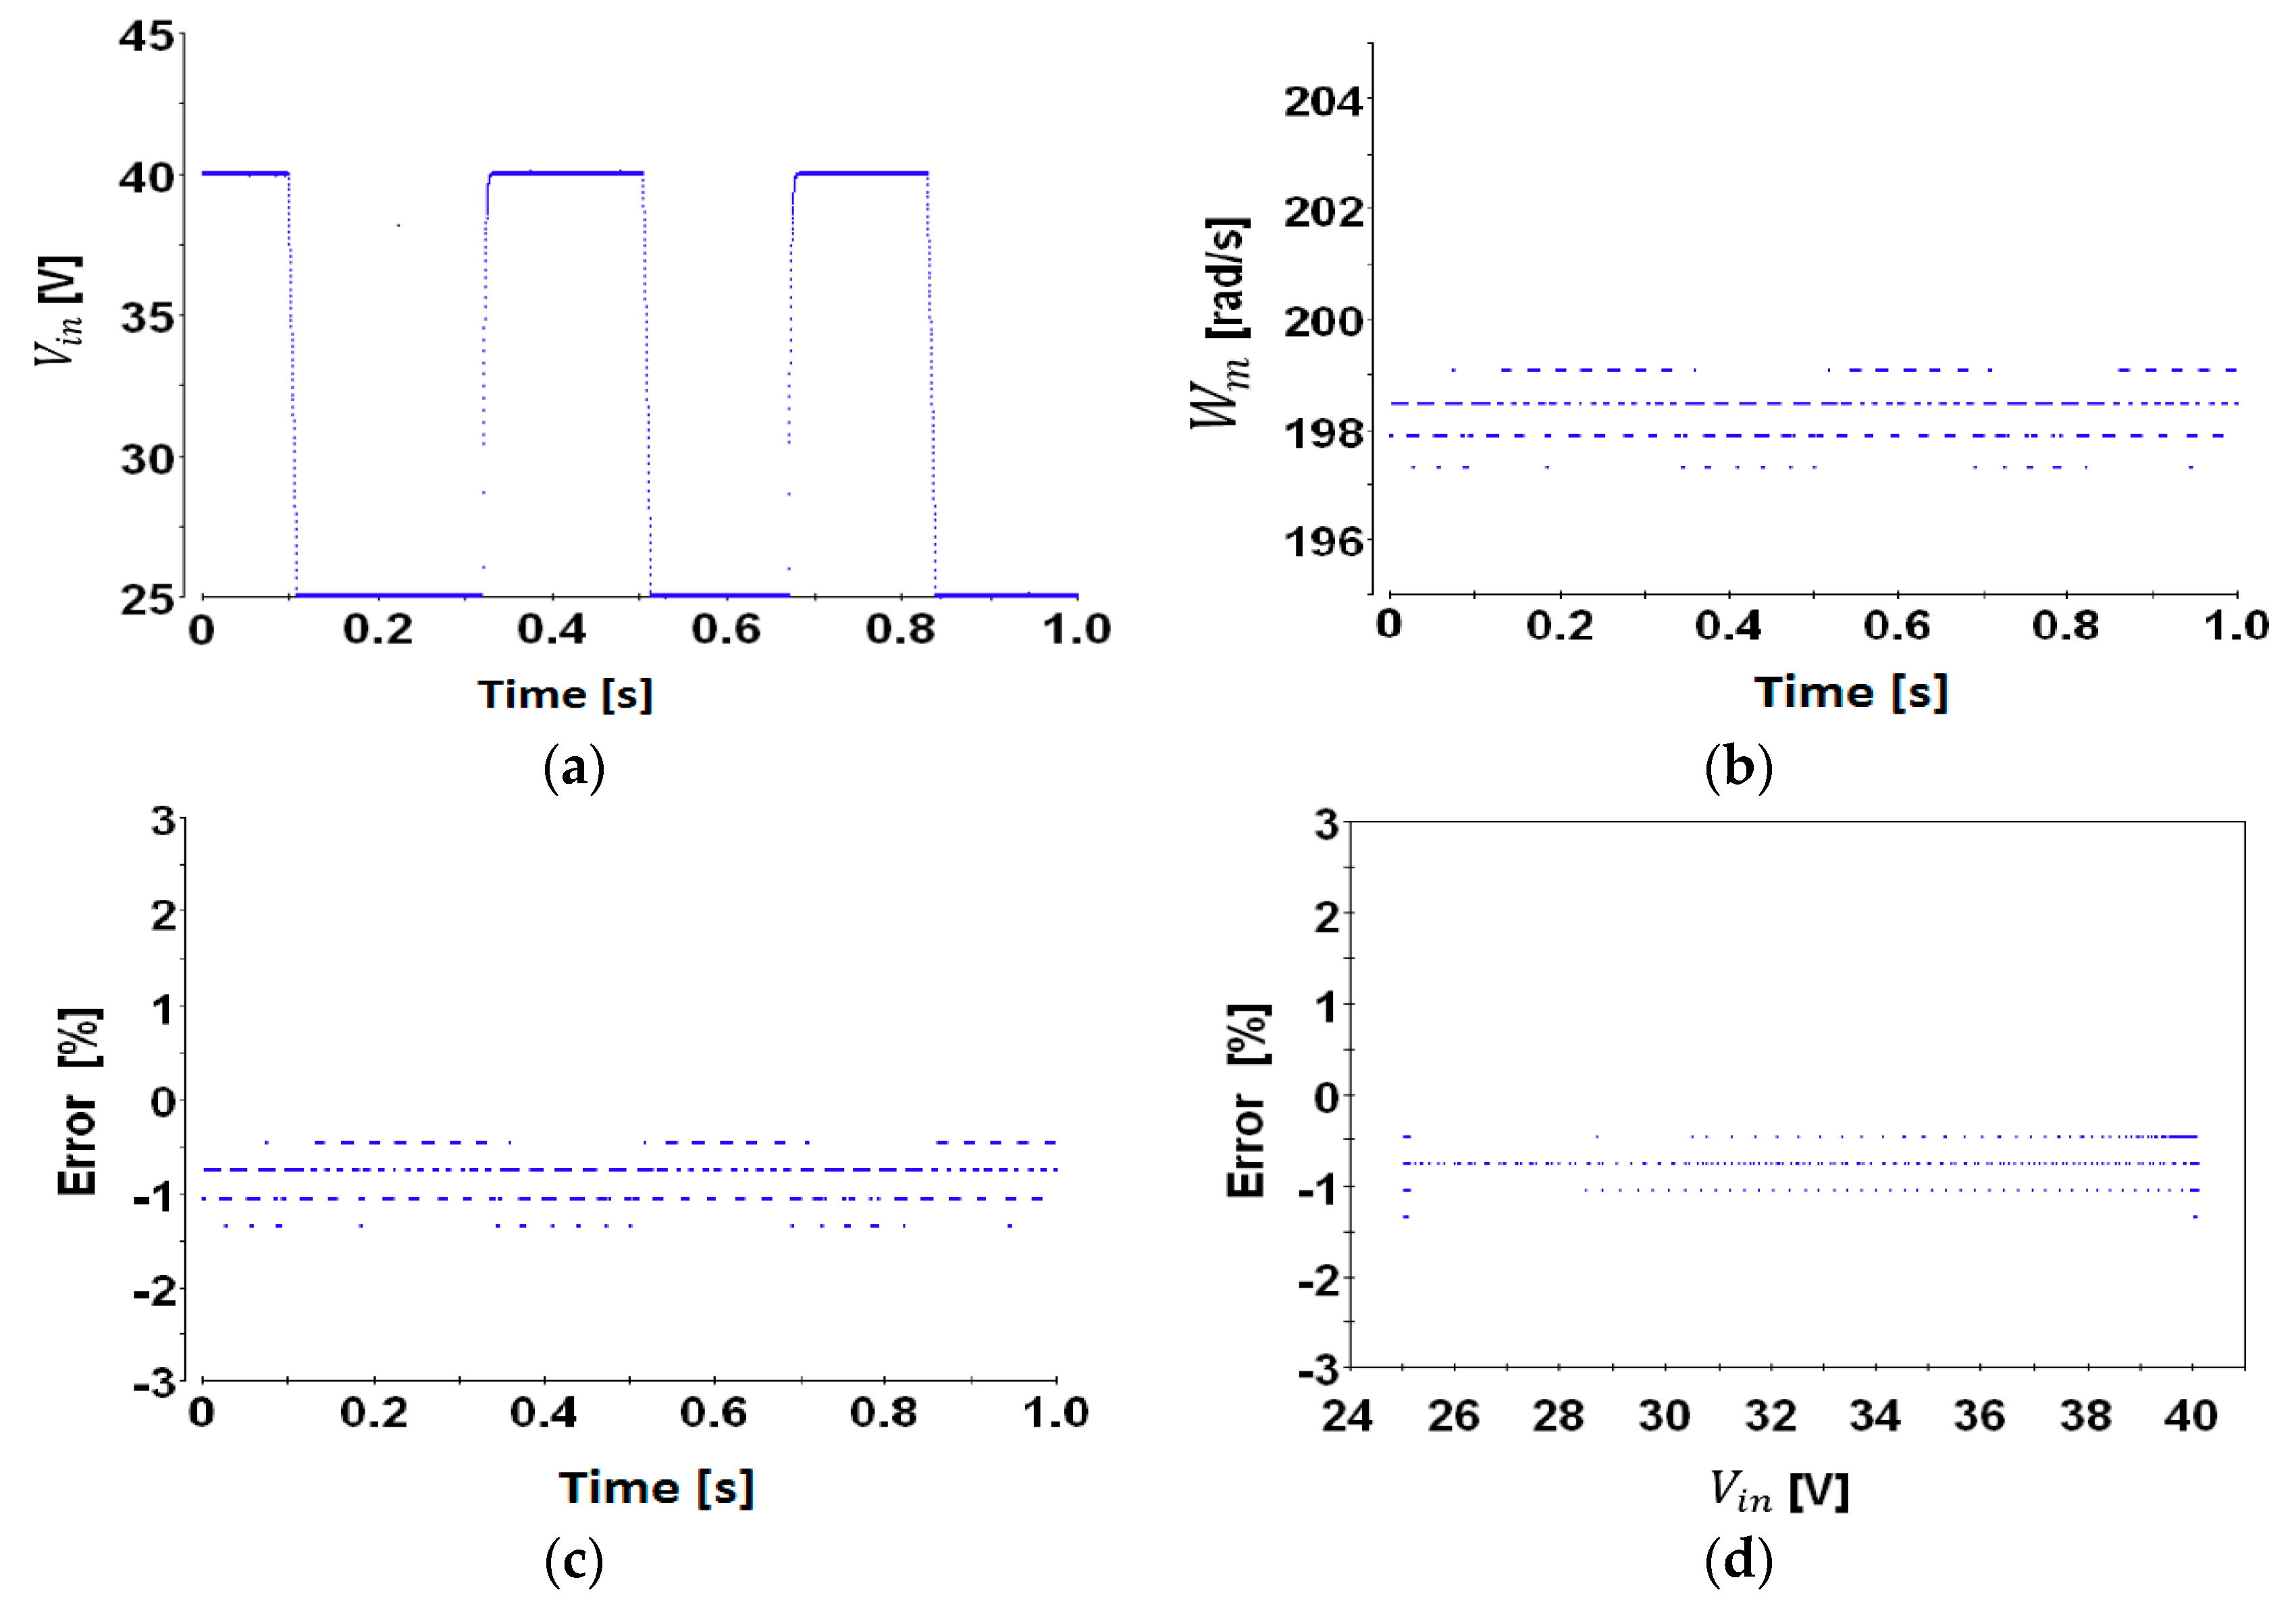
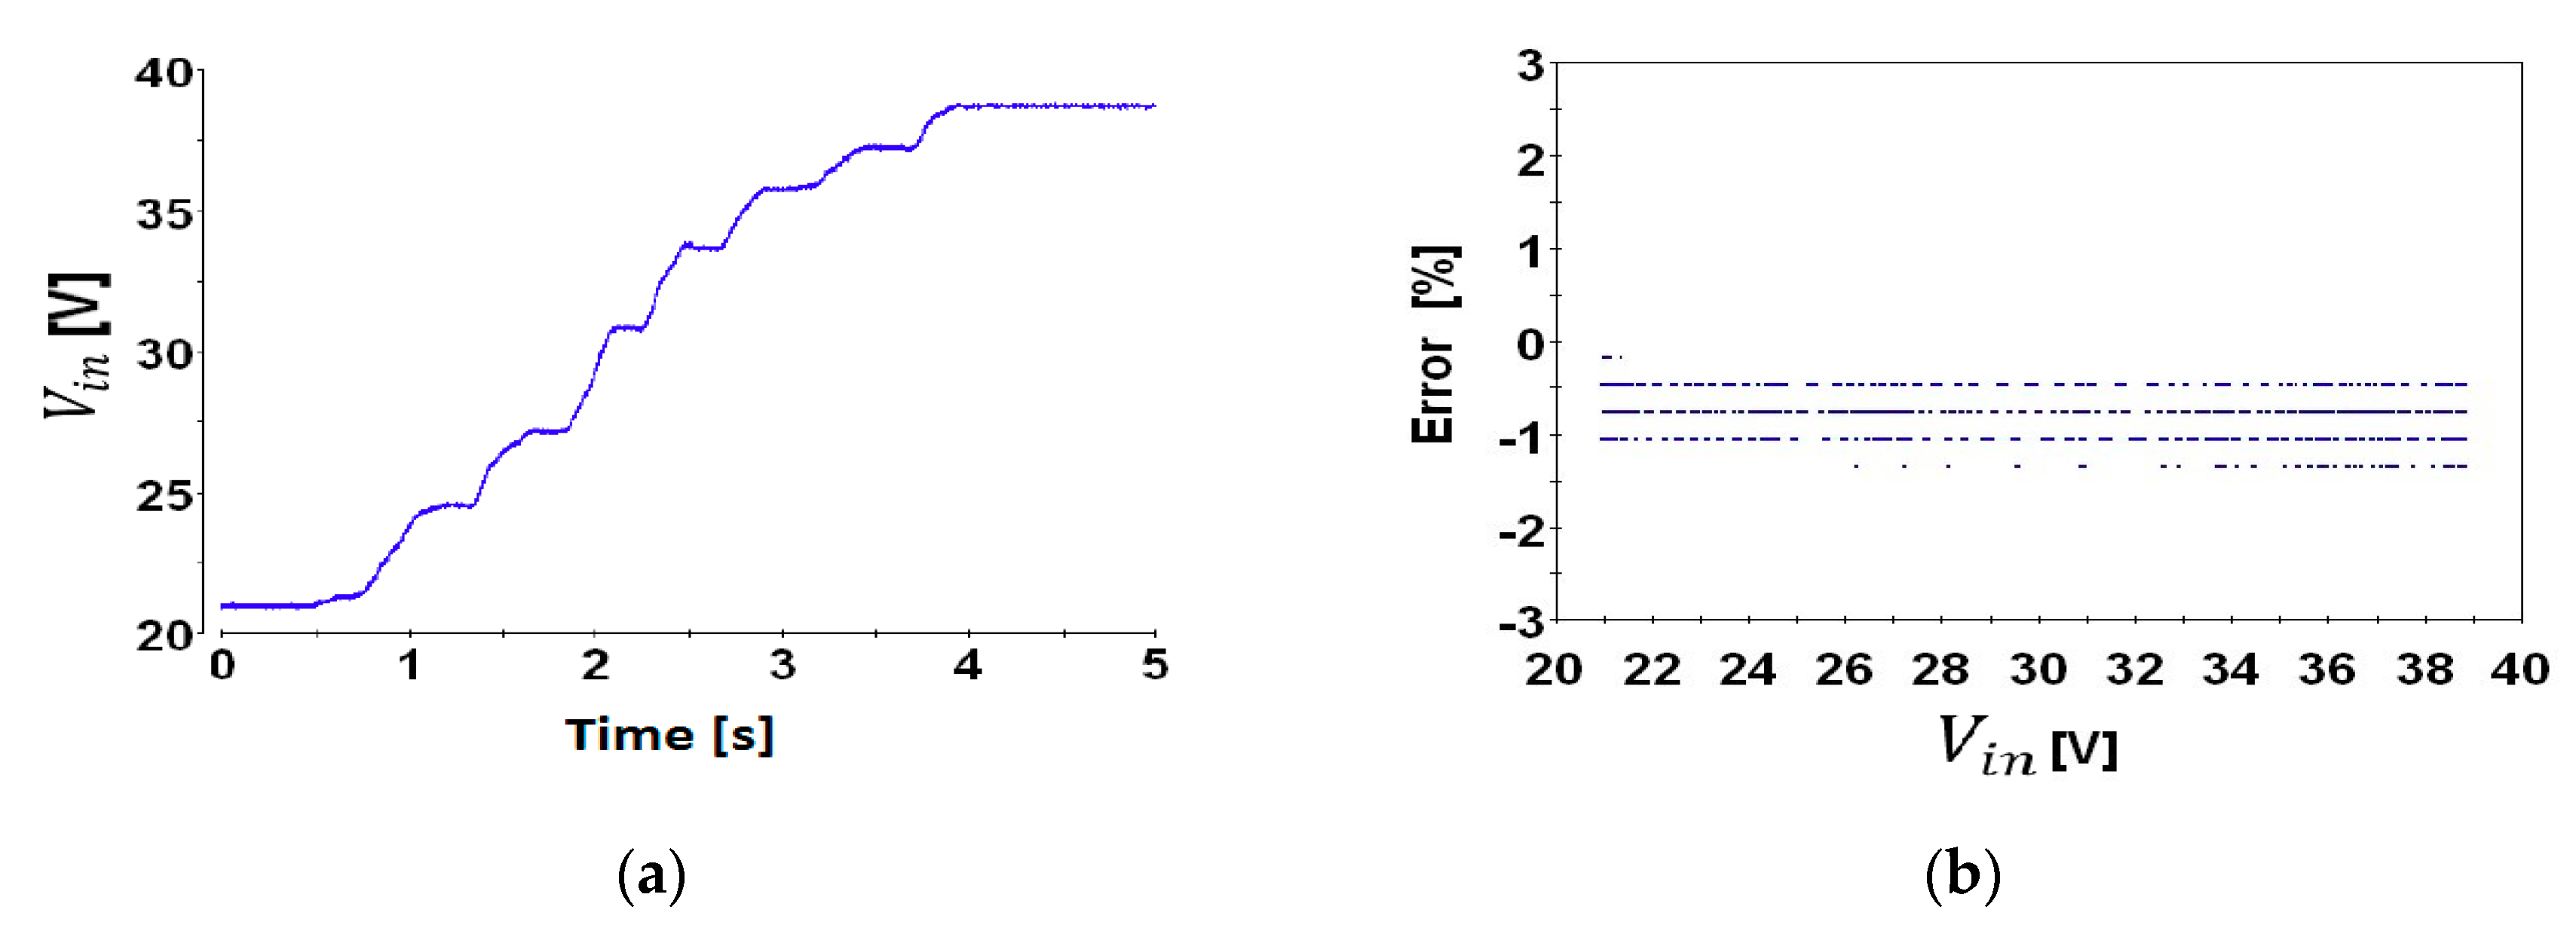
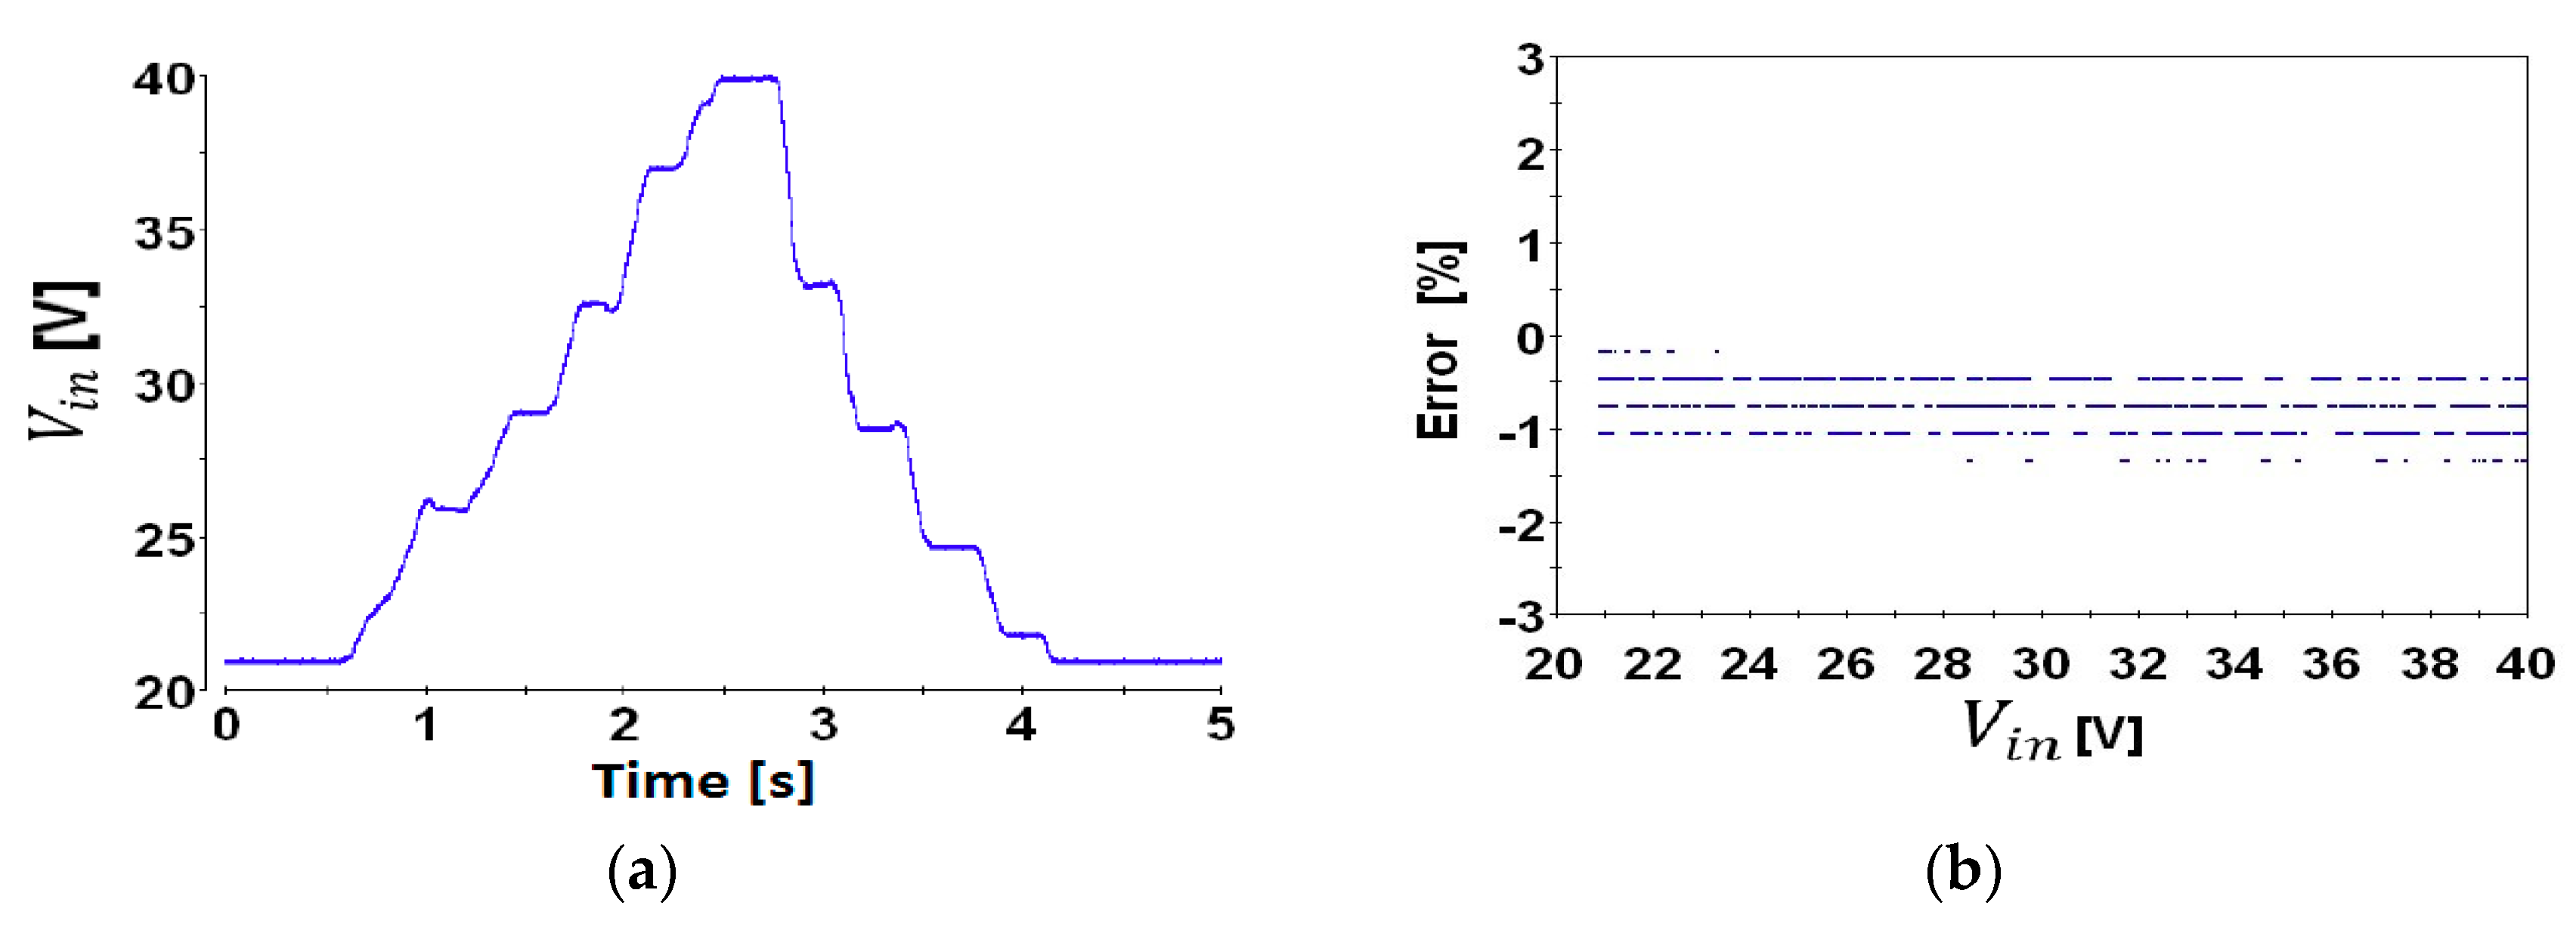
3.6. Perturbation at the Input Voltage
4. Conclusions
Author Contributions
Funding
Acknowledgments
Conflicts of Interest
References
- Cuong, N.D.; Van Lanh, N.; Dinh, G.T. An Adaptive LQG Combined With the MRAS—Based LFFC for Motion Control Systems. J. Autom. Control Eng. 2015, 3, 130–136. [Google Scholar] [CrossRef]
- Sankardoss, V.; Geethanjali, P. PMDC Motor Parameter Estimation Using Bio-Inspired Optimization Algorithms. IEEE Access 2017, 5, 11244–11254. [Google Scholar] [CrossRef]
- Hilairet, M.; Auger, F. Speed sensorless control of a DC-motor via adaptive filters. IET Electr. Power Appl. 2007, 1, 601. [Google Scholar] [CrossRef]
- Hu, H.; Yousefzadeh, V.; Maksimovic, D. Nonuniform A/D Quantization for Improved Dynamic Responses of Digitally Controlled DC-DC Converters. IEEE Trans. Power Electron. 2008, 23, 1998–2005. [Google Scholar] [CrossRef]
- Fung, C.W.; Liu, C.P.; Pong, M.H. A Diagrammatic Approach to Search for Minimum Sampling Frequency and Quantization Resolution for Digital Control of Power Converters. In Proceedings of the 2007 IEEE Power Electronics Specialists Conference, Orlando, FL, USA, 17–21 June 2007; pp. 826–832. [Google Scholar]
- Taborda, J.A.; Angulo, F.; Olivar, G. Estimation of parameters in Buck converter with Digital-PWM control based on ZAD strategy. In Proceedings of the 2011 IEEE Second Latin American Symposium on Circuits and Systems (LASCAS), Bogota, Colombia, 23–25 February 2011; pp. 1–4. [Google Scholar]
- Zane, M. Erickson Impact of digital control in power electronics. In Proceedings of the 16th International Symposium on Power Semiconductor Devices & IC’s, Kawasaki, Japan, 24–27 May 2004; pp. 13–22. [Google Scholar]
- Hoyos, F.E.; Rincón, A.; Taborda, J.A.; Toro, N.; Angulo, F. Adaptive Quasi-Sliding Mode Control for Permanent Magnet DC Motor. Math. Probl. Eng. 2013, 2013, 693685. [Google Scholar] [CrossRef]
- Fossas, E.; Griñó, R.; Biel, D. Quasi-Sliding control based on pulse width modulation, zero averaged dynamics and the L2 norm. In Advances in Variable Structure Systems, Proceedings of the 6th IEEE International Workshop on Variable Structure Systems, Coolangatta, Australia, 7–9 December 2000; World Scientific: Singapore, 2000; pp. 335–344. [Google Scholar]
- Biel, D.; Fossas, E.; Ramos, R.; Sudria, A. Programmable logic device applied to the quasi-sliding control implementation based on zero averaged dynamics. In Proceedings of the 40th IEEE Conference on Decision and Control (Cat. No.01CH37228), Orlando, FL, USA, 4–7 December 2001; Volume 2, pp. 1825–1830. [Google Scholar]
- Ramos, R.R.; Biel, D.; Fossas, E.; Guinjoan, F. A fixed-frequency quasi-sliding control algorithm: Application to power inverters design by means of FPGA implementation. IEEE Trans. Power Electron. 2003, 18, 344–355. [Google Scholar] [CrossRef]
- Angulo, F.; Fossas, E.; Olivar, G. Transition from Periodicity to Chaos in a PWM-Controlled Buck Converter with ZAD Strategy. Int. J. Bifurc. Chaos 2005, 15, 3245–3264. [Google Scholar] [CrossRef]
- Angulo, F.; Olivar, G.; di Bernardo, M. Two-parameter discontinuity-induced bifurcation curves in a ZAD-strategy-controlled dc-dc buck converter. IEEE Trans. Circuits Syst. I Regul. Pap. 2008, 55, 2392–2401. [Google Scholar] [CrossRef]
- Fossas, E.; Hogan, S.J.; Seara, T.M. Two-parameter bifurcation curves in power electronics converters. Int. J. Bifurc. Chaos 2009, 19, 349–357. [Google Scholar] [CrossRef]
- Hoyos, F.E.; Candelo-Becerra, J.E.; Toro, N. Numerical and experimental validation with bifurcation diagrams for a controlled DC–DC converter with quasi-sliding control. TecnoLógicas 2018, 21, 147–167. [Google Scholar] [CrossRef]
- Di Bernardo, M.; Budd, C.; Champneys, A. Grazing, skipping and sliding: Analysis of the non-smooth dynamics of the DC/DC buck converter. Nonlinearity 1998, 11, 859–890. [Google Scholar] [CrossRef]
- Yuan, G.; Banerjee, S.; Ott, E.; Yorke, J.A. Border-collision bifurcations in the buck converter. IEEE Trans. Circuits Syst. I Fundam. Theory Appl. 1998, 45, 707–716. [Google Scholar] [CrossRef]
- Hoyos, F.E.; Candelo, J.E.; Silva-Ortega, J.I. Performance evaluation of a DC-AC inverter controlled with ZAD-FPIC. Inge CUC 2018, 14, 9–18. [Google Scholar] [CrossRef]
- Biel, D.; Cardoner, R.; Fossas, E. Tracking Signal in a Centered Pulse ZAD Power Inverter. In Proceedings of the International Workshop on Variable Structure Systems, Sardinia, Italy, 5–7 June 2006; pp. 104–109. [Google Scholar]
- Biel, D.; Fossas, E.; Guinjoan, F.; Ramos, R. Interleaving quasi-sliding mode control of parallel-connected inverters. In Proceedings of the 2008 International Workshop on Variable Structure Systems, Antalya, Turkey, 8–10 June 2008; pp. 337–342. [Google Scholar]
- Angulo, F.; Olivar, G.; Taborda, J.; Hoyos, F. Nonsmooth dynamics and FPIC chaos control in a DC-DC ZAD-strategy power converter. In Proceedings of the ENOC, EUROMECH Nonlinear Dynamics Conference, Saint Petersburg, Russia, 6–10 July 2008; pp. 1–6. [Google Scholar]
- Rincón, A.; Hoyos, F.E.; Angulo, F. Controller Design for a Second-Order Plant with Uncertain Parameters and Disturbance: Application to a DC Motor. Abstr. Appl. Anal. 2013, 2013, 169519. [Google Scholar] [CrossRef]
- Hoyos, F.E.; Candelo, J.E.; Taborda, J.A. Selection and validation of mathematical models of power converters using rapid modeling and control prototyping methods. Int. J. Electr. Comput. Eng. 2018, 8, 1551. [Google Scholar] [CrossRef]
- Hoyos, F.E.; Burbano, D.; Angulo, F.; Olivar, G.; Toro, N.; Taborda, J.A. Effects of Quantization, Delay and Internal Resistances in Digitally ZAD-Controlled Buck Converter. Int. J. Bifurc. Chaos 2012, 22, 1250245. [Google Scholar] [CrossRef]


| Parameter | Description | Value |
|---|---|---|
| Pr | Rated power | 250 W |
| Vr | Rated voltage | 42 VDC |
| Ir | Rated current | 6 A |
| Rated speed | 4000 RPM |
| Parameter | Description | Value |
|---|---|---|
| Internal resistance of the source | 0.84 Ω | |
| Input voltage | 40.086 V | |
| Diode forward voltage | 1.1 V | |
| Inductance | 2.473 mH | |
| Internal resistance of the inductor | 1.695 Ω | |
| Capacitance | 46.27 µF | |
| Armature resistance | 2.7289 Ω | |
| Armature inductance | 1.17 mH | |
| Viscosity friction coefficient | 0.000138 (N·m/rad/s) | |
| Inertia moment | 0.000115 (kg·m2) | |
| Motor torque constant | 0.0663 (N·m/A) | |
| Voltage constant | 0.0663 (V/rad/s) | |
| Friction torque | 0.0284 (N·m) | |
| Load torque | Variable (N·m) | |
| Speed of the motor [rad/s] | 28 bits | |
| Armature current [A] | 12 bits | |
| Voltage of the motor [V] | 12 bits | |
| Current in the inductor [A] | 12 bits |
| Parameter | Description | Value |
|---|---|---|
| Input voltage | 40.086 V | |
| Reference speed | Variable (rad/s) | |
| Control parameter of FPIC | 1 | |
| Fc | Commutation frequency | 6 kHz |
| Fs | Sample frequency | 6 kHz |
| 1T_p | 1 delay period | 166.6 µs |
| Bifurcation parameter | Variables | |
| Duty cycle | 10 bits |
| Controller | Mp (%) | ts (s) | Error (%) |
|---|---|---|---|
| Closed-loop system in the simulation test | 0.5715 | 0.1473 | −0.1645 |
| Closed-loop system in the experimental test | Overdamped | 0.1859 | 0.4245 |
| Parameter | Mp (%) | ts (s) | Error (%) |
|---|---|---|---|
| ( = 1) | 0.5717 | 0.1701 | −0.0173 |
| ( = 3) | Overdamped | 0.1701 | −0.0173 |
| ( = 5) | Overdamped | 0.1711 | −0.0173 |
| ( = 7) | Overdamped | 0.1737 | −0.1473 |
| ( = 9) | Overdamped | 0.1802 | −0.0173 |
| Parameter | Mp (%) | ts (s) | Error (%) |
|---|---|---|---|
| ( = 1) | Overdamped | 0.2311 | 0.2775 |
| ( = 3) | Overdamped | 0.2381 | 0.2772 |
| ( = 5) | Overdamped | 0.2414 | −0.3118 |
| ( = 7) | Overdamped | 0.2455 | −0.3118 |
| ( = 9) | Overdamped | 0.2505 | −0.4590 |
© 2018 by the authors. Licensee MDPI, Basel, Switzerland. This article is an open access article distributed under the terms and conditions of the Creative Commons Attribution (CC BY) license (http://creativecommons.org/licenses/by/4.0/).
Share and Cite
Hoyos Velasco, F.E.; Candelo-Becerra, J.E.; Rincón Santamaría, A. Dynamic Analysis of a Permanent Magnet DC Motor Using a Buck Converter Controlled by ZAD-FPIC. Energies 2018, 11, 3388. https://doi.org/10.3390/en11123388
Hoyos Velasco FE, Candelo-Becerra JE, Rincón Santamaría A. Dynamic Analysis of a Permanent Magnet DC Motor Using a Buck Converter Controlled by ZAD-FPIC. Energies. 2018; 11(12):3388. https://doi.org/10.3390/en11123388
Chicago/Turabian StyleHoyos Velasco, Fredy E., John E. Candelo-Becerra, and Alejandro Rincón Santamaría. 2018. "Dynamic Analysis of a Permanent Magnet DC Motor Using a Buck Converter Controlled by ZAD-FPIC" Energies 11, no. 12: 3388. https://doi.org/10.3390/en11123388
APA StyleHoyos Velasco, F. E., Candelo-Becerra, J. E., & Rincón Santamaría, A. (2018). Dynamic Analysis of a Permanent Magnet DC Motor Using a Buck Converter Controlled by ZAD-FPIC. Energies, 11(12), 3388. https://doi.org/10.3390/en11123388