Article

The Spatiotemporal Distribution Law of Microseismic Events and Rockburst Characteristics of the Deeply Buried Tunnel Group

1
Key Laboratory of Transportation Tunnel Engineering, Ministry of Education,Southwest Jiaotong University, Chengdu 610031, China
2
School of civil engineering, Changsha University of Science and Technology, Changsha 410076, China
3
Guangxi Communication Investment Group CO., Ltd., Nanning 530022, China
4
China Railway No. 2 Engineering Group Co., Ltd., Chengdu 610032, China
*
Author to whom correspondence should be addressed.
Energies 2018, 11(12), 3257; https://doi.org/10.3390/en11123257
Submission received: 2 October 2018 / Revised: 14 November 2018 / Accepted: 14 November 2018 / Published: 22 November 2018

Abstract

:
Rockburst disaster is one of the prominent problems faced by deep underground engineering. Microseismic (MS) monitoring techniques can be used to warn of rockburst in tunnels to provide scientific basis for rock burst prevention and control measures. Described in this paper, is an MS monitoring system based on MS source location with hierarchical strategy implemented in the tunnel group of the Jinping II hydropower station in Sichuan Province, China. The spatiotemporal distribution of MS events was analyzed in the construction process and the size effect of rockburst risk discussed by statistical analysis and numerical calculation of rockburst in seven tunnels. The results show that the active period of microseisms and the high-incidence period of rockburst are within 1.5 h after the rock disturbance. The MS events within 1D from the tunnel wall are the most intensive and are mainly concentrated near the heading face, the side wall, and the left spandrel. At the construction site, the accuracy rate of rockburst prediction is 61.8%, of which the accuracy rate of the medium and strong rockburst is 80.3%. Based on field statistics of rockburst, the increase of the tunnel excavation section size can reduce the rockburst strength to a certain extent, which is consistent with the numerical simulation results.

1. Introduction

The increasing number of long and deeply buried tunnels has brought great challenges to the construction and operation of the project, in which rockburst is a prominent problem [1,2,3,4]. Rockburst is an important geological sign of rock mass with high ground stress [5]. The phenomenon of rockburst is different due to the accumulation level of geostress, the characteristics of the rock and the shape of the underground engineering contour [6,7,8]. It is a kind of dynamic instability geological disaster in that the elastic strain energy of the surrounding rock can be released suddenly and produces burst release, exfoliation, ejection, and even throw in the rock mass caused by the brittle failure of the excavation unloading during or after the excavation of the underground engineering in the high stress zone [9,10]. Studies have shown that rockburst generally occurs in underground engineering with hard brittle rock mass under high geostress conditions, and the occurrence process is short without obvious premonition [11,12,13,14]. Rockburst is becoming an important factor affecting the construction of deeply buried underground engineering. It not only damages engineering equipment, affects the construction progress, but also seriously threatens the safety of construction personnel [15,16,17]. Therefore, the prediction of rockburst is of great significance for the smooth construction in deep underground engineering.
In recent years, microseismic (MS) technology has been gradually taken as a safety monitoring and early warning method for underground engineering. MS monitoring technology has been widely used in mines and underground projects in Canada [18], South Africa [19,20], Australia [21], and other countries. The rock mass generally produces many small micro-cracks before macroscopic damage because of the non-uniform rock medium. These micro-cracks produce elastic waves in the form of elastic energy release, and can be received by MS sensors installed in the effective range. By using multiple sensors to receive this elastic wave information, the moment, position, and magnitude of the micro-cracks occurrence in the rock mass can be obtained through an inversion method, so as to predict the occurrence of rockburst [22,23,24,25,26].
Srinivasan et al. [27] used MS events, MS dissipative energy, and event frequency as short-term predictors of rockburst and applied them to rockburst prediction in the Kolar gold mine in India. The spatiotemporal evolutional laws of MS events and the relationships between MS monitoring information and the excavation process for the Huainan coal mine were studied by Xu et al. [28]. The comprehensive field methods for rockburst monitoring were presented by Li et al. [29], and the evolutionary characteristics of cracks, rock deformation, and elastic wave velocities for the evaluation of the preparation and evolution of a rockburst were obtained. Dai et al. [30,31,32] analyzed the evolution laws of multiple MS parameters, including the MS event count, the energy release, the energy index, the apparent volume, the dominant frequency, the b value, and the fractal dimension, obtaining the typical abnormal variations prior to a large deformation. Two MS parameters for the comprehensive microseismicity and intensity of the MS events in the rockburst development process were proposed by Feng et al. [33,34]. Tang et al. [35] comparing with earthquake prediction, discussed the feasibility in principle of MS monitoring and prediction of rockburst. The relationship between the magnitude and frequency, the magnitude and the energy concentration degree of MS events by using automatic and manual filtering methods were reported by Ma et al. [36]. Xu et al. [37] analyzed the spatiotemporal distribution of MS activities to identify the excavation damage zones and potential risk regions in underground caverns. Due to the complexity of the rockburst process and its influencing factors, the study of rockburst data in engineering sites is particularly important. Many scholars have carried out statistical analysis on the rockburst in China, such as Tianshengqiao II Hydropower Station diversion tunnel, Taipingyi tunnel, Erlangshan tunnel, and Qinling tunnel, which provided important information for theoretical research and prediction of rockburst [38,39,40,41,42].
Currently, the prediction and evaluation methods for rockburst risks have achieved good results in engineering practice, but the main factors considered mainly focus on stress field and rock mass mechanical properties, and the influence on excavation size effect is not directly involved. The relationship between rockburst strength and cavern excavation size is still lacking in qualitative knowledge. The size effect has always been a hot topic in the field of rock mechanics, but there are no effective research and calculation tools. The cavern size design and risk assessment mainly use the engineering analogy method, but due to the difference of stress field and rock mass conditions, the method is not completely accurate. Therefore, in this paper, an MS monitoring system based on MS source location with hierarchical strategy is implemented in the tunnel group of the Jinping II hydropower station in Sichuan Province, China. The spatiotemporal distribution of MS events is analyzed in the process of construction. The size effect of rockburst risk is discussed in detail by statistical analysis and numerical calculation of rockburst in seven tunnels. The results can provide a useful reference for rockburst prediction and evaluation in deep-buried underground constructions.

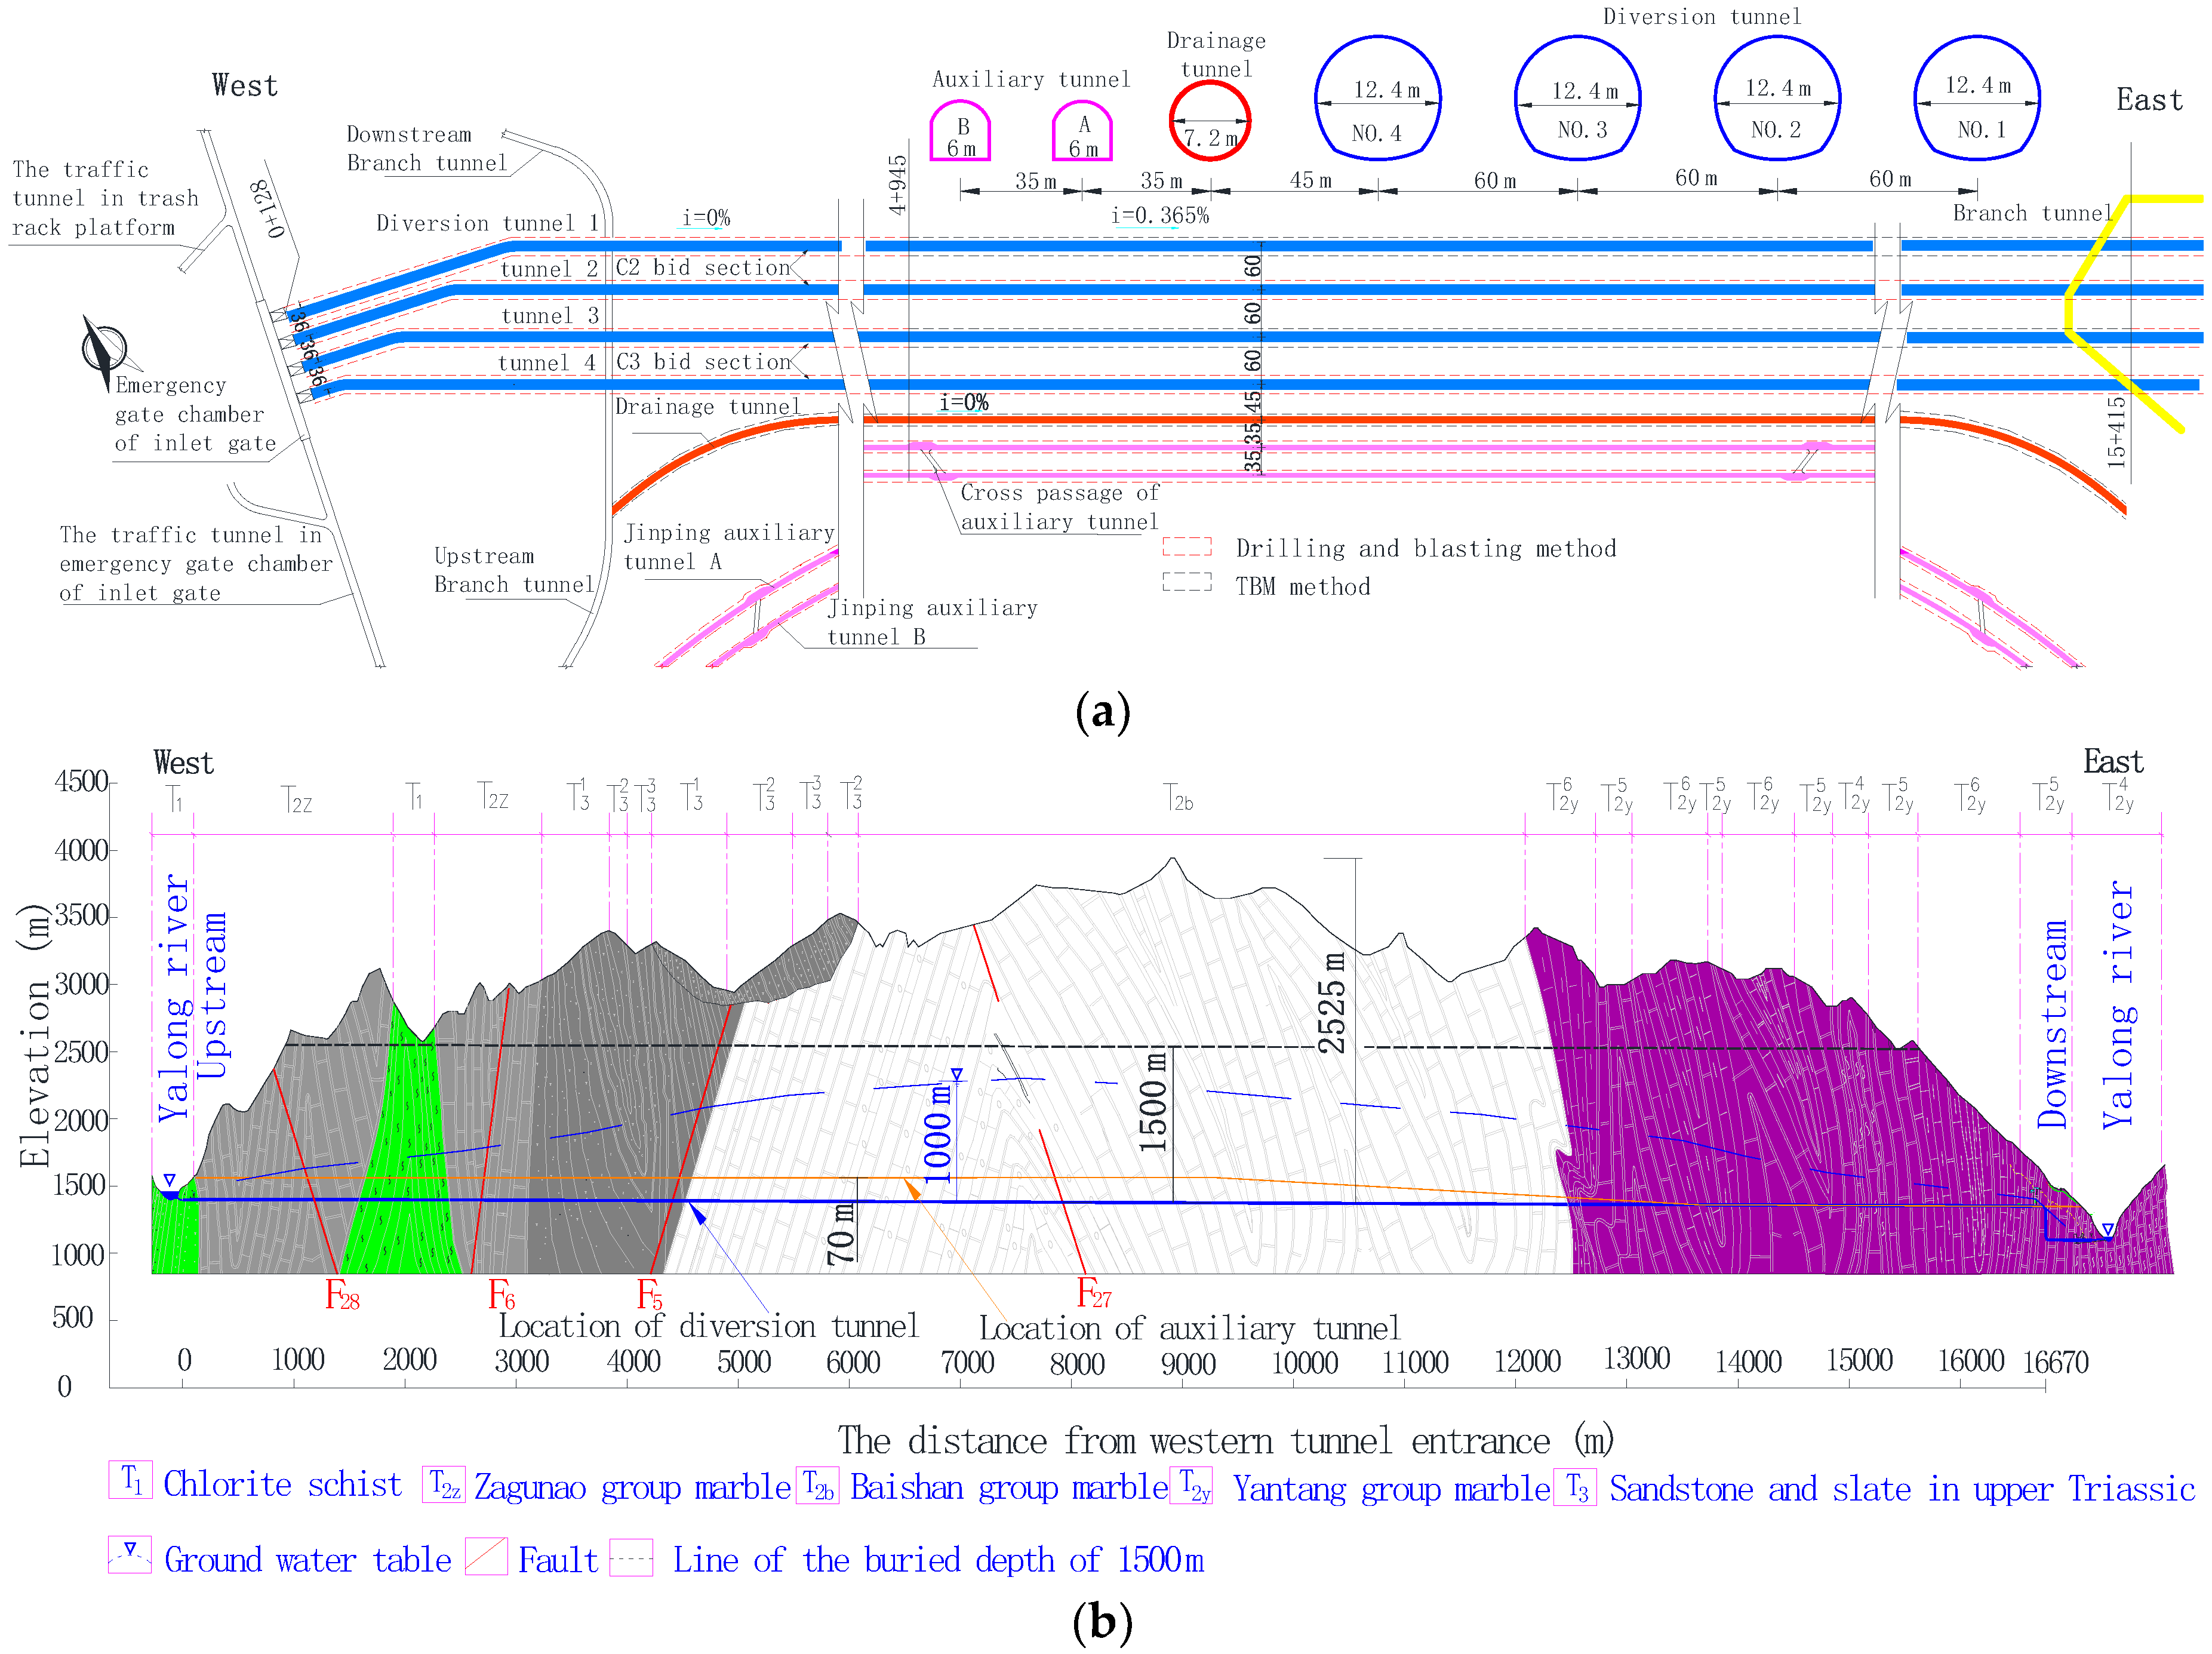
2. Project Overview and Geological Conditions

In the construction of the diversion system of the Jinping II hydropower station, the Jinping auxiliary tunnel A line and B line was first constructed. After that, four diversion tunnels and drainage tunnels were constructed to form seven basic parallel tunnels as shown in Figure 1a. The Jinping auxiliary tunnel was constructed by the drilling and blasting method, the standard section is the gate-shaped section with an excavation area of 45 m2 and the emergency stop area is the horseshoe-shaped section with an excavation area of 55 m2. The construction of the diversion tunnels combined the drilling and blasting method and the tunneling boring machine (TBM). The bid-section adopted by the drilling and blasting method is a horseshoe-shaped section excavated by the bench method. The diameter of excavation is 13 m, and the excavation area of the upper section is 110 m2. A cross-passage was set up every 500 to 600 m in the diversion tunnel. The section is a gate shape, and the excavation area is 60 m2 by drilling and blasting. In order to solve the safety discharge of gushing water and provide a transportation channel for the diversion tunnels, a drainage tunnel was built between the auxiliary tunnel B and diversion tunnel 4. The drainage tunnel was excavated with full section TBM, the excavation diameter is 7.2 m, and the excavation area is 41 m2.
The Jinping II hydropower station is located at the eastern foothills of the Qinghai–Tibet Plateau in an area influenced by the collision of the Eurasian plate and the Indian Ocean plate. The rock masses along the diversion tunnels are mainly composed of middle and upper Triassic marble, limestone, crystalline limestone and sandstone, and slate. From east to west, the tunnels pass through various strata including marble of the Yantang (T2y) group, marble of the Baishan group (T2b), upper Triassic (T3) marble, marble of the Zagunao group, lower Triassic (T1) chlorite schist and metamorphic medium to fine sandstone as shown in Figure 1b. The strike of the steep bedding is parallel to the direction of the principal tectonic line. According to tectonic history and orientation, the faults in the project area can be divided into four structural groups in the NNE direction, NNW direction, NE-NEE direction, and NW-NWW direction (all have a steep inclined angle), respectively. The tensile and torsional joints are developed in the NNE direction and in the approximately EW (NWW and NEE) direction. Many approximately north–south trending tight folds and steeply dipping compressional or compressional-shear faults are found in the project region. F4 and F6 faults are Class I structural planes, and the other faults are Class II structural planes [36]. Class I structural planes refer to regional large faults, which control the stability of the crust in the construction area, extend for several kilometers or more, and have a fracture zone width of several meters to tens of meters. Class II structural planes refer to the large and medium faults extending from hundreds of meters to thousands of meters while the width is from tens of centimeters to meters. The surrounding rock is dominated by class II and III (hydraulic classification), and class IV and V account for about 23% to 30%, mainly concentrated in the T1 strata. The tunnels are generally 1500–2000 m below ground surface, with the maximum depth of 2525 m. The maximum in-situ stress in the engineering area is 80 MPa, the uniaxial compressive strength of marble is 60 to 120 MPa, and the strength–stress ratio of the surrounding rock is 0.75 to 1.5, which has strong and extremely strong rockburst conditions. Prediction and prevention of rockburst is the key to ensure construction safety.

3. MS Monitoring Scheme

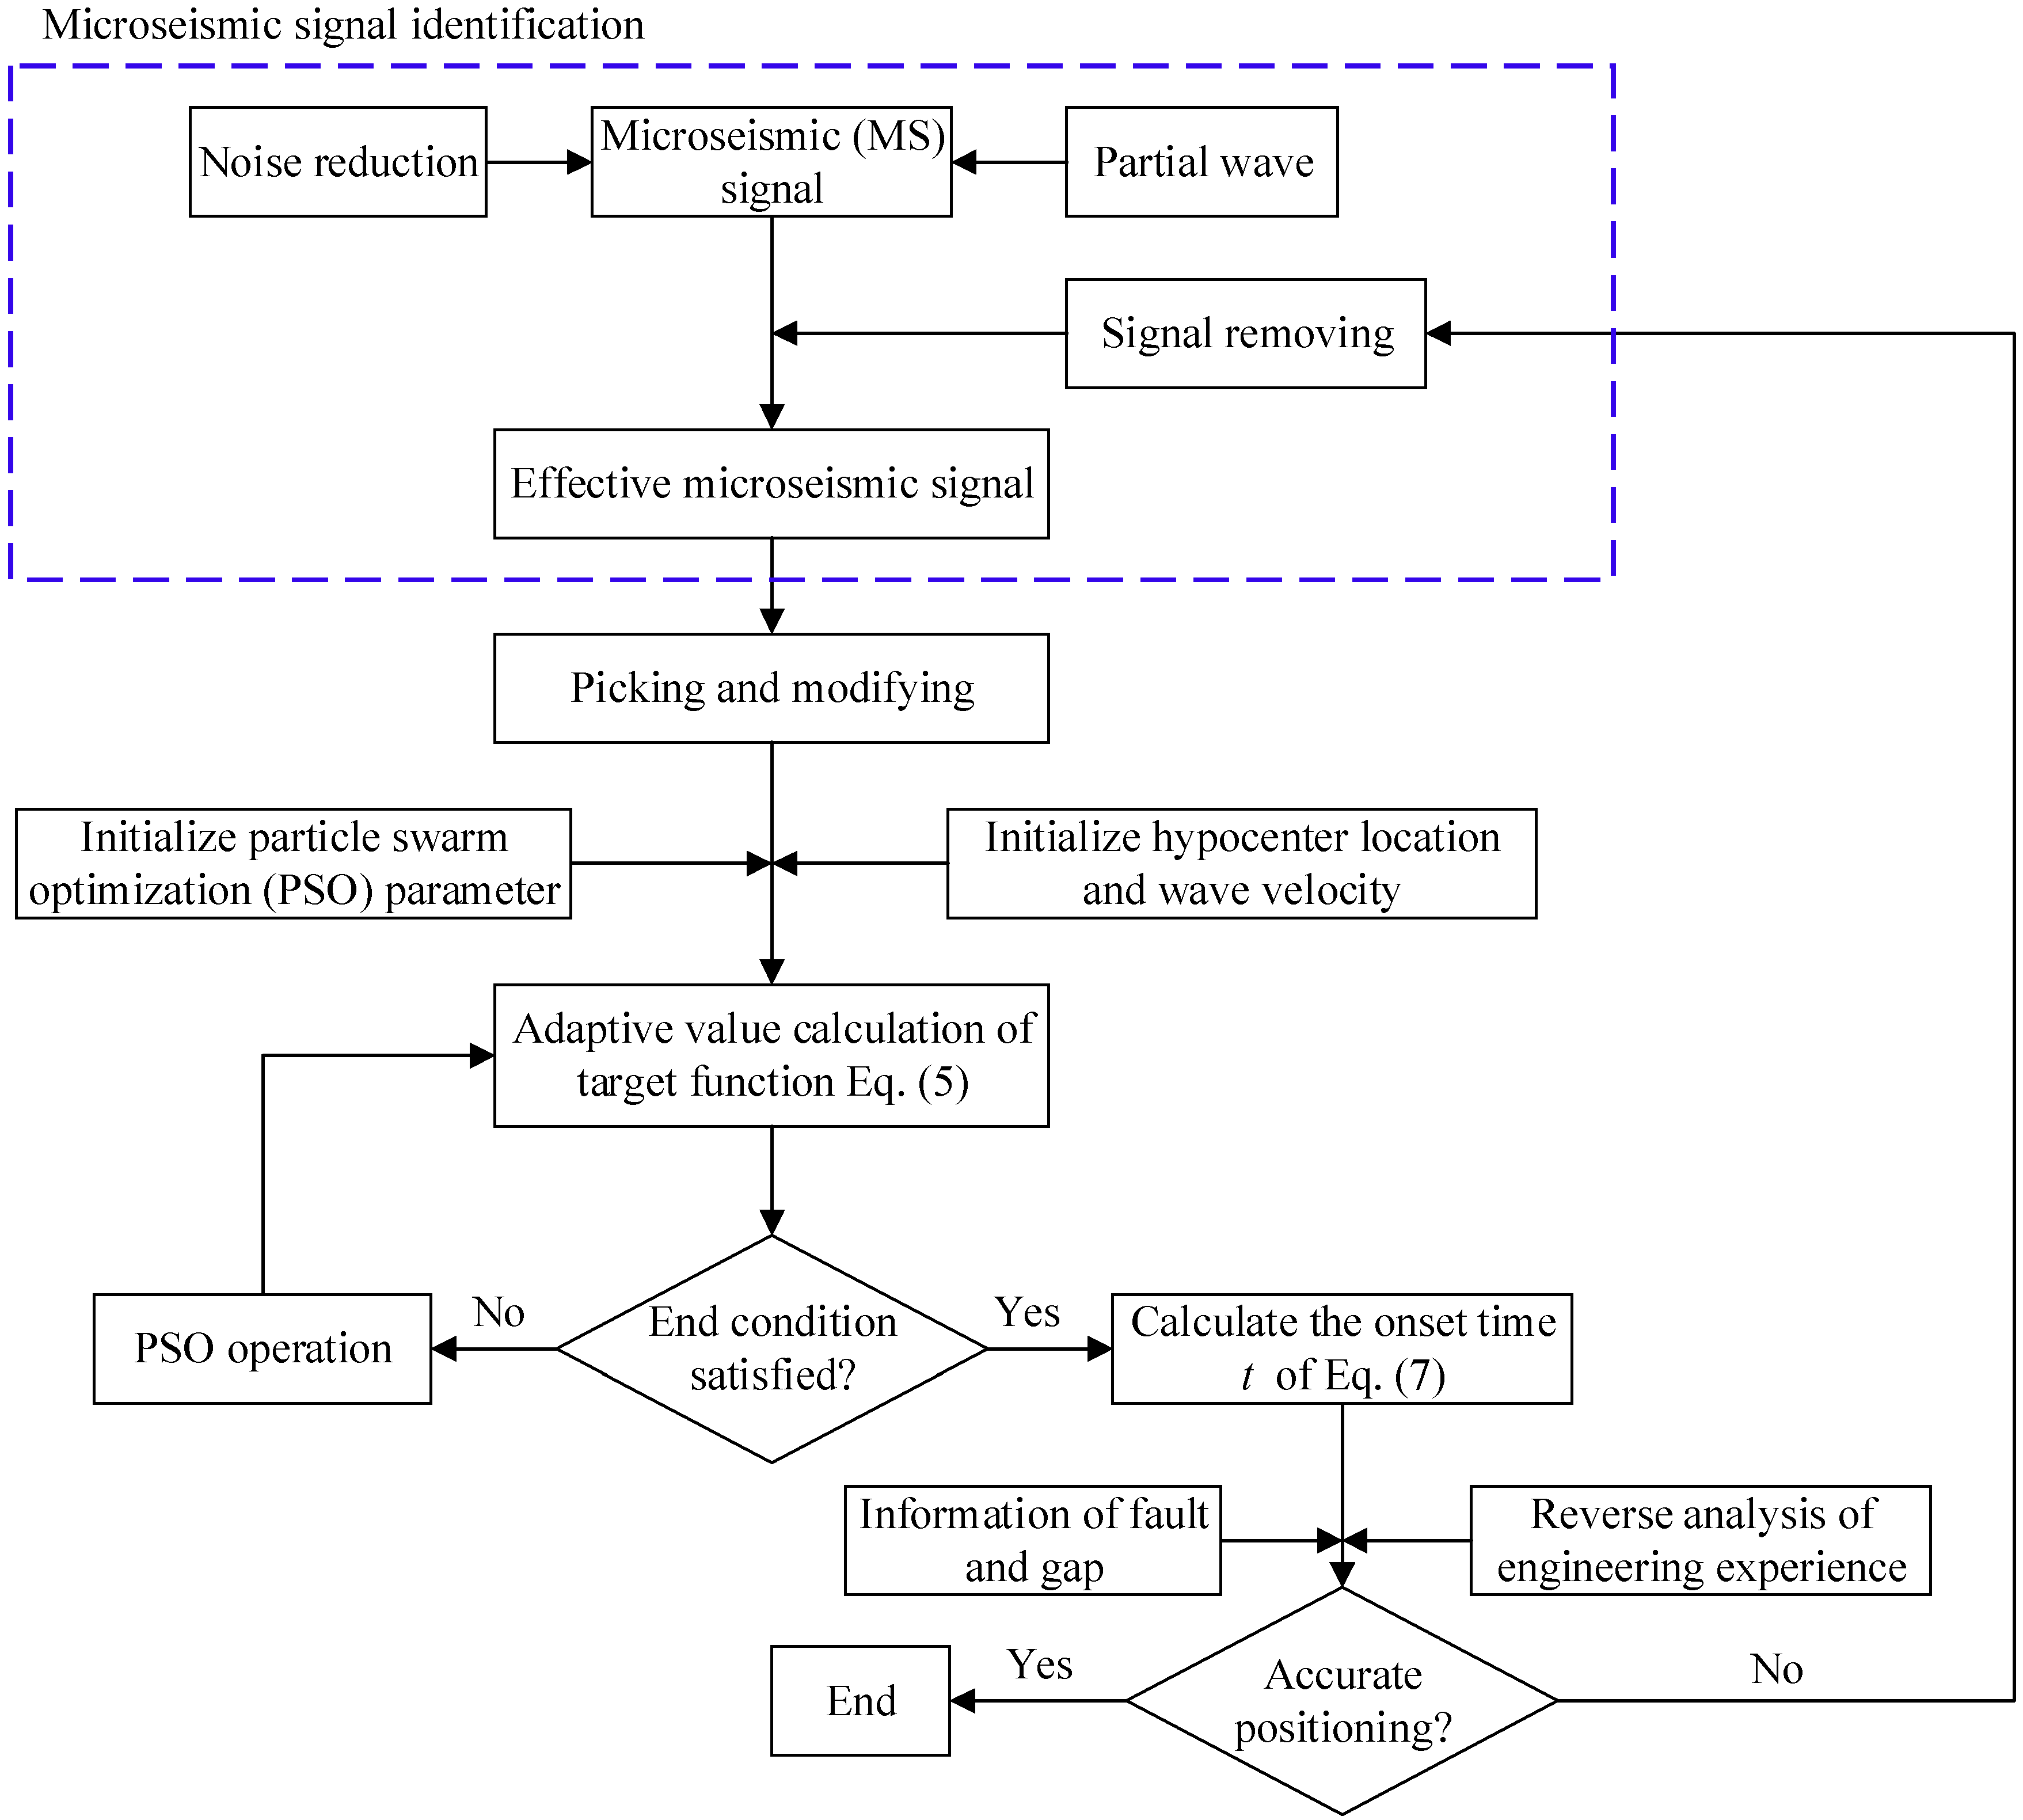
3.1. Method of MS Source Hierarchical Location

The method of MS source hierarchical location is based on minimizing the residual sum of squares of the calculated and monitored difference of arrival time between two adjacent sensors. Particle swarm optimization (PSO) is applied to identify the location and velocity model of the MS source. Then, the analytic solution of the microseism occurrence time can be obtained by minimizing the residual sum of squares of the calculated and monitored arrival time according to the identified velocity structure and MS source. The problem that the velocity model is inaccurate and the solution is not unique is solved well, and the location accuracy, the convergence speed, and the stability of the algorithm are improved [43].
(1) Principle of MS source hierarchical location
The calculated arrival time of the i th sensor is assumed as [44]:
t i = t + ( x i x ) 2 + ( y i y ) 2 + ( z i z ) 2 v  
where t is the seismogenic time (ms), (xi, yi, zi) are the coordinates of the i th sensor, (x, y, x) are the coordinates of MS source location (m), v is the equivalent velocity of the MS signal propagating in the medium (m/ms).
The difference of arrival time between two adjacent sensors i+1 and i can be expressed as [44]:
Δ t i = t i + 1 t i = L i + 1 L i v = Δ L i v  
where:
L i + 1 = ( x i + 1 x ) 2 + ( y i + 1 y ) 2 + ( z i + 1 z ) 2  
L i = ( x i x ) 2 + ( y i y ) 2 + ( z i z ) 2  
where ti+1 is the calculated arrival time of the (i+1) th sensor (ms), ti is the calculated arrival time of the i th sensor (ms), Li+1 is the distance from MS source to the (i+1) th sensor (m), Li is the distance from MS source to the i th sensor (m), ΔLi is the distance difference between two adjacent sensors i+1 and i and MS source (m), v is the equivalent velocity of MS signal propagating in the medium (m/ms), (xi+1, yi+1, zi+1) are the coordinates of the (i+1) th sensor, (x, y, x) are the coordinates of MS source location (m).
The adaptive value function for identifying the MS location and the velocity model can be described as [44]:
Q = i = 1 n [ Δ W i Δ L i v ] 2  
where ΔWi is the monitored difference of arrival time between the (i+1) th sensor and i th (ms), ΔLi is the distance difference between two adjacent sensors i+1 and i and MS source (m), v is the equivalent velocity of MS signal propagating in the medium (m/ms), when i = n, Wi = i1-in, n is the number of sensors. When Q equals or tends to zero, the solutions of v and x, y, z are the best velocity model and the location of the MS source.
According to the principle of time difference location, the fitness function for evaluating the seismogenic time t is as follows [45]:
Q = i = 1 n [ W i t ( x i x ) 2 + ( y i y ) 2 + ( z i z ) 2 v ] 2  
where Wi is the monitored arrival time of the i th sensor (ms), t is the seismogenic time (ms), (xi, yi, zi) are the coordinates of the i th sensor, (x, y, x) are the coordinates of MS source location (m), v is the equivalent velocity of the MS signal propagating in the medium (m/ms).
The method of MS source hierarchical location is used to solve the interrelated velocity and the seismogenic time. The v and x, y, z values are solved first with the Equation (5) as the objective function, then v and x, y, z are substituted into Equation (6) to solve t, the expression of t is given by [45]:
t = i = 1 n ( W i L i v ) n  
where Wi is the monitored arrival time of the i th sensor (ms), Li is the distance from the MS source to the i th sensor (m), v is the equivalent velocity of the MS signal propagating in the medium (m/ms), n is the number of sensors.
(2) Particle swarm optimization algorithm
The particle swarm optimization (PSO) algorithm is a new computational intelligence method based on group model [46]. The algorithm is derived from the study of bird feeding behavior. By simulating simple social systems, the so-called ‘particle swarm’ is constructed in multidimensional solution space. Each particle in a particle swarm can modify its forward direction and velocity by tracking the optimal value found by itself and group, so as to achieve a feasible solution for each particle representation problem in the optimal swarm and fly at a certain speed in the search space associated with the fitness value particles related to the objective function. According to the flying experience and the state of the current optimal particle, the velocity is dynamically adjusted, and the search for the optimal solution to the problem is achieved through collaboration and competition among individuals. In the PSO algorithm, assuming that the optimal location searched by the i th particle is ‘Pibest’ and the optimal location searched by the entire particle swarm is ‘Gibest’ the particle velocity and location can be updated as [47,48,49,50]:
v i t + 1 = w v i t + c 1 r 1 ( P i b e s t t X i t ) + c 2 r 2 ( G i b e s t t X i t )  
X i t + 1 = X i t + v i t + 1  
where vi is the velocity of particle (m/ms), xi is the location of particle (m), r1 and r2 are uniformly distributed random numbers between 0 and 1, c1 and c2 are the learning rates (usually, c1 = c2 = 2), w is the inertia weight, t is the number of iterations.
The PSO algorithm is used to search for the MS source location in this paper due to its simple operation and easiness of solving the global optimal solution for multi-level nonlinear problems. The solving process of the MS source hierarchical location based on the PSO algorithm is shown in Figure 2 [44].
Step 1: The noise reduction and partial wave of the MS signal need to be processed first, the arrival time of the MS signal should be picked up correctly, and the obviously unreasonable MS signal should be removed. Step 2: Initialize the parameters of PSO algorithm, MS coordinates and velocity model. Step 3: By Equation (5), the adaptive value of particles (MS source coordinates and velocity model) is calculated and is used to determine whether it meets the predetermined flight times and positioning accuracy, if so, proceed to step (5), otherwise (if not), to step (4). Step 4: Update the location and search velocity of particles according to Equation (8) and (9), and then go back to step (3). Step 5: Obtain the MS occurrence time by calculation of identified MS source coordinates and velocity model with Equation (7). Step 6: Determine whether the MS signal propagating to the sensor has gone through the large fault or empty area, if so, go back to step (2), otherwise (if not), end the MS source location activity due to the correct choice of the MS signal and the accurate location of the MS source.

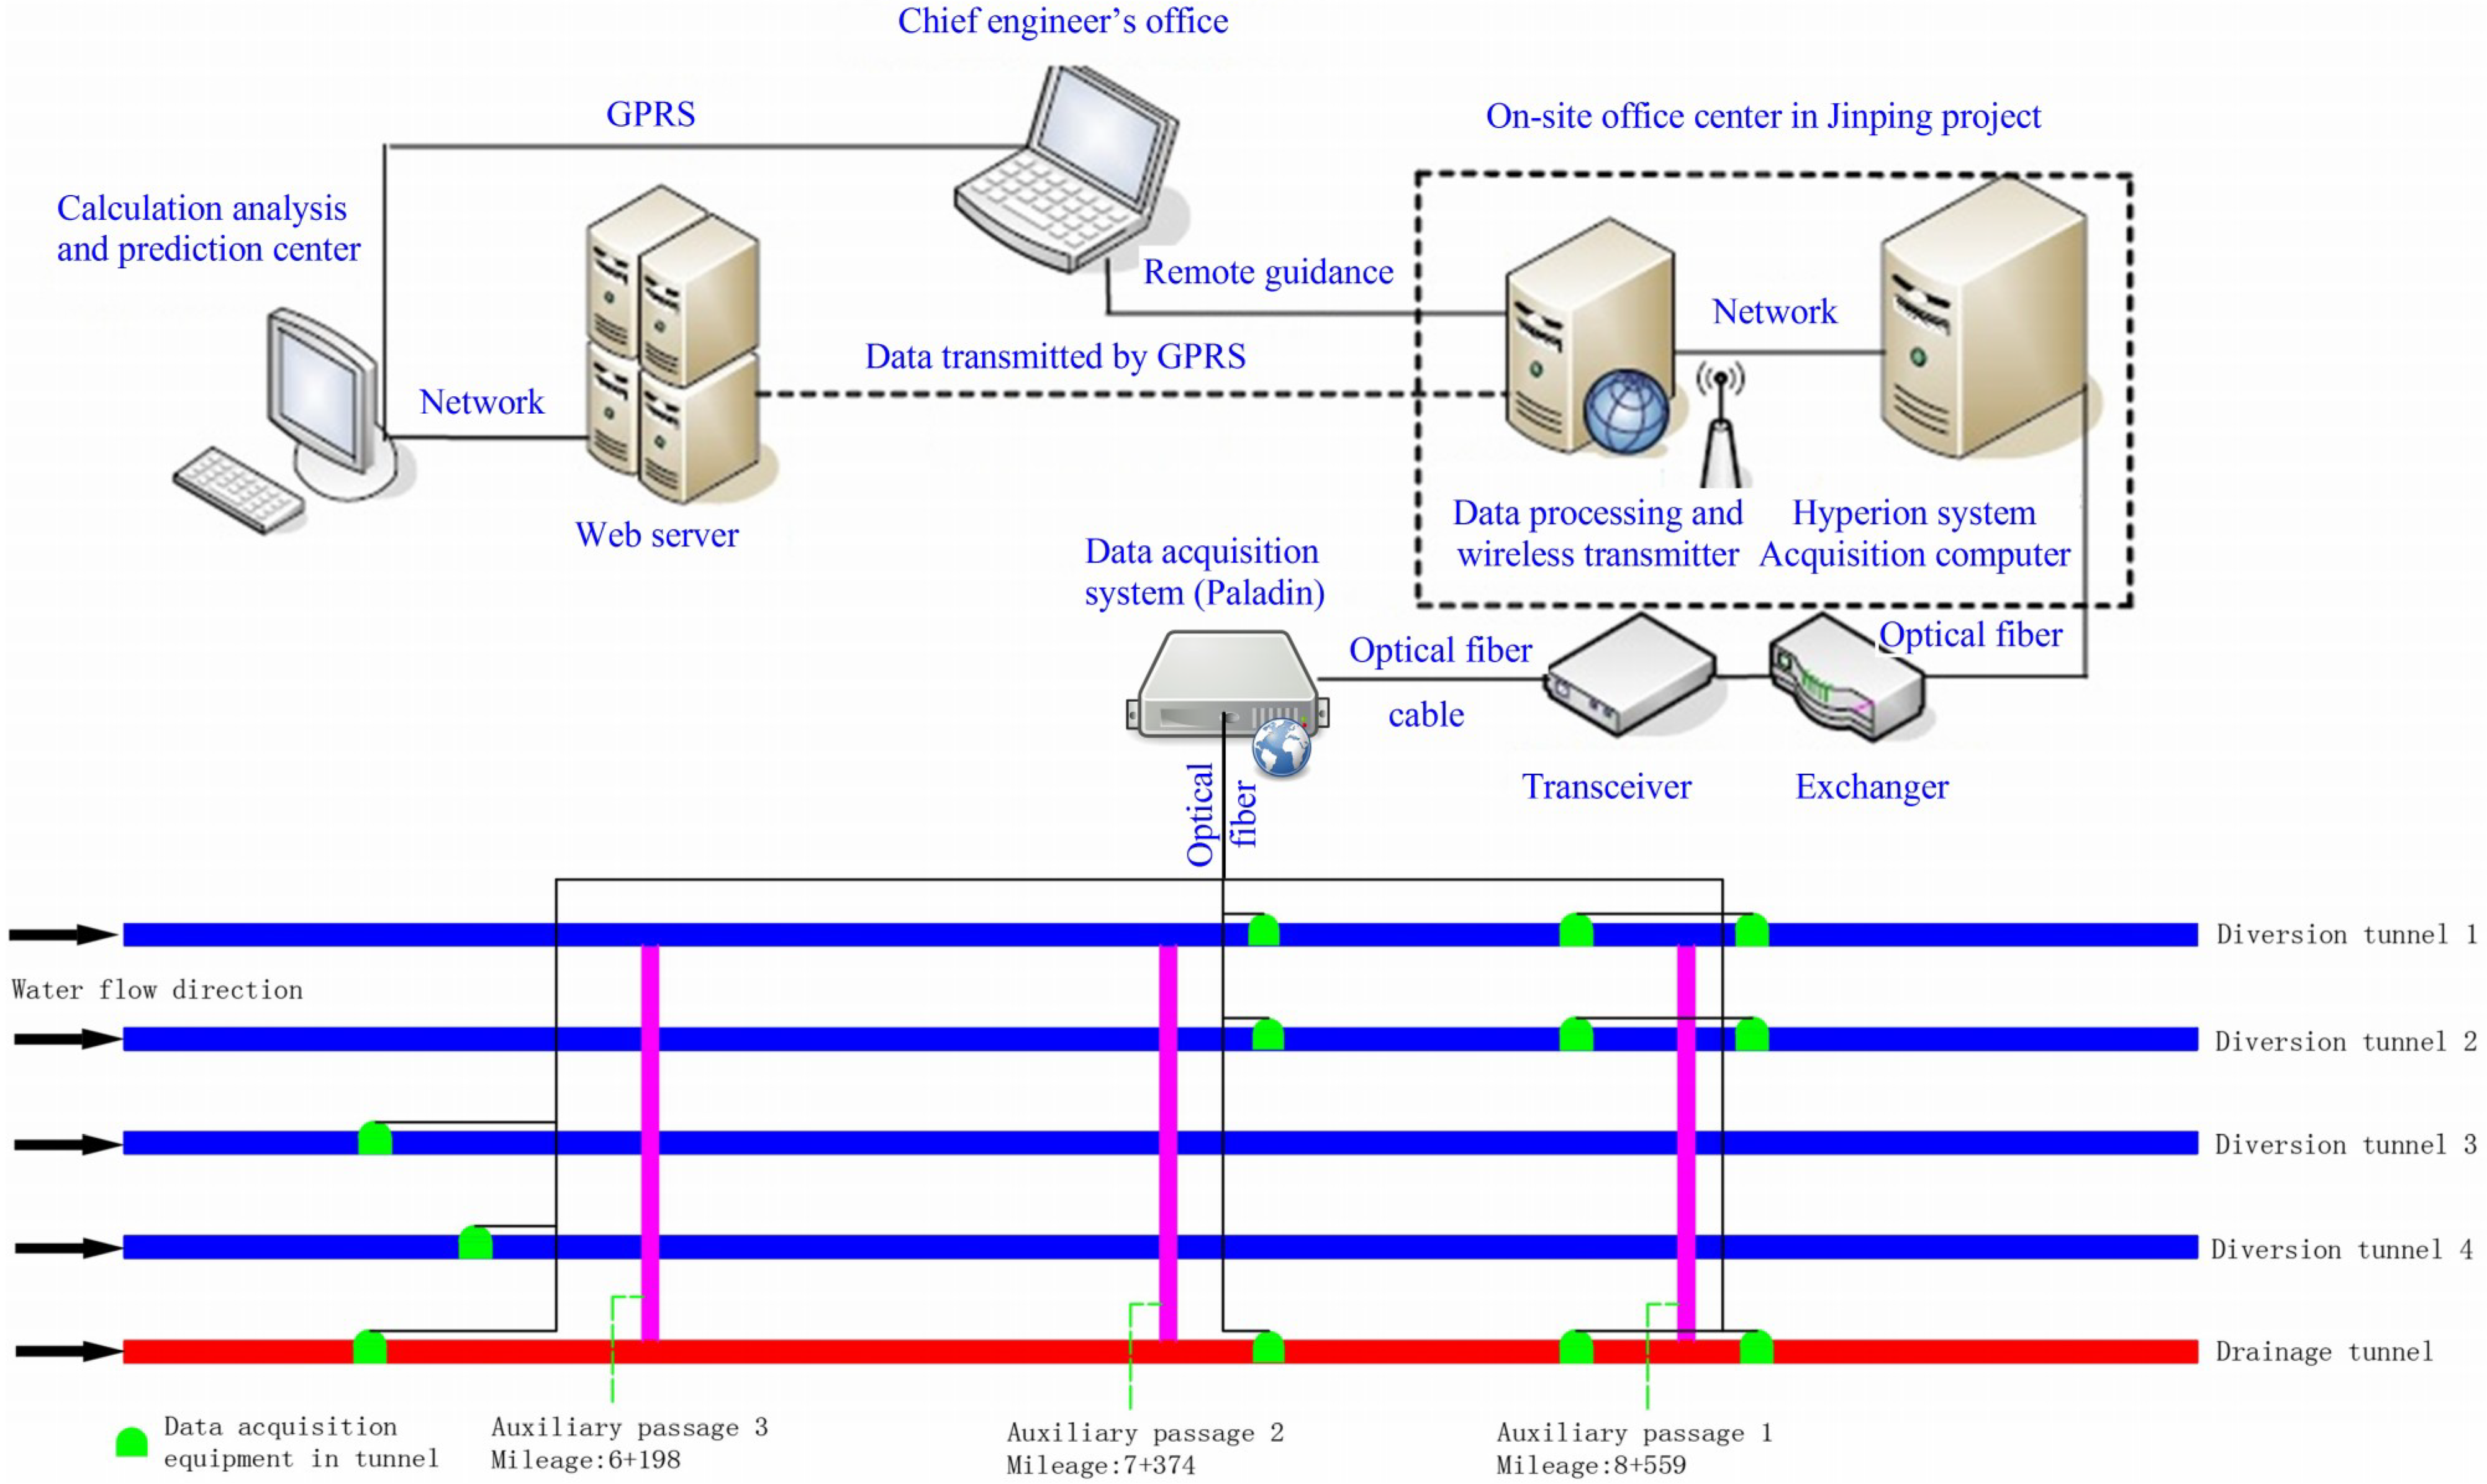
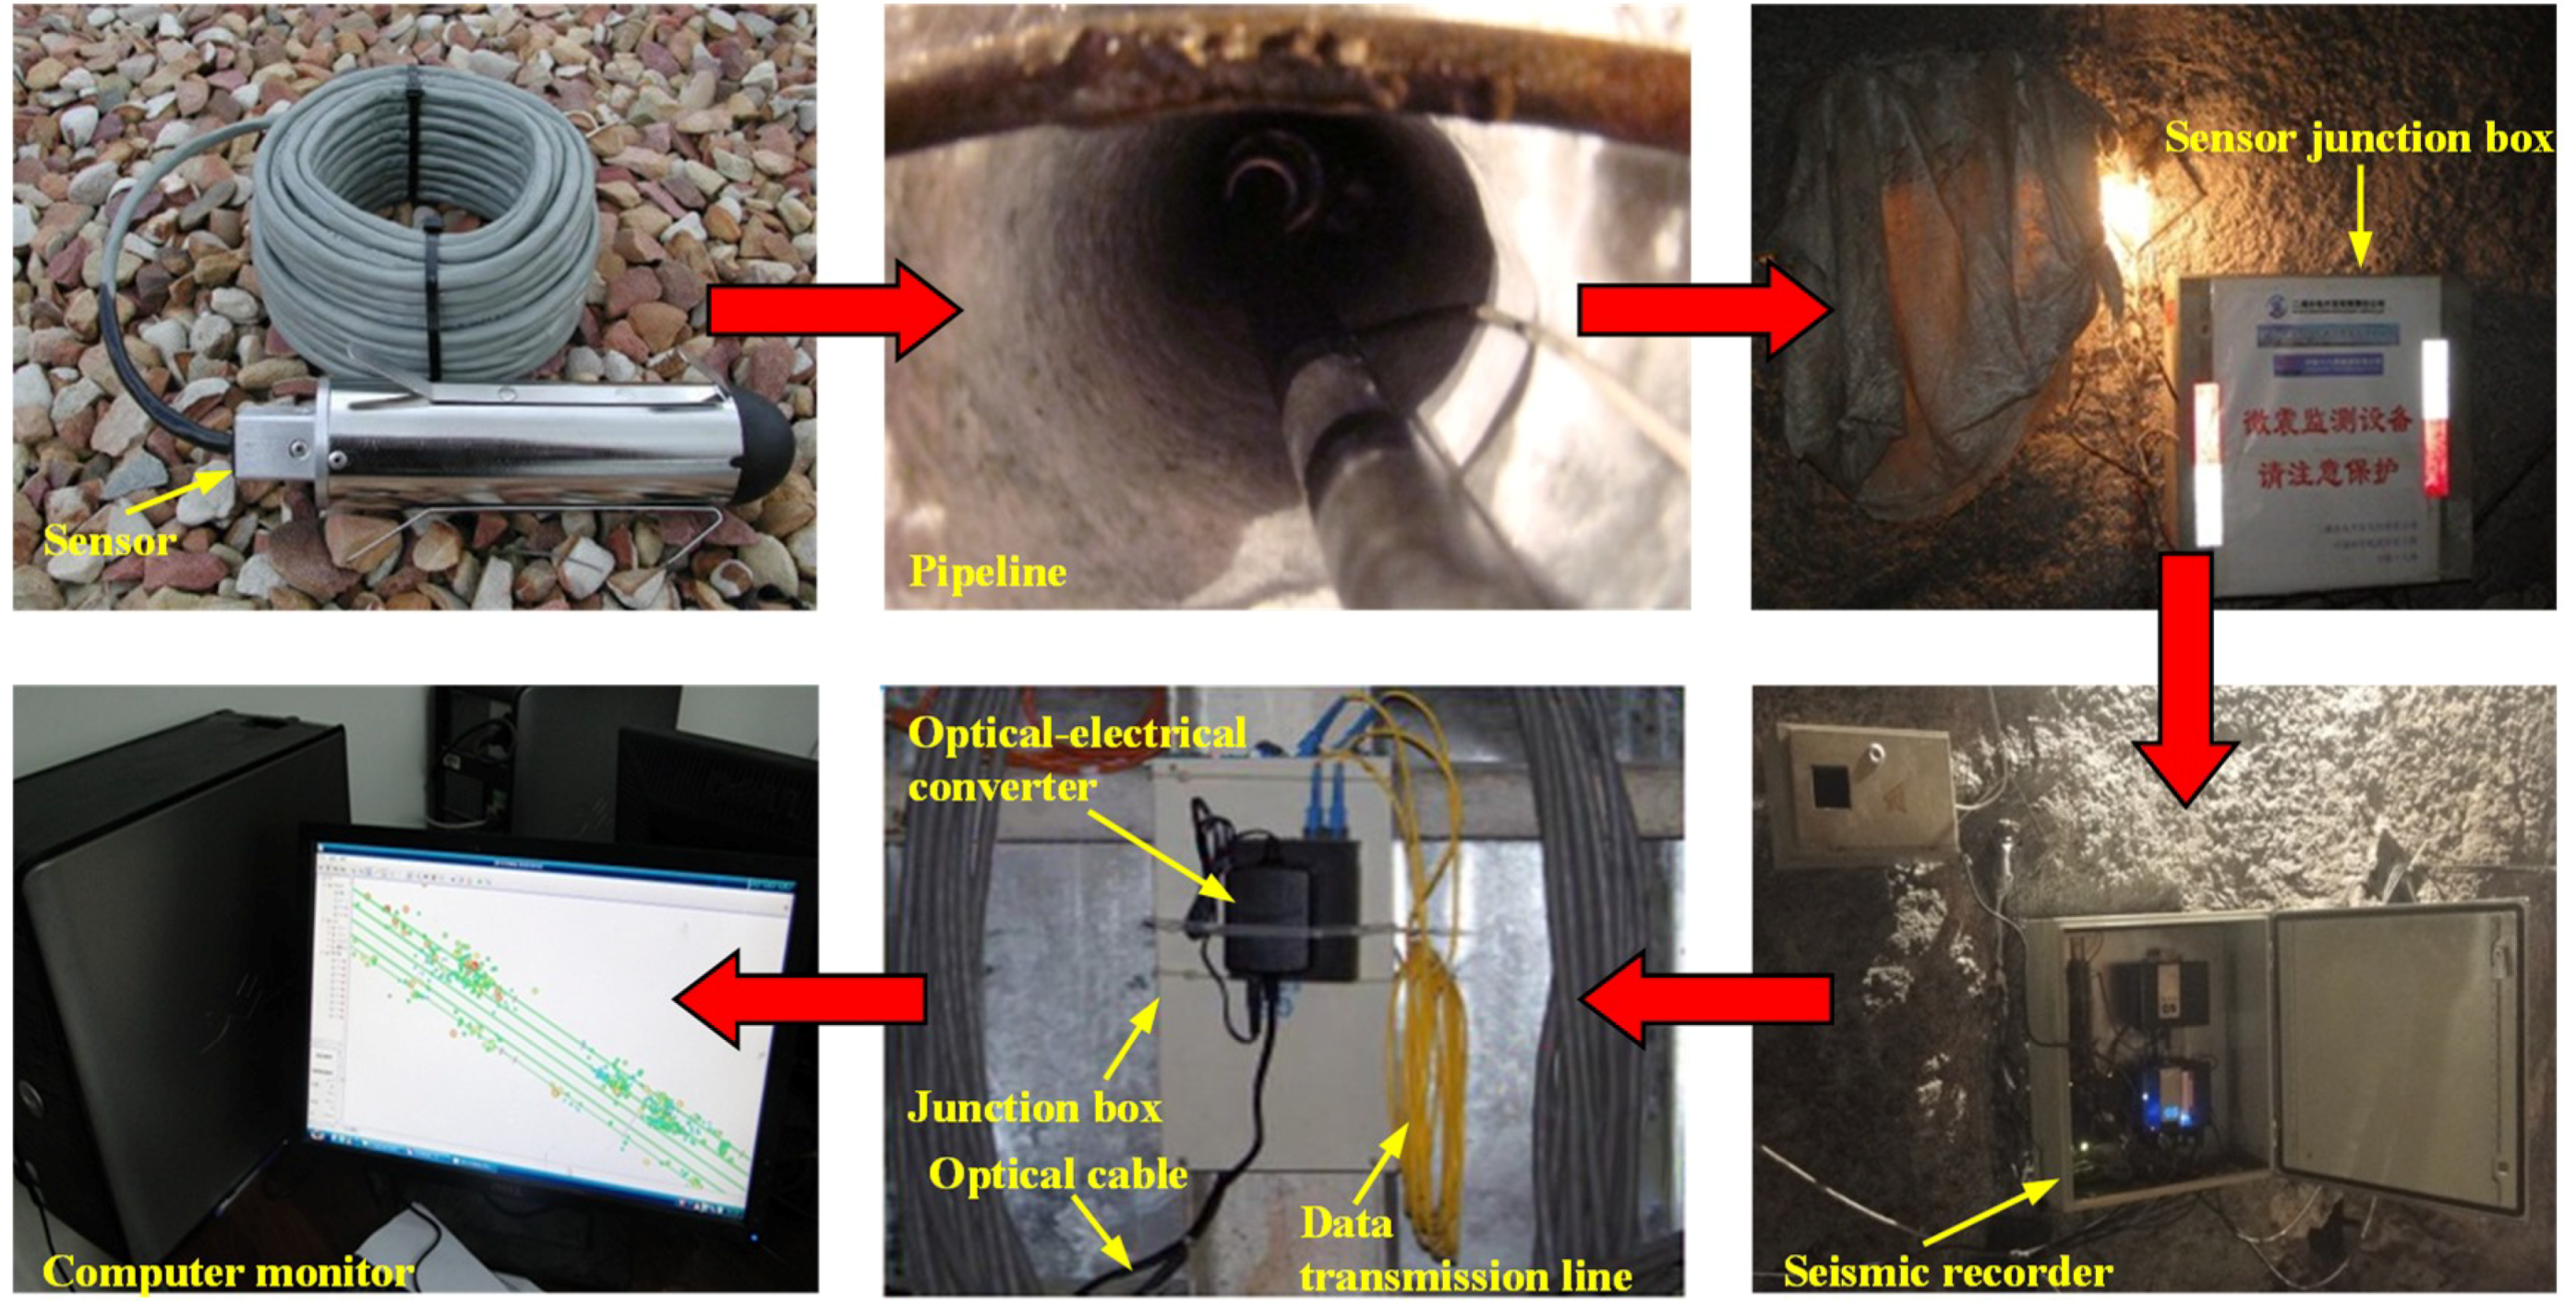
3.2. Monitoring System

The MS monitoring system produced by the Canadian ESG (Engineering Solution Group) is employed in this project, which mainly consists of two parts of hardware and software. The system adopts the modular design method and implements the remote acquisition of PC configuration. The hardware part includes: MS sensor, Paladin sensor connection box equipped with power supply and signal waveform trimming function, Paladin (v.2)-24 bit seismic recorder, PMTS-Paladin master time server, fiber optic beam splitter, monitor and so on. The software includes: PAL-Paladin acquisition software, HNAS-Hyperion network acquisition software, Hyperion digital signal processing software and so on. The MS monitoring system for rockbursts for the Jinping II hydropower station is shown in Figure 3. An optical cable is preferred for data transmission, wireless transmission is used as an alternative, and on-site servers are real-time backup as an emergency to ensure data integrity. MS monitoring can be used for real-time monitoring, and network communication is employed to achieve global sharing.
The working procedure of the MS monitoring system is as follows: First, the sensor converts it into a current wave after receiving the MS signal, and transmits the signal to the data conversion equipment through a customized cable between the sensor and the data acquisition equipment. Second, the data conversion equipment converts the current wave into a data signal, and transmits it to the data acquisition equipment through a network wire or optical fiber for acquisition and storage. Then, the MS data signal is processed and analyzed by the data processing software. Finally, according to the distribution of MS events, the risk area of rockburst can be predicted.

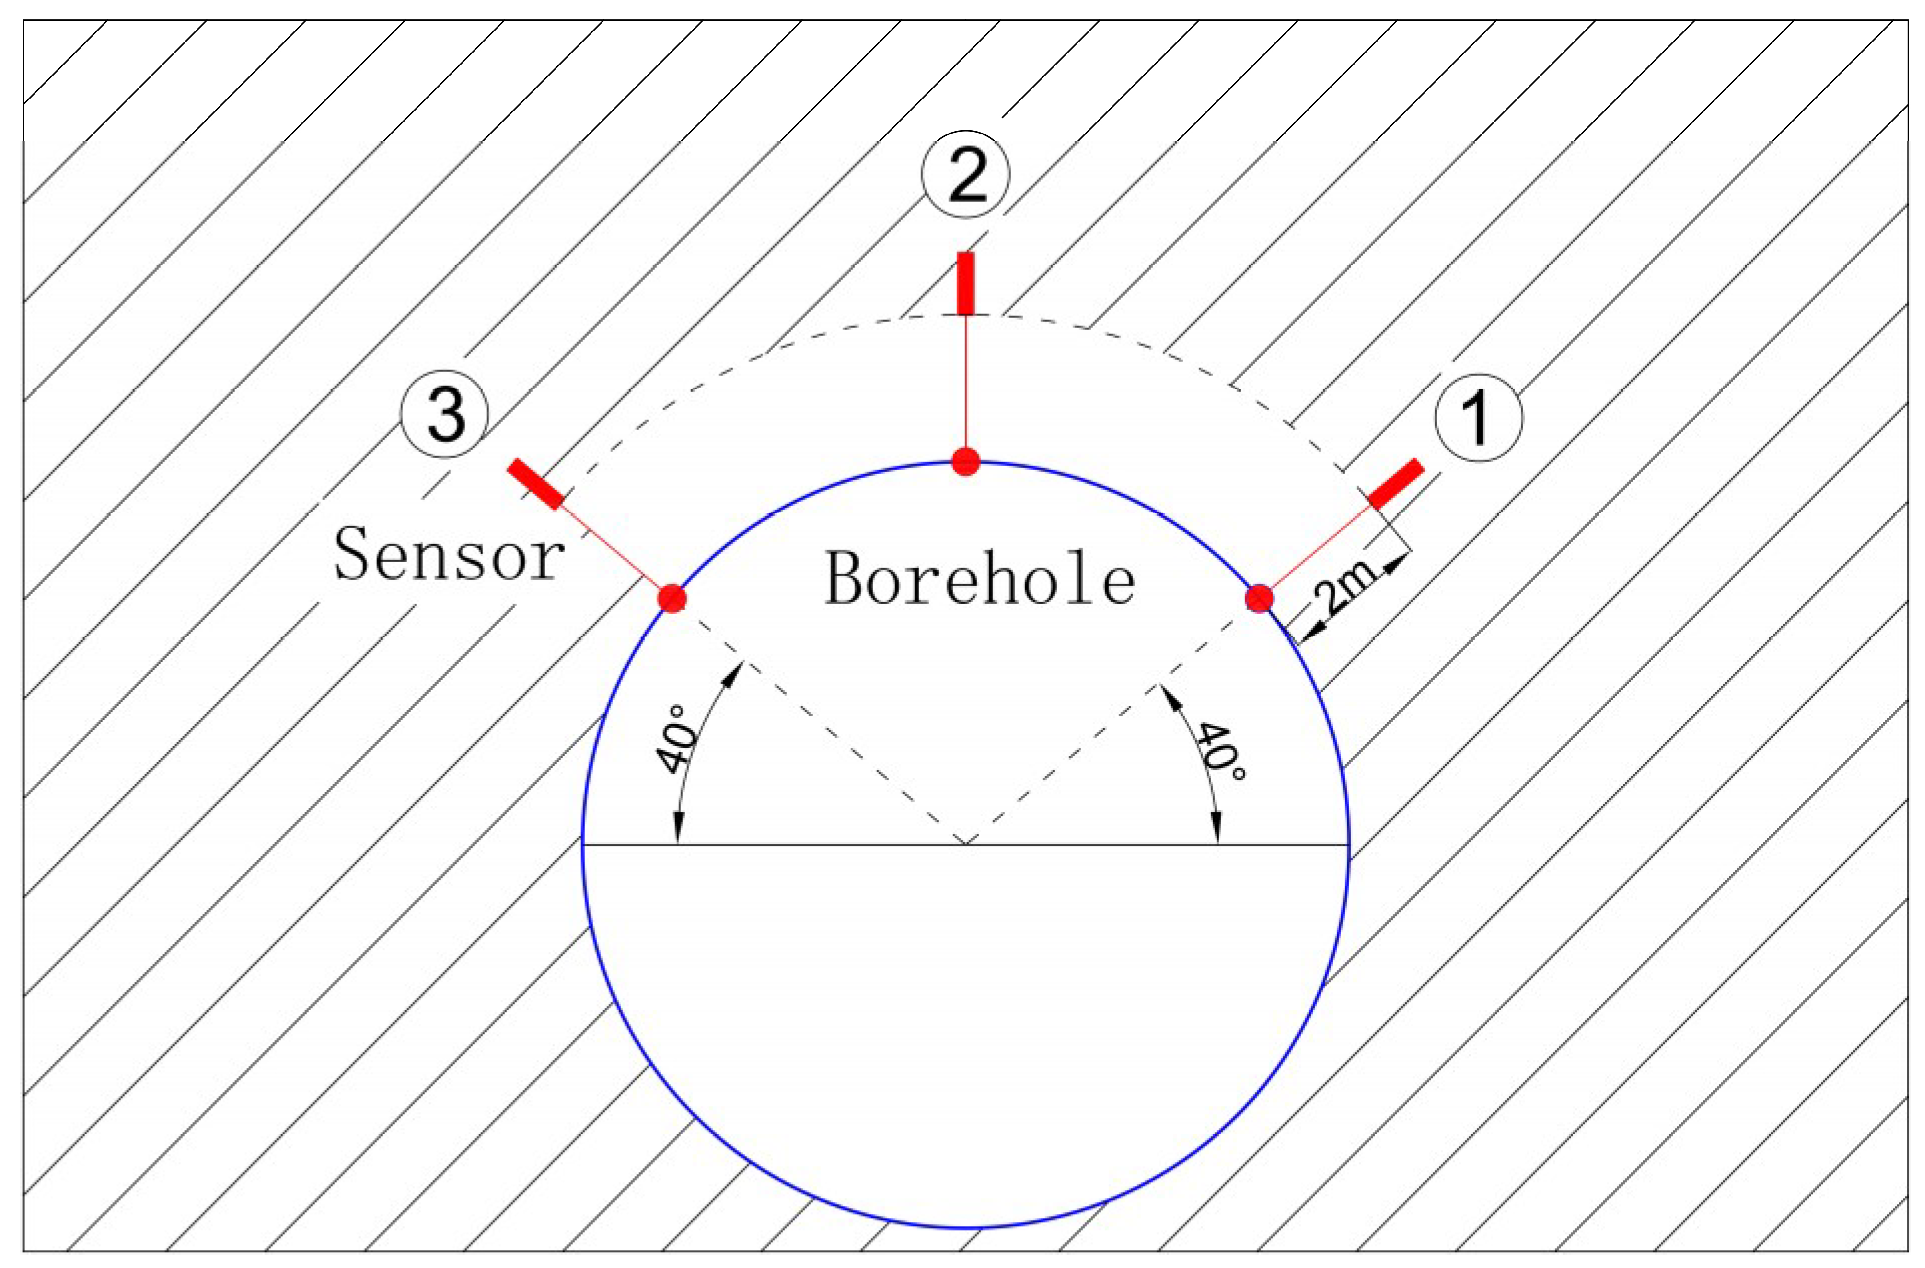
3.3. Installation and Arrangement of Sensors

3.3.1. The Installation Requirements of Sensors

The diameter of the borehole is about 40 mm, so that it is easy to install and disassemble the sensor (the diameter of the sensor is 22 mm), and reserve enough space for sensor adjustment. The depth of the borehole is 3 m, so that the sensor can detect the loose disturbance area and receive a more accurate signal, and prevent the effect of water accumulation in the borehole as shown in Figure 4. The position and depth of borehole should be selected according to the design scheme, and the drilling position of the sensor can be adjusted slightly according to the actual situation in the field.

3.3.2. The Arrangement of Sensors

The MS monitoring is different from the stress and deformation monitoring due to its high requirement for the arrangement of the sensor. An inappropriate sensor arrangement scheme is not only adverse to obtaining effective MS signals, but also difficult for the accurate location of MS sources and the accurate description of MS information such as energy level and so on, which further affects the stability of the localization algorithm. The MS real-time monitoring during the construction of the deep-buried long tunnel is different from other types of engineering (such as mine stope) because of its own particularity: a long-line project, and monitoring the target (the heading face region) which is constantly moving, while the sensors should be able to move easily and flexibly.
Multiple working face real-time monitoring and multiple sensors working together in Figure 3 can give monitoring better adaptability to cable and equipment damage, to faults and other unfavorable geological conditions, and make the location result more reliable and accurate.

3.3.3. The Connection of the Main Equipment

After the sensor is installed, it is connected with the sensor connection box equipped with power supply and signal waveform modification. The junction box is connected with the seismic recorder, and then connected to the master time server and optical-electrical converter through an optical fiber, and finally connected with the computer monitor and the internet as shown in Figure 5.

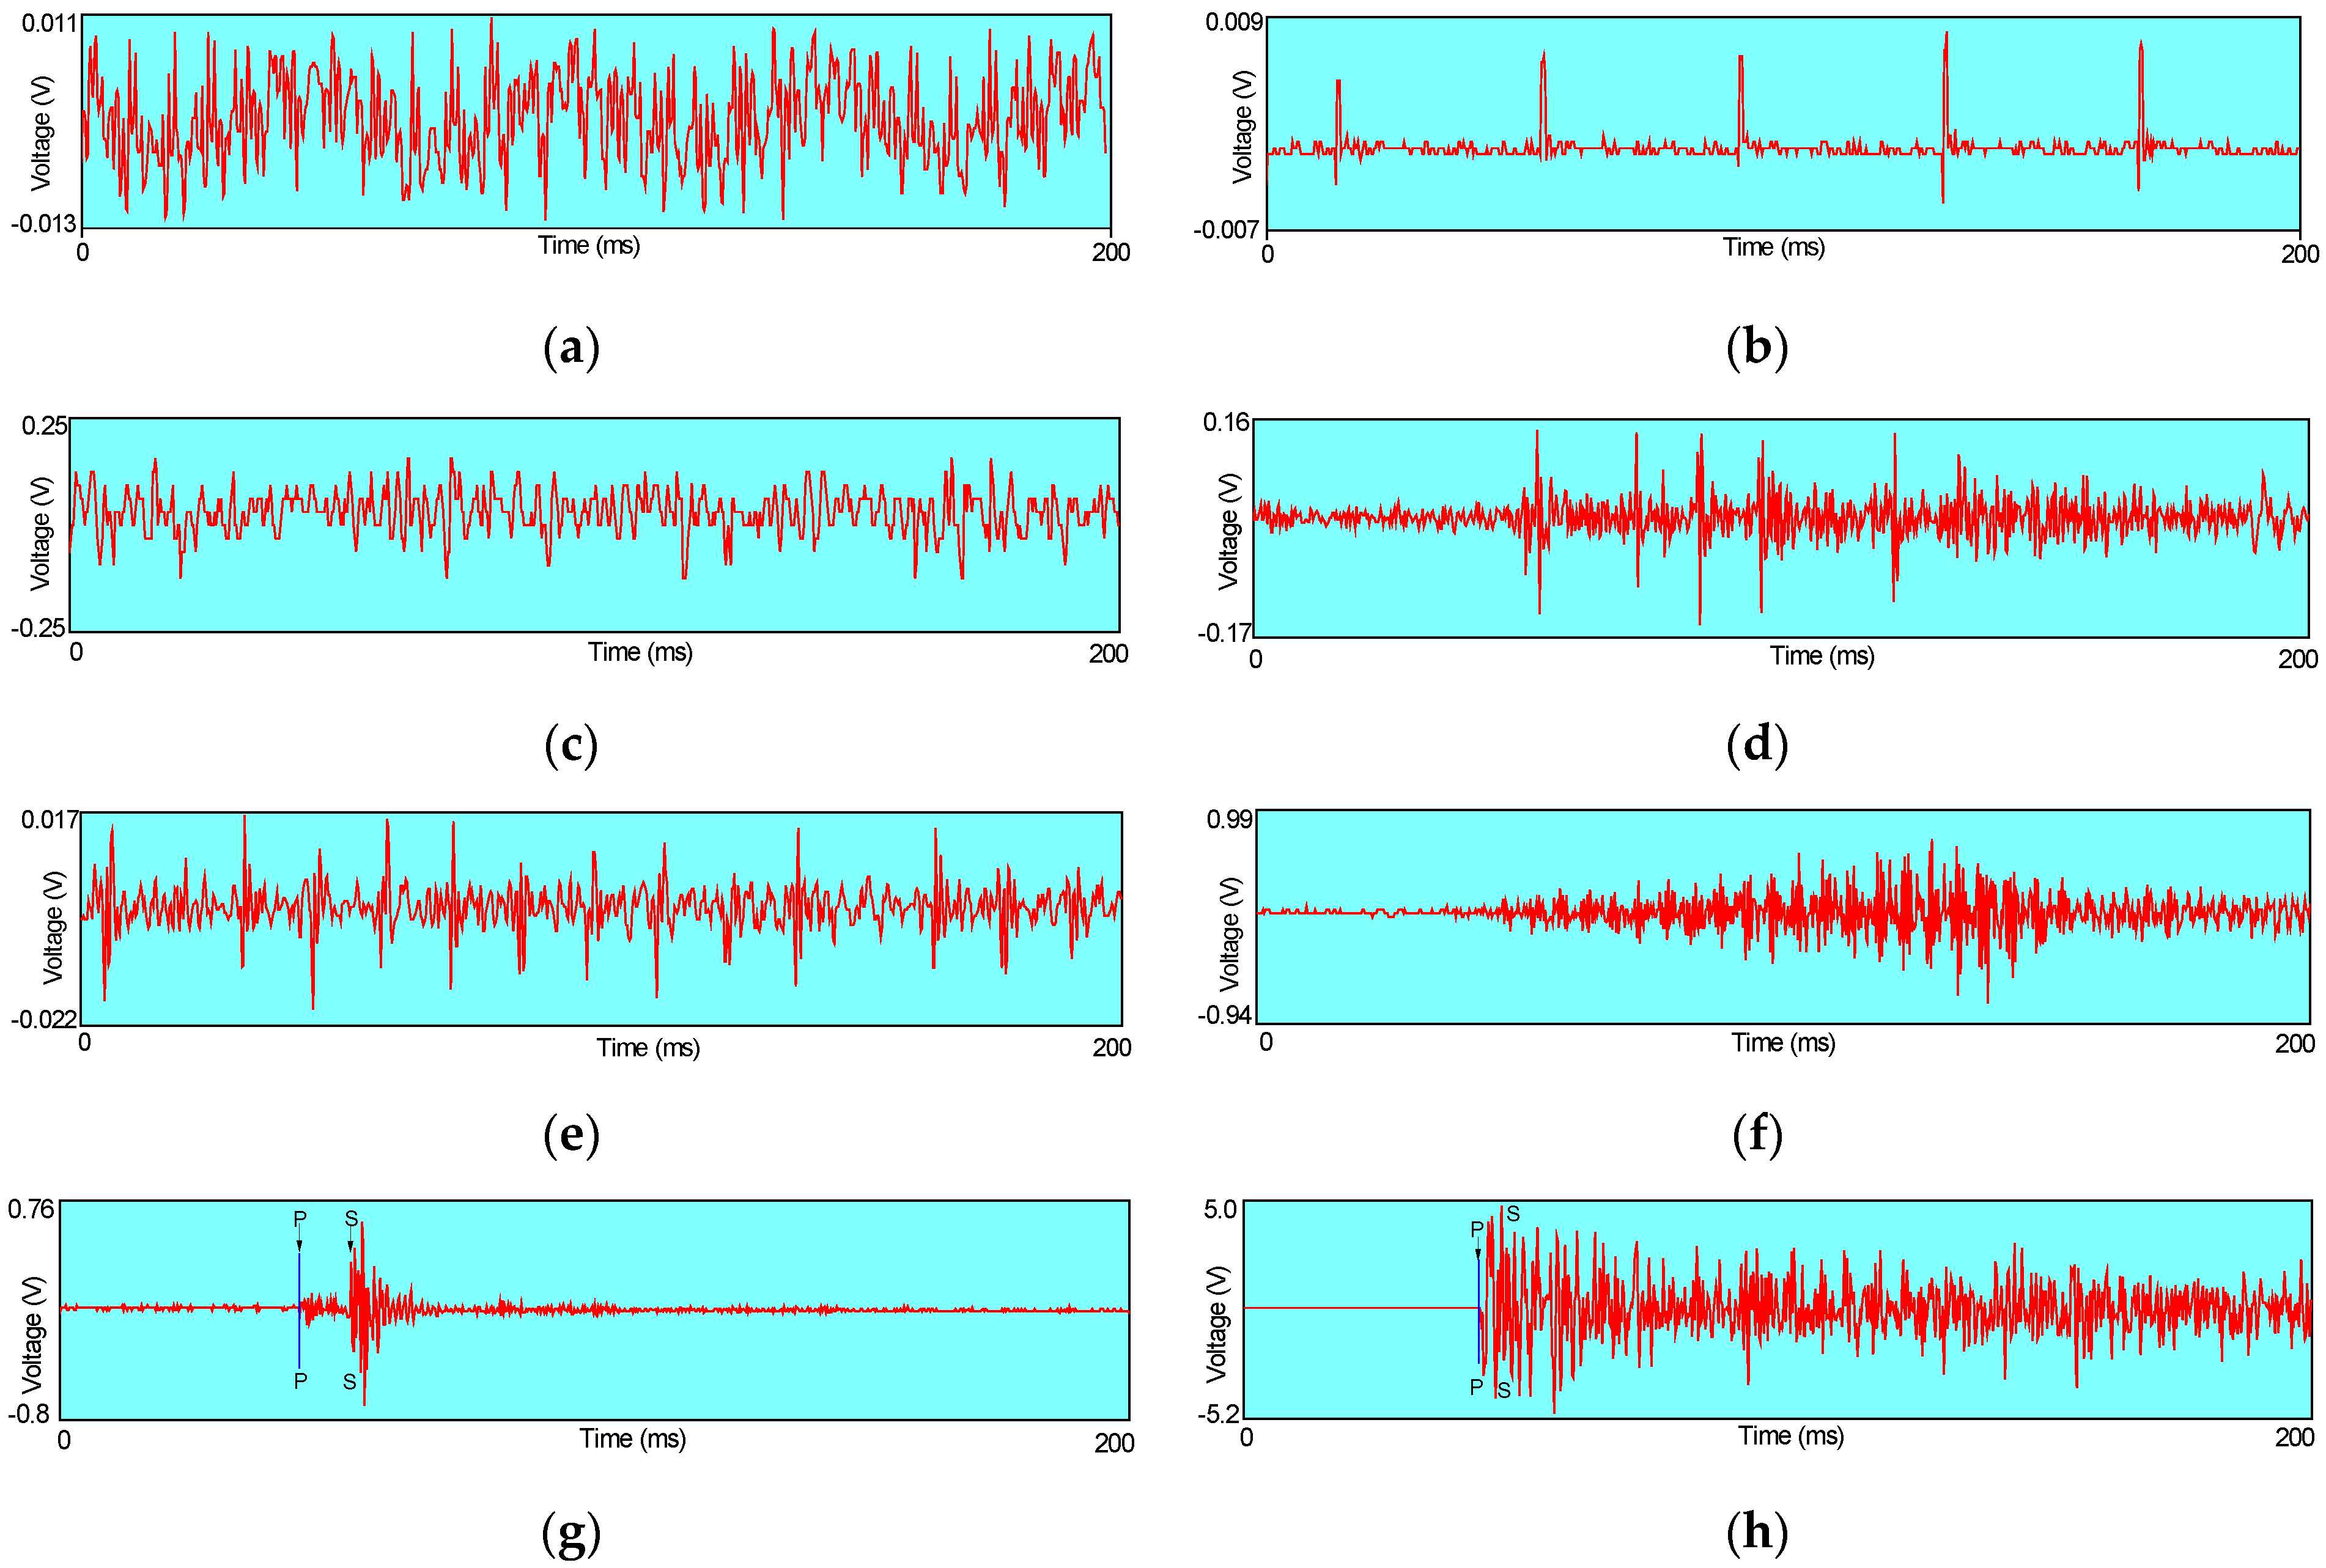
3.4. MS Signal Processing

The noise in the tunnel construction process will affect the accuracy of the MS monitoring results, such as blasting, muck hauling, track laying of the tunnel boring machine and other mechanical work, and also cause the occurrence of MS events. The accuracy of MS monitoring will be seriously affected if the interference signals caused by these noises cannot be eliminated accurately. Therefore, the accurate recognition of waveform is the key to the identification of rockburst and the monitoring and early warning. Some common waveforms of sound source in the tunnel are listed in Figure 6.
MS signals received by monitoring sensors must be processed and noise filtered to obtain MS signals that are useful for rockburst prediction. The main steps of the filtering method are as follows: (1) According to the pre-test results, the filter parameters of the acquisition instrument are set up and the hardware filter is carried out. (2) Synergetic filtering is proceeded by using the response of the sensor to noise signal differential reflection and sensitivity. (3) On account of the main effective signal being near the heading face and the sensor being located behind the heading face, filtering is performed according to the arrival time of the signal and the sensor position. (4) According to the noise database established in the test section, the artificial neural network method is used for filtering. (5) Finally, the noise is filtered through the oscillographic window of the monitoring system. The comparison of MS events before and after filtering is shown in Figure 7. The parameters of the MS events can be obtained by analyzing the waveform of the filtered MS events, the spectral spectrum, and the arrival time of the MS signals.

3.5. Identification of Rockburst

The MS sensors embedded in different space positions are used to record the arrival time and propagation direction of MS signals generated by the surrounding rock rupture, and the location of each MS source is obtained to predict the state of the surrounding rock by data processing. The location and grade of rockburst can be judged comprehensively according to the number and distribution of MS events, the magnitude of local earthquakes, and the energy of radiation. The probability of rockburst is judged according to the apparent volume and energy index of MS events.
The more and active the MS events, the greater the risk of rockburst. The greater the local magnitude of the MS event, the greater the intensity of rockburst. The larger the sphere of the MS event, the greater the energy release, and the greater the intensity of the rockburst as shown in Figure 8 a. In the early stage of rockburst, the apparent volume of the MS source continues to increase, with a sudden trend increase, and the energy index shows signs of a sudden drop as in Figure 8b.

4. MS Monitoring Results

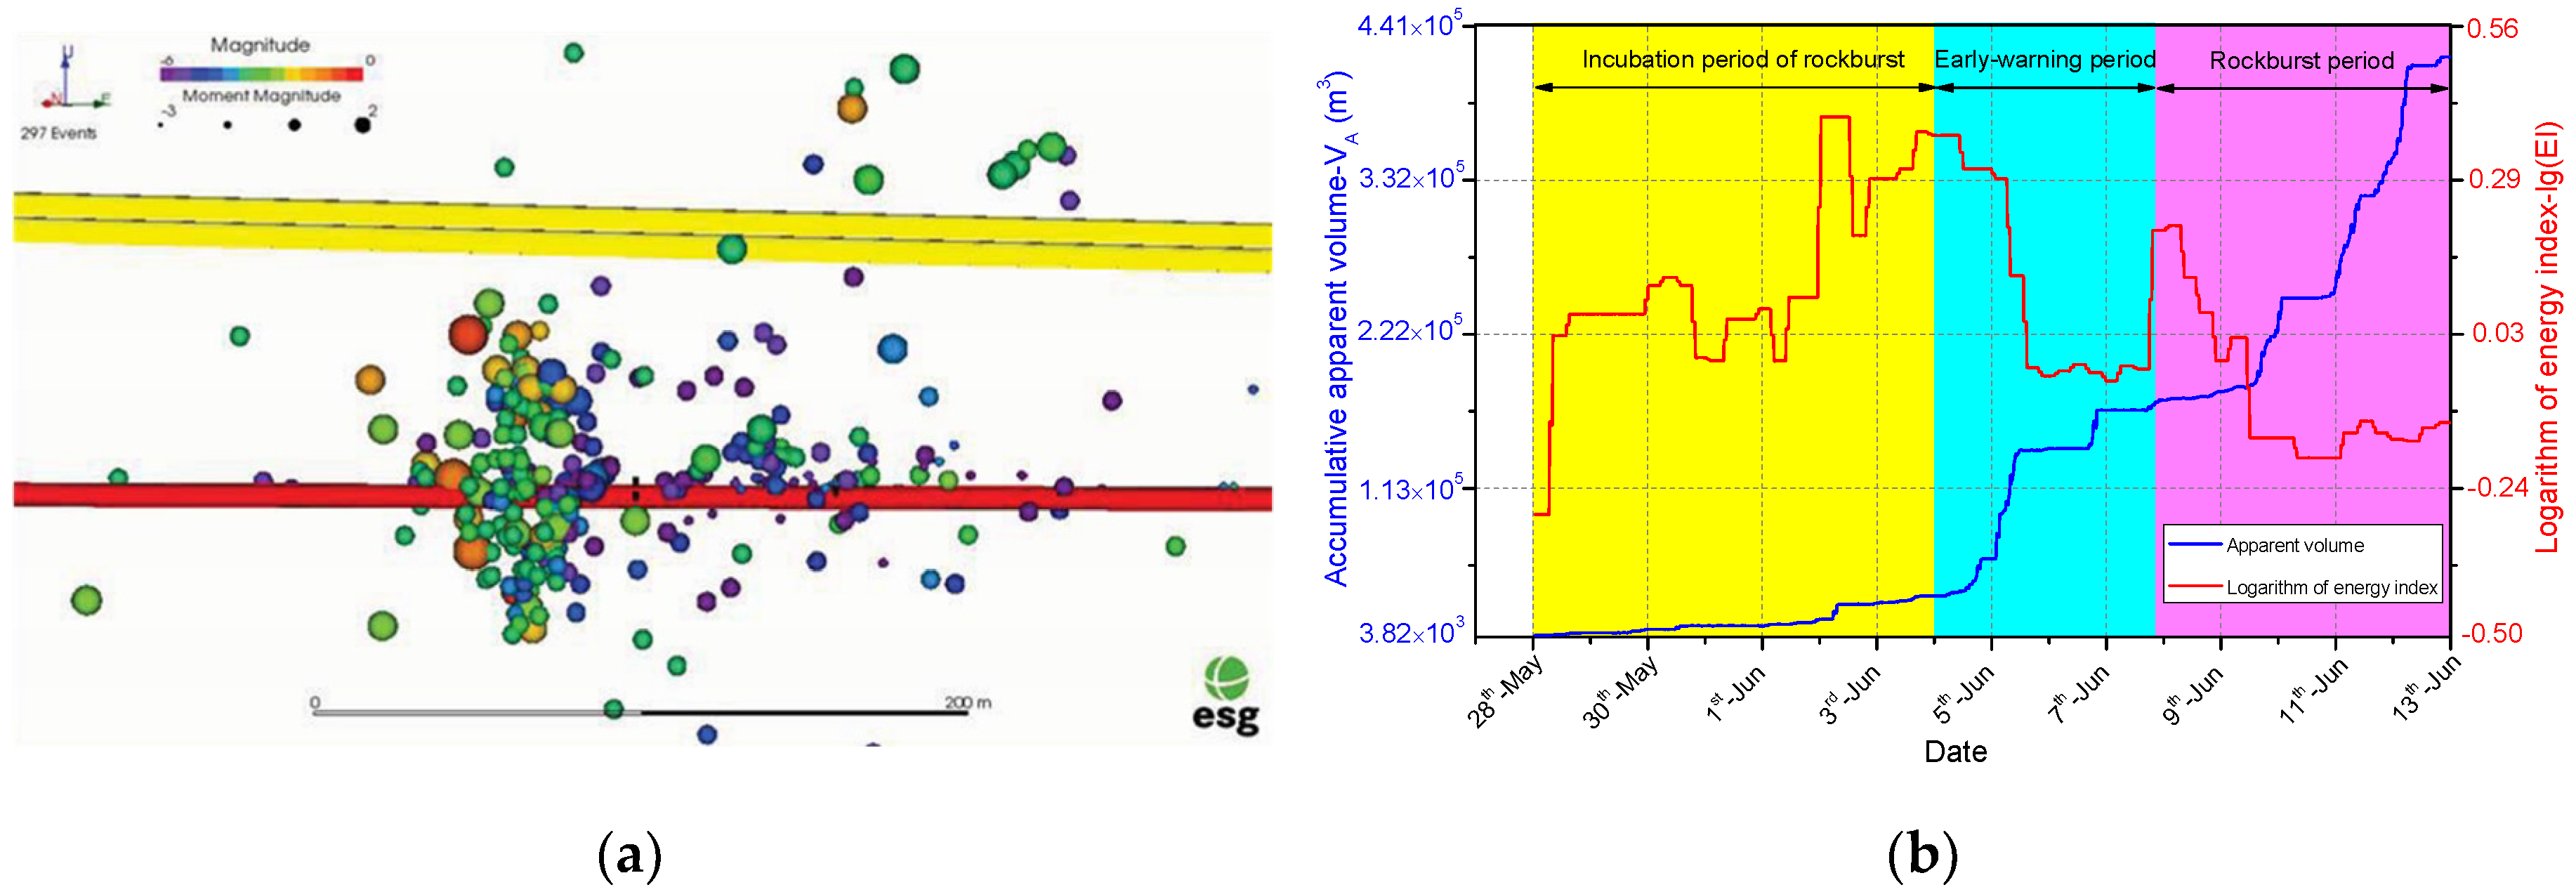
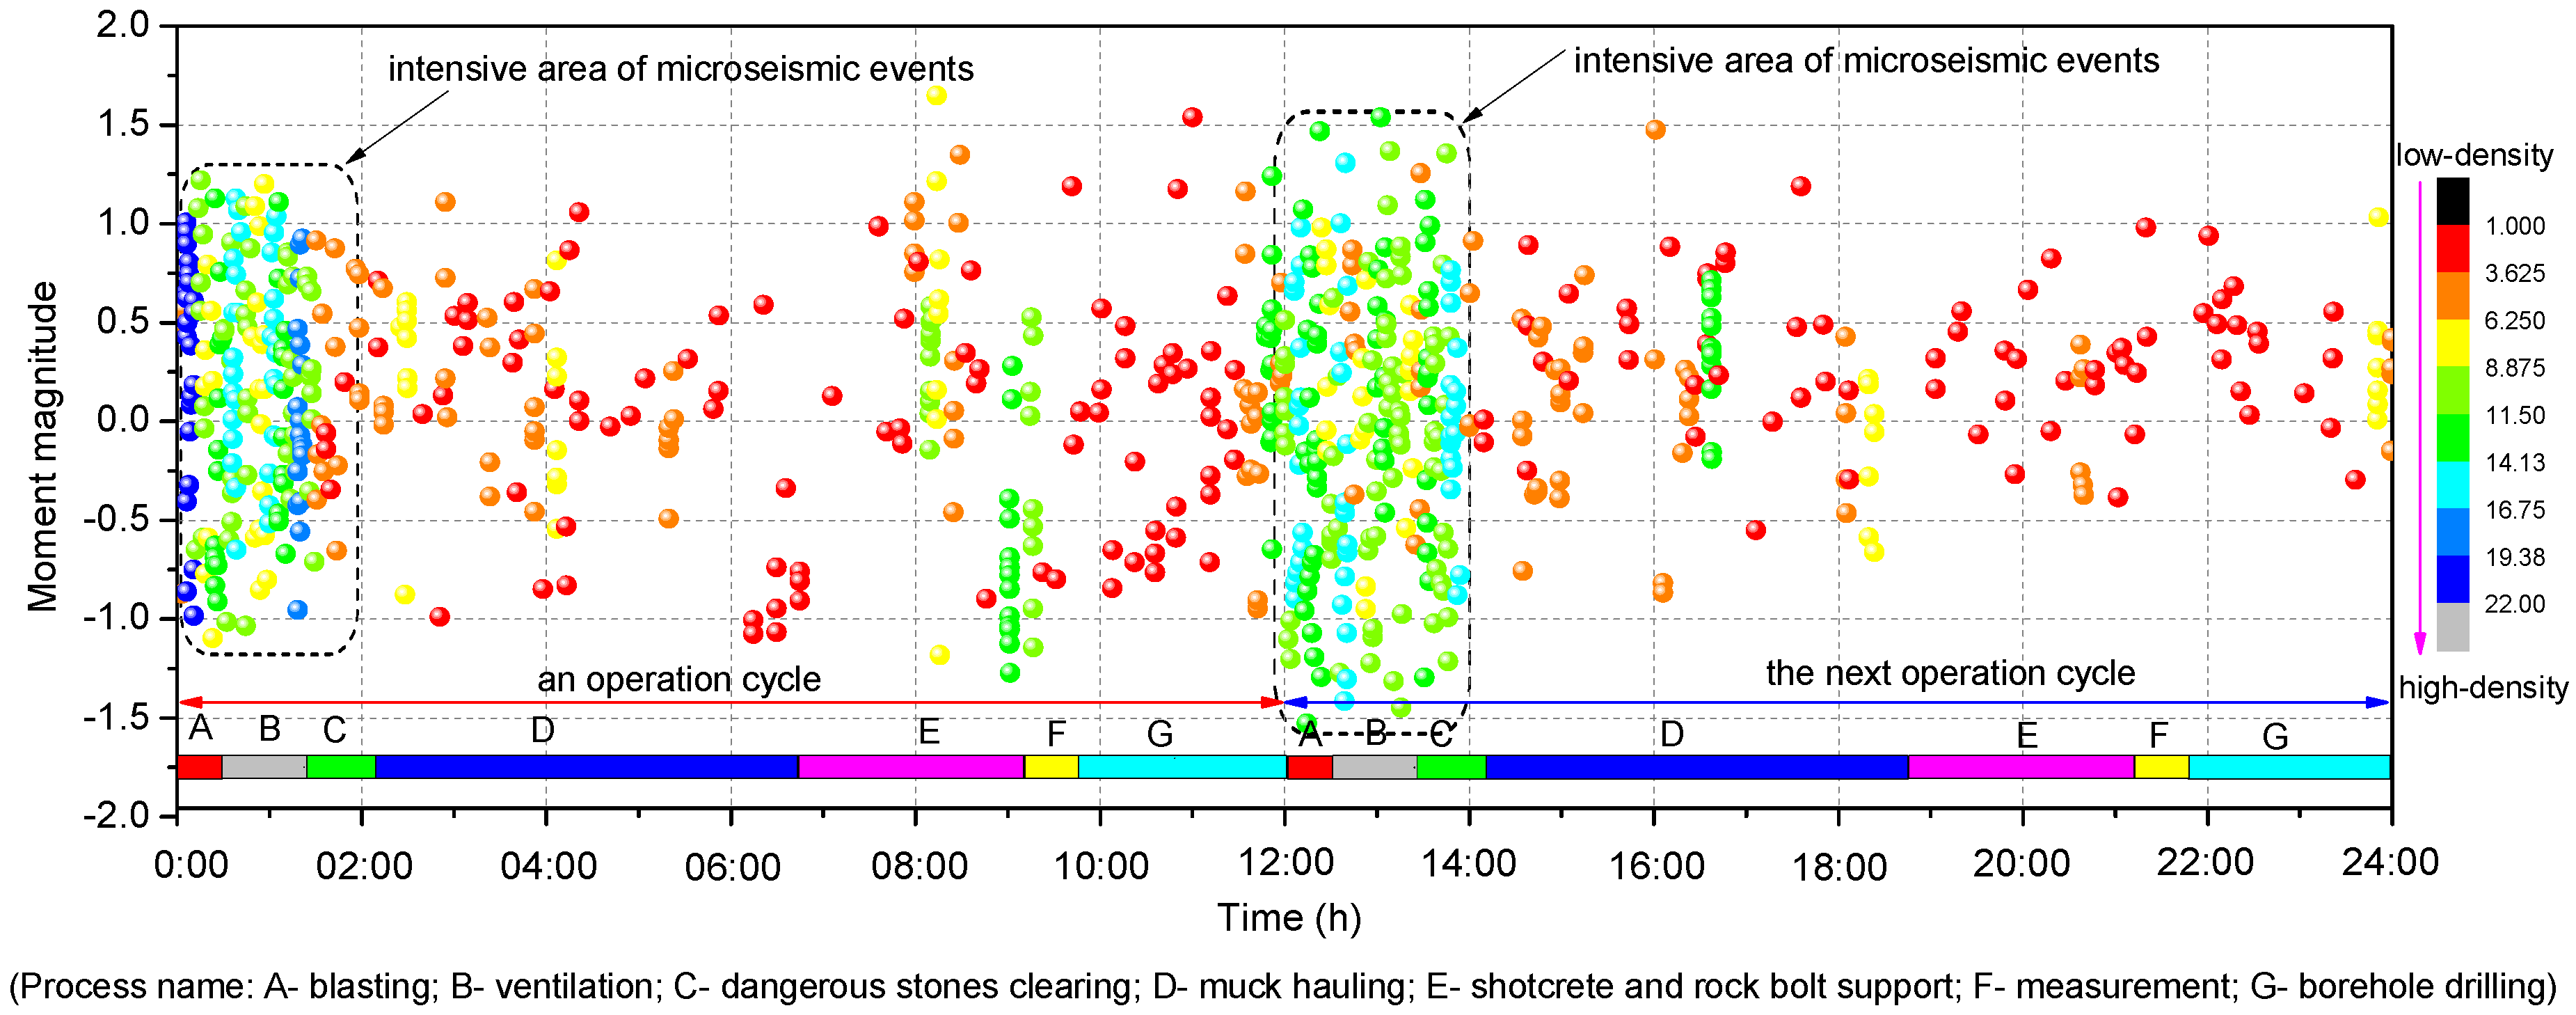
4.1. Time Distribution Law of MS Events

The distribution of cumulative MS events in 24 h from 19th June to 21st July is shown in Figure 9. In the statistical time period, there are two operation cycles per day for tunnel excavation, of which 00:00–01:30 and 12:00–13:30 are respectively the stages of the blasting operation. The data shows that there is a significant difference in the activity rate of MS events caused by the tunnel drilling and blasting method during different operation periods. The MS activity is at a quiet period from 05:00 to 08:00 and 17:00 to 20:00 every day. This is mainly due to the time for muck hauling and the early stages of shotcrete and bolting supports, the surrounding rock is not disturbed by excavation and the surrounding rock is in a quiet period. Because there is a small disturbance to the surrounding rock due to the shotcrete and bolting supports, the surrounding rock stress is adjusted to a small extent, and the subsequent drilling operations further aggravate the disturbance of surrounding rock, so that the MS activity from 08:00–12:00 and 20:00–24:00 has a certain increase. The maximum number of MS events occur within 1.5 h after the tunnel excavation unloading (00:00 to 02:00 and 12:00 to 14:00) and then decrease rapidly. This indicates that the unbalanced stress caused by excavation unloading in a short time has been adjusted to a great extent, resulting in the most severe activity of the surrounding rock micro-fracture and the most strain energy released by the surrounding rock, which then tends to ease. The drilling and blasting method is an instantaneous unloading, and the strain energy is mainly concentrated over several hours after blasting, especially in the release of 1.5 h.
There is a clear relationship between the MS activity of the surrounding rock and the operation procedure of the construction, the greater the disturbance of the operation procedure to the surrounding rock, the more active the surrounding rock MS activity after 1.5 h of disturbance. Therefore, in the areas where the MS activity is relatively frequent, the energy release is relatively large, and the area with strong rockbursttendency, and measures to reduce excavation length, increase stress release time and reduce stress adjustment rate can reduce the risk of rockburst.

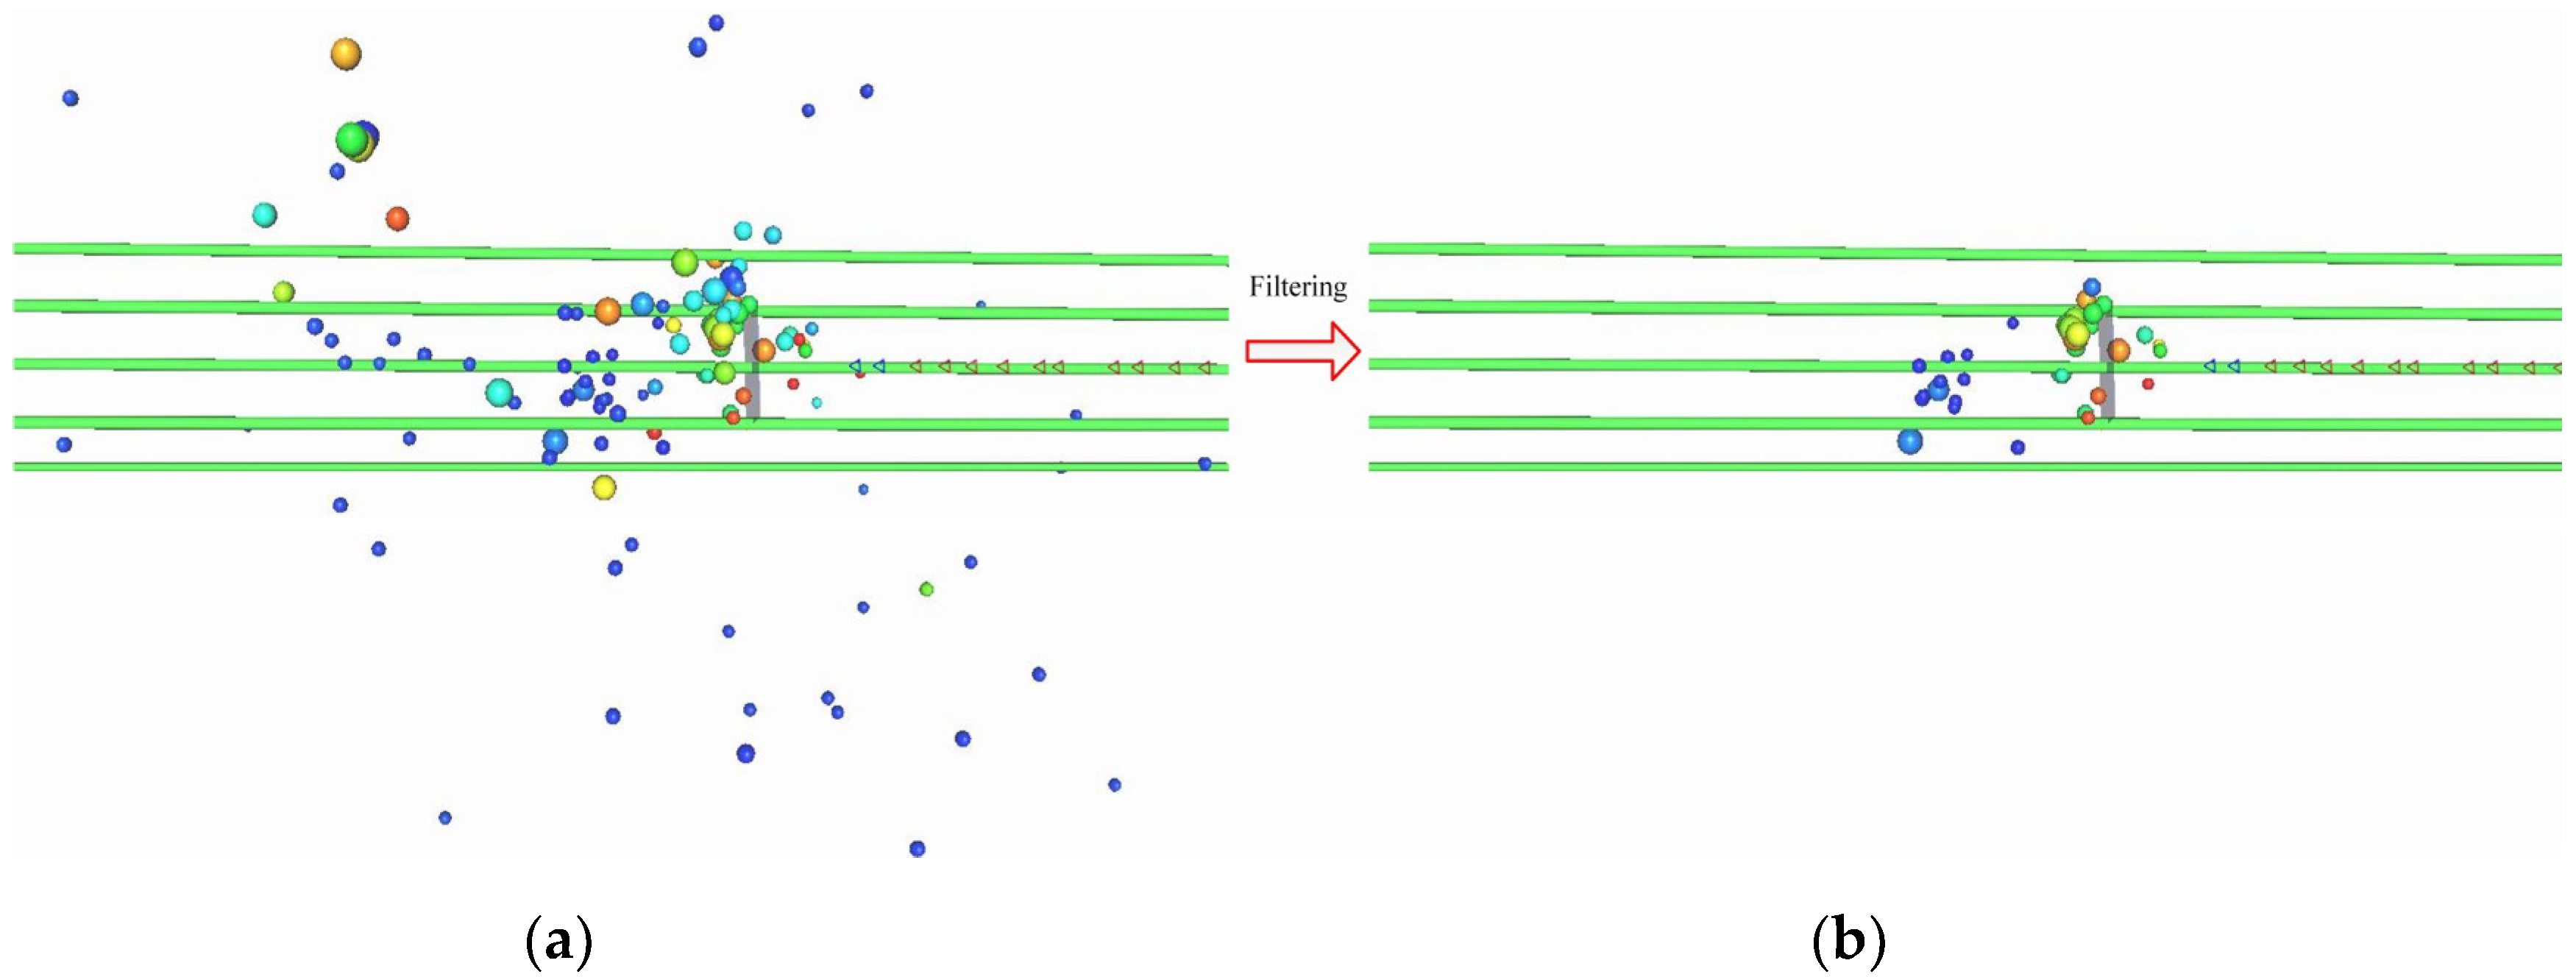
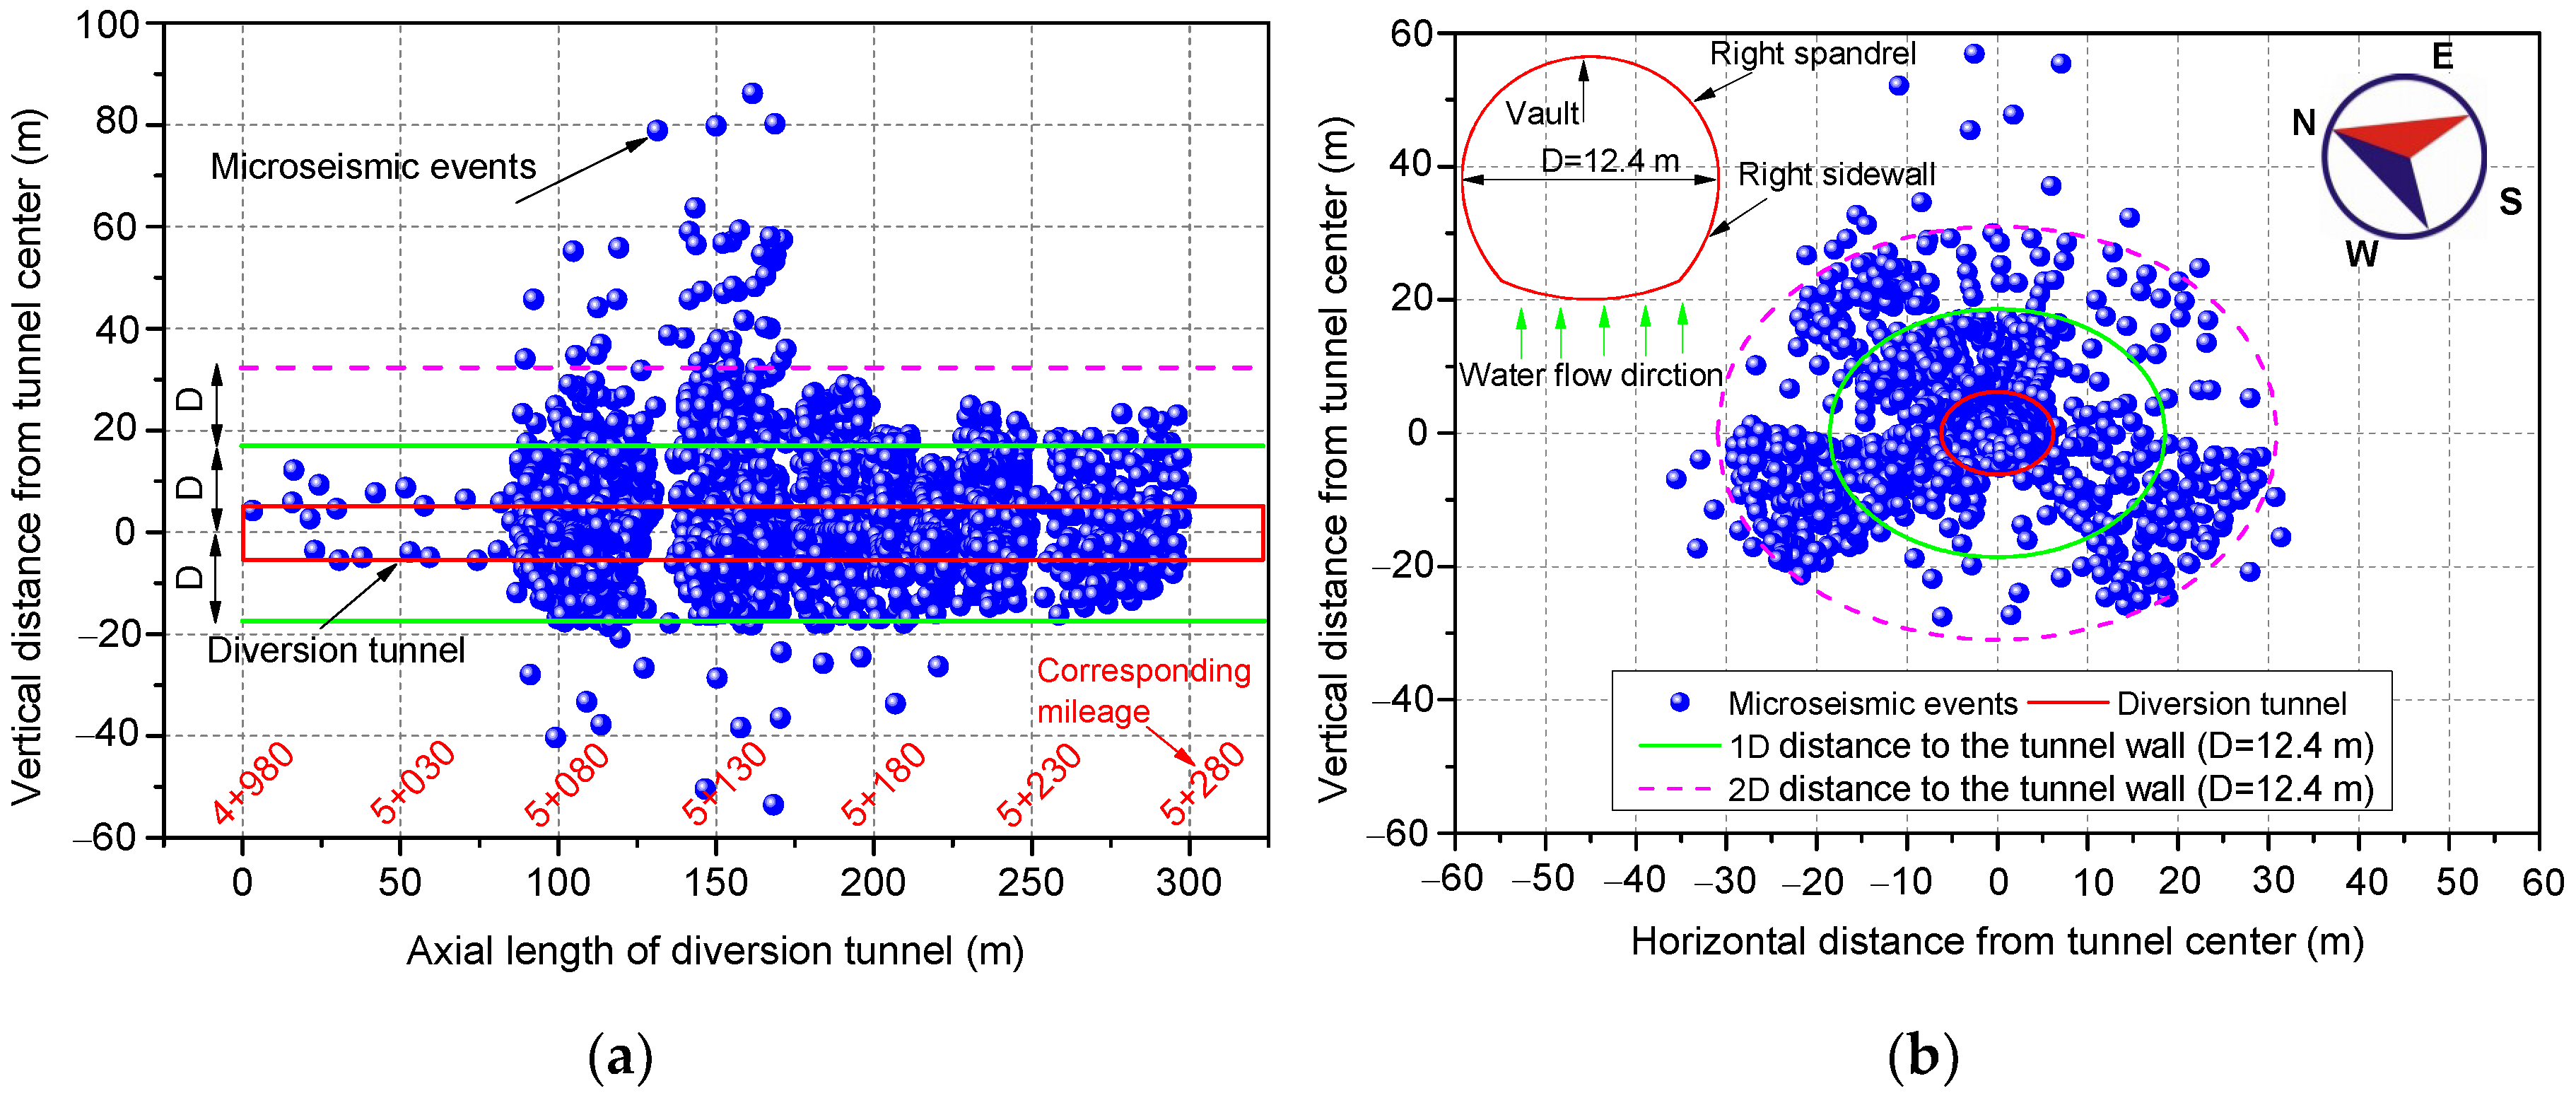
4.2. Spatial Distribution of MS Events

The stress adjustment range of the surrounding rock after the tunnel excavation is closely related to the tunnel diameter. In order to make the findings universal and easy to compare with other projects, the diameter D (12.4 m) is used to represent the distance between the events and the tunnel wall to analyze the distribution of MS events in the radial and axial directions of the tunnel as shown in Figure 10. The center of the heading face is the origin and the tunnel excavation direction is the positive direction of the coordinates. The events are mostly distributed in the range of 2D from the tunnel wall, especially within 1D from the tunnel wall which are the most intensive. It can be seen that a large number of micro-fractures are generated in the surrounding rock within 1D from the tunnel wall. There is high stress concentration and a large amount of strain energy in this area, which provides the energy source for rockburst. From the distribution around the tunnel wall, the events are mainly concentrated near the heading face, the tunnel side wall, and the left spandrel, while the events produced by the arch bottom are fewer and discrete. This indicates that there is high-stress concentration near the dense area of MS events, which will accumulate a large amount of strain energy and pose a high risk of rockburst, and needs high attention. However, the probability of rockburst is low at the arch bottom due to less micro-fracture and less accumulation of strain energy.
According to the field statistics from mileage 9 + 220 to 10 + 775 in diversion tunnel 2, the number of rockbursts above medium strength is 173 as shown in Figure 11. The maximum rockburst occurs at the tunnel vault, accounting for 34.68% of the total. Rockburst at the left side wall, the heading face, the right side wall and the left spandrel accounts for 20.23%, 18.5%, 13.29%, and 8.67% respectively. The rockburst at the arch bottom and the right spandrel is the least, only 3.47% and 1.16%. By comparing the distribution characteristics of rockburst and events in the axial and radial direction of the tunnel, it is clear that the rockburst is basically consistent with the distribution area of events, and the events gathering area gives a good indication of the risk of high rockburst.

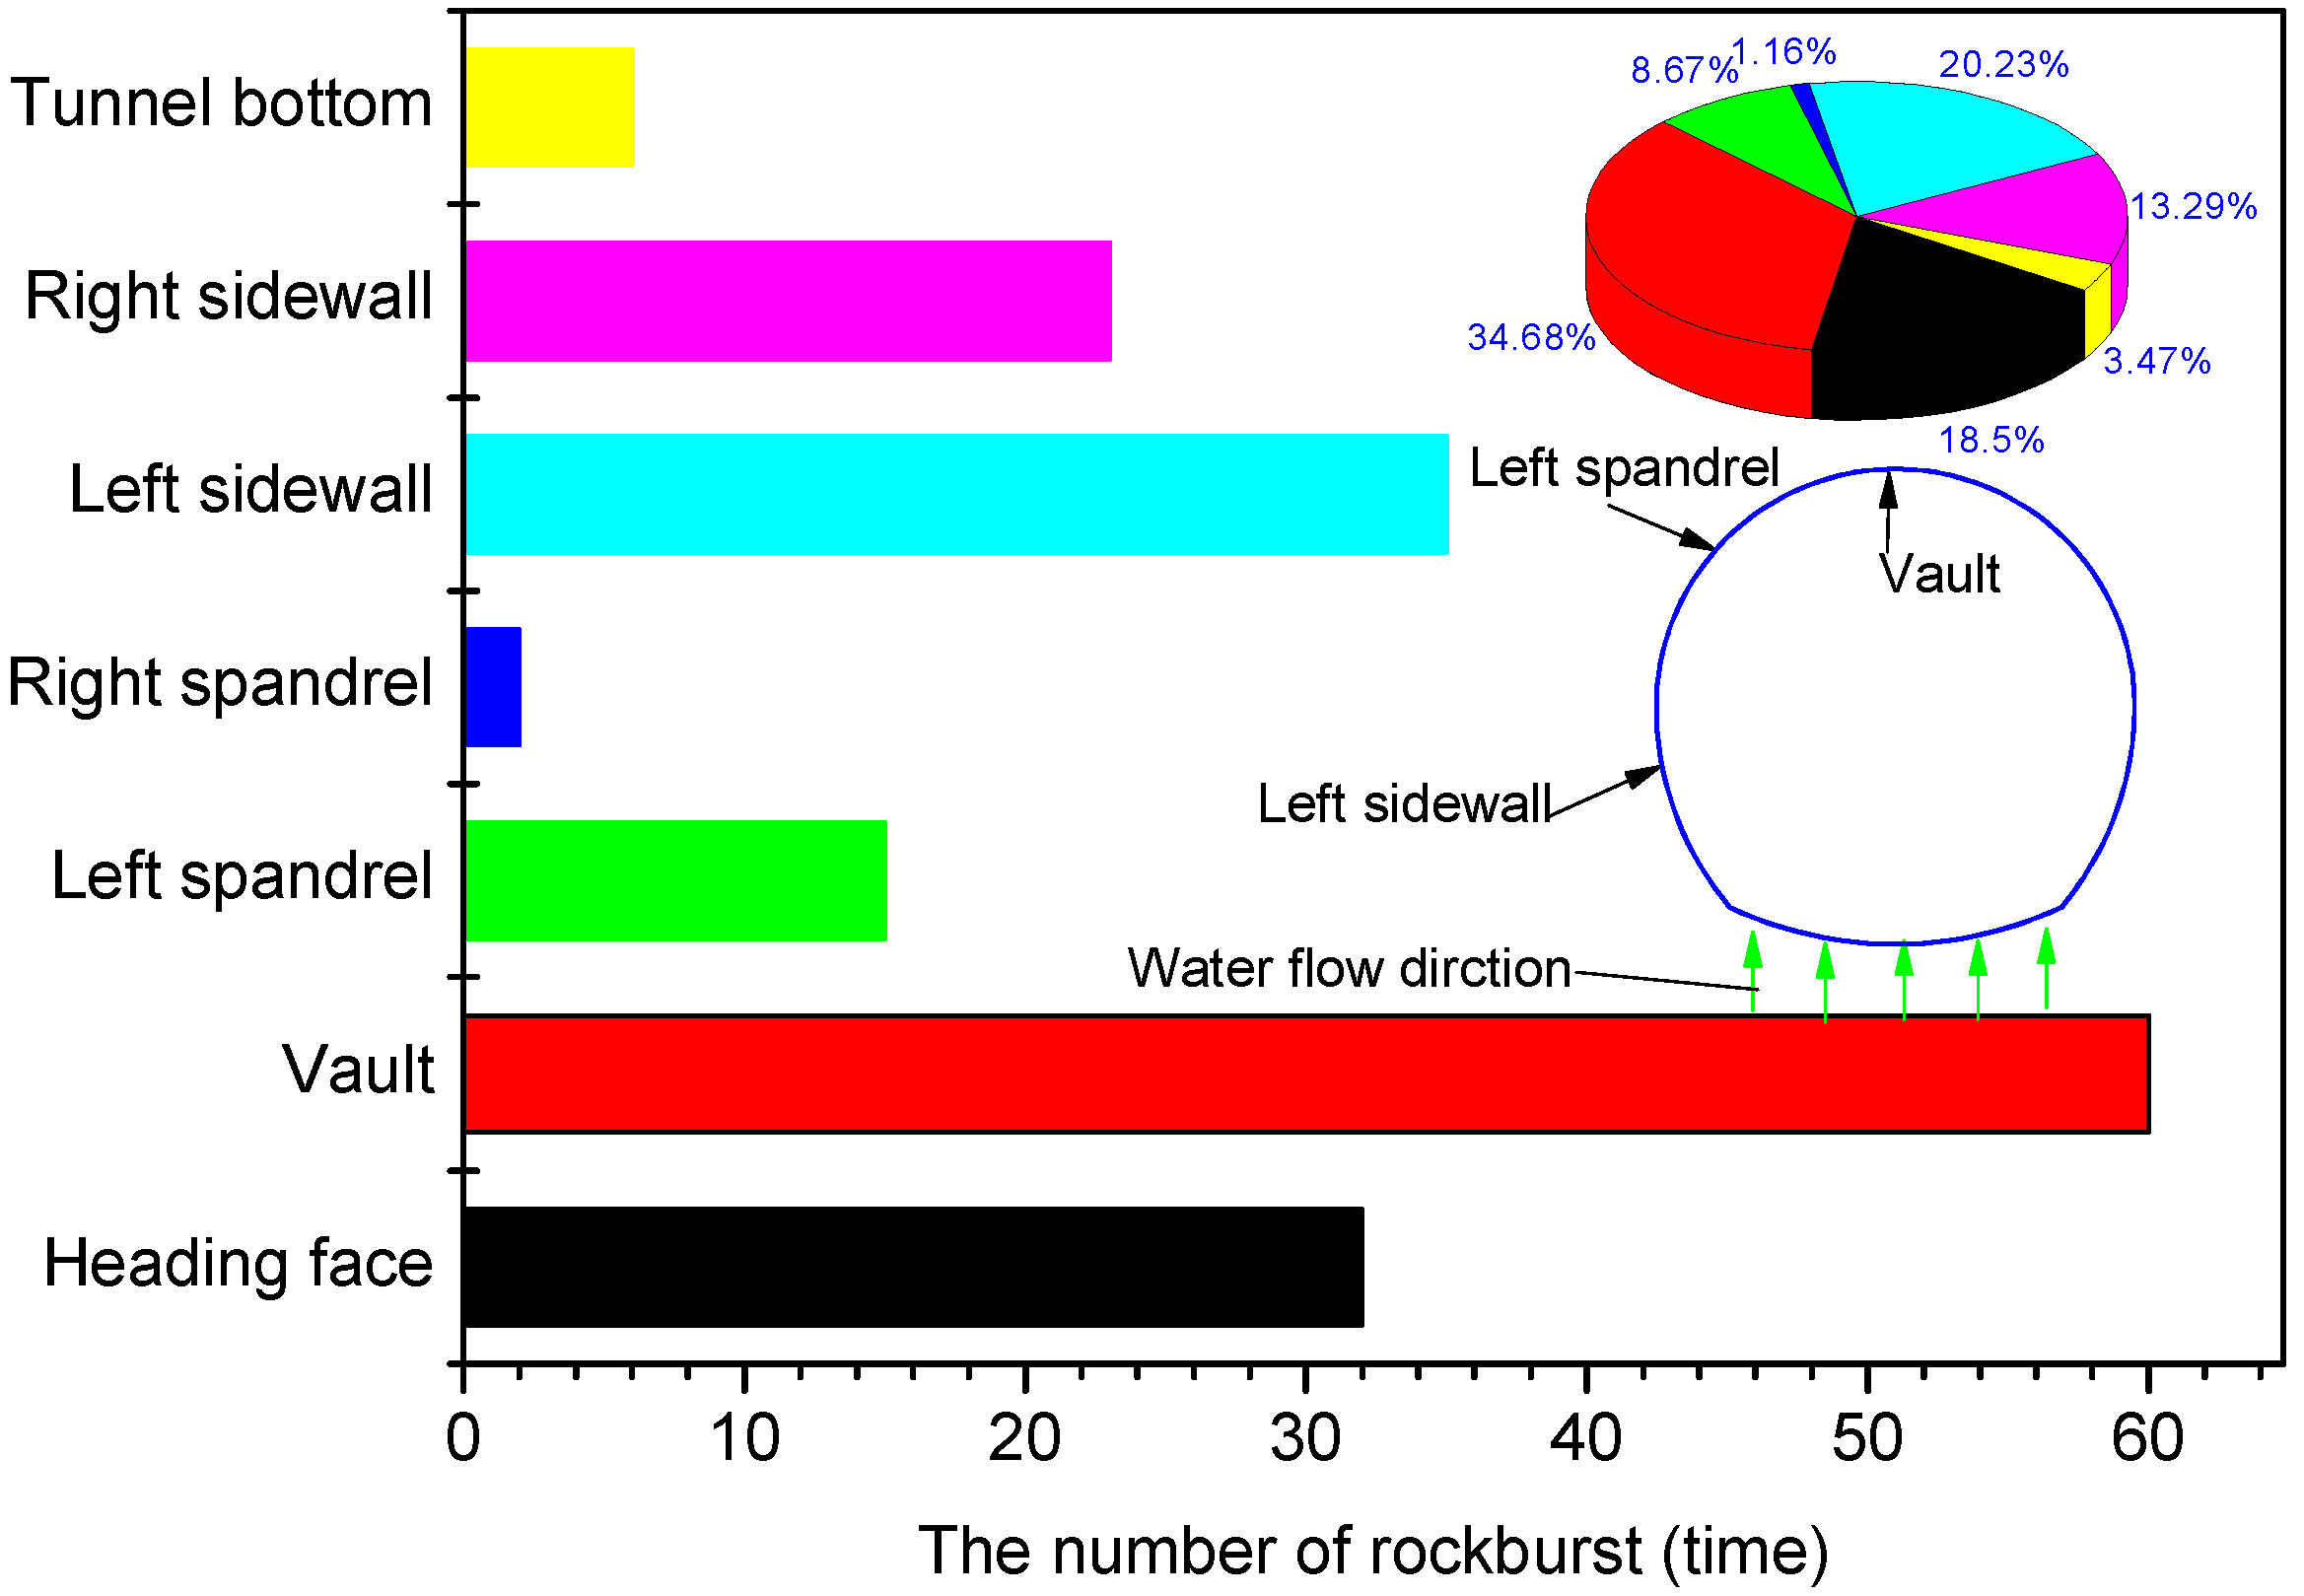
5. Analysis of Rockburst Characteristics

5.1. Stratum Characteristic

The cumulative length of different rockburst grades in different strata in the diversion tunnels is shown in Table 1. It can be seen from the table that the cumulative length of rockburst in the diversion tunnels is 3101.1 m, of which slight rockburst (grade I) accounts for 8.04% of the total excavation length, the medium rockburst (grade II) accounts for 1.62%, the strong rockburst (grade III) accounts for 0.21%, and the extremely strong rockburst (grade IV) accounts for 0.04%. The proportion of rockburst is the highest in T2b Baishan group marble, accounting for 21%, followed by T2y5, T2z, T1, T2y4, T2y6, and T3, accounting for 12.90%, 10.58%, 7.52%, 3.68%, 2.02%, and 1.59% respectively.
The position of the diversion tunnels belongs to the steep slope terrain, and the buried depth reaches 500 m quickly since it enters the main hole, so the rockburst often occurs in the construction process. According to the statistical analysis of the construction site, slight rockburst occurs predominantly before mileage 3 + 000, medium rockburst often occurs after mileage 3 + 000, and strong rockburst occasionally occurs after mileage 4 + 500. The main stratum of the diversion tunnels is Triassic marble, followed by sandstone and slate, and hundreds of meters of mudstone. However, there are certain differences in marble properties in different ages, among which the Baishan group marble has better integrity and brittleness characteristics. The tunnel depth in T2b stratum is more than 1500 m and the groundwater is undeveloped. Moreover, the maximum principal stress, intermediate principal stress, and minimum principal stress increase with buried depth. Therefore, high rock mass strength and in-situ stress provide conditions for the occurrence of rockburst.

5.2. Size Effect of Excavation Section

5.2.1. Rockburst in Auxiliary Tunnels

The rockburst in the Jinping auxiliary tunnels is dominated by continuous type, followed by flaky type, and the proportion of sporadic rockburst is small. The typical flaky rockburst in the construction site is shown in Figure 12a. Approximately 10 minutes after blasting on the heading face at mileage 7 + 188, rockburst and collapse on the left side of the auxiliary tunnel A are induced in the 50 m range from mileage 7 + 120 to 7 + 170 due to the blasting vibration, while the estimated volume is 200 to 300 m3 as shown in Figure 12b. The extremely strong rockburst (grade IV) in the auxiliary tunnel A at mileage 9+503 to 9+523 damaged the support structure and extruded it 4 m towards the tunnel center as shown in Figure 12c. The rockburst is a lumpy and flaky type, and the slumping rock is smoky and hot, lasting for a long time, causing serious damage to the initial support and seriously hindering the construction.

5.2.2. Rockburst in the Drainage Tunnel

Eextremely strong rockburst occurred at mileage 9+283 in the drainage tunnel, resulting in the burying of the tunneling boring machine (TBM) as shown in Figure 13a. The main beam of the TBM machine was directly damaged by the extremely strong rockburst, and its 80 mm steel plate was cut off and the tunneling forced to be interrupted as shown in Figure 13b. It is reckoned that the energy released by the rockburst is equivalent to the energy of a 1.5 magnitude earthquake, and it can be seen that the degree of rockburst is intense.

5.2.3. Rockburst in the Cross Passage of the Diversion Tunnels

The stress is repeatedly adjusted during the construction process because of the alternately heading forward of diversion tunnel 1 and 2. The extremely strong rockburst occurred at the position of 20 m behind the holing-through of diversion tunnel 1, resulting in a 2 m deep rockburst pit and inducing collapse of about 300 m3 on the left side of the arch waist and the side wall as shown in Figure 14.

5.2.4. Rockburst in the Diversion Tunnels

In the section of high in-situ stress, the rockburst in the diversion tunnels is mainly medium and strong rockburst, but the proportion of rockburst length is much smaller than that in the auxiliary tunnels and the drainage tunnel with smaller excavation size. The sizes of the rockburst pits are no more than 2 m, and there is no occurrence of rockburst on the heading face and no extremely strong rockburst. The medium to strong rockburst of the tunnel spandrel and side wall is shown in Figure 15.
The typical rockburst statistics of five tunnels in the range of the extremely high in-situ stress at mileage 7 + 000 to 10 + 000 are shown in Figure 16. The number of rockbursts in the Jinping auxiliary tunnel A is 75, the auxiliary tunnel is 80, the diversion tunnel 1 is 67, the diversion tunnel 2 is 77, and the drainage tunnel is 77. The proportion of rockburst length in the Jinping auxiliary tunnel A, auxiliary tunnel B, diversion tunnel 1, diversion tunnel 2, and drainage tunnel is 28.6%, 26.1%, 11.6%, 6.7%, and 23.3% respectively. It can be seen that the proportion of rockburst length in the Jinping auxiliary tunnels and drainage tunnel is close, which is higher than the diversion tunnels.
Extremely strong rockburst occurred in the Jinping auxiliary tunnels, the drainage tunnel, and the cross passage of diversion tunnels, resulting in serious damage. The diversion tunnels with larger section are mainly slight rockburst and medium strength rockburst. This is consistent with the numerical simulation results, that is, the increase of the tunnel excavation section size can reduce the rockburst strength to a certain extent.
The subsequent construction of the Jinping auxiliary tunnel A occurred with strong rockburst near the position of the medium rockburst in auxiliary tunnel B. The subsequent construction of the cross passage occurred with extremely strong rockburst indicating that the lagging tunnels face more complex stress conditions and larger rockburst risk.

6. Numerical Simulation

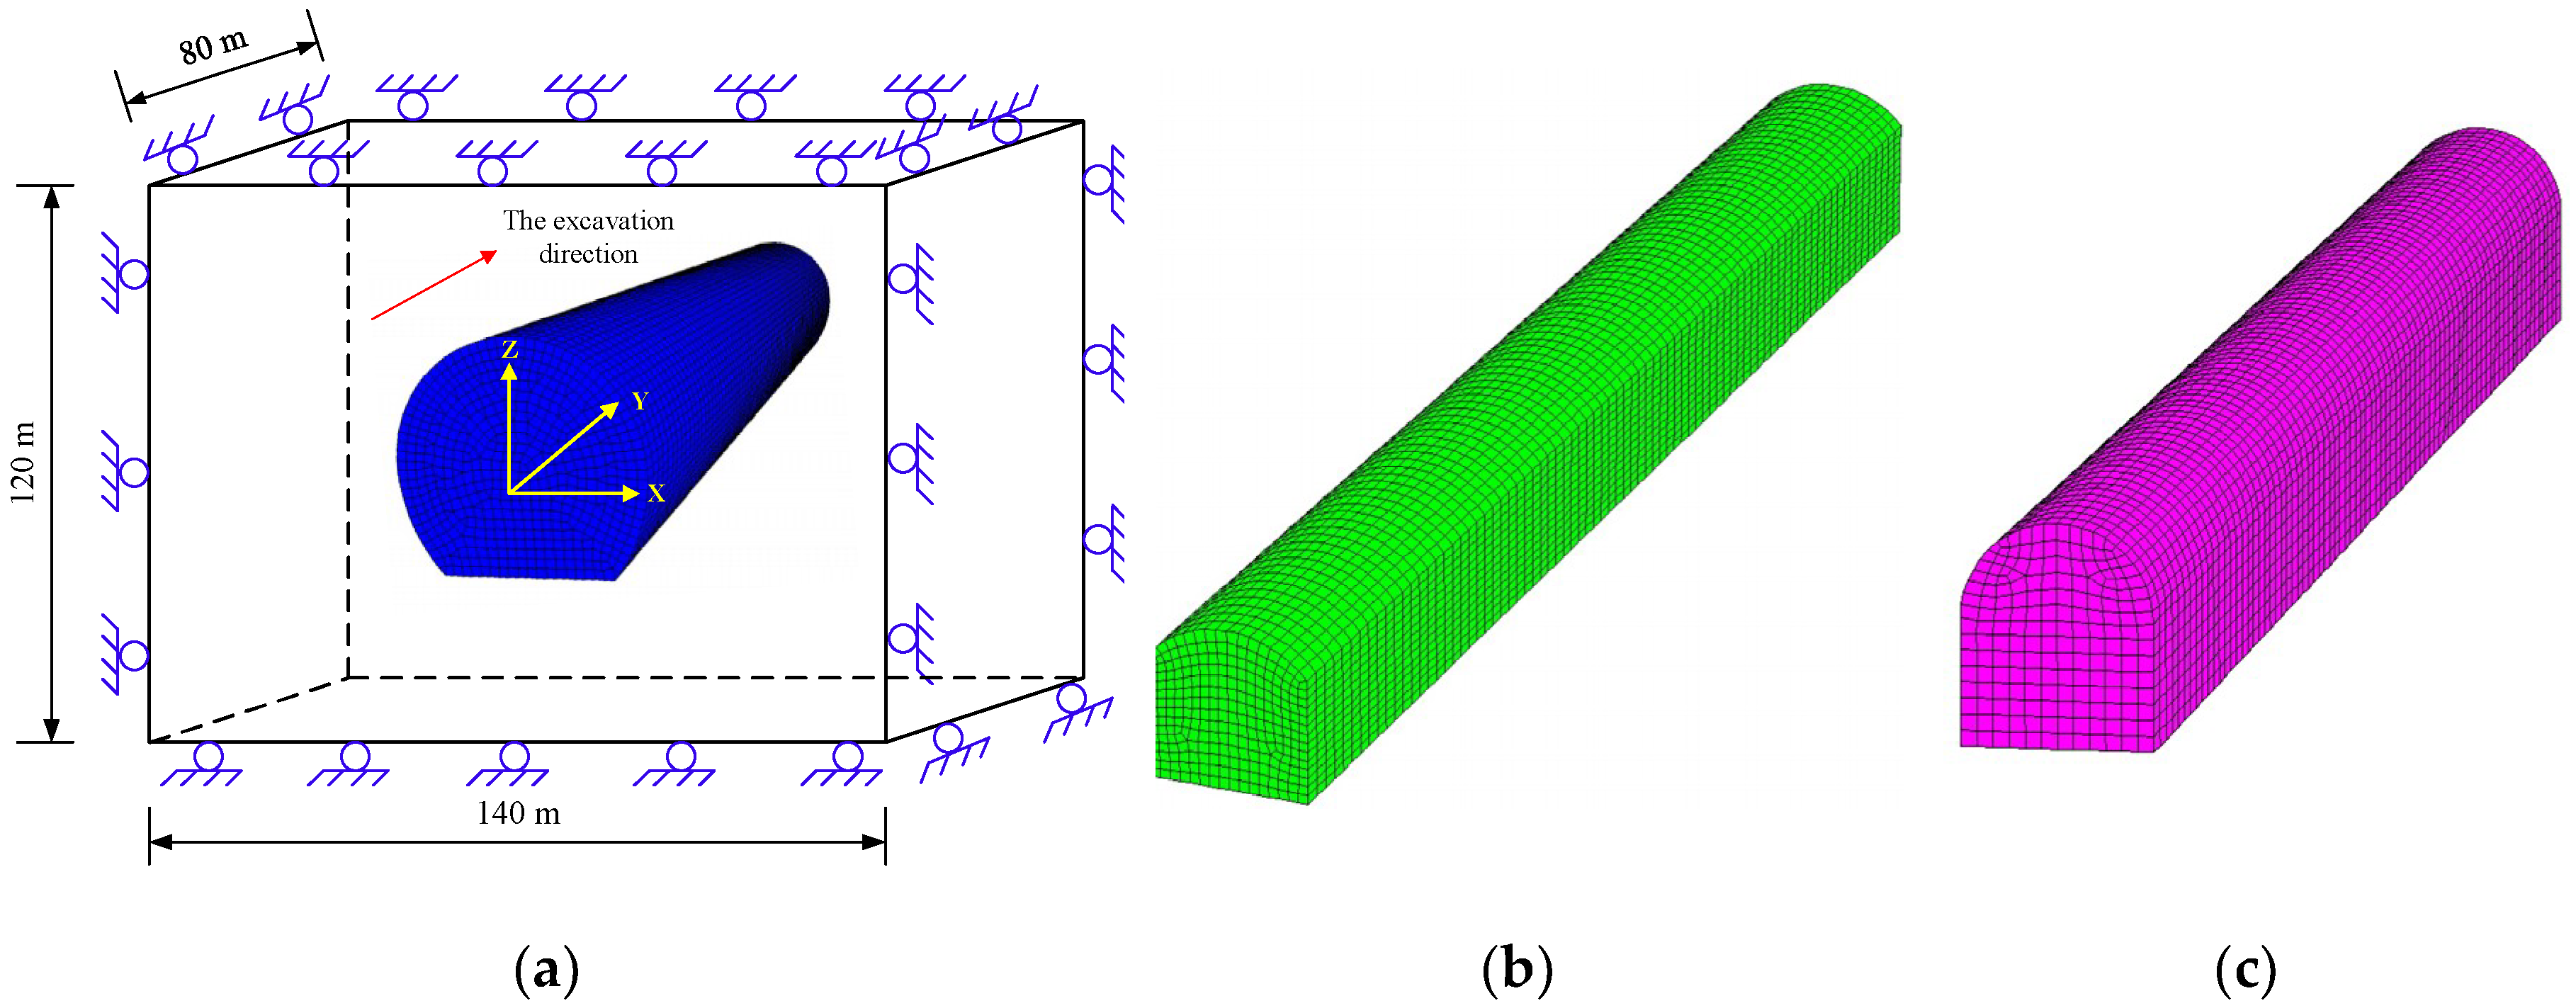
6.1. Model Description

The theory of rockburst proneness proposed by A. Q. Kidybinski a Poland scholar is the most popular method [51]. In this method, a rock uniaxial strength test is used to load the specimen to 70%–80% of its peak strength, and then unload the specimen to obtain the stress–strain curve. The rockburst proneness index Wet can be calculated by Equation (10):
W e t = ϕ s p ϕ s t  
where φsp is the 70%–80% peak strength of rock specimen (MPa), φst is the dissipative plastic deformation energy (J). When Wet < 2.0, no rockburst; when Wet = 2.0–2.5, slight rockburst; when Wet = 3.5–5.0, medium rockburst; when Wet > 5.0, strong rockburst.
According to the test data of five sets of rock specimens in Jinping Auxiliary tunnel [52], the calculation results of rockburst proneness index Wet is shown in Table 2. It indicates there is medium rockburst proneness in the Jinping Auxiliary tunnel. There is little difference in surrounding rock and in-situ stress of the Jinping auxiliary tunnels, diversion tunnels, and cross-passages, which means that the conditions of rockburst are basically the same. However, this method cannot reflect the size effect of the excavation section on the rockburst risk.
The finite difference software FLAC 3D is used to analyze the relationship between the rockburst and the tunnel section size under the same conditions of surrounding rock and in-situ stress. Considering the influence of the boundary effect, the three-dimensional size of the numerical model is set in the horizontal direction x = −70 to 70 m, the vertical direction z = –60 to 60 m, and the longitudinal direction from y = –40 to 40 m. The initial in-situ stress is applied according to the buried depth and the fixed displacement method is used to simulate. The normal displacement constraints are applied to the six sides of the model as shown in Figure 17. Eight-node hexahedral elements are used to simulate the surrounding rock and its mechanical parameters are determined according to the field geological survey data and the strength test of the surrounding rock as shown in Table 3. Each excavation length is 1 m, assuming that the excavation and support are completed instantaneously, and that it has nothing to do with the time. The failure of the support is not considered in the calculation process.

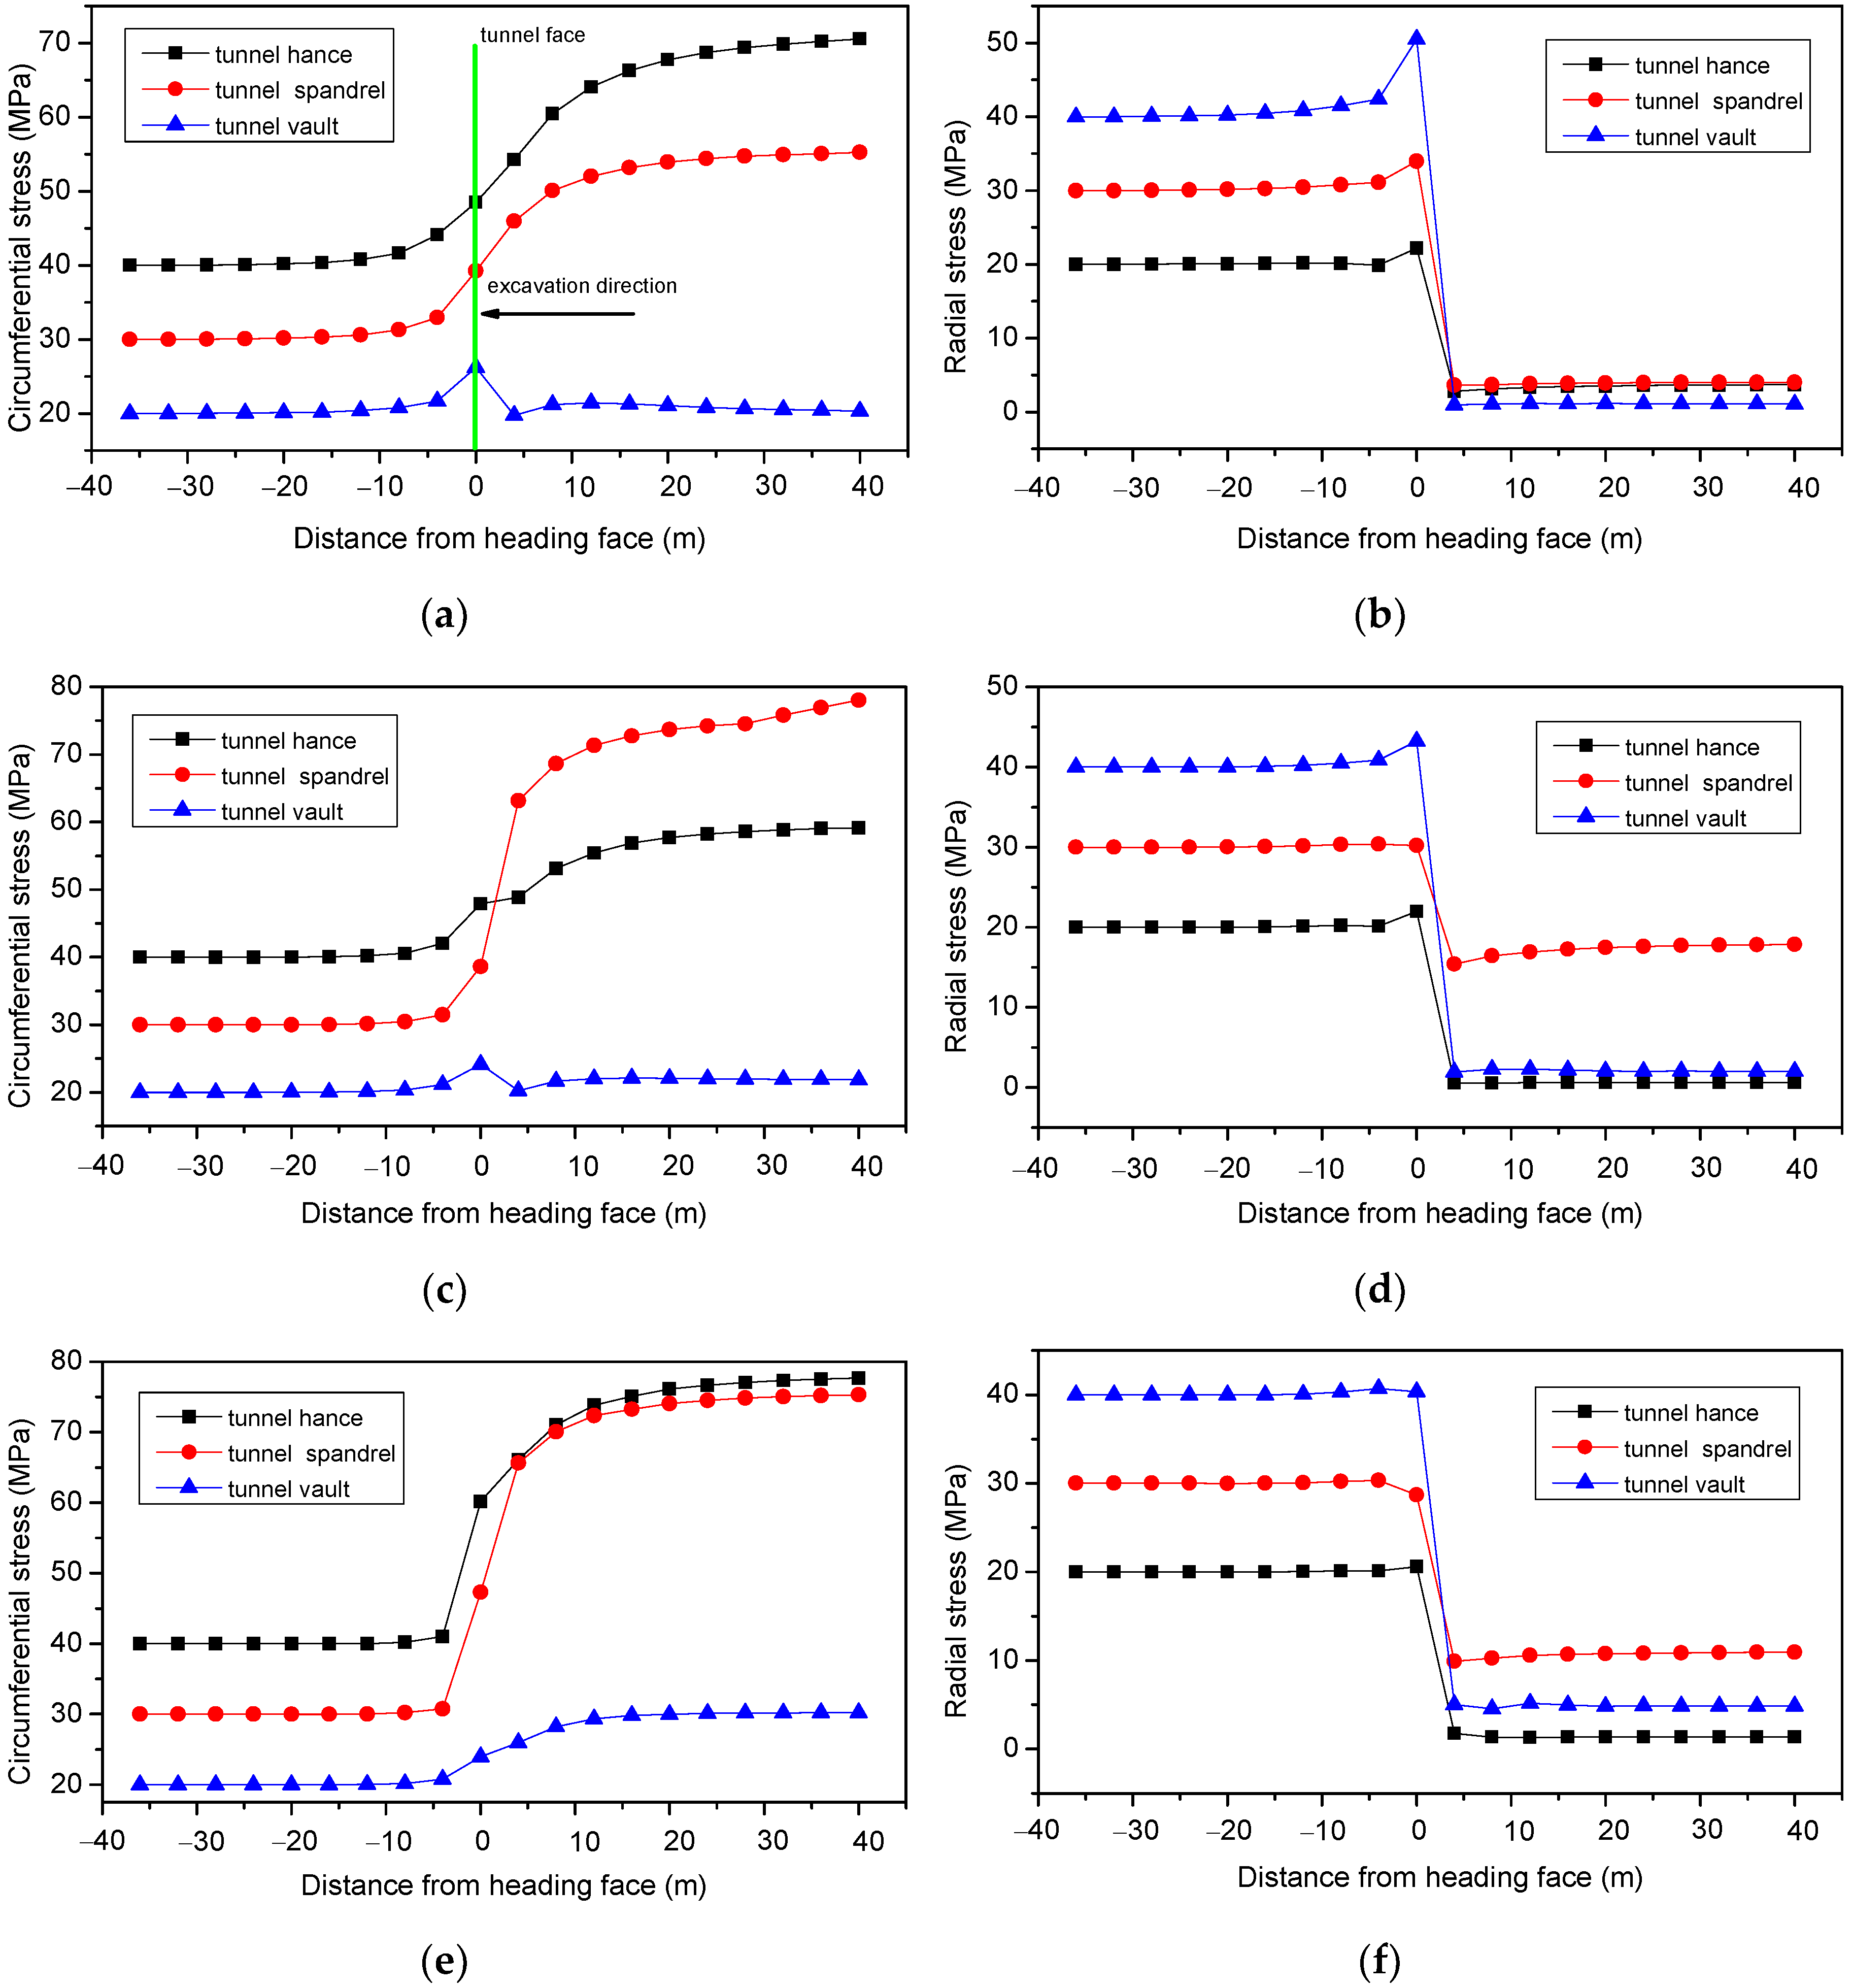
6.2. Simulation Results and Discussion

The variation of the circumferential stress and radial stress during excavation in the three locations of the tunnel, hance, spandrel, and vault is shown in Figure 18. It can be seen that the radial stress of each monitoring point after excavation decreases rapidly, and the value is basically within 10 MPa. However, the circumferential stress is quite different, and the value in tunnel hance and spandrel increases significantly after excavation, while the vault position changes little. The growth rate of the circumferential stress at the tunnel hance of the diversion tunnel is much higher than that of the spandrel and vault, especially in the range of 10 m from the excavation face. It indicates that the rockburst is more likely at this location, which is confirmed by the rockburst record on the site. The variation of circumferential stress in the spandrel of the cross-passage is the largest, followed by the hance, and the vault is the smallest. It is shown that the possibility of rockburst occurring in the spandrel is greater under the same stress condition as the diversion tunnel. The circumferential stress in the spandrel and vault of the auxiliary tunnel is larger, and the maximum stress value is 80 MPa. Rockburst is more likely to occur in the vault and spandrel positions, as evidenced by the rockburst statistics at the Jinping auxiliary tunnels.

7. Conclusions

Rockburst problems induced by high in-situ stresses are prominent during the construction of underground engineering. Early warning of rockburst is of great significance and remains as a worldwide challenge in geotechnical engineering. Based on the MS monitoring system in the tunnel group of the Jinping II hydropower station of China, this paper analyzed the spatiotemporal distribution of MS events in the process of construction, and discussed in detail the size effect of rockburst risk by statistical analysis and numerical simulation. The following conclusions are drawn:
The MS monitoring results show that the spatiotemporal distribution characteristics of MS events have good correlation and consistency with the distribution law of rockburst. The active period of microseisms and the high-incidence period of rockburst are within 1.5 h after the disturbance of the surrounding rock. The greater the disturbance of the operation procedure to the surrounding rock, the more active the surrounding rock MS activity. The MS events within 1 D from the tunnel wall are the most intensive, the events and rockburst are mainly concentrated near the heading face, the tunnel side wall, and the left spandrel, while the events produced by the arch bottom are less and discrete.
The sudden decline of the energy index and the sudden rise of the apparent volume are the significant characteristics of the rockburst. The phenomenon that MS events are gradually concentrated in a certain area and increasing large-magnitude and high-energy events indicate a precursor of high rockburst risk.
The results based on 278 different grades of rockburst prediction in 168 sections of the diversion tunnels and the drainage tunnel show that the accuracy rate of rockburst prediction is 61.8%, of which the accuracy rate of the medium and strong rockburst is 80.3%. Although the time of rockburst cannot be predicted accurately, it can still give early warning of the location of the rockburst in advance.
The rockburst statistics show that the rockburst frequency and intensity are relatively high when the in-situ stress is large. No matter what are the proportions of the rockburst length or the strong to extremely strong rockburst ratio, the auxiliary tunnels and the drainage tunnel are all higher than the diversion tunnel. The statistical data of rockburst is consistent with the numerical simulation results in that the increase of the tunnel excavation section size can reduce the rockburst strength to a certain extent.

Author Contributions

H.Z. analyzed the calculation results and wrote the article; L.C. carried out the numerical simulation; S.C. offered useful suggestions for the preparation and writing of the paper; J.S. processed the data; and J.Y. provided the information of the construction site.

Funding

The study was supported by National Natural Science Foundation of China (NSFC) under Grant No. 51508037.

Acknowledgments

We also highly appreciate the contribution of data collection from 2nd Engineering Pte Ltd. of the Chinese Railway 2nd Bureau, Ertan Hydropower Development Company, Ltd., and East China Investigation and Design Institution. Finally, the authors would like to thank reviewers for useful comments and editors for improving the manuscript.

Conflicts of Interest

The authors declare no conflict of interest.

References

  1. Kaiser, P.K.; Cai, M. Design of rock support system under rockburst condition. J. Rock Mech. Geotech. Eng. 2012, 4, 215–227. [Google Scholar] [CrossRef]
  2. Feng, X.T.; Yang, Y.; Feng, G.L.; Xiao, Y.X.; Chen, B.R.; Jiang, Q. Fractal behaviour of the microseismic energy associated with immediate rockbursts in deep, hard rock tunnels. Tunn. Undergr. Space Technol. 2016, 51, 98–107. [Google Scholar] [CrossRef]
  3. Zhang, Z.Q.; Zhang, H.; Tan, Y.J.; Yang, H.Y. Natural wind utilization in the vertical shaft of a super-long highway tunnel and its energy saving effect. Build. Environ. 2018, 145, 140–152. [Google Scholar] [CrossRef]
  4. Zhang, Z.Q.; Shi, X.Q.; Wang, B.; Li, H.Y. Stability of NATM tunnel faces in soft surrounding rocks. Comput. Geotech. 2018, 96, 90–102. [Google Scholar] [CrossRef]
  5. Hudyma, M.; Potvin, Y.H. An engineering approach to seismic risk management in hardrock mines. Rock Mech. Rock Eng. 2010, 43, 891–906. [Google Scholar] [CrossRef]
  6. Beck, D.A.; Brady, B.H.G. Evaluation and application of controlling parameters for seismic events in hard-rock mines. Int. J. Rock Mech. Min. Sci. 2002, 39, 633–642. [Google Scholar] [CrossRef]
  7. Li, T.B.; Ma, C.C; Zhu, M.L.; Meng, L.B.; Chen, G.Q. Geomechanical types and mechanical analyses of rockbursts. Eng. Geol. 2017, 222, 72–83. [Google Scholar]
  8. Hatzor, Y.H.; He, B.G.; Feng, X.T. Scaling rockburst hazard using the DDA and GSI methods. Tunn. Undergr. Space Technol. 2017, 70, 343–362. [Google Scholar] [CrossRef]
  9. Chen, B.R.; Feng, X.T.; Li, Q.P.; Luo, R.Z.; Li, S.J. Rock burst intensity classification based on the radiated energy with damage intensity at Jinping II hydropower station, China. Rock Mech. Rock Eng. 2015, 48, 289–303. [Google Scholar] [CrossRef]
  10. He, M.C.; Sousa, L.R.; Miranda, T.; Zhu, G.L. Rockburst laboratory tests database- Application of data mining techniques. Eng. Geol. 2015, 185, 116–130. [Google Scholar] [CrossRef]
  11. Cai, M.; Kaiser, P.K.; Martin, C.D. Quantification of rock mass damage in underground excavations from microseismic event monitoring. Int. J. Rock Mech. Min. Sci. 2001, 38, 1135–1145. [Google Scholar] [CrossRef]
  12. Naji, A.M.; Rehman, H.; Emad, M.Z.; Yoo, H. Impact of Shear Zone on Rockburst in the Deep Neelum-Jehlum Hydropower Tunnel: A Numerical Modeling Approach. Energies 2018, 11, 1935. [Google Scholar] [CrossRef]
  13. Xue, Y.; Cao, Z.; Du, F.; Zhu, L. The influence of the backfilling roadway driving sequence on the rockburst risk of a coal pillar based on an energy density criterion. Sustainability 2018, 10, 2609. [Google Scholar] [CrossRef]
  14. Wang, Z.Y.; Dou, L.M.; Wang, G.F. Mechanism analysis of roadway rockbursts induced by dynamic mining loading and its application. Energies 2018, 11, 2313. [Google Scholar] [CrossRef]
  15. Ma, K.; Tang, C.A.; Wang, L.X.; Tang, D.H.; Zhuang, D.Y.; Zhang, Q.B.; Zhao, J. Stability analysis of underground oil storage caverns by an integrated numerical and microseismic monitoring approach. Tunn. Undergr. Space Technol. 2016, 54, 81–91. [Google Scholar] [CrossRef] [Green Version]
  16. Xie, H.; Pariseau, W.G. Fractal character and mechanism of rock bursts. Int. J. Rock Mech. Min. Sci. 1993, 30, 343–350. [Google Scholar] [CrossRef]
  17. Gong, Q.M.; Yin, L.J.; Wu, S.Y.; Zhao, J.; Ting, Y. Rock burst and slabbing failure and its influence on TBM excavation at headrace tunnels in Jinping II hydropower station. Eng. Geol. 2012, 124, 98–108. [Google Scholar] [CrossRef]
  18. Urbancic, T.I.; Trifu, C.I. Recent advances in seismic monitoring technology at Canadian mines. J. Appl. Geophy. 2000, 45, 225–237. [Google Scholar] [CrossRef]
  19. Durrheim, R.J.; Haile, A.; Roberts, M.K.C.; Schweitzer, J.K.; Spottiswoode, S.M.; Klokow, J.W. Violent failure of a remnant in a deep South African gold mine. Tectonophysics 1998, 289, 105–116. [Google Scholar] [CrossRef]
  20. Milev, A.M.; Spottiswoode, S.M.; Rorke, A.J.; Finnie, G.J. Seismic monitoring of a simulated rockburst on a wall of an underground tunnel. J. S. Afr. Inst. Min. Metall. 2001, 101, 253–260. [Google Scholar]
  21. Basson, F.R.P.; Van Der Merwe, S. Seismicity Management as Hill 50 Gold Mine, Western Australia. In Proceedings of the Fourth International Seminar on Deep and High Stress Mining, 7–9 November, Perth; Australian Centre for Geomechanics: Perth, Australia, 2007; pp. 233–242. [Google Scholar]
  22. Yang, C.X.; Luo, Z.Q.; Hu, G.B.; Liu, X.M. Application of a microseismic monitoring system in deep mining. J. Univ. Sci. Technol. B 2007, 14, 6–8. [Google Scholar] [CrossRef]
  23. Wang, J.M.; Zeng, X.H.; Zhou, J.F. Practices on rockburst prevention and control in headrace tunnels of Jinping II hydropower station. J. Rock Mech. Geotech Eng. 2012, 4, 258–268. [Google Scholar] [CrossRef]
  24. Wang, H.L.; Ge, M.C. Acoustic emission/microseismic source location analysis for a limestone mine exhibiting high horizontal stresses. Int. J. Rock Mech. Min. Sci. 2008, 45, 720–728. [Google Scholar] [CrossRef]
  25. Afraei, S.; Shahriar, K.; Madani, S.H. Developing intelligent classification models for rock burst prediction after recognizing significant predictor variables, Section 1: Literature review and data preprocessing procedure. Tunn. Undergr. Space Technol. 2019, 83, 324–353. [Google Scholar] [CrossRef]
  26. Cai, W.; Dou, Li.M.; Zhang, M.; Cao, W.Z.; Shi, J.Q.; Feng, L.F. A fuzzy comprehensive evaluation methodology for rock burst forecasting using microseismic monitoring. Tunn. Undergr. Space Technol. 2018, 80, 232–245. [Google Scholar] [CrossRef]
  27. Srinivasan, C.; Arora, S.K.; Benady, S. Precursory monitoring of impending rockbursts in Kolar gold mines from microseismic emissions at deeper levels. Int. J. Rock Mech. Min. Sci. 1999, 36, 941–948. [Google Scholar] [CrossRef]
  28. Xu, J.; Jiang, J.D.; Xu, N.; Liu, Q.S.; Gao, Y.F. A new energy index for evaluating the tendency of rockburst and its engineering application. Eng. Geol. 2017, 230, 46–54. [Google Scholar] [CrossRef]
  29. Li, S.J.; Feng, X.T.; Li, Z.H.; Chen, B.R.; Zhang, C.Q.; Zhou, H. In situ monitoring of rockburst nucleation and evolution in the deeply buried tunnels of Jinping II hydropower station. Eng. Geol. 2012, 137–138, 85–96. [Google Scholar] [CrossRef]
  30. Dai, F.; Li, B.; Xu, N.W.; Zhu, Y.G. Microseismic early warning of surrounding rock mass deformation in the underground powerhouse of the Houziyan hydropower station, China. Tunn. Undergr. Space Technol. 2017, 62, 64–74. [Google Scholar] [CrossRef]
  31. Dai, F.; Li, B.; Xu, N.W.; Fan, Y.L.; Zhang, C.Q. Deformation forecasting and stability analysis of large-scale underground powerhouse caverns from microseismic monitoring. Int. J. Rock Mech. Min. Sci. 2016, 86, 269–281. [Google Scholar] [CrossRef]
  32. Dai, F.; Jiang, P.; Xu, N.W.; Chen, W.F.; Tan, Y.S. Focal mechanism determination for microseismic events and its application to the left bank slope of the Baihetan hydropower station in China. Environ. Earth Sci. 2018, 77, 268. [Google Scholar] [CrossRef]
  33. Feng, G.L.; Feng, X.T.; Chen, B.R.; Xiao, Y.X. Microseismic sequences associated with rockbursts in the tunnels of the Jinping II hydropower station. Int. J. Rock Mech. Min. Sci. 2015, 80, 89–100. [Google Scholar] [CrossRef]
  34. Feng, G.L.; Feng, X.T.; Chen, B.R.; Xiao, Y.X. Performance and feasibility analysis of two microseismic location methods used in tunnel engineering. Tunn. Undergr. Space Technol. 2017, 63, 183–193. [Google Scholar] [CrossRef]
  35. Tang, C.A.; Wang, J.M.; Zhang, J.J. Preliminary engineering application of microseismic monitoring technique to rockburst prediction in tunneling of Jinping II project. Int. J. Rock Mech. Min. Sci. 2010, 2, 193–208. [Google Scholar] [CrossRef]
  36. Ma, T.H.; Tang, C.A.; Tang, L.X.; Zhang, W.D.; Wang, L. Rockburst characteristics and microseismic monitoring of deep-buried tunnels for Jinping II Hydropower Station. Tunn. Undergr. Space Technol. 2015, 49, 345–368. [Google Scholar] [CrossRef]
  37. Xu, N.W.; Li, T.B.; Dai, F.; Li, B.; Zhu, Y.G.; Yang, D.S. Microseismic monitoring and stability evaluation for the large scale underground caverns at the Houziyan hydropower station in Southwest China. Eng. Geol. 2015, 188, 48–67. [Google Scholar] [CrossRef]
  38. Zhang, J.S.; Lu, J.Y.; Jia, Y.R. Study of rockburst in the tunnel in Tianshengqiao II hydropower station. Water Power 1991, 10, 34–37. [Google Scholar]
  39. Zhou, D.P.; Hong, K.R. The rockburst features of Taipingyi tunnel and the prevention methods. Chin. J. Rock Mech. Eng. 1995, 14, 171–178. [Google Scholar]
  40. Xu, L.S.; Wang, L.S. Study of the laws of rockburst and its forecasting in the tunnel of Erlang mountain road. Chin. J. Geotech Eng. 1999, 21, 569–572. [Google Scholar]
  41. Gu, M.C.; He, F.L.; Chen, C.Z. Study of rockburst in Qinling tunnel. Chin. J. Rock Mech. Eng. 2002, 21, 1324–1329. [Google Scholar]
  42. Li, C.J.; Li, H.Q. Rockburst characteristics and treatment methods in Qinling tunnel. Tunn. Undergr. Works. 1999, 1, 36–41. [Google Scholar]
  43. Eberhart, R.C.; Kennedy, J. A new optimizer using particle swarm theory. In Proceedings of the Sixth International Symposium on Micro Machine and Human Science, Nagoya, Japan, 4–6 October 1995; IEEE: Piscataway, NJ, USA, 1995; pp. 39–43. [Google Scholar]
  44. Chen, B.R.; Feng, X.T.; Li, S.L.; Yuan, J.P.; Xu, S.C. Microseism source location with hierarchical strategy based on particle swarm optimization. Chin J. Rock Mech. Eng. 2009, 28, 741–749. [Google Scholar]
  45. Dong, L.J.; Li, X.B.; Tang, L.Z.; Gong, F.Q. Mathematical functions and parameters for microseismic source loction without pre-measuring speed. Chin J. Rock Mech. Eng. 2011, 30, 2057–2067. [Google Scholar]
  46. Kennedy, J.; Eberhart, R.C. Particle Swarm Optimization. In Proceedings of the 1995 IEEE International Conference on Neural Networks, Perth, Australia, 27 November–1 December 1995; IEEE: Piscataway, NJ, USA, 1995; pp. 1942–1948. [Google Scholar]
  47. Shi, Y.; Eberhart, R.C. Empirical study of particle swarm optimization. In Proceedings of the 1999 Congress on Evolutionary Computation, Washington, DC, USA, 6–9 July 1999; IEEE: Piscataway, NJ, USA, 1999; pp. 1945–1950. [Google Scholar]
  48. Li, L.J.; Huang, Z.B.; Liu, F.; Wu, Q.H. A heuristic particle swarm optimizer for optimization of pin connected structures. Comput Struct. 2007, 85, 340–349. [Google Scholar] [CrossRef]
  49. Seyedpoor, S.M.; Salajegheh, J.; Salajegheh, E.; Gholizadeh, S. Optimal design of arch dams subjected to earthquake loading by a combination of simultaneous perturbation stochastic approximation and particle swarm algorithms. Appl Soft Comput. 2011, 11, 39–48. [Google Scholar] [CrossRef]
  50. Eberhart, R.C.; Shi, Y. Tracking and optimizing dynamic systems with particle swarms. In Proceedings of the 2001 Congress on Evolutionary Computation, Seoul, Korea, 27–30 May 2001; IEEE: Piscataway, NJ, USA, 2001; pp. 94–100. [Google Scholar]
  51. Kidybinski, A.Q. Bursting liability indices of coal. Int. J. Rock Mech. Min. Sci. 1981, 18, 295–304. [Google Scholar] [CrossRef]
  52. Liu, N.; Zhang, C.S.; Chu, W.J.; Ni, S.H. Discussion on size effect of rock burst risk in deep buried tunnel. Chin J. Rock Mech. Eng. 2017, 36, 2514–2521. [Google Scholar]
Figure 1. Layout and geologic condition of the Jinping II Hydropower Station: (a) Plane layout; (b) Engineering geologic profile.
Energies 11 03257 g001
Figure 2. Flowchart of microseismic (MS) source location algorithm with hierarchical strategy based on particle swarm optimization (PSO).
Energies 11 03257 g002
Figure 3. MS monitoring system of the Jinping II hydropower station.
Energies 11 03257 g003
Figure 4. Layout of sensors.
Energies 11 03257 g004
Figure 5. The connection of monitoring equipment.
Energies 11 03257 g005
Figure 6. Waveforms of typical MS sources: (a) Electric current; (b) Knocking; (c) Rock drill; (d) Tunneling boring machine (TBM) construction; (e) Fan; (f) Locomotive whistle; (g) Microseisms; (h) Rockburst.
Energies 11 03257 g006
Figure 7. The comparison of MS events before (a) and after (b) filtering.
Energies 11 03257 g007
Figure 8. Significant characteristics of rockburst: (a) MS events before an extreme rockburst; (b) The apparent volume and energy index.
Energies 11 03257 g008
Figure 9. Time distribution law of MS events.
Energies 11 03257 g009
Figure 10. Spatial distribution of MS events: (a) Longitudinal section; (b) Cross section.
Energies 11 03257 g010
Figure 11. Field statistics of rockburst in diversion tunnel 2.
Energies 11 03257 g011
Figure 12. Rockburst in auxiliary tunnels: (a) Extremely strong rockburst; (b) Induced collapse; (c) Support structure damage.
Energies 11 03257 g012
Figure 13. Rockburst in drainage tunnel: (a) TBM is buried; (b) 80 mm steel plate is damaged.
Energies 11 03257 g013
Figure 14. Rockburst in cross passage.
Energies 11 03257 g014
Figure 15. Rockburst in the drainage tunnel.
Energies 11 03257 g015
Figure 16. Rockburst statistics in auxiliary tunnel, diversion tunnel and drainage tunnel: (a) The number of rockbursts: (b) The length of rockburst.
Energies 11 03257 g016
Figure 17. Three-dimensional numerical model: (a) Diversion tunnel; (b) Cross passage; (c) Auxiliary tunnel.
Energies 11 03257 g017
Figure 18. Stress variation of monitoring points after three types of section excavation: (a) Circumferential stress of the diversion tunnel; (b) Radial stress of the diversion; (c) Circumferential stress of the cross passage; (d) Radial stress of the cross passage; (e) Circumferential stress of the auxiliary tunnel; (f) Radial stress of the auxiliary tunnel.
Energies 11 03257 g018
Table 1. Statistics of the rockburst length in different stratum.
Statistical ItemLength of Each Stratum Lithology (m)Total (m)Percentage (%)
T2y4T2y5T2y6T1T2zT2bT3Accounting for Total Length of RockburstAccounting for Total Excavation Length
Grade I rockburst231039.2111229752351132518.281.208.04
Grade II rockburst6243.5051081440506.516.331.62
Grade III rockburst14000051.4065.42.110.21
Grade IV rockburst00000110110.350.04
Rockburst in total (m)431282.7111234860557.4133101.11009.90
Stratum length (m)11709942.95501.531108025.52654.5816.531320.9//
Table 2. Calculated results of rockburst proneness index.
Specimen NumberRockburst Proneness Index WetAverage ValueRockburst Risk
13.823.59Medium rockburst
22.98
33.54
43.25
54.38
Table 3. Mechanical parameters of surrounding rock.
Density
ρ (kg/m3)
Poisson Ratio
μ
Internal Friction Angle
φ (°)
Cohesion
C (MPa)
Elasticity Modulus
E (GPa)
27000.2457.535

