Abstract
This paper presents a couple of methods to evaluate the heat removal factor FR of flat plate solar collectors, as well as a parametric study of the FR against the tilt angle β, and (Ti − Ta)/G, and its effects on the a0-factor (FRτα) and the a1-factor (FRULmin). The proposed methods were based on indoor flow calorimetry. The first method considers the ratio of the actual useful heat to the maximum useful heat. The second takes into account the slopes of the family of efficiency curves (FRULmin) according to ANSI/ASHRAE 93-2010, and the minimum overall heat loss coefficient, ULmin. In both methods, a feedback temperature control at collector inclinations from horizontal to vertical allows the inlet temperature and the emulating of the solar radiation to be established by electrical heating. The performance of the methods was determined in terms of the uncertainty of the FR. Method 1 allowed a three-fold improved precision compared to Method 2; however, this implied a more detailed experimental setup. According to the first method, the effects of the tilt angle β, and the (Ti − Ta)/G, on the a0-factor were considerable, since FR is directly proportional to the a0-factor. The changes in (Ti − Ta)/G caused an average change in FR of 32% The FR shows almost linear behavior for inclinations from horizontal to vertical with a 14.5% change. The effects of β on the a1-factor were not considerable, due to the compensation between the increase in FR and the decrease in ULmin as β increased.
Highlights
- The effects of tilt angle and (Ti − Ta)/G on the FR, a0-factor and a1-factor, were investigated using indoor flow calorimetry.
- The method based on the ratio of the actual useful heat to the maximum useful heat shows considerably improved behavior in terms of uncertainty.
- The FR shows linear behavior for inclinations from horizontal to vertical with a change of 14.5%.
- The changes in (Ti − Ta)/G caused an average change in FR of 32%.
- The effect of the variation of the tilt angle and the (Ti − Ta)/G-value on the a0-factor is considerable since the FR is directly proportional to the a0-factor.
- The changes in inclination do not considerably affect the a1-factor due to the compensation between the increase in FR and the decrease in ULmin when β increases.
1. Introduction
In 2014, flat plate collector heating represented 22.4% (83.9 GWth) of the total worldwide solar heating, and this percentage continues to grow [1]. The characterization and simulation have improved commercialization in many types of process, first for low temperature (<80 °C) and more recently in the medium temperature range (80–250°). The characterization reduces estimating uncertainty and allows better economic scenarios, which are welcome for the solar heating industry.
Flat plate solar collector characterizations are now used to determine the ao, a1, and the IAM as indicated by [2,3,4,5,6], among other standards and publications. The FR refers to the thermal effectiveness of solar collectors viewed as heat exchangers, while the a0 (FRτα) is the fraction of the solar radiation GAa that gains the collector, and the a1 (FRULmin) is the factor of heat losses of the solar collector due to the ambient effect. Most of the solar collector’s studies consider the ULmin as a constant; it is the case in which the efficiency against (Ti − Ta)/G has almost linear behavior. The ULmin has linear behavior when the efficiency curve is fitted as the second order polynomial approach; however, in this case, the ULmin is considered a function of (Ti − Ta)/G only. In the same way, the IAM mainly concerns the optical effects of the incidence angle, but does not concern the effect of the confined fluid flow and these optical effects simultaneously, as is the case when ULmin is considered constant.
The convective flow pattern of the confined fluid between the absorber and the collector glazing is a function of the hot and cold wall temperature changes [7]. In a tilted differentially heated cavity, it has been found that different classes of natural convection flows appear due to changes in tilt angle and the differences in temperature [8,9,10]. The overall heat transfer coefficient considerably reduces a tall cavity turns from horizontal to vertical [11]. The above-mentioned implies disregarding the fact that the figures of merit FR, a0, and a1 are a strong function of the ULmin, which is in turn dependent on the collector inclination due to changes in the difference in outlet–inlet temperature and collector tilt angle. Meanwhile, the influence of collector inclinations mainly takes into account the incidence angle (optical effects: τα) according to ANSI/ASHRAE 93-2010, 2014 [2]. Awasarmol and Pise [12] studied the natural convection heat transfer from a fin array and angles of inclination. They found a decrease in heat transfer coefficient with the increase in angle of inclination and an optimal angle at 45°. Montoya-Marquez and Flores-Prieto [13] experimentally shows that the changes in collector tilt considerably affects the UL and the calculations of the efficiency, due to variations in the flow pattern into the air cavity between the absorber plate and glazing.
The FR is also understood as the ratio of the actual useful heat to the maximum useful heat [4], which is the thermal effectiveness of the solar collector. Thus, one way to show a more detailed picture of the performance or effectiveness of the solar collector, like most heat exchangers, is through the heat removal factor. Currently, the heat removal factor FR is calculated as the ratio of actual useful energy gains to the useful energy gains, when the whole collector surface is at the fluid inlet temperature. However, this last experimental condition is difficult to achieve because inlet fluid increases its temperature as it flows through the absorber. Additionally, most studies determining FR have been theoretical, using a combination of thermal parameters, such as the collector fin efficiency factor F′ [4]. In addition, the efficiency curve slope at outdoor conditions (a1-factor), which is FRULmin, can be determined by a standard test [2]. To achieve FR, the ULmin must be determined separately.
In line with this, the a0-factor and a1-factor strongly depend on FR, but it is usually calculated by a method where ULmin is considered as a constant or with linear behavior [14,15,16]. For its part, Malvi et al. [17] reported the performance of a solar flat plate collector for various flow configurations; experiments at indoor conditions were conducted to determine the FR. The results indicate that, for the same conditions, parallel flow receives a double FR value compared with the serpentine flow. Experimental methods to evaluate FR, the a0-factor and the a1-factor separately, and its uncertainty have an incipient development. On the other hand, the relationships between FR and β and between FR and (Ti − Ta)/G, which affect the a0 and a1, have become briefly studied, and characterized collectors at a specific latitude have different performance predictions at other latitudes, although these run at the same solar incidence angle. Therefore, the effects of tilt angle β, in a range of (Ti − Ta)/G, due to changes in the convective flow patterns, on FR, which affects the a0-factor and a1-factor, were experimentally studied by two proposed methods. The tilt collector was studied under inclinations from horizontal to vertical, and a Ti from 60 to 90 °C. The proposed methods were based on indoor heat flow calorimetry and ANSI/ASHRAE 93-2010 [2]. The indoor condition consideration fixes the solar radiation, ambient temperature, wind velocity, and background radiation, in order to improve the experimental uncertainty.
2. Materials and Method
2.1. Sampling
The study involves the manufacture and instrumentation of the solar collector to work in indoor conditions. The sample is shown in Figure 1; this is a glazing collector with 2.00 m2 of gross area Aa and an aspect ratio AR of 40. The 10–90% water–glycol is the working fluid, in which heat capacity is considered variable [18]. The absorber is comprised of a couple of header tubes d1, and five raised finned tubes d2, all of which of copper and joined by tin–lead solder. The absorber solar absorbance α, is 0.94 and the glazing solar transmittance τ is 0.86 [19]. The absorbance and transmittance were obtained by normalizing the measured spectral [20]. A Shimadzu UV-3100 (Shimadzu Corporation, Kyoto, Japan) is used from 300 to 2500 nm, every 2.0 nm with ±0.1% of photometric uncertainty and 1.0% of wavelength uncertainty. Table 1 shows the manufacture characteristics of the sample.
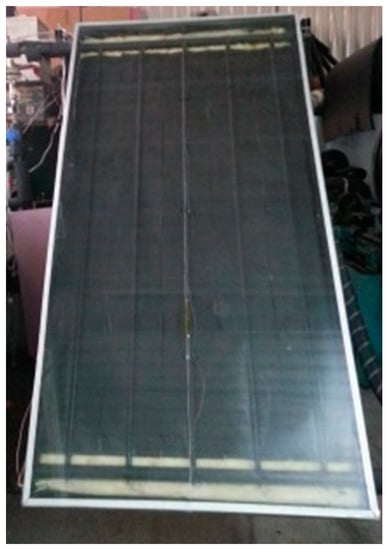
Figure 1.
Sample.

Table 1.
Manufacture characteristics of the solar collector.
2.2. Experimental Desing
Figure 2 shows that the glazing collector heats up the absorber plate, which in turns heats the working fluid that flows through the raising tubes. At this time, part of the supplied energy GAτα heats the working fluid and the rest is transferred to the ambient as heat losses QL, which is dependent from the β and (Ti − Ta)/G. The incoming heat flux GAτα is considered independently of β, and it is the sum of the useful energy Qu(β, (Ti − Ta)/G) plus the heat loss flux QL(β, (Ti − Ta)/G).
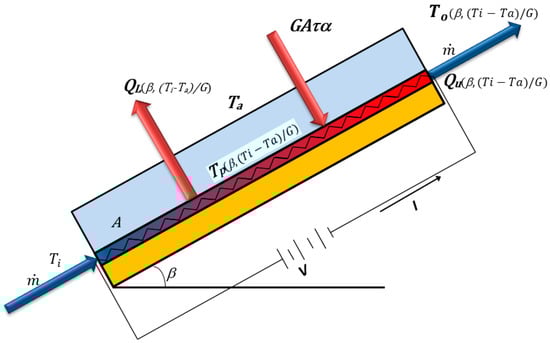
Figure 2.
Physical model.
In this study, the incoming heat flux GAτα is fixed at a specified value, so the outlet heat is the sum of the actual useful heat Qu_a(β, (Ti − Ta)/G), plus the heat loss flux QL(β, (Ti − Ta)/G). The following considerations are also taken in to account in the experiments: (a) steady state, (b) constant surrounding temperature and emissivity, (c) constant radiative exchange, (d) linear variation of Cp with the temperature, and (e) the mean plate temperature, Tp(β, (Ti − Ta)/G), which is considered as the average temperature between outlet and inlet temperature [To(β, (Ti − Ta)/G) + Ti]/2.
The experimental design allows for the determination of the FR and FRULmin as a function of β and (Ti − Ta)/G at indoor conditions by a couple of methods, under inclinations from horizontal to vertical. The a0 is equal to FRτα, and the a1 is equal to FRULmin. The indoor condition consideration fixes the solar radiation, ambient temperature, wind velocity, and background radiation, in order to improve the experimental uncertainty. In the first proposed method, the FR was determined by the ratio of Qu_a to the maximum useful heat Qu_max, by indoor flow calorimetry. In the second proposed method, the FRUL_min was determined according to ANSI/ASHRAE 93-2010 [2] by achieving the slopes of the families of the efficiency curves, and the UL_min by flow calorimetry at indoor conditions too. The indoor condition is the main difference of the second method with the standard technique to obtain the factor FRUL_min. In both proposed methods, a feedback temperature control works at a set of collector inclinations from horizontal to vertical. At indoor conditions, the solar heating was emulated by the Joule effect and the PID control, using an electrical heater, making it possible to replace (Ti − Ta)/G by (Ti − Ta)/(VI/Aτα), to achieve better experimental uncertainty. Thus, the solar heating is given by Equation (1):
where τ and α are the glazing solar transmittance and the solar absorbance of the absorber respectively, and V and I are the electrical voltage and current, respectively. The performance of both methods was evaluated in terms of uncertainty, which was determined by the propagation error method and by the RMSE and R2, respectively.
Method 1: FR as a Function of the Ratio Qu_a/Qu_max
Equation (2) shows that the FR is the ratio of the actual useful heat to the maximum useful heat, according to Duffie and Beckman [4]. The Qu_max occurs when Tp is equal to Ti, or To is equal to Ti, because QL tends to be minimal. In the case, that Tp or To is greater than Ti, the QL is greater than zero, and the Qu_a is then greater than zero too.
The Qu_a(β, (Ti − Ta)/G) can be correlated by the change in enthalpy of the working fluid between outlet and inlet, at constant pressure. The Qu_max occurs when the whole collector is at the inlet fluid temperature, minimizing heat losses, QLmin. For this, Tp = Ti, or To = Ti, as is shown in Equation (3).
The FR value is determined by two parallel tests. The first determines the Qu_a at a fixed value of GAτα. In the second, the QLmin, and the Qu_max, are determined considering Tp = Ti and adjusting the GAτα. In this case, the FR is a function of β and (Ti − Ta)/G, as well as Qu_a, QLmin or (VI)2, Qu_max, and Tp, as is shown in Figure 3.
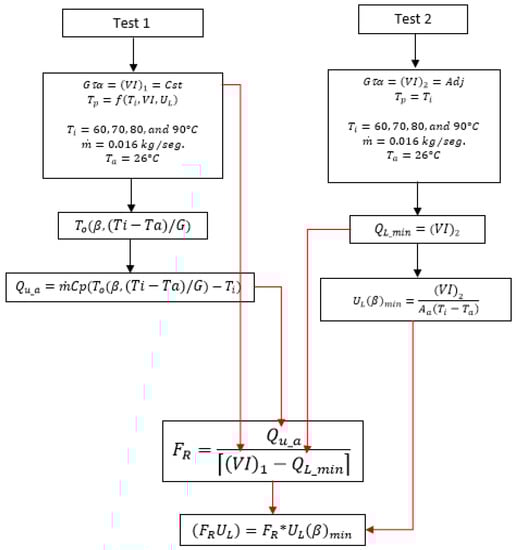
Figure 3.
Mathematical model.
Method 2: FRULmin According to ANSI/ASHRAE 93-2010
The FRULmin was determined based on ANSI/ASHRAE 93-2010 [2], the ULmin factor was obtained separately, using heat flow calorimetry as per Beikircher et al. [3] and Montoya-Marquez and Flores-Prieto [13]. A set of tests is used to determine the family of efficiency curves against (Ti − Ta)/G, at inclinations from horizontal to vertical, which in turn allows for a set of FRULmin, each of which represents the slope of linear regression of each efficiency curve. The ULmin is determined to achieve the value of the FR once the FRULmin is achieved by Method 1 (Test 2), setting the GAτα as the compensation heat flux (VI)2 and setting the difference in temperature (Ti − Ta) according to Equation (4):
Equation (5) gives the collector efficiency (ANSI/ASHRAE 93-2010, 2014) [2]:
2.3. Experimental Setup
The experimental setup entails that the sample is mounted with a variable angle β at 0–90°, with an uncertainty of ±0.1°. The absorber heating (VI) is homogeneously distributed by means of the electrical heater and remains almost constant over each test. The electrical heater is supplied with a maximum of 2000 W, with an uncertainty of ±5 W. The temperature differences (To − Ti) and (Ti − Ta) were measured using a thermopile type T thermocouple and 32 gauge wires, with an uncertainty of ±0.1 °C. A thermal bath supplied with a 10–90% water–glycol mixture was used as working fluid, with an uncertainty of ±0.01 °C. The mass flow rate was 0.016 kg/s [21,22]; it was monitored with a turbine flowmeter, with an uncertainty of 3%. It was also verified by weighing the water–glycol mixture, at specified time steps during the experiments. The experimental setup is shown in Figure 4.
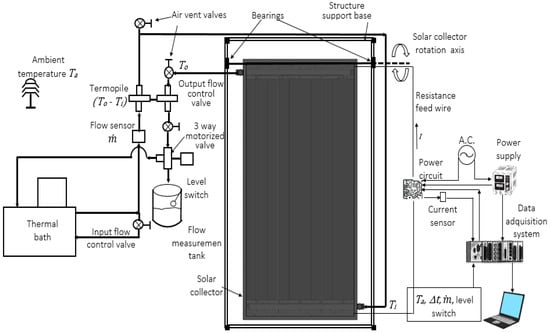
Figure 4.
Experimental setup.
The experimental indoor conditions allow uniform surrounding temperature and surrounding emissivity, and the experiments can be run with non-considerable changes in solar heating, ambient temperature, and wind velocity. The working fluid was a 10–90% water–glycol mixture to minimize adverse boiling effects. A programmable FPGA (NI-cRIO9022, 32 bit data acquisition, Lab-VIEW software) (National Instruments, Austin, TX, USA) was used to monitor, record, and calculate the experimental variables at time steps of 1 s. The steady state was verified by monitoring experimental data without considerable changes in the experimental variables over 30 min. Each reported data point corresponds to an average of over 1800 measurements, taken over a 30 min period. The tests were run at a specified range and steps of the tilt angle, and the remaining variables involved in the experiment were considered without significant variations. Each test was carried out by in triplicate for comparison.
The experimental conditions Tp = Ti and was verified by infrared imaging on the absorber plate. As seen in Figure 5, the field temperature of the absorber plate was as expected, thanks to the PID control losses compensation. Figure 5a shows the Tp = Ti condition, where the standard deviation was only 0.14 °C. Figure 5b shows the case in which , where we can find a conventional temperature profile of the solar collector absorber.
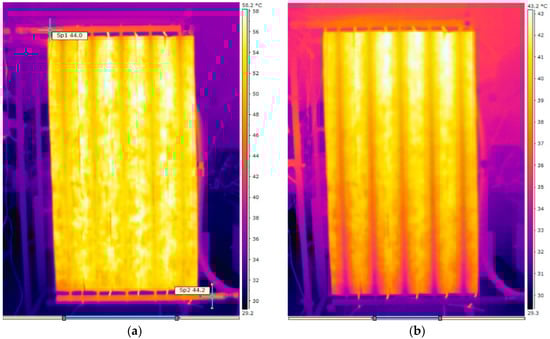
Figure 5.
Infrared imagining testing of the absorber plate at the (a) Tp = Ti and (b) T_p = f(T_i, VI, U_L).
3. Results
The experiments were conducted highlighting the behavior of the FR and FRULmin as a function of the β and (Ti − Ta)/G. As noted above, the a0-factor is direct proportional to FR and the a1-factor is equal to FRULmin. The experimental campaign comprises five sets of four experiments, each one performed in triplicate. The parametric study was conducted for β as follows: 0°, 30°, 45°, 60°, and 90°. The (Ti − Ta)/G was 0.044, 0.056, 0.069, and 0.083.
3.1. Comparative Performance of both Methods
The uncertainty, in terms of RMSE and R2, of each method disclose its performance. Figure 6 shows a similar shape of FR against β for both methods. The FR grew were 0.14 and 0.27 for Methods 1 and 2, respectively. The experimental uncertainties of Methods 2 and 1 were ±0.049 and ±0.016 respectively; this is 306% times greater with Method 2 compared with Method 1. As seen in Figure 6, both shadow gaps of the experimental uncertainty are cross practical. The linearity values are (0.053, 0.9630) and (0.104, 0.9708) for Methods 1 and 2, respectively. The RMSE was considerably higher in Method 2. Method 1 allows for achieving an FR value for every studied value of (Ti − Ta)/G, unlike Method 2, where the FR is just an average value determined from the slope of each efficiency curve. Therefore, the remainder of this paper focuses on Method 1.
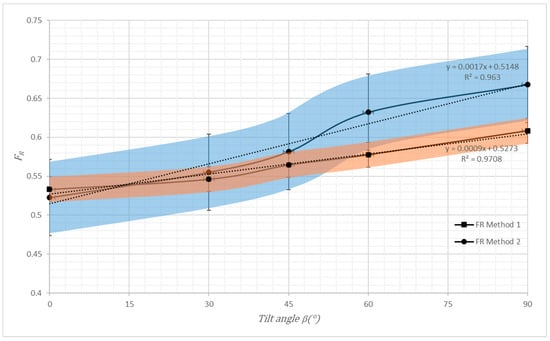
Figure 6.
The FR against β by Methods 1 and 2.
3.2. Method 1: FR, a1:FRULmin and ULmin against β
Figure 7 shows the FR, ULmin and (FRULmin) against β based on Method 1, taking the average values over the set of (Ti − Ta)/G. The FR increases from 0.34 to 0.61 (14.5%) as the angle of inclination increases from 0 to 90°. The FR increases as it goes from horizontal to vertical; this is because ULmin decreases its value at the same time, from 5.9 to 5.4 W/m2·K. The increase in FR and the decline of ULmin cause FRULmin to remain almost constant along the inclination set of tests, changing only 0.1 W/m2·K (3.0%). Thus, the coefficient a1, of the solar collector efficiency curve, does not change considerably with the inclination angle. In addition, the coefficient a0 can change considerably if the τα remains almost constant.
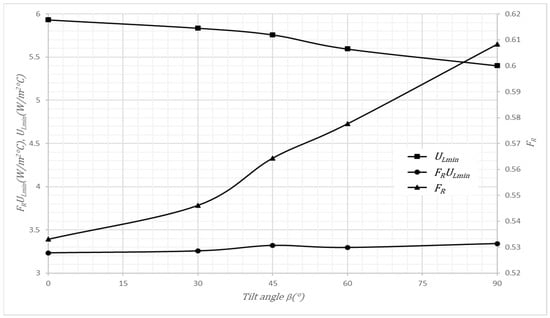
Figure 7.
FR, a1:FRULmin and ULmin against β by Method 1.
3.3. Method 1: FR, a1:FRULmin against β and (Ti − Ta)/G
Figure 8 shows FR against β for the studied range of (Ti − Ta)/G. The change in FR was 14.5% on average over the set of β, as mentioned above. On the other hand, the variation of (Ti − Ta)/G means average changes in FR of 32% over the set of (Ti − Ta)/G, and the a0 is affected considerably due to changes in (Ti − Ta)/G, only if τα remains almost constant, because the flow pattern between the absorber plate and glassing cover is modified considerably. The latter is in the same line of the experimental work of Montoya-Marquez and Flores-Prieto [13].
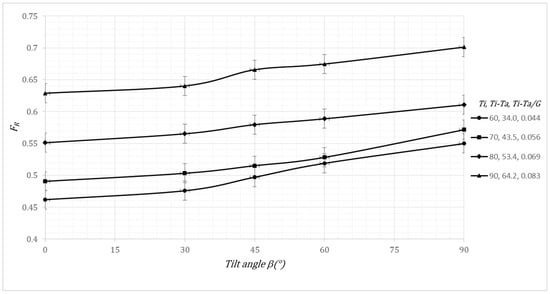
Figure 8.
FR vs. β and (Ti − Ta)/G by Method 1.
Figure 9 shows a1:FRULmin as a function of β and (Ti − Ta)/G for Method 1. The a1-factor shows variations over the set of β that are not considerable. However, the a1-factor can change by 2.3% over the studied range of (Ti − Ta)/G. Over the range of (Ti − Ta)/G, the changes in a1-factor as a function of β is not considerable due to the compensation between the increase in FR and the decrease in ULmin when β increases.
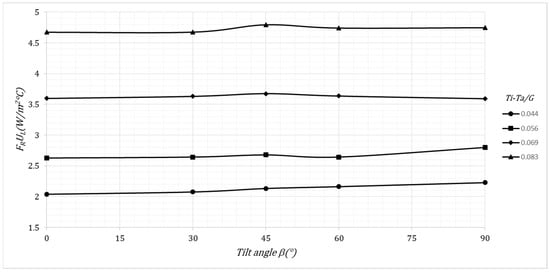
Figure 9.
The a1:FRULmin as a function of β and (Ti − Ta)/G by Method 1.
4. Conclusions
A couple of experimental indoor test methods for determining FR and FRULmin (a1-factor) were conducted. Method 1 determined the ratio of Qu_a to Qu_max; Method 2, by achieving the slopes, determined the FRULmin of the family of the efficiency curves, (ANSI/ASHRAE 93-2010, 2014) [2] and the ULmin by indoor flow calorimetry. The effects of tilt angle and (Ti − Ta)/G on the FR and FRULmin factors were investigated, considering that the a0 is directly proportional to FR and a1 is equal to FRULmin. Both methods determine the behavior of FR against tilt angle and (Ti − Ta)/G. However, Method 1 shows considerably improved behavior in terms of uncertainty of FR—a three-fold lower uncertainty. Thus, a method was conducted to obtain the FR with the use of a PID temperature control at fixed indoors conditions, with which it is possible to obtain the FR with lower uncertainty. In addition, Method 1 shows some advantages over Method 2—more data points, less uncertainty, and a complete view of the collector’s efficiency—but a more detailed experimental setup is needed.
The changes in inclination from horizontal to vertical caused an almost linear increase in FR, (14.5%), which represents a change of 45% due to (Ti − Ta)/G, which caused an average change in FR of 32%. Thus, the effects of changes in tilt angle and (Ti − Ta)/G-value on the a0-factor is considerable, since a0 is directly proportional to FR. The inclination changes do not considerably affect the a1-factor due to the compensation between the increase in FR and the decrease in ULmin when β increases.
Author Contributions
O.M.-M. and J.J.F.-P. contributed to the design and implementation of the research, to the analysis of the results and to the writing of the manuscript.
Funding
This research was funded by Consejo Nacional de Ciencia y Tecnolgía México, CONACyT and the Tecnológico Nacional de México (Project. 5685.16), and the APC was funded by the Tecnológico Nacional de México.
Acknowledgments
The authors are grateful to Consejo Nacional de Ciencia y Tecnolgía, CONACyT and Tecnológico Nacional de México, TecNM, whose financial support made this work possible.
Conflicts of Interest
The authors declare that they have no conflict of interest.
Nomenclature
| Variables | Description | Units |
| Aa | Collector area | m2 |
| AR | Aspect ratio | - |
| Cp | Specific heat | kJ/kg·K |
| d1 | Diameter of heaters | m |
| d2 | Diameter of raising tubes | m |
| FR | Heat removal factor | Adimentional |
| G | Solar radiation | W/m2 |
| IAM | Incidence angle modifier | - |
| L_ins | Insulation width | m |
| Mass flow | kg/s | |
| Qi | Input heat | W |
| Ql | Loss heat | W |
| Qu | Useful heat | W |
| Qu_a | Actual useful heat | W |
| RMSE | Root mean square error | - |
| R2 | Coefficient of determination | Adimentional |
| Ta | Ambient Temperature | °C |
| Ti | Input temperature | °C |
| To | Output temperature | °C |
| Tp | Mean absorber plate temperature | °C |
| UL | Overall heat transfer coefficient | W/m2·°C |
| VI | Electric power | W |
| W | fin width | m |
| Symbols | ||
| α | Absorbance | Adimentional |
| β | Tilt angle | ° |
| δ | Glass cover thickness | m |
| δa | Fin thickness | m |
| τ | Transmittance | Adimentional |
| η | Efficiency | Adimentional |
References
- Mauthner, F.; Weiss, W.; Spörk-Dür, M. Solar Heat Worldwide; IEA Solar Heating & Cooling Programme: Gleisdorf, Austria, 2016. [Google Scholar]
- American Society of Heating, Refrigerating, and Air-Conditioning Engineers, Inc. Methods of Testing to Determine the Thermal Performance of Solar Collectors; ANSI/ASHRAE 93-2010 (RA 2014); ASHRAE: Atlanta, GA, USA, 2014. [Google Scholar]
- Beikircher, T.; Osgyan, P.; Fischer, S.; Drück, H. Short-term efficiency test procedure for solar thermal collectors based on heat loss measurements without insolation and a novel conversion towards daytime conditions. Sol. Energy 2014, 107, 653–659. [Google Scholar] [CrossRef]
- Duffie, J.; Beckman, W. Solar Engineering of Thermal Processes, 4th ed.; John Wiley & Sons, Inc.: Hoboken, NJ, USA, 2013. [Google Scholar]
- International Standard, Test Methods for Solar Collectors—Part 1: Thermal Performance of Glazed Liquid Heating Collectors Including Pressure Drop; ISO 9806-1; ISO: Vernier, Switzerland, 1994.
- Sabatelli, V.; Marano, D.; Braccio, G.; Sharma, V.K. Efficiency test of solar collectors: Uncertainty in the estimation of regression parameters and sensitivity analysis. Energy Convers. Manag. 2002, 43, 2287–2295. [Google Scholar] [CrossRef]
- Saury, D.; Benkhelifa, A.; Penot, F. Experimental determination of first bifurcations to unsteady natural convection in a differentially-heated cavity tilted from 0° to 180°. Exp. Therm. Fluid Sci. 2012, 38, 74–84. [Google Scholar] [CrossRef]
- Alvarado, R.; Xamán, J.; Hinojosa, J.; Álvarez, G. Interaction between natural convection and surface thermal radiation in tilted slender cavities. Int. J. Therm. Sci. 2008, 47, 355–368. [Google Scholar] [CrossRef]
- Ozoe, H.; Sayama, H.; Churchill, S.W. Natural convection in an inclined rectangular channel at various aspect ratios and angles—Experimental measurements. Int. J. Heat Mass Transf. 1975, 18, 1425–1431. [Google Scholar] [CrossRef]
- Ozoe, H.; Yamamoto, K.; Sayama, H.; Churchill, S.W. Natural convection in an inclined rectangular channel heated on one side and cooled on the opposing side. Int. J. Heat Mass Transf. 1974, 17, 1209–1217. [Google Scholar]
- Cooper, P.I. The effect of inclination on the heat loss from flat-plate solar collectors. Sol. Energy 1981, 27, 413–420. [Google Scholar] [CrossRef]
- Awasarmol, U.V.; Pise, A.T. An experimental investigation of natural convection heat transfer enhancement from perforated rectangular fins array at different inclinations. Exp. Therm. Fluid Sci. 2015, 68, 145–154. [Google Scholar] [CrossRef]
- Montoya-Marquez, O.; Flores-Prieto, J.J. The effect of the angle of inclination on the efficiency in a medium-temperature flat plate solar collector. Energies 2017, 10, 71. [Google Scholar] [CrossRef]
- Kumar, P.; Roy, S.C.; Paswan, M.K. Experimental study of Collector heat removal factor and Collector efficiency factor of flat-plate solar Air Heater having roughened (Rhombus shape) absorber plate. Int. J. Tech. Res. Appl. 2016, 4, 170–174. [Google Scholar]
- Rosli, M.A.M.; Misha, S.; Sopian, K.; Mat, S.; Sulaiman, M.Y.; Salleh, E. Parametric analysis on heat removal factor for a flat plate solar collector of serpentine tube. World Appl. Sci. J. 2014, 29, 184–187. [Google Scholar]
- Xie, W.T.; Dai, Y.J.; Wang, R.Z. Theoretical and experimental analysis on efficiency factors and heat removal factors of Fresnel lens solar collector using different cavity receivers. Sol. Energy 2012, 86, 2458–2471. [Google Scholar] [CrossRef]
- Malvi, C.S.; Gupta, A.; Gaur, M.K.; Crook, R.; Dixon-Hardy, D.W. Experimental investigation of heat removal factor in solar flat plate collector for various flow configurations. Int. J. Green Energy 2017, 14, 442–448. [Google Scholar] [CrossRef]
- Lyondell Chemical Company. Technical Data Propylene Glycol Boiling Point of Aqueous Propylene Glycol Solutions 2006. Available online: http: //www.lyondellbasell.com/techlit/techlit/2519.pdf (accessed on 4 April 2013).
- CIE 130-1998, Practical Methods for the Measurement of Reflectance and Transmittance; Technical Report No. 130; Commission Internationale de L´Eclairage: Vienna, Austria, 1998.
- Glass in Building—Determination of Light Transmittance, Solar Direct Transmittance, Total Solar Energy Transmittance, Ultraviolet Transmittance and Related Glazing Factors; ISO9050-2003; ISO: Vernier, Switzerland, 2003.
- Bava, F.; Furbo, S. Correction of Collector Efficiency Depending on Variations of Collector Type, Solar Collector Fluid, Volume Flow Rate and Collector Tilt. IEA-SHC Info Sheet 45.A.1. 22 December 2014. Available online: http://task45.iea-shc.org/data/sites/1/publications/IEA-SHC-T45.A.1-INFO-Correctionofcollector-efficiency.pdf (accessed on 21 December 2016).
- Zauner, C.; Hengstberger, F.; Hohenauer, W.; Reichl, C.; Simetzberger, A.; Gleiss, G. Methods for medium temperature collector development applied to a CPC collector. Energy Procedia 2012, 30, 187–197. [Google Scholar] [CrossRef]
© 2018 by the authors. Licensee MDPI, Basel, Switzerland. This article is an open access article distributed under the terms and conditions of the Creative Commons Attribution (CC BY) license (http://creativecommons.org/licenses/by/4.0/).