Abstract
To realize the safety control of electric power systems under high penetration of photovoltaic power systems, accurate global horizontal irradiance (GHI) forecasts using numerical weather prediction models (NWP) are becoming increasingly important. The objective of this study is to understand meteorological characteristics pertaining to large errors (i.e., outlier events) of GHI day-ahead forecasts obtained from the Japan Meteorological Agency, for nine electric power areas during four years from 2014 to 2017. Under outlier events in GHI day-ahead forecasts, several sea-level pressure (SLP) patterns were found in 80 events during the four years; (a) a western edge of anticyclone over the Pacific Ocean (frequency per 80 outlier events; 48.8%), (b) stationary fronts (20.0%), (c) a synoptic-scale cyclone (18.8%), and (d) typhoons (tropical cyclones) (8.8%) around the Japanese islands. In this study, the four case studies of the worst outlier events were performed. A remarkable SLP pattern was the case of the western edge of anticyclone over the Pacific Ocean around Japan. The comparison between regionally integrated GHI day-ahead forecast errors and cloudiness forecasts suggests that the issue of accuracy of cloud forecasts in high- and mid-levels troposphere in NWPs will remain in the future.
1. Introduction
Installation of photovoltaic (PV) power systems has accelerated in Japan after the introduction of a feed-in tariff in 2012 (Ogimoto et al. [1]). The capacity of installed PV systems connected to the Japanese power grid stands at approximately 40 GW at present. Moreover, liberalization of retail electricity sales (full retail competition) started in the Japanese electric power market after April 2016 (Ogimoto et al. [2]). In the 2016 fiscal year, renewable energy and hydro power generation account for 6.9% and 7.6% for electric power generation in Japan, respectively (Table 1). Thermal power plants (including coal, oil and natural gas) control mainly electric power generation in Japan. Under the high penetration of variable renewable energy, an optimal control of other power resources requires regional PV forecasts.

Table 1.
The proportion of electric power generations for the 2016 fiscal year in Japan.
PV power generation has large variability on both spatial and temporal scales owing to variable weather conditions and solar irradiance (or global horizontal irradiance (GHI)) [3,4,5,6,7,8]. To control the safety of electric energy management systems (EMSs) with PV power generation, the use of day-ahead and intraday-ahead PV power forecasts are expected (e.g., Ogimoto et al. [9]). In the existing electric power system in Japan, electric power generation is dominated by thermal power plants. The daily startup or shut down schedules of thermal power plants are planned a day prior to the target day, and these plants can absorb changes in demand (Huva et al. [10]; Udagawa et al. [11,12], TEPCO website [13]). Achieving an adaptable supply of electric power and minimizing the total costs of electric power control are the most essential aims of electric power companies.
In Japan, 10 electric companies (Hokkaido, Tohoku, Tokyo, Hokuriku, Chubu, Kansai, Chugoku, Shikoku, Kyushu, and Okinawa in Figure 1) control the electric power systems in regional areas. After April 2014, an organization was established to facilitate cross-regional coordination among transmission operators (called “OCCTO”, [14,15]) to ensure aggregation of electric power interconnection by using nationwide networks. The OCCTO establishes a Japan wide of grid interconnection aiming at increasing power system security with a growing share of variable renewable energy.
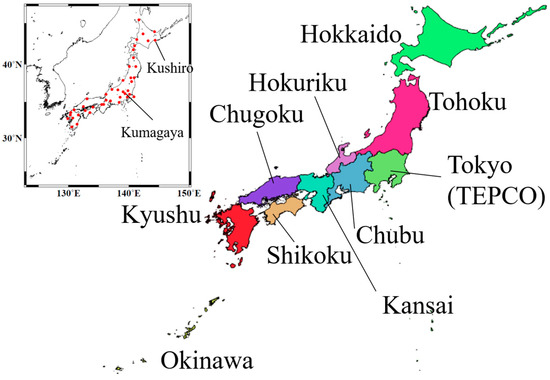
Figure 1.
Map of Japanese islands and 10 electric power grids. Red squares indicate the locations of Japan Meteorological Agency’s (JMA’s) global horizontal irradiance (GHI) observation stations including the Kushiro and Kumagaya special GHI observation stations.
Recently, day-ahead forecasts of regionally integrated PV power and GHI have been performed using numerical weather prediction (NWP) models (e.g., Lorenz et al. [16]; Fernandez-Jimenez et al. [17]; Fonseca Jr. et al. [18,19]; Jimenez et al. [20]; Haupt and Kosovic [21]). However, NWP-based GHI forecasts are often associated with large errors (or outlier events). If control over regulated power supply (i.e., thermal power plants) is not optimal, electric power surpluses or blackouts can be caused in electric power systems. From the viewpoint of achieving safe control over EMSs, such outlier events in forecasts are not acceptable and must be avoided.
In examples from other regional areas, PV power predictions for Germany are derived using an upscaling method involving representative PV systems, based on global NWPs of the European Centre for Medium-Range Forecasts (ECMWF) and post-processing procedures (Lorenz et al. [16]). In the U.S., seven different NWPs are blended and seamless GHI predictions are made using a solar power forecasting system called “SunCAST” (Haupt and Kosovic [21]). Oozeki et al. [22] and Fonseca Jr. et al. [19] estimated the errors in regional PV power generation forecasts for central Japan based on support vector regression by using NWP. Recently, the value of day-ahead forecast was evaluated in the fields of operational electricity generation costs and economy (e.g., Martinez-Anido et al., [23]; Antonanzas et al., [24]) Martinez-Anido et al., [23] was analyzed by simulating the operation of the independent system operator under a range of scenarios with varying solar power penetrations and investigated the impact of solar power forecasting improvements.
Japan Meteorological Agency (JMA) has developed various types of operational NWPs to address natural disasters. In previous studies, authors have statistically validated GHI forecasts obtained using JMA NWPs and investigated seasonal and regional characteristics of GHI forecast errors (Ohtake et al. [25,26]). Ohtake et al. [25] evaluated the GHI forecast errors by JMA day-ahead forecasts for JMA’s GHI monitoring stations and showed that the mean bias error (MBE) values of the GHI range from 50 to 50 W/m2 in a year. The root mean square error (RMSE) values in winter were about 90–100 W/m2, while the RMSE values in summer approached up to 150 W/m2. Ohtake et al. [25,26] investigated that regional and seasonal variations in cloud types (cirrus, altocumulus and stratus clouds etc.) are related to large GHI forecast errors. However, outlier events of regionally integrated GHI forecasts have not been adequately investigated. Recently, Uno et al. [27] suggested that multi-center ensemble were useful for detecting large daily GHI forecast errors obtained from JMA’s NWP for central Japan.
Currently, electric power interconnection between electric power companies in Japan is often required to manage the safety control of electric power system under outlier events of PV power generation forecasts. Therefore, outlier events of GHI or PV power forecasts for a region must be avoided. If we could use day-ahead forecasts to determine whether GHI outlier forecasts would occur, it would be feasible to perform stable and reliable electric power interconnection with other reserved electric power generation systems.
The aim of the study is to understand statistical meteorological characteristics of outlier events (a total of 80 cases) in regionally integrated GHI day-ahead forecasts. This study also performed case studies of four worst outlier events during the recent four years (2014–2017). The relation between the regionally GHI forecast errors and cloud fields are discussed. In this study, the target electric areas are the nine of the 10 Japanese electric power areas mentioned above, except for Okinawa electric power company which is an independent electric power grid (see Figure 1).
In Section 2, observational data and the operational NWPs of JMA are described. A scheme for detecting outlier events in regionally integrated GHI forecasts is provided in Section 3. Four case studies of the largest GHI day-ahead forecasts (the worst cases) from 2014 to 2017 are described in Section 4. In Section 5, the relation between cloudiness and GHI forecast errors is discussed. A summary of our findings is given in Section 6.
2. Data and Model Descriptions
2.1. Solar Irradiance Observations
To validate GHI forecasts from the NWPs, the authors examined surface-observed GHI data obtained using pyranometers at JMA operational observatory stations. Kumagaya and Kushiro JMA stations were temporary GHI observation stations that were operational from September 2013 to March 2018. The target area was the nine electric power service areas of Hokkaido (8), Tohoku (7), Tokyo (7), Chubu (3), Hokuriku (2), Kansai (3), Chugoku (3), Shikoku (3), and Kyushu (7) (shown in Figure 1). The figures in the brackets refer to the number of JMA GHI monitoring stations. Across the nine electric power areas, the data generated by 43 stations are used for regional validations in this study.
Forecasted GHI values are archived as hourly-averaged data every hour (see Section 2.3). Pyranometer measurements are obtained at each station at intervals of 10 s to 1 min. Therefore, the observed, hour-averaged GHI values are used in the same manner as that employed by meso-scale model (MSM). A detailed explanation of JMA solar radiation monitoring can be found in Ohtake et al (2015) [26].
2.2. Satellite-Estimated Solar Radiation
To validate spatial GHI distribution, satellite-estimated GHI datasets (called “AMATERASS data”; Takenaka et al. [28]; CREST TEEDDA [29]), too, were used in this study. Takenaka et al. [28] developed an algorithm for estimating GHI from geostationary satellite data by using a neural network with a learning algorithm that can perform high-speed estimations of GHI values. Based on the results of GHI validation using in situ ground observations, Takenaka et al. [28] reported a good correlation between in situ ground observations and estimates obtained under clear and cloudy conditions, except in cases of broken clouds (or cumulus clouds). Damiani et al. [30] reported that the total mean bias errors of the AMATERASS data decrease to approximately 10–15 W m−2 under clear-sky conditions when using surface GHI measurements.
2.3. Numerical Model
The forecasts obtained using the JMA operational MSM with a horizontal grid spacing of 5 km was analyzed in this study. The MSM, which is based on a physical model (or NWP, Saito et al. [31]), has been used as an operational model in the islands of Japan to prevent meteorological disasters (according to the JMA website [32]) and to support aviation operations. After 28 February 2017, the fundamental numerical code of MSM was changed to a new NWP model (A System based on a Unified Concept for Atmosphere, “ASUCA”) [33]. We call the new NWP “MSM-ASUCA” in the following description.
MSM yields forecasts at intervals of 3 h (with initialization times of 00, 03, 06, 09, 12, 15, 18, and 21 UTC) for 39 h. GHI forecasts are calculated at intervals of 15 min and archived as hourly averaged data (from a previous hour to a target hour). Model domains of the MSM are set up on the Japan islands. Initial conditions for the MSM are set using a four-dimensional variational analysis data assimilation technique (Meso 4D-VAR, Ishikawa and Koizumi [34]). Initial and boundary conditions for the MSM are set using forecast datasets and a global spectral model (GSM) developed by JMA with a horizontal grid size of 20 km. Vertical levels of the conventional MSM and MSM-ASUCA consist of 48 and 76 layers (21.8 km above sea level (ASL)), respectively.
Microphysical processes with a three-ice bulk microphysics scheme developed by Ikawa and Saito [35] are installed in MSM. Two-moment bulk parameterization is included as well. An improved version of the Kain-Fritsch cumulus parameterization (Kain and Fritsch [36]) scheme developed by Ohmori and Yamada [37] is used in MSM. Detailed explanations of MSM can be found on the English-language website of JMA (JMA [38]).
A partial condensation scheme proposed by Sommeria and Deardorff [39] is applied to the cloud radiation process (shortwave process) in MSM to represent sub-grid-scale cloudiness. Sub-grid-scale cloudiness (partial clouds within the model grid size) are represented by fluctuations generated using a turbulence scheme (Nakanishi and Niino [40]). For the shortwave processes in MSM, cloud fractions are calculated assuming a maximum-random overlap.
From 5 December 2017, the JMA started providing the GHI forecasts obtained from MSM for commercial use.
2.4. Metrics
As evaluation metrics of GHI forecasts, MBE and RMSE were used, and they are expressed as follows:
where ε is the difference in regionally integrated GHI values between the forecasts (FCST) and the observations (OBS) ()); n denotes the number of data. MBE and RMSE values for each event were calculated during the daytime from 07–21 LST.
3. Detection of GHI Forecast Outlier Events
In this section, descriptions of outlier events in GHI forecasts are given, in addition to a procedure for screening large errors in GHI forecasts. In the present study, outlier events in GHI forecasts were defined based on MSM day-ahead forecasts (03 UTC initialization time, or 12 h Japanese local standard time (LST) on a previous day). Here LST is UTC + 9 h. In the following equation, an index of a forecast error parameter τ is introduced;
Here, hourly and denote hourly averaged GHI forecasts with an initialization time of 00 UTC and GHI observations, respectively. denotes extra-terrestrial solar irradiance (EXT) at the top of the atmosphere, and this quantity was calculated theoretically at intervals of 1 h (i.e., in this study, it is not a solar constant) [41]. Given this value as the threshold of outlier events in regionally integrated GHI forecasts, a higher order of approximately 5% in a year (80 cases in all from 2014 to 2017; see Table 2, Table 3, Table 4 and Table 5 ) was selected from daily-accumulated absolute errors (“Daily_error” () in Table 2, Table 3, Table 4 and Table 5 ) in the four-years period of 2014–2017. Cases of overestimation and underestimation (“Daily_biases” () in Table 2, Table 3, Table 4 and Table 5) were selected from all seasons.
Table 2.
Top 20 outlier events in regionally integrated GHI day-ahead forecasts for nine electric power grids during 2014. “Daily_Error” and “Daily_BIAS” denote daily absolute errors and mean bias errors, respectively. “Surface sea level pressure (SLP) patterns” for each day were judged by the authors based on JMA weather charts.
Table 3.
Same as Table 2, but for 2015.
Table 4.
Same as Table 2, but for 2016.
Table 5.
Same as Table 2, but for 2017.
Under outlier events in GHI forecasts, several SLP patterns were found in 80 events during the four years; (a) a western edge of anticyclone over the Pacific Ocean (frequency in 80 events; 48.8%), (b) stationary fronts (including the Baiu front in the Japanese rainy season) (20.0%), (c) a synoptic-scale cyclone (13.8%), and (d) typhoons (8.8%) around the Japan islands.
4. Case Studies of GHI Forecast Outlier Events
In this section, several case studies under different weather conditions (i.e., rainy season in early summer, typhoons, western edges of anticyclone, etc.) are described for outlier events in day-ahead GHI forecasts of interest (marked with stars in Table 2, Table 3, Table 4 and Table 5). The four cases in the following subsections (4 August 2014, 10 October 2015, 29 July 2016 and 11 July 2017, called case 1, 2, 3, and 4, respectively) were selected as the largest forecast error cases for each year. Three of these four cases were negative bias cases.
4.1. Case 1 on 4 August 2014
Firstly, we selected outlier events in regionally integrated day-ahead GHI forecasts for nine power grid areas in Japan. Table 2 lists the top 20 outlier events (11 overestimations and 9 underestimations) in day-ahead GHI forecasts in 2014. These cases are characterized by several sea-level pressure (SLP) patterns: western or eastern edges of anticyclone over the Pacific Ocean, passage of a cyclone, south-coast cyclone, typhoon, stationary front (including the Baiu front in the early summer rainy season in Japan), and outbreak of cold air. In this subsection, the largest forecast error case in 2014 of 4 August 2014 is considered as a case study.
A weather chart corresponding to 09 LST on 4 August 2014 is shown in Figure 2a. The Japanese islands are located on the western edge of a anticyclone with central pressure of 1014 hPa (shown by “H”) over the Pacific Ocean. A cyclone with central pressure of 998 hPa (shown by “L”) is located over the far east of Russia. A tropical depression (shown by “TD”) is found over the Korean peninsula. This means that the Japan islands correspond to a transition stage from clear-sky to cloudy conditions. Around the western edge of anticyclone, wider contour intervals of surface pressure isobars and weaker easterly winds from the Pacific Ocean are suggested to be prevalent.
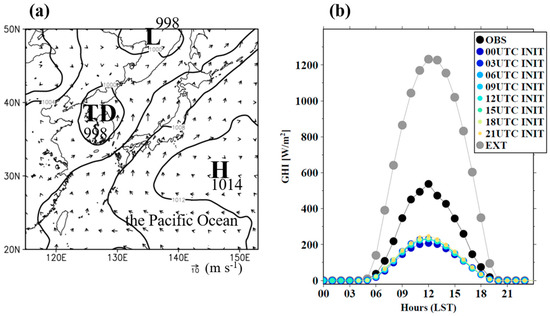
Figure 2.
(a) Weather chart at 09 JST on 4 August 2014. (b) Time series of hourly GHI observations (black circles), meso-scale model (MSM) forecasts (colors), and extra-terrestrial solar irradiance on the same day for the integrated region of the nine electric power companies’ areas.
Figure 2b shows the time-series of hourly-GHI observations, MSM forecasts with different initial times (00, 03, 06, 09, 12, 15, 18, and 21 UTC initialization times on 3 August 2014), and EXT, respectively. The values are integrated regionally over the nine power areas on the same day. Day-ahead GHI forecast values obtained at the initialization time of 03 UTC (12 LST) (denoted by blue-colored circles) are smaller than the half of the GHI observations. GHI forecasts with different initialization times indicate underestimation throughout the day compared to the observed values. The orange colored circles represent forecasts with relatively short lead times (intraday-ahead forecasts after 15 UTC). Even the short-term forecasts at 21 UTC (06 LST on the target day) could not mitigate the underestimation in GHI forecasts.
MBE and RMSE values corresponding to each initialization time (from day-ahead forecasts to intraday-ahead forecasts) on 4 August 2014 are listed in Table 6. The RMSE values obtained at the initialization times of 00 UTC (day-ahead forecasts) and 21 UTC (intraday-ahead forecasts) were 195.2 W m−2 and 173.5 W m−2, respectively. The difference in RMSE values obtained at the initialization times of 00 and 21 UTC was −21.7 W m−2, which is slightly better.
Table 6.
Daily mean bias error (MBE) and root mean square error (RMSE) values for each initialization time (from day-ahead forecasts to intraday-ahead forecasts) on 4 August 2014, and MBE and RMSE differences between the forecast with initialization time of 00 UTC and each of the other forecasts.
Figure 3 shows a comparison of a satellite-estimated GHI snapshot at 12 LST on 4 August 2014 obtained from AMATERASS with 24-h, 18-h, 12-h, and 6-h-ahead MSM GHI forecasts (03, 09, 15, and 21 UTC initialization times on 3 August 2014). GHI forecasts are generally underestimated compared to satellite-estimated GHI values. GHI forecasts with the four different initialization times indicate the almost same distribution, and suggest the lack of improvement even in case of the 6-h ahead forecast.
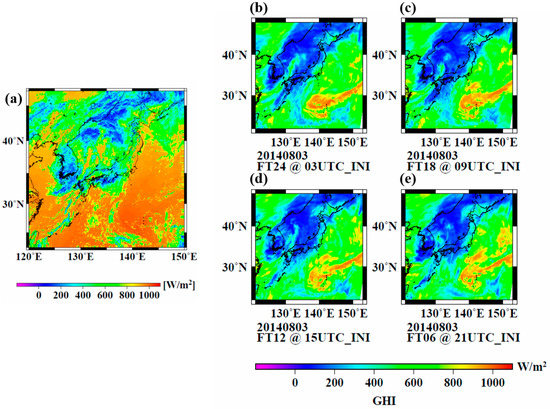
Figure 3.
(a) Satellite-estimated GHI (AMATERASS data) at 12 JST on 4 August 2014. MSM GHI forecasts of (b) 24-h forecasts with initialization time of 03 UTC on 03 August, (c) 18-h forecasts with initialization time of 09 UTC, (d) 12-h forecasts with initialization time of 15 UTC and (e) 6-h forecasts with initialization time of 21 UTC.
To investigate the difference between regionally integrated GHI observations and forecasts, the time series on 4 August 2014 for the nine electric power areas are compared, as shown in Figure 4. GHI hourly observations (black solid circles) and day-ahead hourly forecasts (blue solid circles) initialized at 00 UTC (09 JST on 3 August 2014) and intraday-ahead hourly forecasts (orange solid circles) initialized at 21 UTC (06 JST on 4 August 2014) are shown in this figure. For Kyushu, intraday-ahead forecasts contain larger forecast errors than do the day-ahead forecasts. Day-ahead forecasts for the eight electric power service areas (except for Kansai) underestimate forecast errors. Regionally integrated GHI forecasts in Kansai only was close to observations.
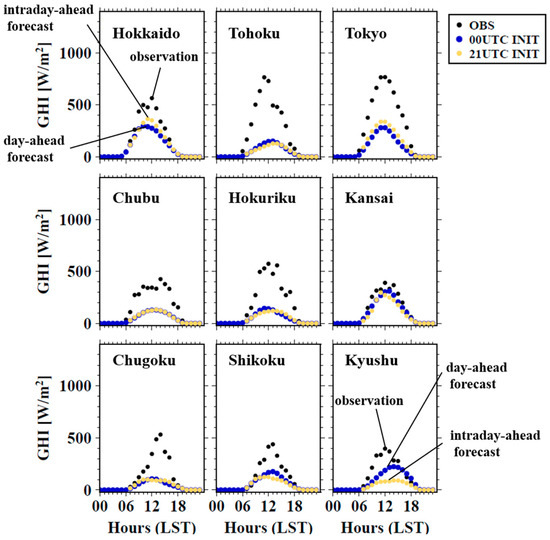
Figure 4.
Time series of regionally integrated GHI observations and forecasts for nine electric power areas on 4 August 2014. The black, orange and blue circles indicate observations, intraday-ahead forecasts, and day-ahead forecasts, respectively.
4.2. Case 2 on 10 October 2015
The top 20 outlier events in day-ahead GHI forecasts from 2015 are listed in Table 2. In the top 20 cases (15 overestimations and 5 underestimations), outlier events in regionally integrated GHI forecasts were caused under similar SLP patterns (see Section 4.1) (i.e., western or eastern edges of anticyclone over the Pacific Ocean, passage of a cyclone, stationary front (the Baiu front)), except for typhoon and south-coast cyclone cases. In about half of the events among the top 20 cases, the outlier events were caused under anticyclone and around those edges.
A weather chart generated at 09 JST on 10 October 2015 (Figure 5a) shows a 988 hPa cyclone located over the Sea of Okhotsk. Japan is around the western edge of the anticyclone of 1020 hPa over the Pacific Ocean. The chart shows another 1010 hPa cyclone with a stationary front located off the southern coast of Japan.
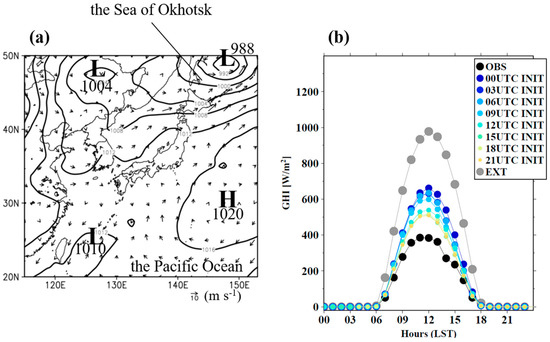
Figure 5.
(a) Weather chart at 09 JST on 10 October 2015. (b) Time series of hourly GHI observations (black circles), meso-scale model (MSM) forecasts (colors), and extra-terrestrial solar irradiance on the same day for the integrated region of the nine electric power companies’ areas.
Time series of GHI forecasts indicates overestimation compared to GHI observations, which is contrary to case 1 (Figure 2b and Figure 5b). In this case, the intraday-ahead GHI forecasts with initialization time of 21 UTC were improved compared the day-ahead forecasts. However, the intraday-ahead forecasts continued to be overestimated. RMSE values corresponding to initialization times of 00 UTC and 21 UTC are 177.8 W m−2 and 78.3 W m−2, respectively (Table 7). The difference in RMSE values between the day-ahead and intraday-ahead forecasts was −99.5 W m−2. In the case of this event, gradual improvements were found in regionally integrated GHI forecasts.
Table 7.
Same as Table 6, but for 10 October 2015.
A comparison of GHI distribution between satellite estimations and forecasts (Figure 6) shows that generally, day-ahead and intraday-ahead forecasts are close to satellite GHI estimations. The location of the satellite-estimated low-GHI band spanning from the north-east to the south-west directions (shown by “A” in Figure 6a) is similar to the forecasted locations. Compared with 24 h ahead forecasts (Figure 6b), the low-GHI band A produced by 6 h ahead forecasts (Figure 6e) moves to northward and reaches the south coastal regions of the Japan main islands. However, the other low-GHI regions (shown by “B” in Figure 6a) over the western part of Hokkaido were not reproduced in the forecasts.
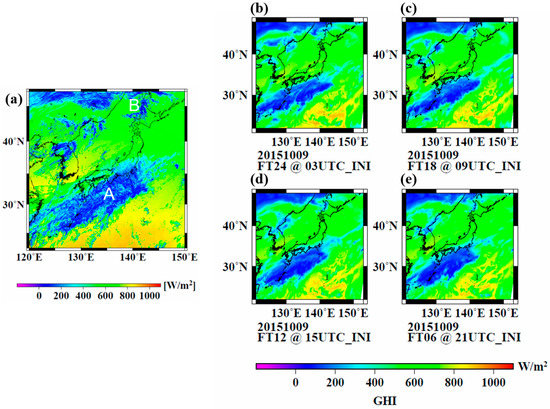
Figure 6.
(a) Satellite-estimated GHI (AMATERASS data) at 12 JST on 10 October 2015. MSM GHI forecasts of (b) 24-h forecasts with initialization time of 03 UTC on 09 October, (c) 18-h forecasts with initialization time of 09 UTC, (d) 12-h forecasts with initialization time of 15 UTC and (e) 6-h forecasts with initialization time of 21 UTC.
Comparisons of the time series of regionally integrated GHI observations and day-ahead and intraday-ahead forecasts (Figure 7), in particular, show strong overestimation for the seven electric power service areas which are located around the edge of the low-GHI band “A” (except for Hokkaido and Tohoku areas), on 10 October 2015. In Tokyo and Chubu areas, intraday-ahead GHI forecast errors tend to be smaller than day-ahead GHI forecasts due to the northward movement of the low-GHI band A in 6 h ahead forecasts.
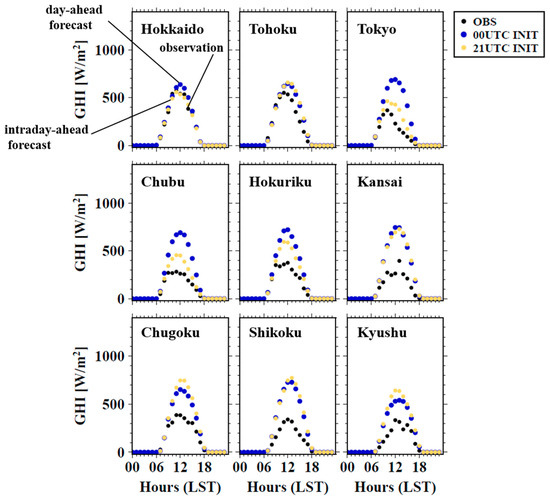
Figure 7.
Same as Figure 4, but for 10 October 2015.
4.3. Case 3 on 29 July 2016
In the top 20 cases (10 overestimations and 10 underestimations) of outlier events in GHI forecasts (Table 4), western or eastern edges of the anticyclone over the Pacific Ocean, passage of a cyclone, the Baiu front (stationary front), typhoon, cold air outbreaks, and south-coast cyclone cases were found in 2016.
A weather chart generated on July 29, 2016, which is the top outlier event among the GHI forecasts in 2016, indicated that the Japan islands are located at the western edge of anticyclone over the Pacific Ocean (Figure 8a). Wider contour intervals of surface pressure isobars and weaker easterly winds from the Pacific Ocean are suggested to be prevalent around Japan. A 1008 hPa synoptic-scale cyclone with a stationary front is located over the Sea of Okhotsk. In this case, regionally integrated GHI forecasts with different initialization times shows remarkable underestimation compared with GHI observations (Figure 8b). The intraday-ahead GHI forecast with the initialization time of 21 UTC (Figure 8b) shows a slight improvement. RMSE values obtained at initialization times of 00 UTC and 21 UTC were 221.0 W m−2 and 170.6 W m−2, and the difference in the RMSE values was −50.4 W m−2 (Table 8). The anticyclone over the Pacific Ocean was located in a relatively northward region compared with the location of the anticyclone over the Pacific Ocean corresponding to the previous underestimation outlier event in 2014 (see Section 4.1).
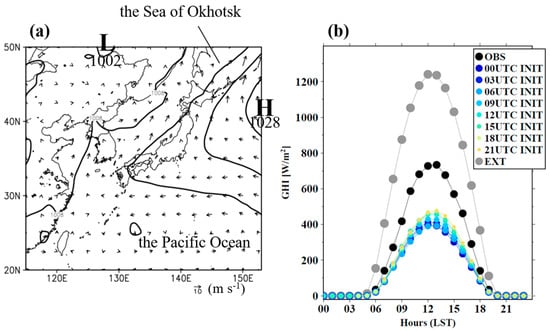
Figure 8.
(a) Weather chart at 09 JST on 29 July 2016. (b) Time series of hourly GHI observations (black circles), meso-scale model (MSM) forecasts (colors), and extra-terrestrial solar irradiance on the same day for the integrated region of the nine electric power companies’ areas.
Table 8.
Same as Table 6, but for 29 July 2016.
Although weak GHI forecast values (under approximately 200 W m−2) over Hokkaido were reproduced (Figure 9), GHI forecasts were considerably lower than the satellite-estimated GHI values. GHI forecasts over other regions, except for Hokkaido, were 400–800 W m−2 and were generally lower than the GHI observations.
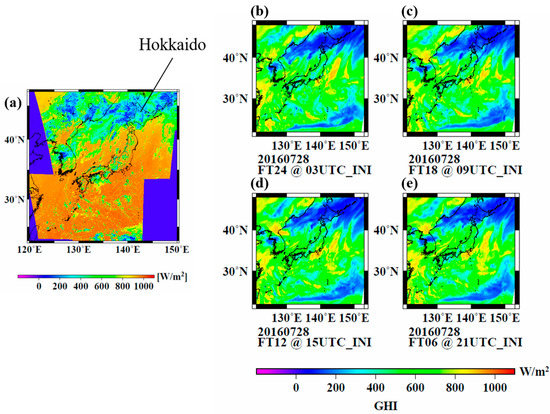
Figure 9.
(a) Satellite-estimated GHI (AMATERASS data) at 12 JST on 29 July 2016. MSM GHI forecasts of (b) 24-h forecasts with initialization time of 03 UTC on 28 July, (c) 18-h forecasts with initialization time of 09 UTC, (d) 12-h forecasts with initialization time of 15 UTC and (e) 6-h forecasts with initialization time of 21 UTC.
Figure 10 shows a time series of regionally integrated GHI observations and forecasts for the nine electric power areas on 29 July 2016. The GHI values in day-ahead and intraday-ahead GHI forecasts for Hokkaido, Tohoku and Chubu areas are approximately half of GHI observations. Especially, a remarkable underestimation of GHI forecasts over Tohoku was found. Although the intraday-ahead forecasts for the Tohoku and Tokyo areas improved slightly, underestimations in GHI forecasts remained.
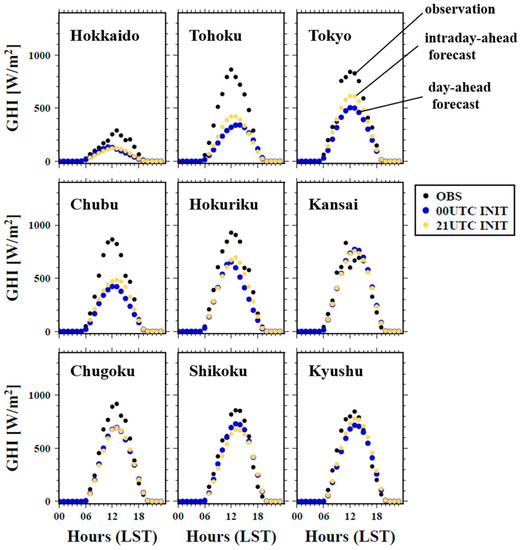
Figure 10.
Same as Figure 4, but for 29 July 2016.
4.4. Case 4 on 11 July 2017
Table 5 lists the top 20 cases (9 overestimations and 11 underestimations) of outlier events of GHI forecasts in 2017. These events are characterized by a western edge of anticyclone over the Pacific Ocean, cyclone, south-coast cyclone, typhoon, and stationary front.
In this subsection, the worst forecast error case on 11 July 2017 is described. This case was forecasted using MSM-ASUCA. From a weather chart generated at 09 LST on 11 July 2017 (Figure 11a), the Japanese islands were located at the western and northern edges of several anticyclones over the Pacific Ocean (two 1014-hPa anticyclones and a 1016-hPa anticyclone). Weak wind fields were suggested to be prevalent owing to the small horizontal gradient of SLP. The cyclone (994 hPa) with fronts over the eastern Eurasia continent moved eastward and close to the Japanese islands.
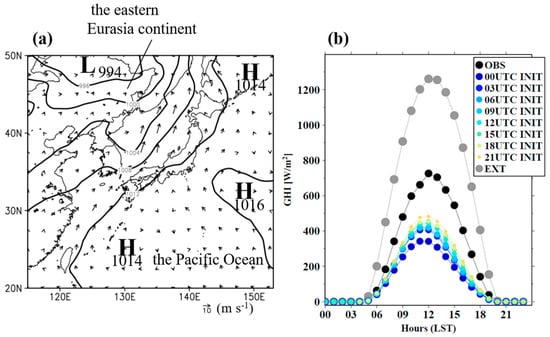
Figure 11.
(a) Weather chart at 09 JST on 11 July 2017. (b) Time series of hourly GHI observations (black circles), meso-scale model (MSM) forecasts (colors), and extra-terrestrial solar irradiance on the same day for the integrated region of the nine electric power companies’ areas.
The time series of regionally integrated GHI observations and forecasts shown in Figure 11b indicates the same remarkable underestimation of GHI forecasts as in the two other outlier events described in Section 4.1 and Section 4.3. In this case, intraday-ahead forecasts were slightly superior to day-ahead forecasts. The differences in MBE and RMSE values between forecasts with initialization times of 00 UTC and 21 UTC were 82.1 W m−2 and −96.4 W m−2, and intraday-ahead GHI forecasts were superior to day-ahead GHI forecasts (Table 9).
Table 9.
Same as Table 6, but for 11 July 2017.
Satellite-estimated GHI values show that weak GHI values prevail over the northern and western parts of Japan (shown by “C” and “D” in Figure 12a). Relatively large GHI values were found over eastern Japan (Tohoku and Tokyo). Although the distribution of GHI forecasts was similar to that of satellite-estimated GHI values, GHI forecasts were generally smaller than the corresponding satellite-estimated GHI values. There was a small difference in GHI distribution between day-ahead and intraday-ahead forecasts (updated at intervals of 6 h with different initialization times).
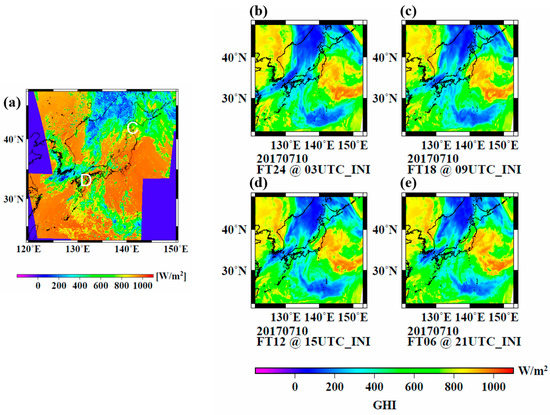
Figure 12.
(a) Satellite-estimated GHI (AMATERASS data) at 12 JST on 11 July 2017. MSM GHI forecasts of (b) 24-h forecasts with initialization time of 03 UTC on 10 July, (c) 18-h forecasts with initialization time of 09 UTC, (d) 12-h forecasts with initialization time of 15 UTC and (e) 6-h forecasts with initialization time of 21 UTC.
A comparison of regionally integrated GHI observations and forecasts (Figure 13) shows that day-ahead forecasts are characterized by large underestimation in the eight electric power areas except for the Hokkaido and Chugoku areas. Intraday-ahead GHI forecasts in the Tokyo area were superior to day-ahead GHI forecasts and were close to the GHI observations. Although intraday-ahead GHI forecasts for the Chubu, Hokuriku, Kansai and Kyushu areas were improved, GHI underestimations remained. Over the northern areas (Hokkaido and Tohoku around “C” in Figure 12a) and the western areas (Shikoku around “D” in Figure 12a), however, intraday-ahead forecasts could not be improved, compared with day-ahead forecasts.
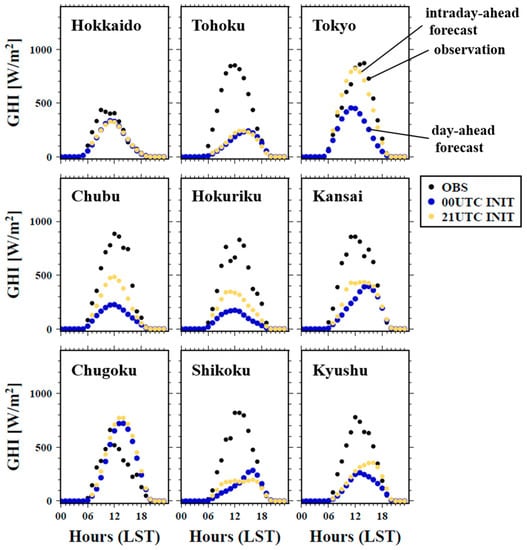
Figure 13.
Same as Figure 4, but for 11 July 2017.
5. Discussion
GHI distribution mainly depends on the distribution of clouds over an area. GHI distribution is the two dimensionally (horizontal) parameter. On the other hands, clouds in the atmosphere have the three dimensionally (horizontal and vertical) parameter. To investigate error sources of regionally integrated GHI forecasts, comparisons of cloud fields between satellite observations and MSM forecasts are performed in this section.
Figure 14a shows the satellite-observed cloud fields at 12 JST on 4 August 2014. Figure 14b shows the total cloudiness and Figure 14c,d show cloud fields at high-level (500 hPa or higher), mid-level (from 850 hPa to 500 hPa) and low-level troposphere (from surface to 850 hPa), respectively. This case was significant underestimation of regionally integrated GHI forecasts (Figure 2b). Total cloudiness distribution is similar that of high-level clouds. The mid-level clouds in the MSM reproduce the region E over the Korea peninsula (Figure 14a,d). The region F in the low-level clouds in the MSM forecasts is not found the observations (Figure 14a,e). From this case, the underestimation of regionally integrated GHI forecasts can be caused by the overestimation of high- and mid-level clouds in the MSM over the Japan islands.
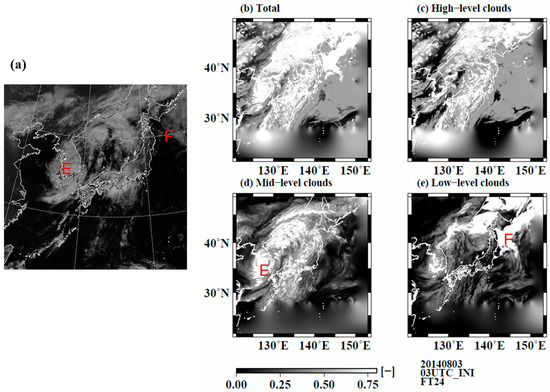
Figure 14.
(a) Satellite-visible clouds image at 12 JST on 4 August 2014. (b) Total cloudiness of MSM, (c) high-level clouds, (d) mid-level clouds and (e) low-level clouds obtained from the day-ahead (24 h ahead) forecasts with 03 UTC initialization time, respectively.
In the same manner, the overestimation case of regionally integrated GHI forecasts on 10 October 2015 (Figure 5b) was investigated. The satellite-observed cloud band spanning from the north-east to the south-west directions (shown by “G” in Figure 15a which corresponds to “A” in Figure 6a) is similar to the distribution of the total cloudiness (Figure 15b). Since the low-level clouds are not produced in the MSM, the total cloudiness is formed by high-level clouds and mid-level clouds. The mid-level clouds in the MSM is located off the southern coast of Japan. In addition, the optical thickness of high-level clouds can be thinner than the real clouds.
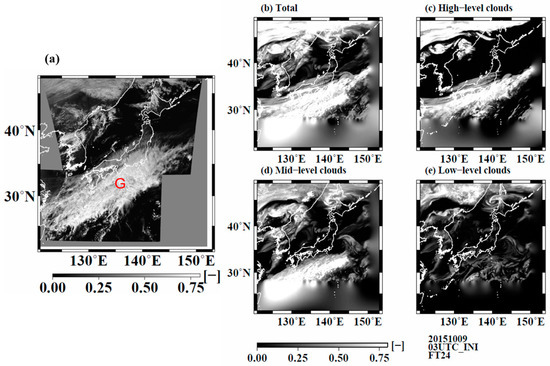
Figure 15.
Same as Figure 14, but for on 10 October 2015.
In the underestimation case of regionally integrated GHI forecasts on 29 July 2016 (Figure 8b), the total cloudiness in the MSM is prevailing compared with satellite observations (Figure 16a,b). Compared with satellite estimated cloudiness, the total cloudiness is made by high-level and mid-level clouds (Figure 16c,d). In this case, the thicker reproduction of high-level and mid-level clouds can be caused the underestimation of regionally integrated GHI forecasts. In the low-level clouds in the MSM, thicker clouds are prevailed over the Sea of Japan (shown by the region “H”) and off the east coast of Hokkaido (shown by the region “I”) compared with satellite observation (Figure 16e).
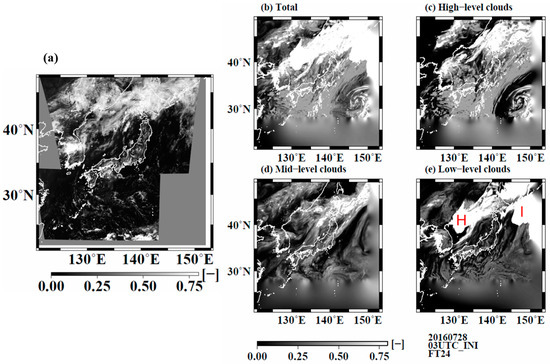
Figure 16.
Same as Figure 14, but for on 29 July 2016.
Finally, for the underestimation case of July 11, 2017 (Figure 11b), GHI values forecasted from the MSM are lower than satellite-estimated GHI values overall (Figure 12). The total cloudiness is too large compared with satellite observations (Figure 17a,b). In particular, high-level clouds prevailed significantly over the whole of Japan. It seems that high-level clouds can reduce the surface GHI overall.
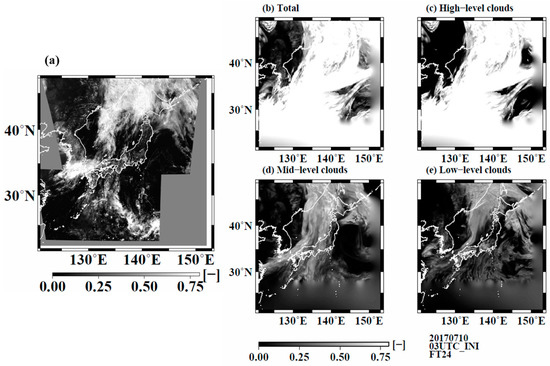
Figure 17.
Same as Figure 14, but for on 11 July 2017.
In particular, remarkable SLP patterns among the largest error cases (the four cases from 2014–2017) in regionally integrated GHI forecasts were found in the case of the western edge of anticyclone over the Pacific Ocean around Japan. Underestimations in regionally integrated GHI forecasts were found in the summer season (July and August) in the three events. Overestimation of the outlier event was caused in the autumn of 2015. Around the western edge of anticyclone, wider contour intervals of surface pressure isobars and weaker easterly winds from the Pacific Ocean were suggested to be prevalent. In several power service areas in these cases, GHI forecast accuracy is not improved by intraday-ahead forecasts.
Ohtake et al. [25] suggested from the relationship between monitoring records of cloud types and GHI day-ahead forecasts that outlier events of GHI day-ahead forecasts were caused under low-level clouds (stratocumulus (Sc) clouds and cumulus clouds), mid-level clouds (altocumulus clouds), and high-level clouds (cirrus clouds). In the future, GHI forecasts (or cloudiness forecasts) under such cloud types should be incorporated into the operational model of JMA.
The results of the four outlier events suggested that the reproducibility of high-level and mid-level clouds in the MSM can important for regionally integrated GHI forecasts. Generally, vertical model intervals in higher level layers tend to take coarser than those of near surface in NWPs. Seiki et al. [42] suggested that cirrus clouds over the tropics was affected by vertical model grid spacing of a general circulation model and showed that a vertical grid spacing of 400 m or less was necessary to resolve the structure of cirrus clouds. In the future research, sensitivity experiments on vertical layers in NWPs will be required for the improvement of high- and mid-level cloud forecasts.
For low-level clouds (e.g., Sc clouds), Yang and Kleissl [43] developed two schemes (first one is a preprocessing scheme for an initial guess at liquid water content when initializing with data and second one is a satellite cloud data assimilation) in order to improve Sc clouds forecasts in coastal regions. They also reported that the combination of both preprocessors provided the most improvement in the prediction of Sc clouds spatial coverage, thickness, and lifetime in coastal regions. Sahu et al. [44] also assimilated meteorological observations from the surface and upper-air in-situ networks over the southern California coast and showed that their hourly cyclic assimilation improved Sc clouds coverage, thickness, and life time over the coastal region.
Routine surveillance of GHI forecasts with different initialization times would be important for identifying outlier events in day-ahead GHI forecasts. Several-hour ahead forecasts in a target day tend to improve cloud forecasts associated with fronts and cyclones, because the model can be initialized through a data assimilation method that employs the latest observation data sets. To reduce GHI forecast errors, improvement in both radiation and microphysical processes of NWP models will be required to generate accurate GHI forecasts.
6. Conclusions
To stabilize electric power system operation under various weather conditions, considering the installation of a large amount of PV systems, power interconnection between different electric power service areas would be required.
In this study, case studies of large errors (or outlier events) in regionally integrated day-ahead GHI forecasts obtained using MSM of JMA were investigated for nine electric power service areas in Japan. During the four years from 2014 to 2017, a total of 80 outlier cases in regionally integrated GHI forecasts were selected. These outlier events must be addressed to prevent electric power accidents (e.g., power failure, surplus power). From this study, the following results are obtained;
(1) Outlier events in regionally integrated GHI day-ahead forecasts tend to be caused in the following SLP patterns; a western edge of anticyclone, a stationary front, a synoptic-scale cyclone and typhoon etc.
(2) The comparison between regionally integrated GHI day-ahead forecast errors and cloudiness forecasts suggested that the issue of forecast accuracy of clouds in high-level and mid-level troposphere in NWPs were remained.
The SLP patterns of both overestimated and underestimated outlier events in day-ahead GHI forecasts were investigated. Under outlier events in GHI forecasts, several SLP patterns were found in 80 events during the four years; (a) a western edge of anticyclone over the Pacific Ocean (frequency per 80 outlier events; 48.8%), (b) stationary fronts (including the Baiu front in the Japanese rainy season) (20.0%), (c) a synoptic-scale cyclone (18.8%), and (d) typhoons (tropical cyclones) (8.8%) around the Japan islands.
Furthermore, information related to the SLP patterns described above can be used in advance as an indicator of outlier events in regionally integrated day-ahead GHI forecasts (i.e., PV power forecasts) by electric power system operators. Although the present study focused on Japanese electric power areas, further investigation of SLP characteristics under outlier events will be required for other worldwide regions.
The present study defined outlier events based on GHI forecasts from NWP for nine electric power areas in Japan. From another viewpoint, a definition of outlier events based on the difference between observations and forecasts of regionally integrated PV power generation would be required. This problem will be investigated in the future.
Author Contributions
Data curation, F.U., Y.Y., H.T. and T.Y.N.; Formal analysis, H.O.; Investigation, H.O.; Methodology, H.O.; Supervision, T.O.; Writing—original draft, H.O., F.U., T.O. and Y.Y.; Writing—review and editing, H.O.
Funding
This research was funded by Core Research for Evolutional Science and Technology (CREST) project, grant number JPMJCR15K1, provided by the Japan Science and Technology Agency (JST) [45,46].
Acknowledgments
Special observations were supported by the Kumagaya and Kushiro meteorological offices of the JMA. The AMATERASS data was obtained from the solar radiation consortium. The weather charts were obtained from the JMA website (http://www.data.jma.go.jp/fcd/yoho/hibiten/).
Conflicts of Interest
The authors declare no conflict of interest.
References
- Ogimoto, K.; Kaizuka, I.; Ueda, Y.; Oozeki, T. A Good Fit: Japan’s solar power program and prospects for the new power system. IEEE Power Energy Mag. 2013, 11, 65–74. [Google Scholar] [CrossRef]
- Ogimoto, K. PV Integration in Japan, IEA PVPS Task 14– Utility Workshop. 2014. Available online: http://ieapvps.org/fileadmin/html/img/32_PV_Grid_Integration_in_Japan__Kazuhiko_Ogimoto__Univ_Tokyo_.pdf (accessed on 24 September 2018).
- Davy, R.J.; Troccoli, A. Interannual variability of solar energy generation in Australia. Sol. Energy 2012, 86, 3554–3560. [Google Scholar] [CrossRef]
- Schmidt, T.; Kalisch, J.; Lorenz, E.; Heinemann, D. Evaluating the spatio-temporal performance of sky-imager-based solar irradiance analysis and forecasts. Atmos. Chem. Phys. 2016, 16, 3399–3412. [Google Scholar] [CrossRef]
- Gueymard, C.A.; Wilcox, S.M. Assessment of spatial and temporal variability in the US solar resource from radiometric measurements and predictions from models using ground-based or satellite data. Sol. Energy 2011, 85, 1068–1084. [Google Scholar] [CrossRef]
- Ruiz-Arias, J.A.; Quesada-Ruiz, S.; Fernandez, E.F.; Gueymard, C.A. Optimal combination of gridded and ground-observed solar radiation data for regional solar resource assessment. Sol. Energy 2015, 112, 411–424. [Google Scholar] [CrossRef]
- Journee, M.; Muller, R.; Bertrand, C. Solar resource assessment in the Benelux by merging Meteosat-derived climate data and ground measurements. Sol. Energy 2012, 86, 3561–3574. [Google Scholar] [CrossRef]
- Wirth, G.; Lorenz, E.; Spring, A.; Becker, G.; Pardatscher, R.; Witzmann, R. Modeling the maximum power output of a distributed PV fleet. Prog. Photovolt: Res. Appl. 2015, 1164–1181. [Google Scholar] [CrossRef]
- Ogimoto, K.; Washihara, K.; MacGill, I.; Mather, B.; Stetz, T.; Mayr, C.; Brundlinger, R.; Iaria, A.; Gaglioti, E.; Rekinger, M.; et al. High penetration PV in power systems outcome of the IEA-PVPS Task 14’s subtask 3. In Proceedings of the 29th European Photovoltaic Solar Energy Conference and Exhibition, Amsterdam, The Netherlands, 22–26 September 2014; pp. 3994–3999. [Google Scholar]
- Huva, R.; Dargaville, R.; Caine, S. Prototype large-scale renewable energy system optimisation for Victoria, Australia. Energy 2012, 41, 326–334. [Google Scholar] [CrossRef]
- Udagawa, Y.; Ogimoto, K.; Ikegami, T.; Oozeki, T.; Ohtake, H.; Fukutome, S. Impact of PV power prediction technology on power system operation. In Proceedings of the 6th World conference on Photovoltaic Energy Conversion, Kyoto, Japan, 23–27 November 2014; 8WePo.8.5. pp. 1197–1198. [Google Scholar]
- Udagawa, Y.; Ogimoto, K.; Ikegami, T.; Oozeki, T.; Ohtake, H.; Fukutome, S. Analysis of the variability of PV power and residual load. In Proceedings of the 6th World conference on Photovoltaic Energy Conversion, Kyoto, Japan, 23–27 November 2014; 8WePo.9.28. pp. 1301–1302. [Google Scholar]
- Tokyo Electric Power Company (TEPCO). Available online: http://www.tepco.co.jp/en/challenge/energy/thermal/thermal-e.html (accessed on 31 August 2018).
- Organization for Cross-Regional Coordination of Transmission Operators, Japan (OCCTO). Available online: https://www.occto.or.jp/en/occto/about_occto/index.html (accessed on 31 August 2018).
- Organization for Cross-Regional Coordination of Transmission Operators, Japan (OCCTO). Organization for Cross-Regional Coordination of Transmission Operators, JAPAN Annual Report—Fiscal Year 2016. Available online: https://www.occto.or.jp/en/information_disclosure/annual_report/files/annual_report_FY2016.pdf (accessed on 24 September 2018).
- Lorenz, E.; Scheidsteger, T.; Hurka, J.; Heinemann, D.; Kurz, C. Regional PV power prediction for improved grid integration. Prog. Photovolt: Res. Appl. Special Issue 2010, 19, 757–771. [Google Scholar] [CrossRef]
- Fernandez-Jimenez, L.A.; Muñoz-Jimenez, A.; Falces, A.; Mendoza-Villena, M.; Garcia-Garrido, E.; Lara-Santillan, P.M.; Zorzano-Alba, E.; Zorzano-Santamaria, P.J. Short-term power forecasting system for photovoltaic plants. Renew. Energy 2012, 44, 311–317. [Google Scholar] [CrossRef]
- Fonseca, J.G.S., Jr.; Oozeki, T.; Ohtake, H.; Takashima, T.; Ogimoto, K. On the Use of Maximum Likelihood and Input Data Similarity to Obtain Prediction Intervals for Forecasts of Photovoltaic Power Generation. J. Electr. Eng. Technol. 2015, 10, 1342–1348. [Google Scholar] [CrossRef]
- Fonseca, J.G.S., Jr.; Oozeki, T.; Ohtake, H.; Takashima, T.; Ogimoto, K. Regional forecasts of photovoltaic power generation according to different data availability scenarios: A study of four methods. Prog. Photovolt: Res. Appl. 2014, 23, 1203–1218. [Google Scholar] [CrossRef]
- Jimenez, P.; Hacker, J.; Dudhia, J.; Haupt, S.; Ruiz-Arias, J.; Gueymard, C.; Thompson, G.; Eidhammer, T.; Deng, A. WRF-Solar: An augmented NWP model for solar power prediction. Model description and clear sky assessment. Bull. American Meteor. Soc. 2016, 12, 1249–1264. [Google Scholar] [CrossRef]
- Haupt, S.E.; Kosovic, B. Big Data and Machine Learning for Applied Weather Forecasts Forecasting Solar Power for Utility Operations: Computational Intelligence. 2015 IEEE Symposium Series 2015, 496–501. [Google Scholar]
- Oozeki, T.; Fonseca, J.G.S., Jr.; Ohtake, H.; Shimose, K.I.; Takashima, T.; Ogimoto, K. Development of the regional photovoltaic power forecasting using irradiation data from a few meteorological stations. In Proceedings of the 28th European Photovoltaic Solar Energy Conference and Exhibition; Villepinte, France: 30 September–4 October 2013; pp. 3928–3930.
- Martinez-Anido, C.B.; Botor, B.; Florita, A.R.; Draxl, C.; Lu, S.; Hamann, H.F.; Hodge, B.-M. The value of day-ahead solar power forecasting improvement. Sol. Energy 2016, 129, 192–203. [Google Scholar] [CrossRef]
- Antonanzas, J.; Pozo-Vázquez, D.; Fernandez-Jimenez, L.A.; Martinez-de-Pisona, F.J. The value of day-ahead forecasting for photovoltaics in the Spanish electricity market. Sol. Energy 2017, 158, 140–146. [Google Scholar] [CrossRef]
- Ohtake, H.; Shimose, K.-I.; Fonseca, J.G.S., Jr.; Takashima, T.; Oozeki, T.; Yamada, Y. Accuracy of the solar irradiance forecasts of the Japan Meteorological Agency mesoscale model for the Kanto region, Japan. Sol. Energy 2013, 98, 138–152. [Google Scholar] [CrossRef]
- Ohtake, H.; Shimose, K.I.; Fonseca, J.J.G.S.; Takashima, T.; Oozeki, T.; Yamada, T. Regional and seasonal characteristics of global horizontal irradiance forecasts obtained from the Japan Meteorological Agency mesoscale model. Sol. Energy 2015, 116, 83–99. [Google Scholar] [CrossRef]
- Uno, F.; Ohtake, H.; Matsueda, M.; Yamada, T. A diagnostic for advance detection of forecast busts of regional surface solar radiation using multi-center grand ensemble forecasts. Sol. Energy 2018, 162, 196–204. [Google Scholar] [CrossRef]
- Takenaka, H.; Nakajima, T.Y.; Higurashi, A.; Higuchi, A.; Takamura, T.; Pinker, R.T.; Nakajima, T. Estimation of solar radiation using a neural network based on radiative transfer. J. Geophys. Res. 2011, 116. [Google Scholar] [CrossRef]
- JST CREST EMS, TEEDDA Team. Available online: http://www.nkj.ds.u-tokai.ac.jp/~teedda/en/index.html (accessed on 31 August 2018).
- Damiani, A.; Irie, H.; Horio, T.; Takamura, T.; Khatri, P.; Takenaka, H.; Nagao, T.; Nakajima, T.Y.; Cordero, R.R. Evaluation of Himawari-8 surface downwelling solar radiation by SKYNET observations. Atmos. Meas. Tech. Discuss. 2018, 11, 2501–2521. [Google Scholar] [CrossRef]
- Saito, K.; Fujita, T.; Yamada, Y.; Ishida, J.; Kumagai, Y.; Aranami, K.; Ohmori, S.; Nagasawa, R.; Kumagai, S.; Muroi, C.; et al. The operational JMA nonhydrostatic mesoscale model. Mon. Weather Rev. 2006, 134, 1266–1298. [Google Scholar] [CrossRef]
- The Japan Meteorological Agency English Version Website (Numerical Weather Prediction Activities). Available online: http://www.jma.go.jp/jma/en/Activities/nwp.html (accessed on 31 August 2018).
- Ishida, J.; Muroi, C.; Kawano, K.; Kitamura, Y. Development of a new nonhydrostatic model “ASUCA” at JMA. CAS/JSC WGNE Res. Activ. Atmos. Ocean. Modell. 2010, 40, 11–12. [Google Scholar]
- Ishikawa, Y.; Koizumi, K. One month cycle experiments of the JMA mesoscale 4-dimensional variational data assimilation (4D-Var) system. CAS/JSC WGNE Res. Activ. Atmos. Oceanic Modell. 2002, 32, 126–127. [Google Scholar]
- Ikawa, M.; Saito, K. Description of a nonhydrostatic model developed at the forecast research department of the MRI. Tech. Rep. MRI. 1991, 28, 238. [Google Scholar]
- Kain, J.; Fritsch, J. Convective parameterization for mesoscale models: The Kain–Fritsch scheme. The representation of cumulus convection in numerical models. Meteor. Monogr. 1993, 24, 165–170. [Google Scholar]
- Ohmori, S.; Yamada, Y. Implementation of the Kain-Fritsch convective parameterization scheme in the JMA’s Non-hydrostatic Model. CAS/JSC WGNE Res. Activ. Atmos. Oceanic Modell. 2004, 34, 425–426. [Google Scholar]
- JMA website. Outline of the Operational Numerical weather Prediction at the Japan Meteorological Agency (Outline NWP March 2013). Available online: http://www.jma.go.jp/jma/jma-eng/jma-center/nwp/outline2013-nwp/index.htm (accessed on 31 August 2018).
- Sommeria, G.; Deardorff, J.W. Subgrid-scale condensation in models of nonprecipitating clouds. J. Atmos. Sci. 1977, 34, 344–355. [Google Scholar] [CrossRef]
- Nakanishi, M.; Niino, H. Development of an improved turbulence closure model for the atmospheric boundary layer. J. Meteor. Soc. Jpn. 2009, 87, 895–912. [Google Scholar] [CrossRef]
- Liou, K.N. An Introduction to Atmospheric Radiation. Academic Press Inc. 2002, 84, 583. [Google Scholar] [CrossRef]
- Seiki, T.; Kodama, C.; Satoh, M.; Hashino, T.; Hagihara, Y.; Okamoto, H. Vertical grid spacing necessary for simulating tropical cirrus clouds with a high-resolution atmospheric general circulation model. Geophys. Res. Lett. 2015, 42, 4150–4157. [Google Scholar] [CrossRef]
- Yang, H.; Kleissl, J. Preprocessing WRF initial conditions for coastal stratocumulus forecasting. Sol. Energy 2016, 133, 180–193. [Google Scholar] [CrossRef]
- Sahu, D.K.; Yang, H.; Kleissl, J. Assimilating observations to simulate marine layer stratocumulus for solar forecasting. Sol. Energy 2018, 162, 454–471. [Google Scholar] [CrossRef]
- Japan Science and Technology Agency (JST). Available online: http://www.jst.go.jp/EN/index.html (accessed on 31 August 2018).
- Core Research for Evolutional Science and Technology (CREST). Available online: http://www.jst.go.jp/kisoken/crest/en/index.html (accessed on 31 August 2018).
© 2018 by the authors. Licensee MDPI, Basel, Switzerland. This article is an open access article distributed under the terms and conditions of the Creative Commons Attribution (CC BY) license (http://creativecommons.org/licenses/by/4.0/).