1. Introduction
The building sector consumes nearly 40% of the world’s primary energy [
1] and is responsible for a significant amount of CO
2 emissions which is a major cause of global warming [
2]. With the increasing population and increasing global temperature, energy demand in the building sector is increasing day by day. To meet this growing energy demand and to ensure the effective usage of diminishing fossil fuel resources, mitigation measures must be implemented and practiced. In parallel it is also important to analyze historical energy consumption trends and to forecast the same for different climatic regions of the world in order to facilitate the policy makers in the development of effective policies concerning buildings energy performance. Outdoor temperature which is different in different parts of the world has a significant effect on the buildings cooling and heating energy demands.
There are different methods for analyzing energy consumption patterns of buildings, yet, the Degree-days (DDs) method, invented by Lt-Gen. Sir Richard Strachey in 1878, is a simple and reliable method to establish energy analysis of buildings [
3]. Degree-days represents a versatile climatic indicator which is commonly used in the analysis of building energy performance, as an e.g., (i) to perform energetic assessment of existent and new buildings; (ii) to analyze the territory energy consumption; (iii) to develop scenario analyses in terms of energy consumption forecasting, and so on. DDs can also be used to plan future energy targets and energy budgets, identify variations in consumption patterns and investigate building’s performance against typical benchmarks and most importantly in the preparation of policies concerning buildings’ energy consumption [
4]. Technically, Degree-days are nothing but the summation of the differences of temperatures for a specific time period [
5]. The temperature difference is determined between mean ambient temperature and a reference temperature, usually known as base temperature or balance point temperature. The base temperature is a constant value at which cooling (heating) systems are not required to operate to maintain comfort conditions in the buildings. Selecting an optimum base temperature for the heating and cooling plants is crucial in order to optimize the performance of HVAC plants and to control HVAC related costs in buildings. For example, in USA, UK, and Germany, commonly used base temperatures for the purpose of calculating HDDs and CDDs are 18.3 °C, 15.5 °C and 15 °C [
6].
A number of researchers have established the HDDs and CDDs of different countries, e.g., Orhan et al. [
7] established HDDs and CDDs for 78 different cities of Turkey using the historical temperature data from the relevant weather stations. In a similar study, Altan [
3] established HDDs and CDDs for five different base temperatures for 79 city centres of Turkey using long term historical data of 21 years. Al-Hadhrami [
8] used temperature data from 38 metrological stations and established HDDs and CDDs for different parts of Saudi Arabia for a base temperature of 18.3 °C. Mattia et al. [
4] determined HDDs and CDDs for Italy for 75 different locations for three different base temperatures. Viorel and Zamfir [
9] established HDDs and CDDs for 29 different cities of Romania using the data collected from the relevant weather stations. There are more similar studies [
10,
11,
12,
13,
14,
15,
16,
17,
18,
19,
20] where HDDs and CDDs have been established for different parts of the world. However, there are plenty of regions/countries on the globe of which HDDs and CDDs have not been established yet and therefore, forecasting energy consumption of such regions is always a challenging task for their policy makers. This unavailability of HDD and CDDs for different climatic regions of the world has been considered as a serious knowledge gap which must be filled through continuous research. This study aims to fill this knowledge gap partially by focusing on one country, i.e., Pakistan, by establishing its HDDs and CDDs (at different base temperatures) of 22 cities representing different climatic regions of Pakistan by using daily mean historical temperature data of last 30 years (1985 to 2015) collected from the metrological department of Pakistan. The study further aims to develop HDDs and CDDs maps to facilitate the international investors, policy makers and building designers to identify major heating and cooling regions of Pakistan.
2. Background
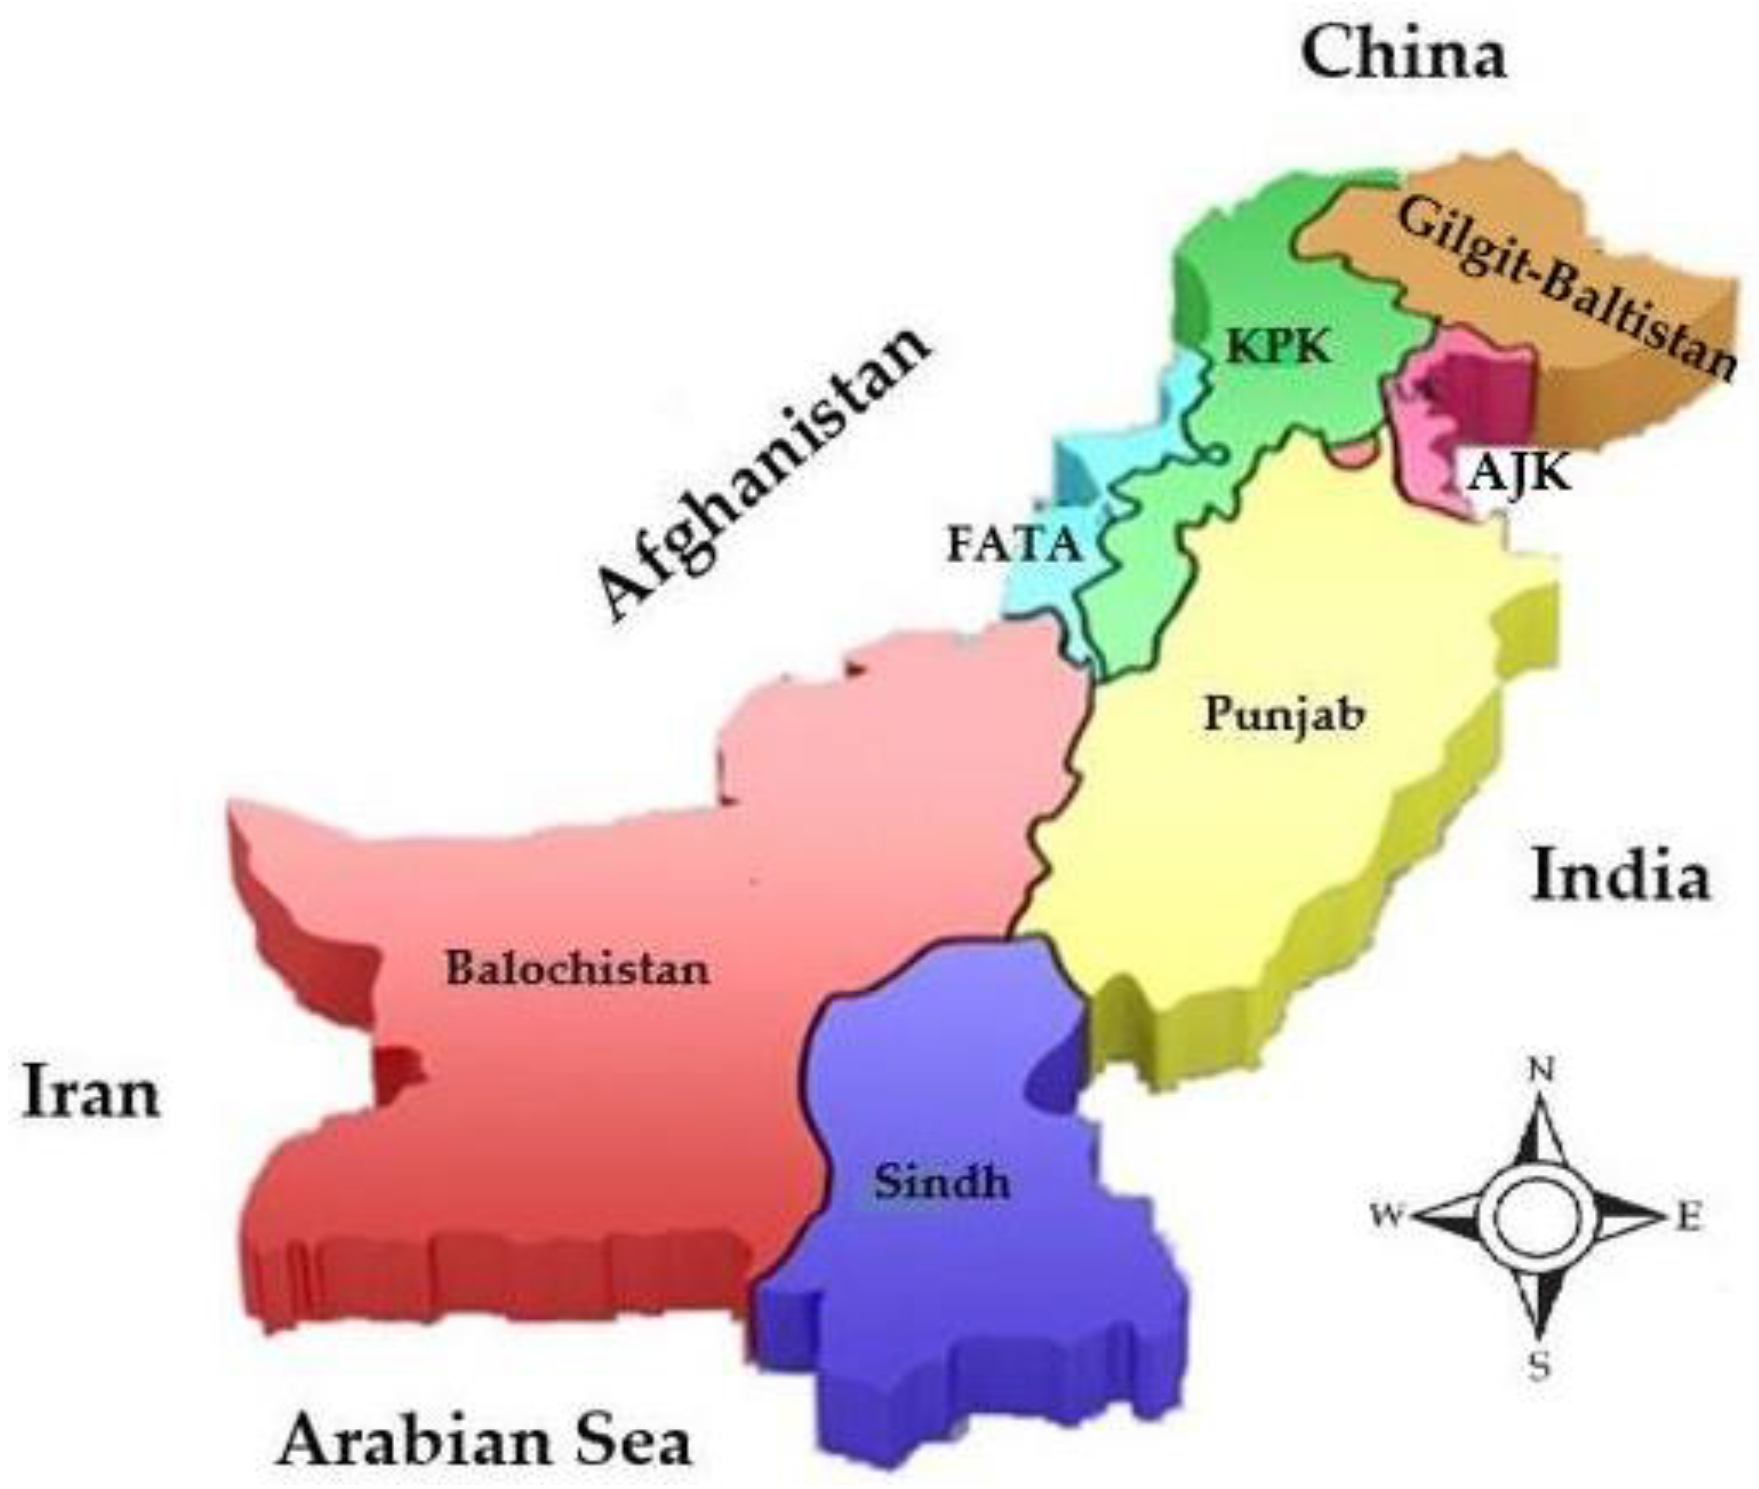
Pakistan is comprised of four provinces: Punjab, Sindh, Baluchistan and Khyber-Pakhtunkhwa (KPK) and four associated territories: the Tribal belt (Federally Administrative Tribal Areas, commonly known as FATA), Gilgit–Baltistan, Islamabad Capital Territory, and Azad Jammu and Kashmir (AJK). Pakistan is bordered by Afghanistan to the west, India to the east, China in the northeast and Iran borders the country to the southwest. Pakistan has a coastline of 1046 km on its south.
Figure 1 shows the map of Pakistan [
21].
Pakistan covers 796,095 km
2 land area, which is approximately equal to the collective terrestrial areas of France and the United Kingdom. In 2015, Pakistan had a population of 19.45 M, and a gross national income per capita of 1275 USD. In recent years, Pakistan has seen some economic growth, i.e., approximately 4.4% over the last 10 years [
22]. The climate of Pakistan varies from temperate to tropical having arid conditions in the coastal south. There is a dry season with considerably less or no rainfall and a monsoon season with heavy rainfall followed by frequent flooding. There are four different seasons: a cool, dry winter from December through February; a hot, dry spring from March through May; the summer rainy season, or southwest monsoon period, from June through September; and the retreating monsoon period of October and November [
23]. Average temperature varies with highest temperatures recorded in the Southern end near the coastline whereas temperatures in the northern end of Pakistan remain fairly low. Pakistan has recorded one of the highest temperatures in the world, i.e., 53.5 °C in its Sindh province on 26 May 2010 [
24]. A strong and diverse energy sector making full utilization of available energy resources in a developing country such as Pakistan could play a vital role in the development of its other sectors and could bring socio-economic development to the country [
25]. Unfortunately, Pakistan is currently facing a severe energy shortage and has already signed an agreement with Iran to supply natural gas through a 1900-km long pipeline in order to overcome this energy crisis. However, this project has been delayed due to political reasons and the country’s energy short fall is increasing day by day [
26]. Oil and gas are the two key components of Pakistan’s current energy mix meeting approximately 62% electricity demand of the country while 34% demand is met by hydro power plants and the remaining 4% by the nuclear power plants [
27].
Energy consumption in the building sector has a share of 55% of its annual energy and is the major energy consuming sector of Pakistan [
28]. At the time when Pakistan is becoming a key player in Asia after it initiated China Pakistan Economic Corridor (CPEC) project with China and when other countries such as Russia and Iran have shown their desire to join this project, it is expected that Pakistan’s energy sector will have a greater opportunity to contribute towards international carbon reduction targets through greener and sustainable initiatives. Therefore, it is a great opportunity for its policy makers to analyze and forecast energy demands of different regions of Pakistan for attracting more investors from across the world for its energy sector. As discussed earlier, the Degree Day Method could be applied for analyzing and forecasting energy consumption of Pakistan’s different regions. For this purpose, availability of HDD and CDD at different base temperatures is indispensable. At current, a very limited research [
29] had been undertaken in this regard which was based on a single year data only and represented only a few cities of Pakistan.
3. Methodology
Data for the mean daily temperature for 22 cities located in different provinces of Pakistan for a period of 30 years (i.e., from 1985 to 2015) were obtained from the relevant weather stations and yearly Cooling Degree-Days (CDDs) and Heating Degree-Days (HDDs) were then calculated for each city based on their daily mean temperatures.
Table 1 presents the Latitude, Longitude, elevation and average annual outdoor temperature of 22 cities in Pakistan.
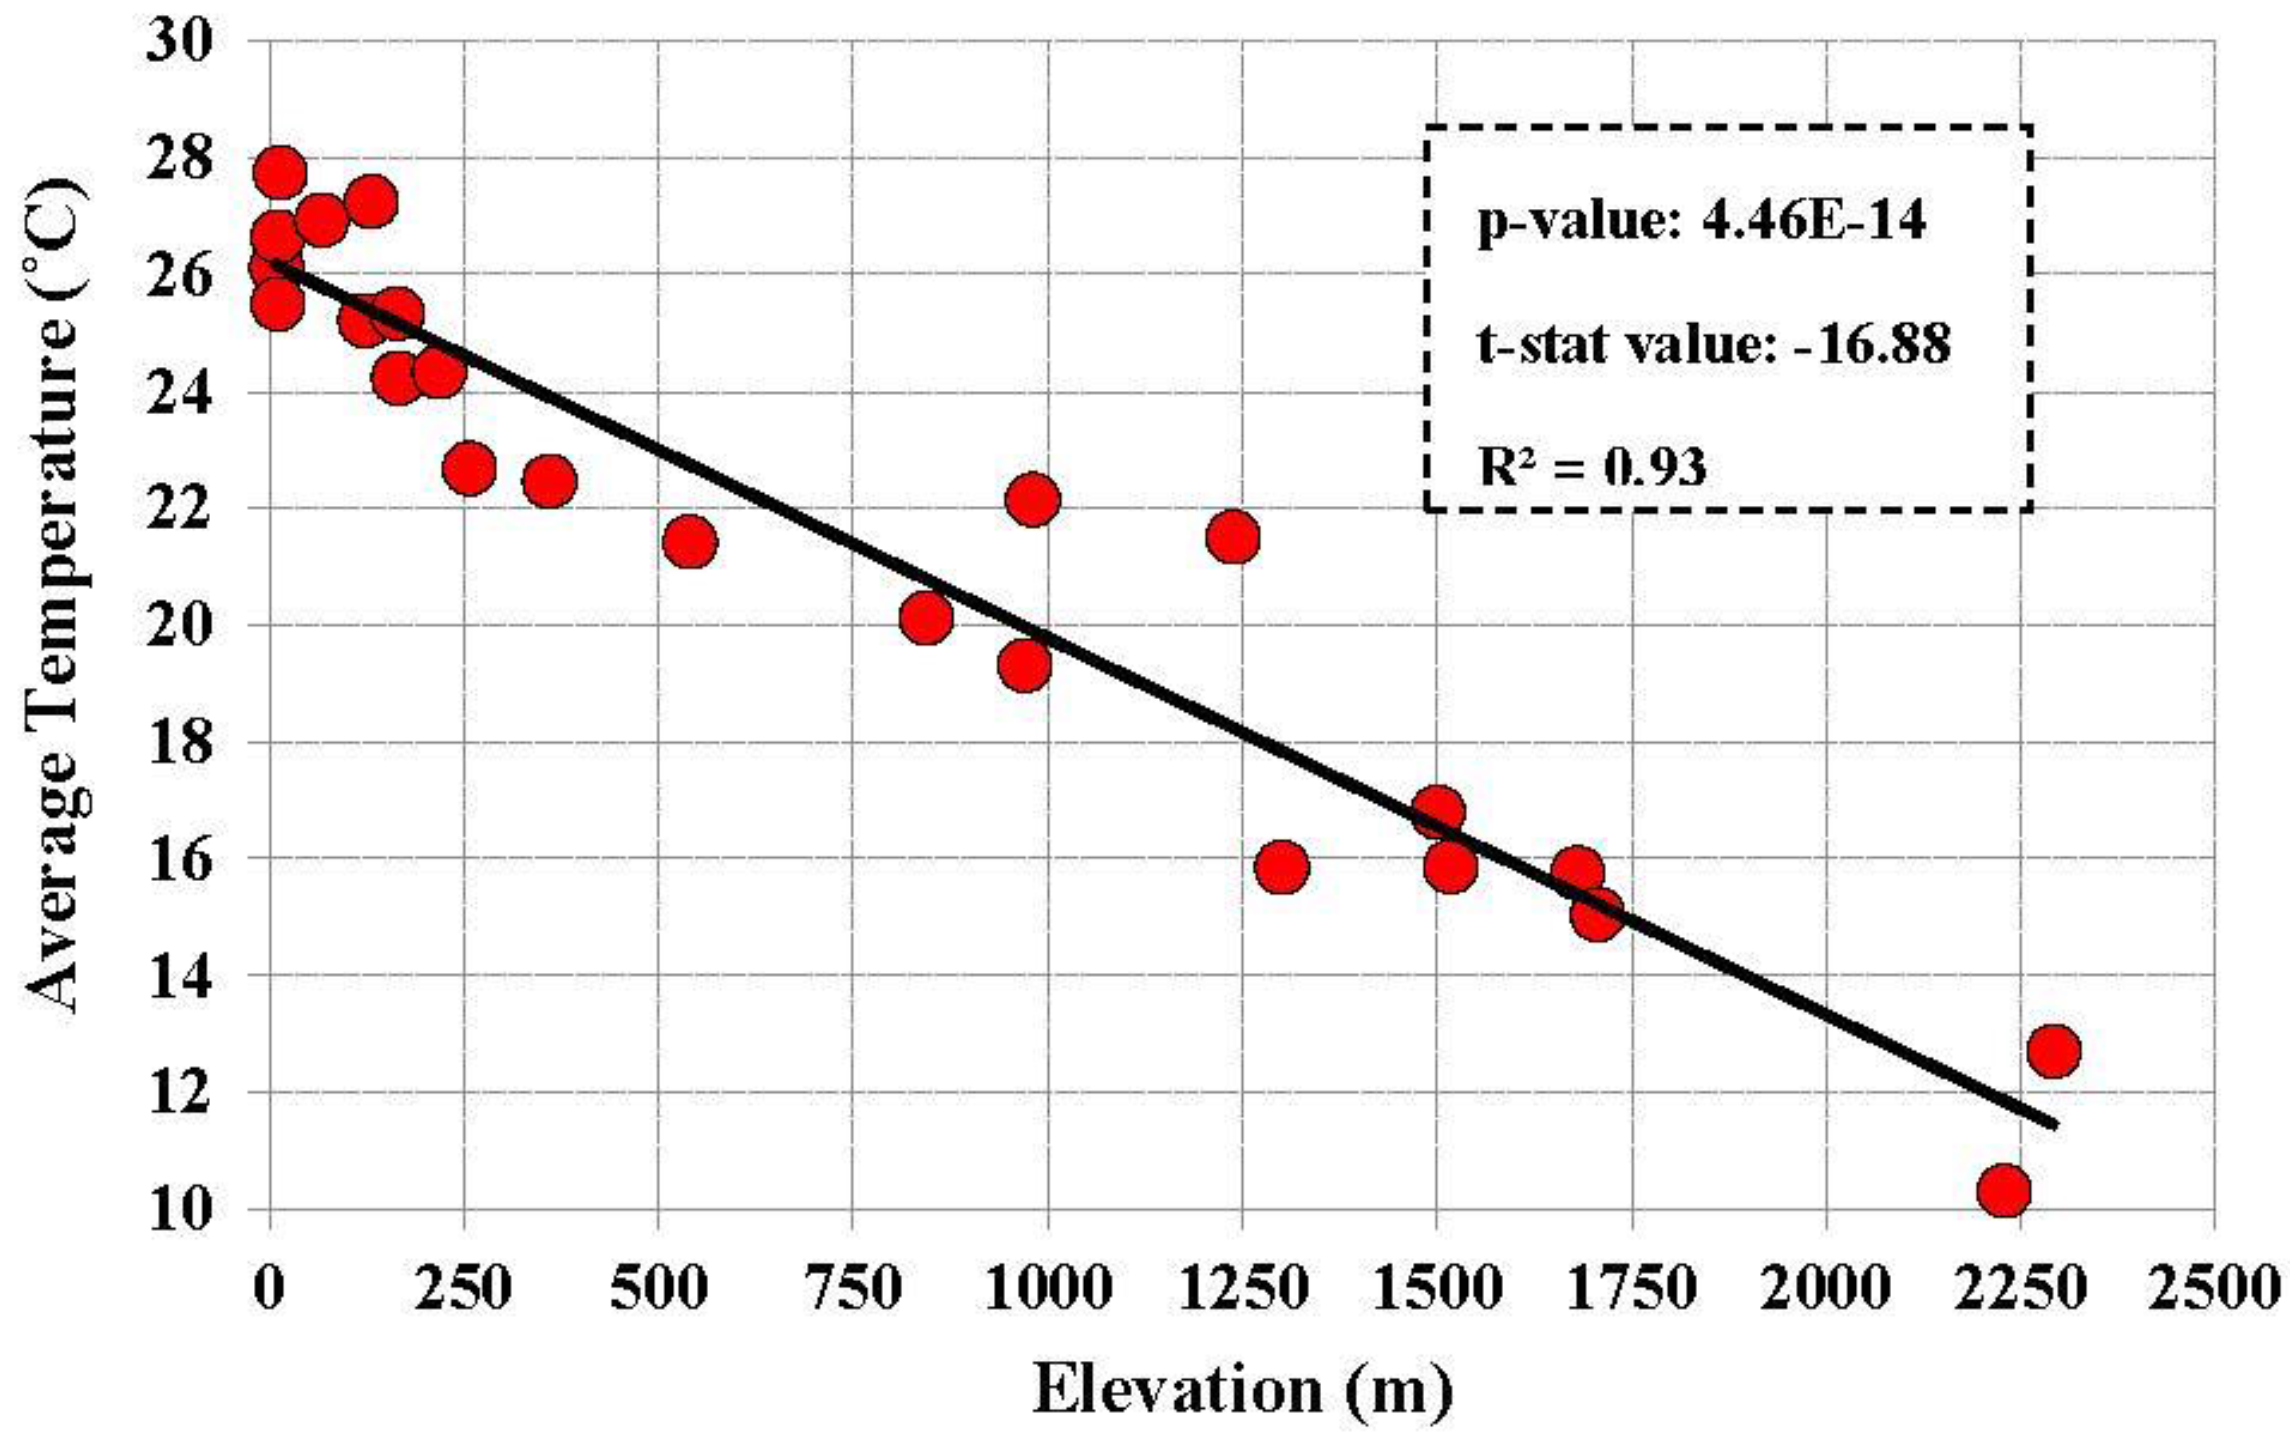
Figure 2 shows the relationship between the average temperature of different cities and their corresponding elevation.
It is apparent that cities at low elevation such as Karachi and Pasni have high annual mean temperature, i.e., >26 °C, whereas cities with high elevation such as Parachinar, Murree and Quetta have lower annual mean temperatures, i.e., <15 °C. Linear regression analysis was performed and values for different statistical parameters were found. Parameters such as p-value which is less than 0.05, t-stat value > 1.96 and R2 value of 0.93, demonstrate a strong relationship between elevation and average temperature.
4. Calculation of Degree-Days
Degree-days are the integral (summation) of the differences of temperatures between a defined base temperature and ambient temperature. Heating degree-day is a measure of a value when base temperature remains higher than the outdoor temperature. In this way DDs for a particular day are merely the difference of base temperature and the daily average ambient temperature. The base point temperature is a principal value to the successful use and understanding of degree-days. Base point temperature is a point, at which the cooling and/or heating system will not need to operate to perform the associated working [
30].
4.1. Calculation of Heating Degree-Days
Real values of heating degree-day numbers for a specific area can be measured using daily average ambient temperatures. Daily, monthly and yearly and yearly average heating degree-day numbers for each city have been calculated using (Equations (1)–(4)) equations:
In the equations,
Ta (°C) is the daily mean ambient temperature,
Tb (°C) is base point temperature, and HDD is heating degree-day number. The positive sign in Equation (1) shows that only the positive values of temperature difference (
Tb −
Ta) should be considered for HDD. If this temperature difference is negative, it should be considered as zero. Annual HDDs for 22 cities for six different base temperatures (i.e., 12 °C, 14 °C, 16 °C, 18 °C, 20 °C and 22 °C) are presented in
Table 2.
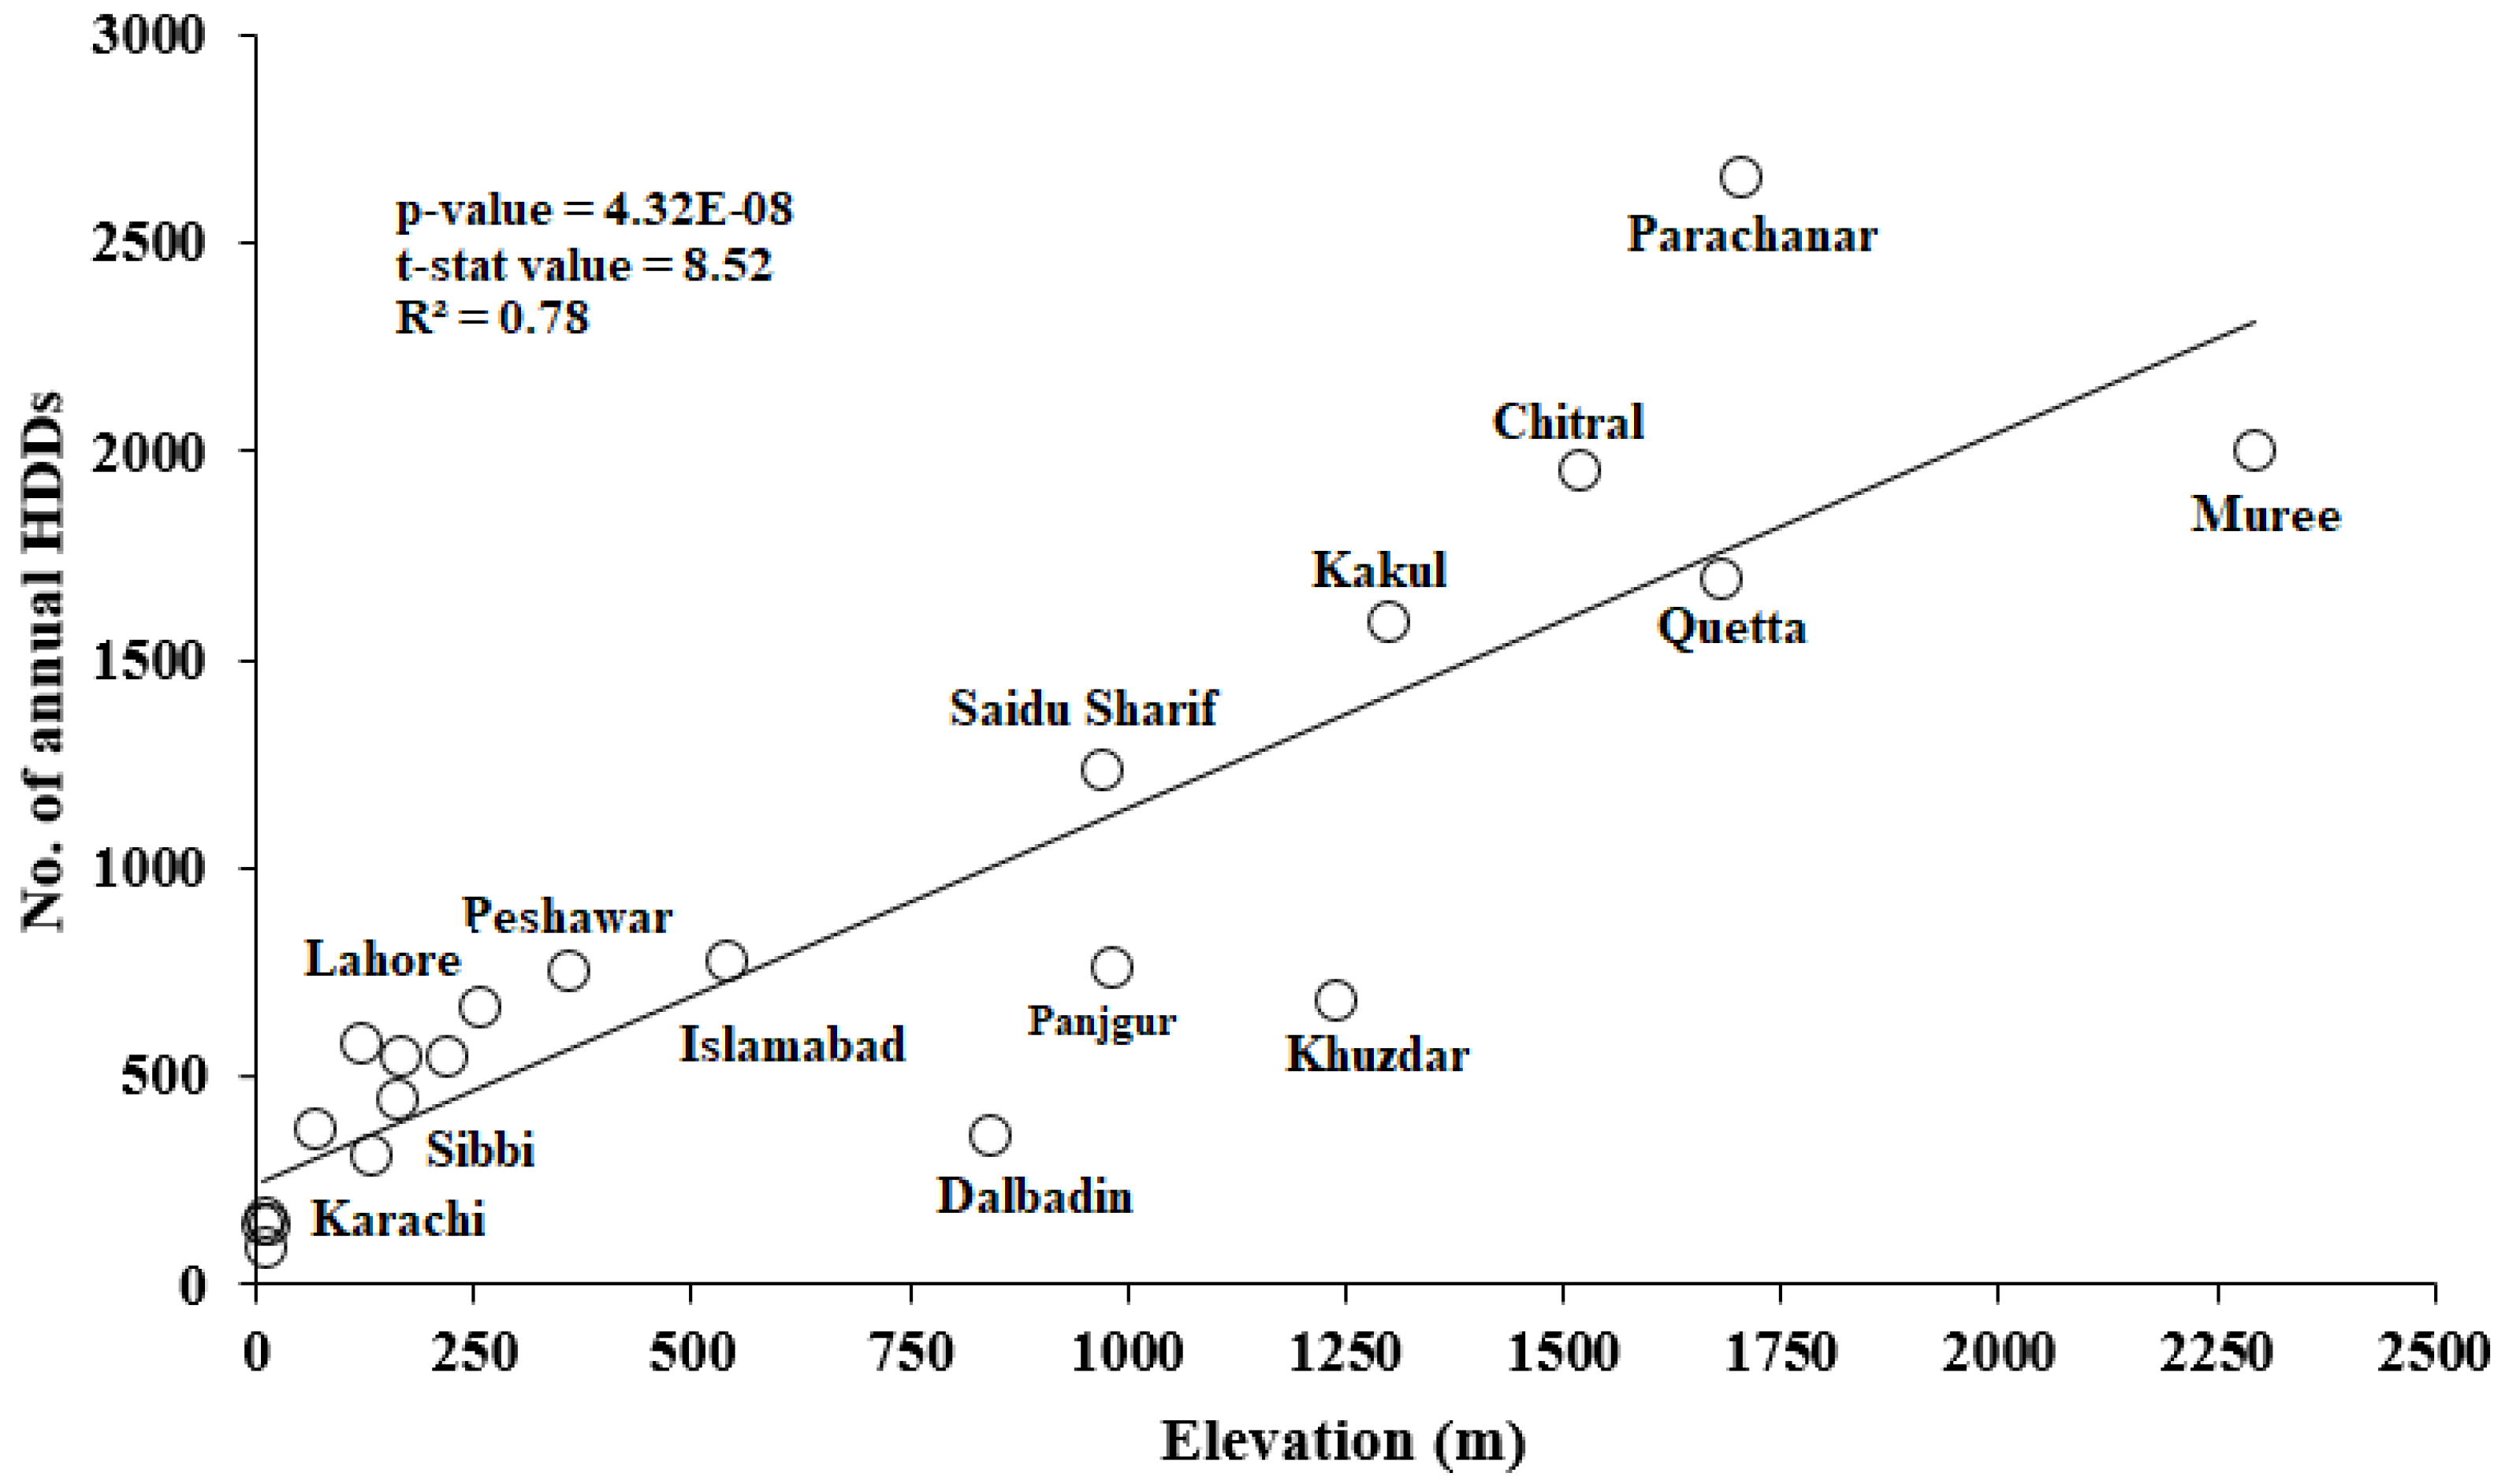
Figure 3 shows the relationship between elevation and the number of HDDs for different cities for a base temperature of 18 °C. Linear regression shows that elevation and number of HDDs have a linear positive relationship with
p-value < 0.05, t-stat value > 1.96 and R
2 = 0.78. It is apparent that HDDs increase with the increase in elevation and are highest for the Parachinar with Murree, Chitral and Quetta and Kakul having the higher number of HDDs after Parachinar. It could be seen that the capital city of Pakistan “Islamabad” has a moderate number of HDDs, i.e., 70% less than Parachinar. Cities near the coast line such as Karachi, Sibi and Sukkur have the least number of HDDs, i.e., <500 per year. This means a building in Parachinar will have seven times more heating cost if the same building was in Islamabad and approximately nine times more than the same building in Karachi. Base temperature is another important parameter which can affect the number of HDDs.
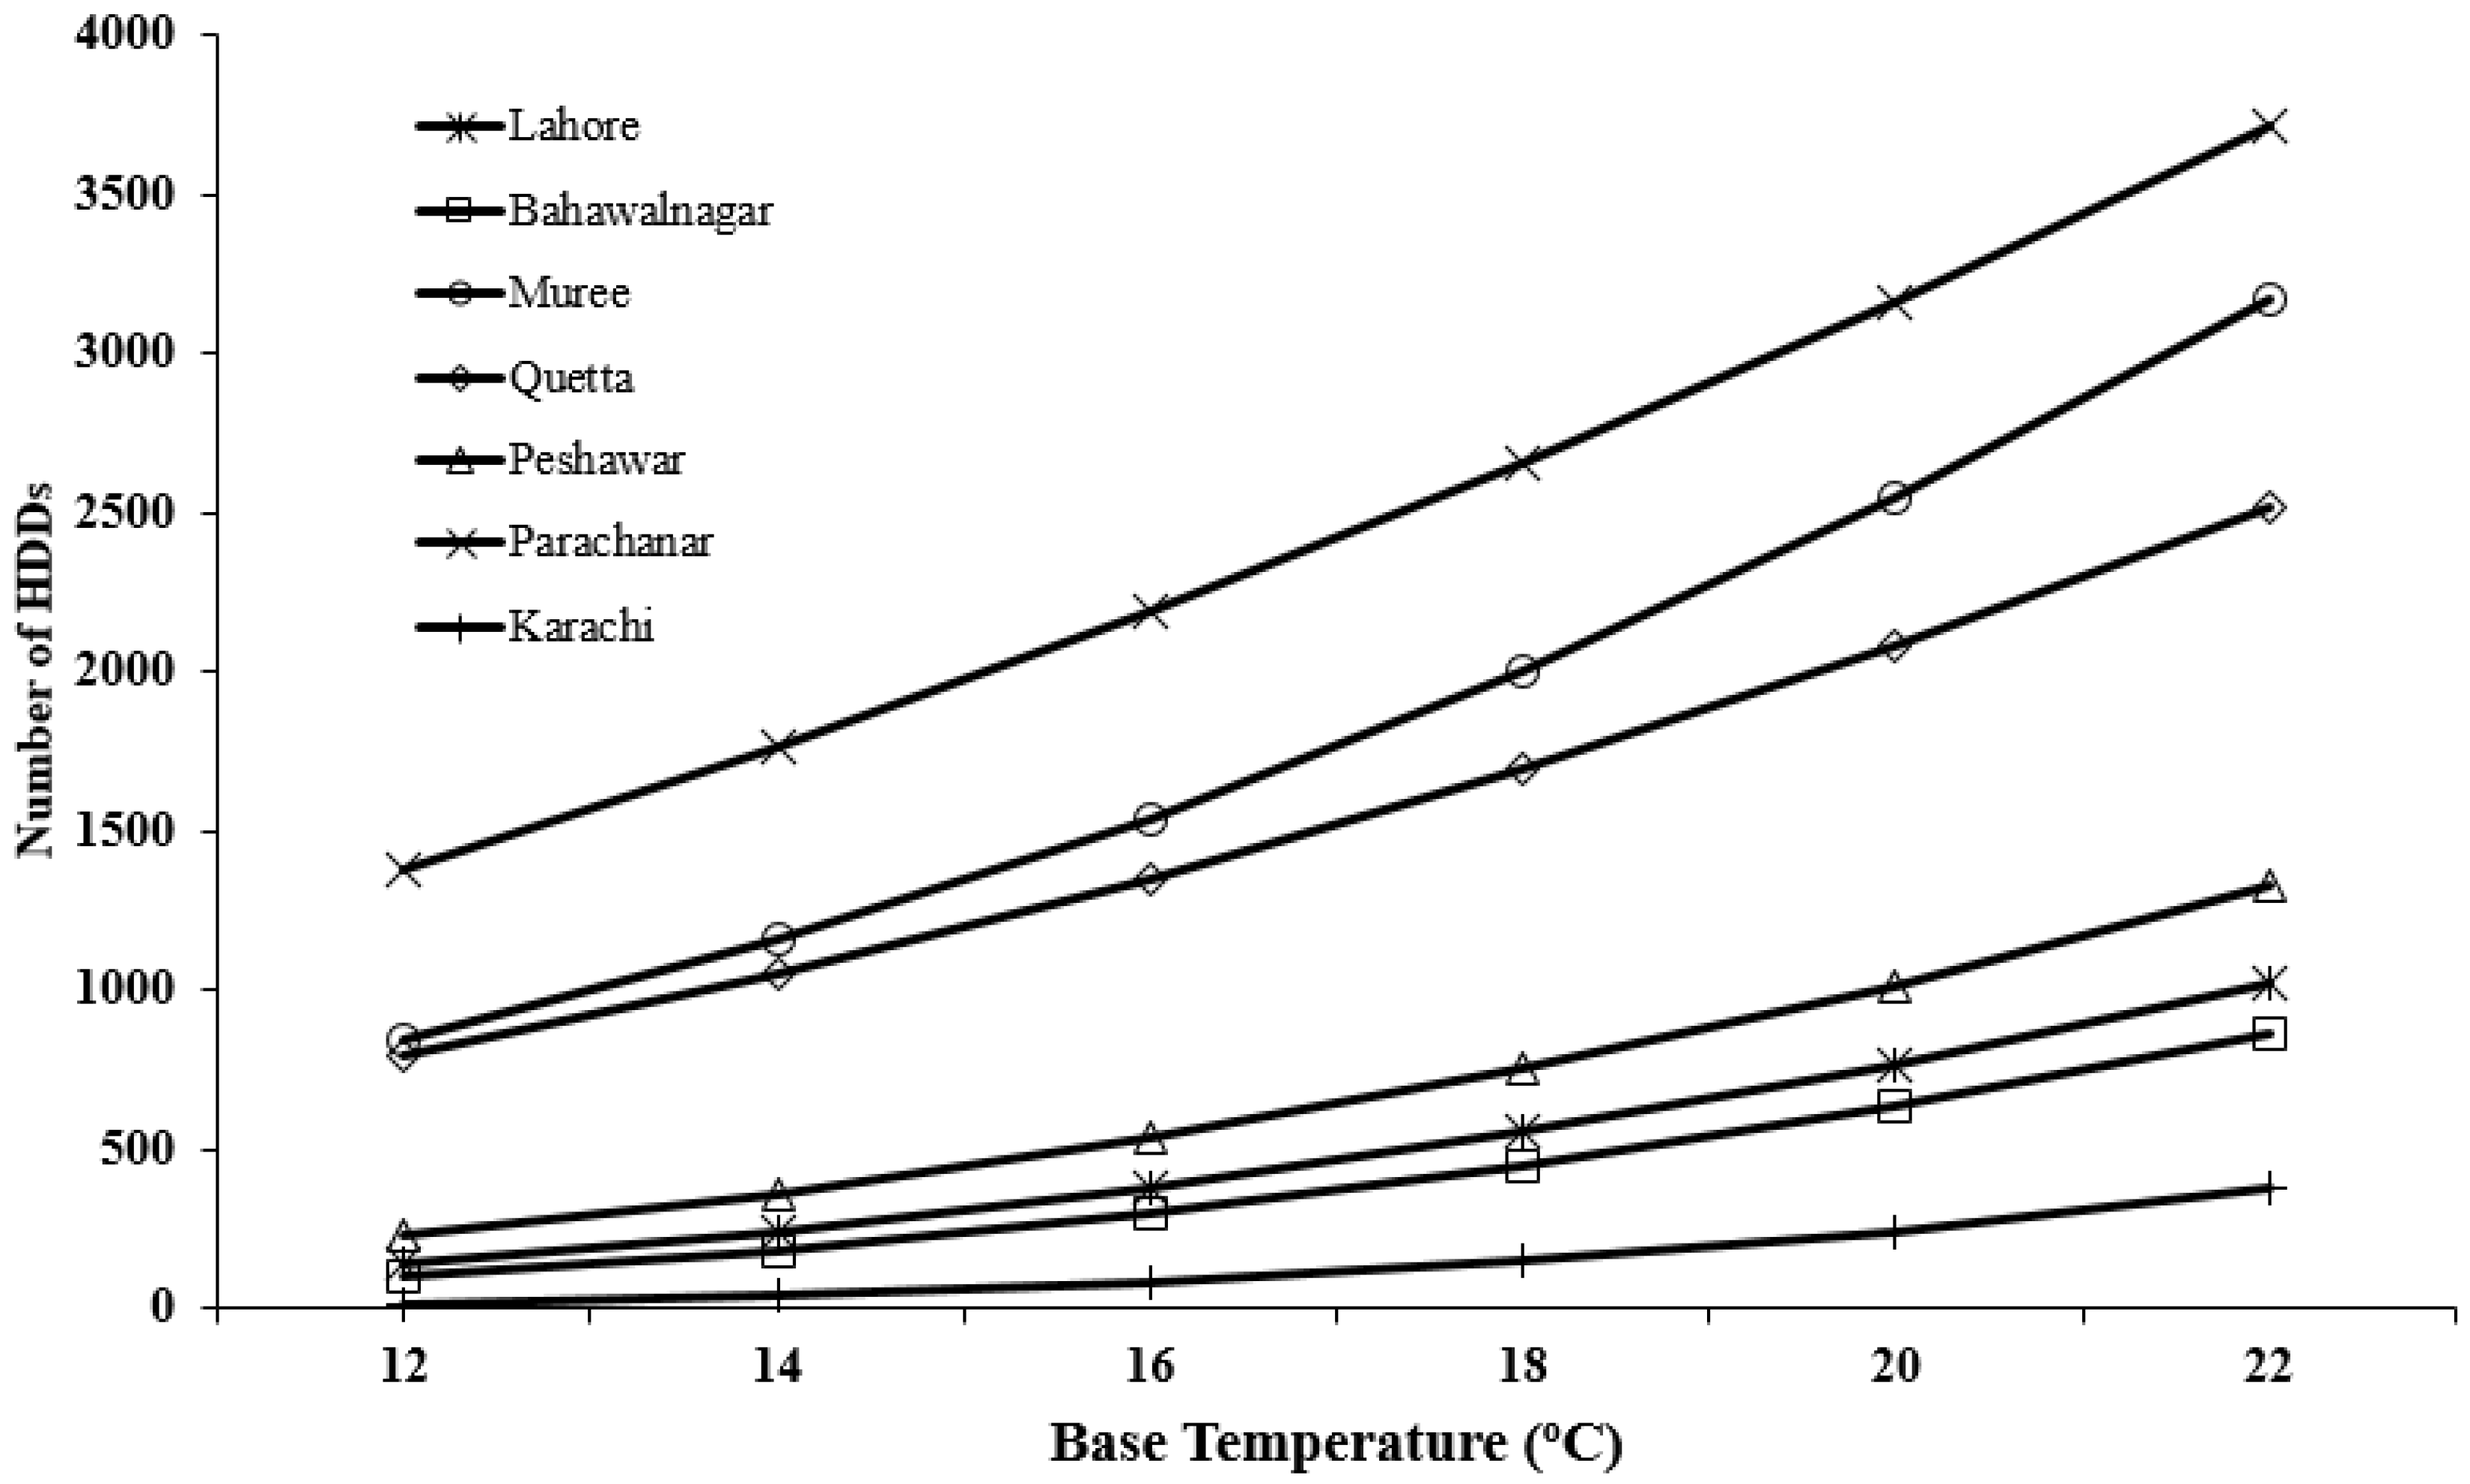
Figure 4 shows the variation of HDDs for major cities of Pakistan at different base temperatures ranging from 12 °C to 22 °C. It is apparent that the number of HDDs increase with an increase in the base temperature. This means, the higher the set point for the heating plant is, higher will be the running hours of the boiler plant and higher will be the fuel consumption. A building with a set point of 18 °C in Peshawar will have 72% less heating demand than the same building if it was in Parachinar.
4.2. Calculation of Cooling Degree-Days
Same methodology has been employed in the calculation of CDDs. Real values of cooling degree-day numbers of 22 different cities are measured using daily average ambient temperatures. Daily, monthly and yearly and yearly average heating degree-day numbers for each city have been calculated using (Equations (5)–(8)) equations:
In the equations, Ta (°C) is the daily mean ambient temperature, Tb (°C) is base point temperature, and CDD is cooling degree-days number. The positive sign in Equation (5) shows that only the positive values of temperature difference (Ta − Tb) should be considered. If this temperature difference is negative, it should be considered as zero.
Calculated annual CDDs for 22 cities for six different base temperatures (i.e., 18 °C, 20 °C, 22 °C, 24 °C, 26 °C and 28 °C) are presented in
Table 3.
From
Table 3, it is apparent that with the increasing base temperature, the numbers of CDDs drop. This means a building having a set point of 26 °C as base temperature for its A/C operation will have less electricity bills compared to a same sized building operating at a lower base temperature as its set point. It is further clear from this table that cities located in the northern regions of Pakistan have a lower number of CDDs whereas cities located in the South closer to the coast line of the Arabian sea such as Badin, Sukkur, Sibi, Karachi and Hyderabad have the highest number of CDDs. It is evident that a building located at Sibi will have 8 times higher cooling energy bills if the same building was in Parachinar.
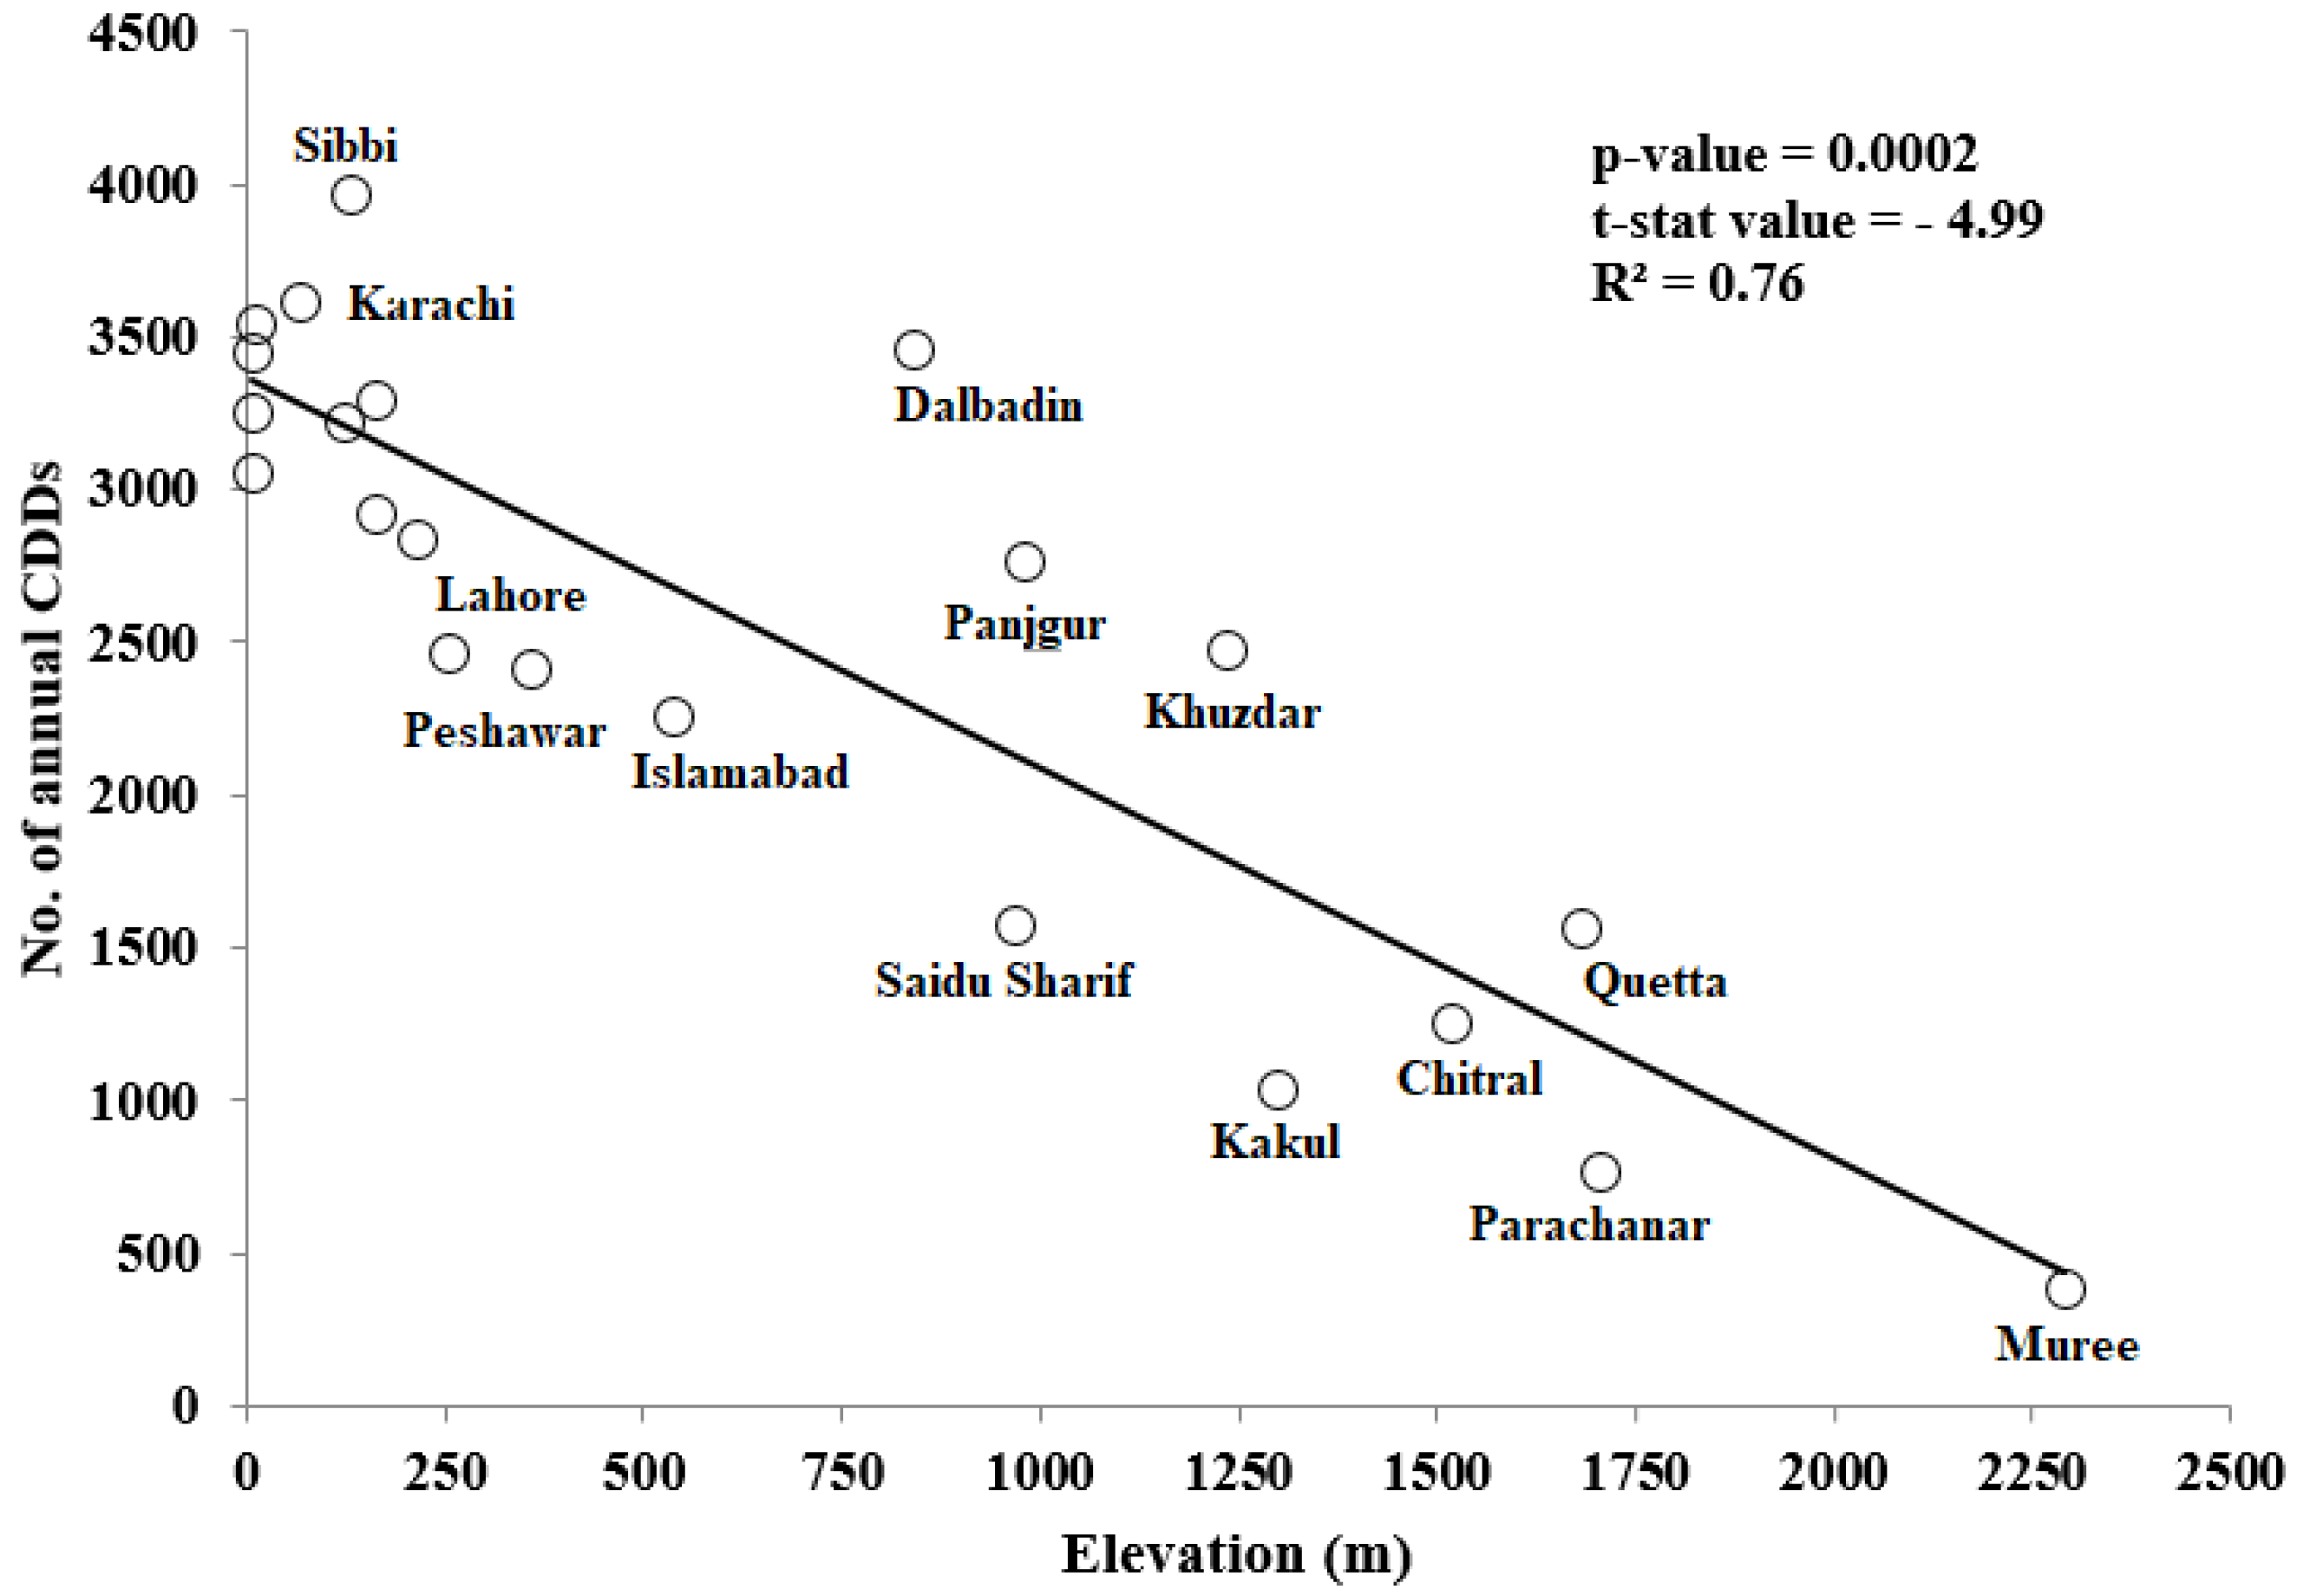
Figure 5 shows the variation of yearly CDDs with respect to the elevation of cities. A strong negative linear relationship (
p-value = 0.0002, t-stat = −4.99 and R
2 = 0.76) is obvious between the CDDs and the elevation suggesting that with the increasing elevation, CDDs decrease. Cities which are located at high elevations such as Murree, Parachinar, and Quetta have the lowest number of CDDs compared to the cities which are located at low elevation such as Sukkur, Sibi, and Karachi.
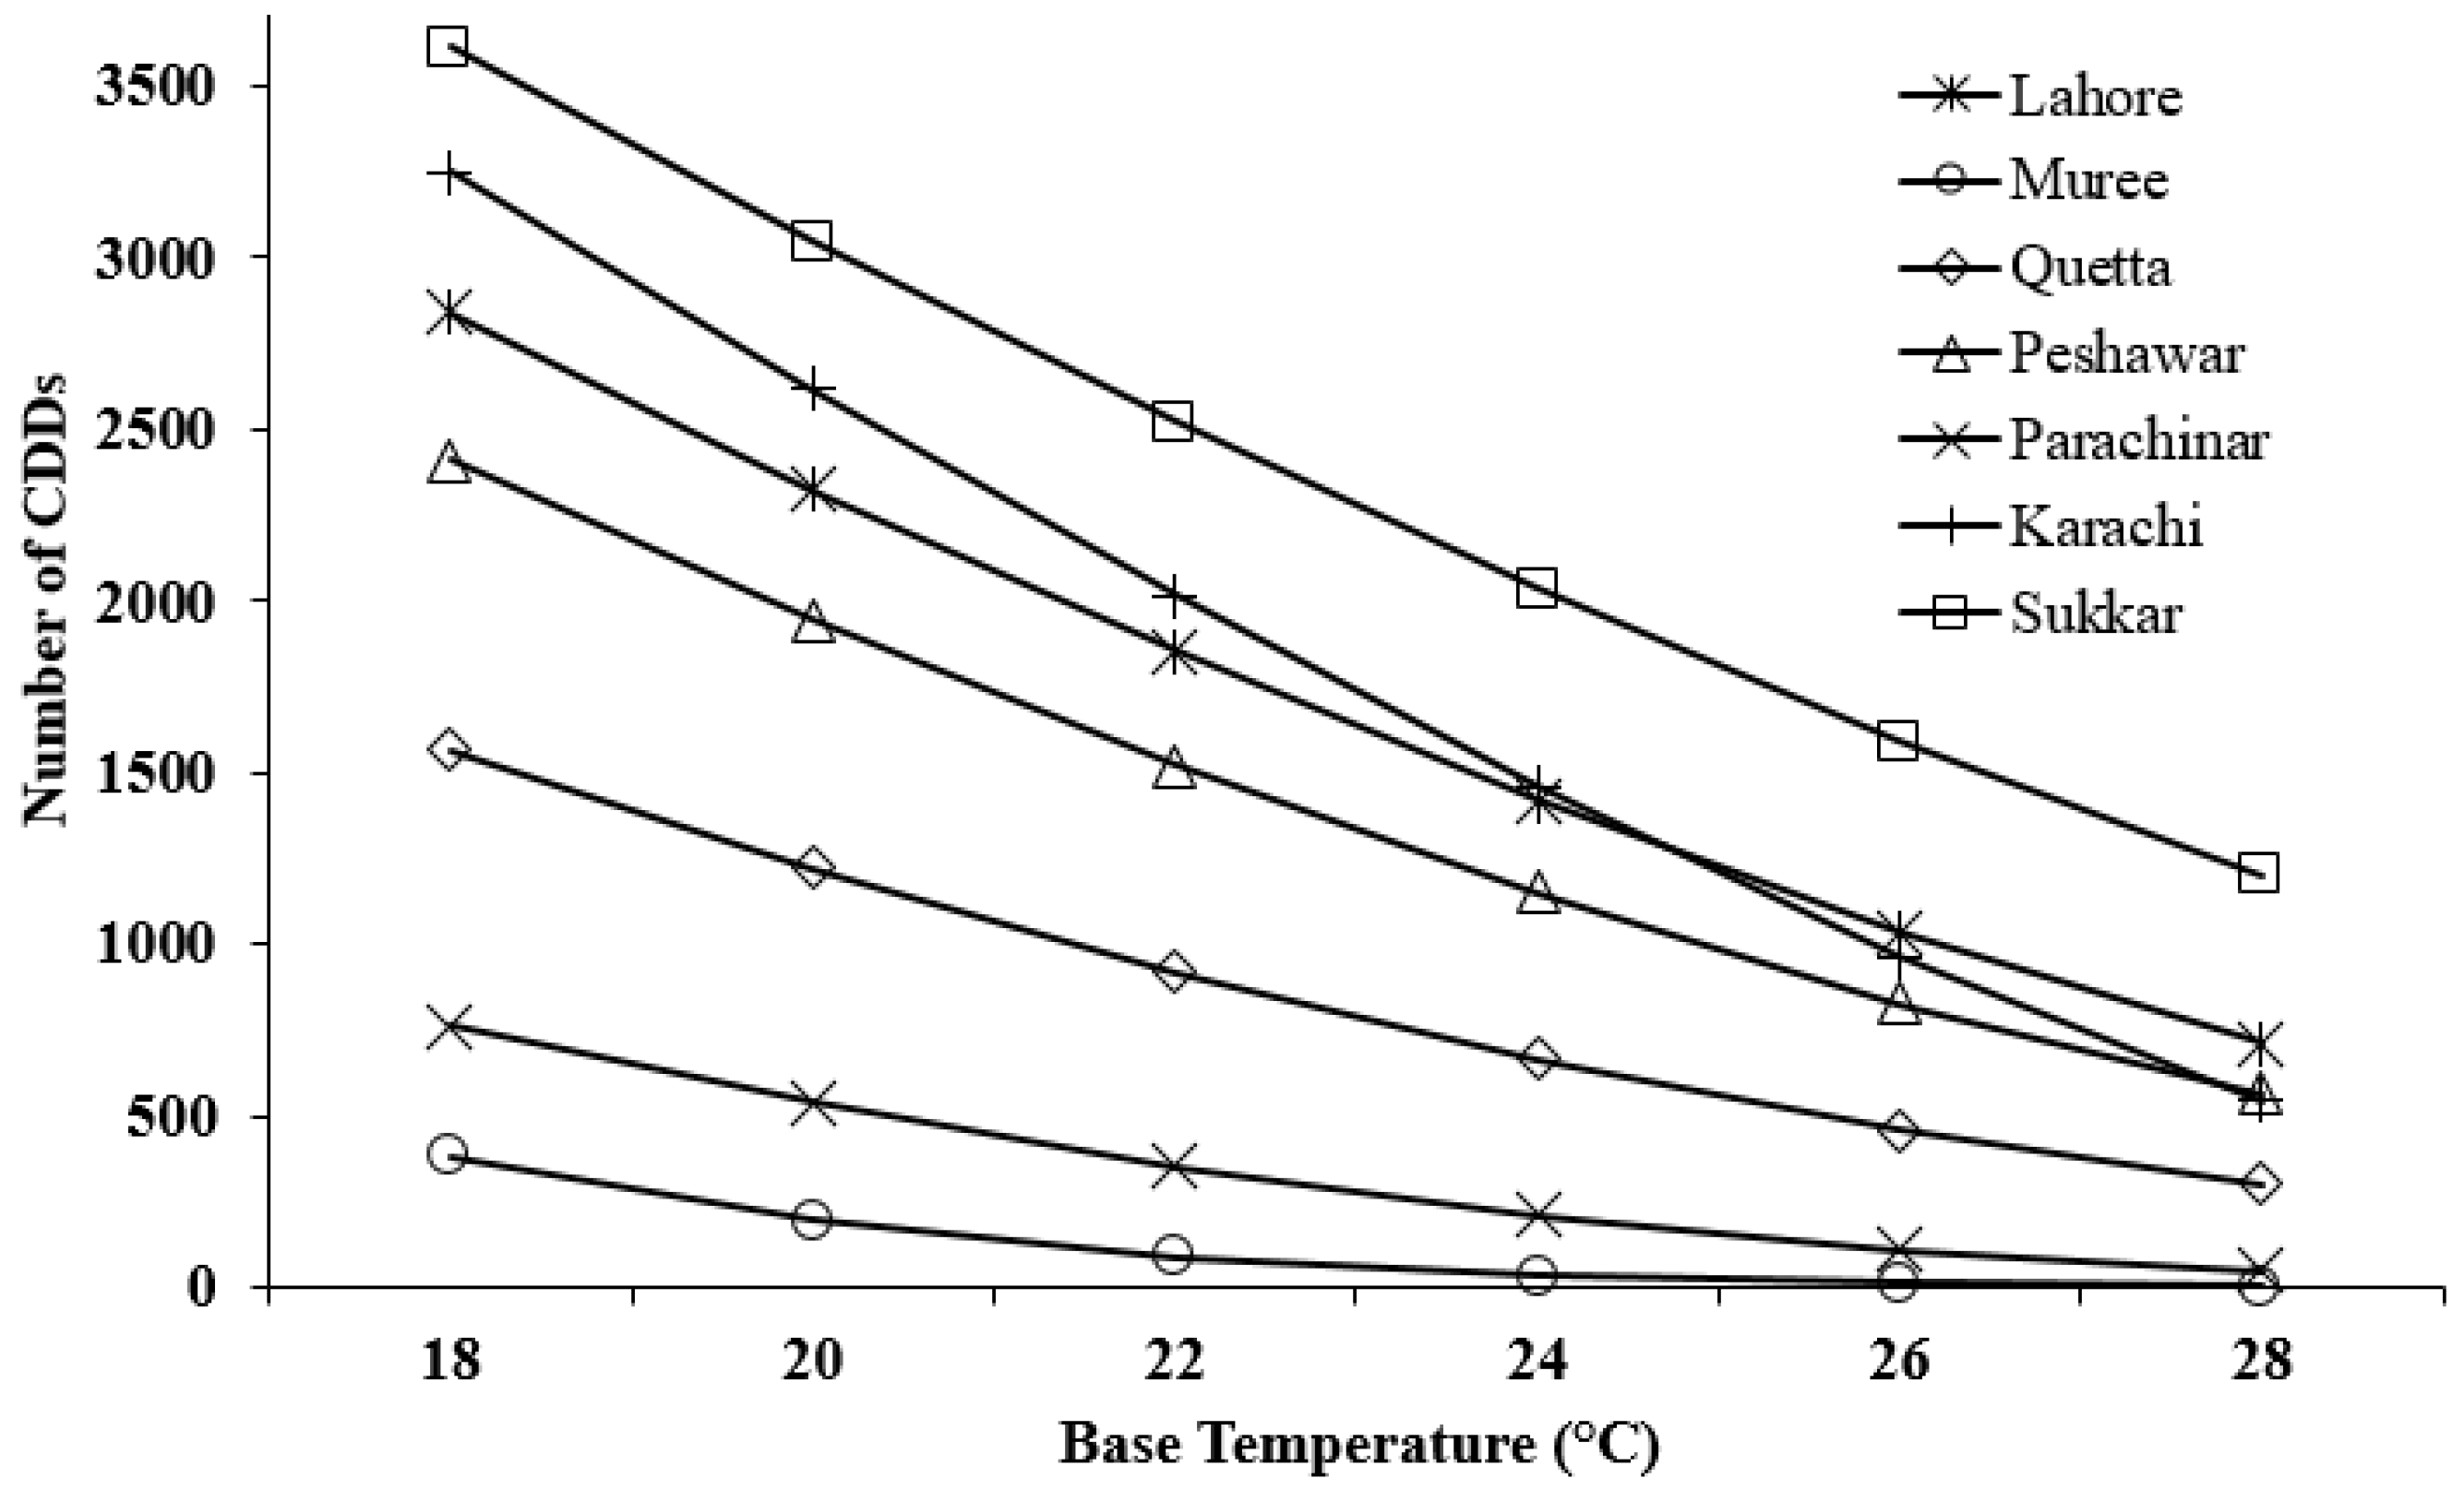
Figure 6 shows the variation of CDDs for major cities of Pakistan at different base temperatures ranging from 18 °C to 28 °C. It is apparent that the number of CDDs decrease with an increase in the base temperature. This means, the lower the set point for cooling plant is, the higher will be its running hours and the higher will be the electricity bill.
5. Results and Discussion
Annual mean HDDs and CDDs of 22 cities in Pakistan located in the different regions have been calculated using Equations (1) to (8) by using the daily mean temperature data of each city obtained from the Metrological office of Pakistan as listed in
Table 1. Annual HDDs of 22 cities have been calculated for six different base temperatures, i.e., 12 °C, 14 °C, 16 °C, 18 °C, 20 °C and 22 °C. Measured values indicated that the elevation of the cities have a significant effect on the number of HDDs. Cities at higher elevation and higher latitudes have higher numbers of HDDs and vice versa, e.g., the highest numbers of HDDs at a base temperature of 18 °C were observed in Parachinar (2656), Murree (2001), Chitral (1952) and Kakul (1590) whereas cities on the southern end near the coastline experience lowest HDDs, e.g., Pasni (90) and Karachi (146). This means that heating energy consumption (natural gas consumption) will be 29 times more in Parachinar compared to Pasni for a same building operating under the same conditions. HDDs values in the cities of the northern and central regions of Pakistan are higher than the cities located on the southern end near the coastline. This clearly suggests that cities at higher altitudes have a higher number of HDDs and thus higher heating energy demands and vice versa.
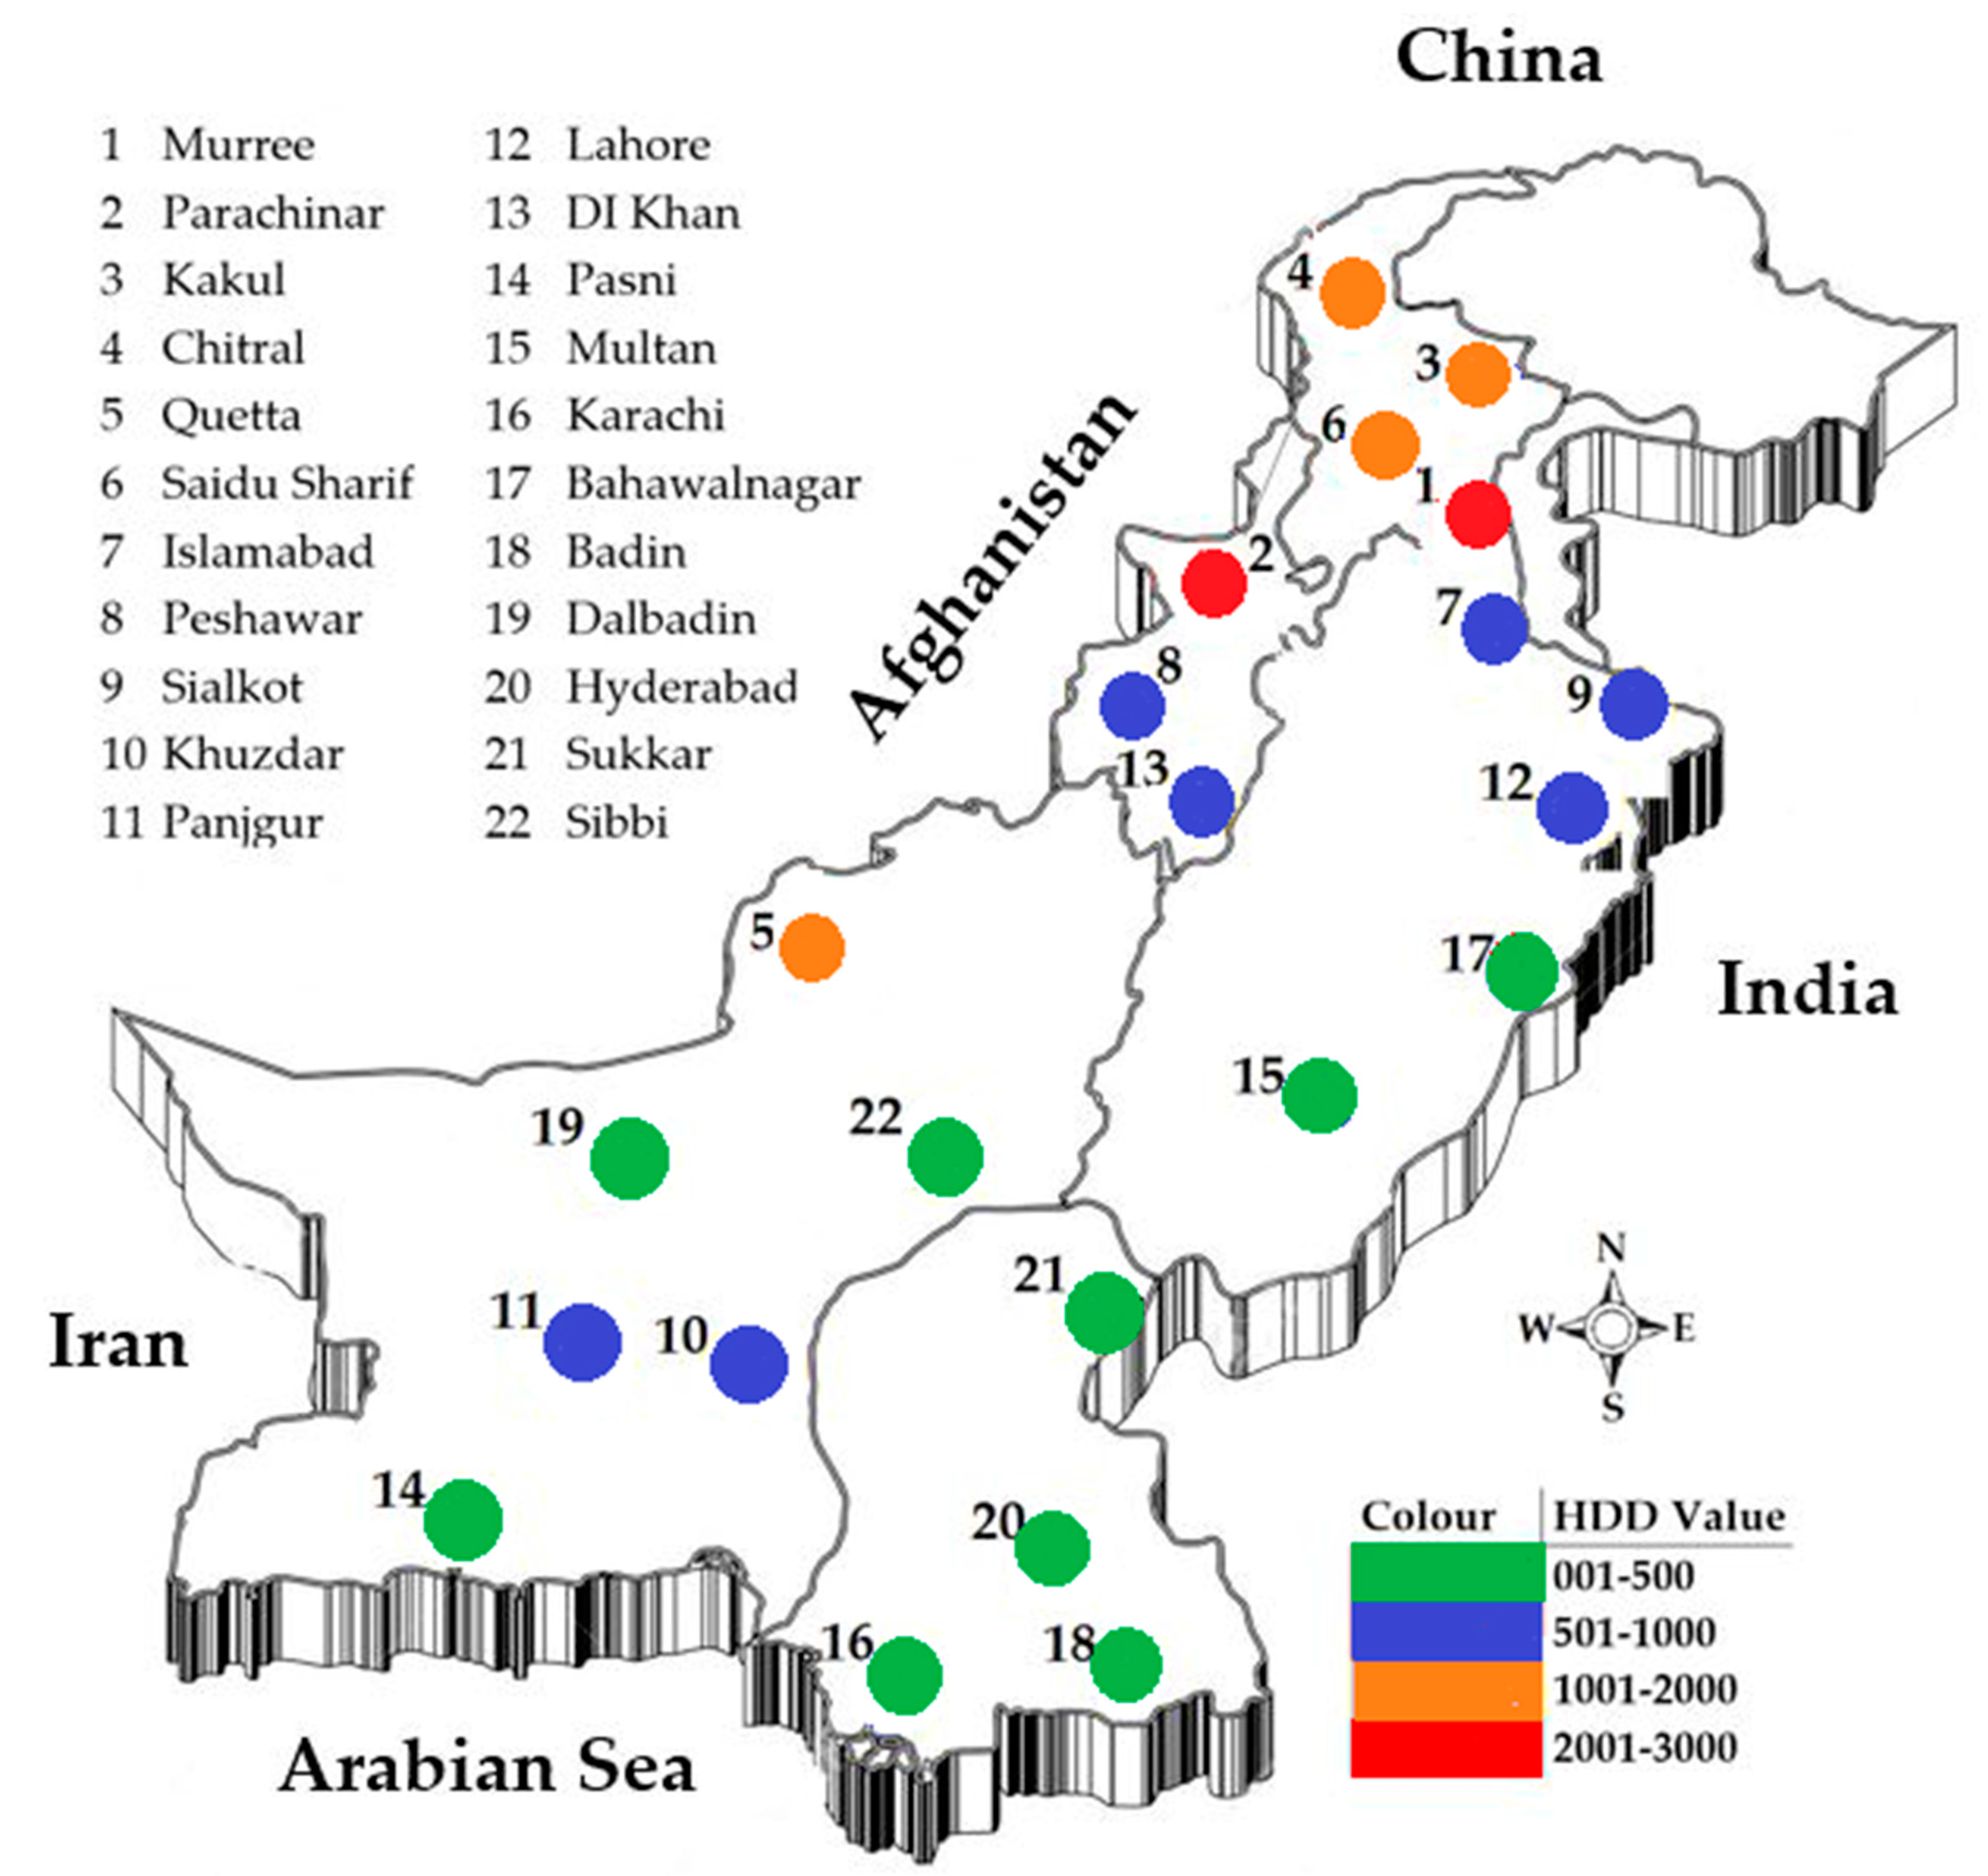
Figure 7 shows the HDDs map of Pakistan. This HDDs map of Pakistan should be helpful for policy makers to identify the major heating regions and international investors as it could help in making decisions for bringing gas pipelines from the neighboring countries, e.g., this HDDs map of Pakistan is suggesting that Pakistan’s northern region has higher heating demands. As Pakistan is currently negotiating with Iran for a gas pipe line, it may also look to Tajikistan for gas supply through Afghanistan as Tajikistan is relatively closer to these regions than Iran. This will certainly have a significant impact on the capital and operational costs of the project.
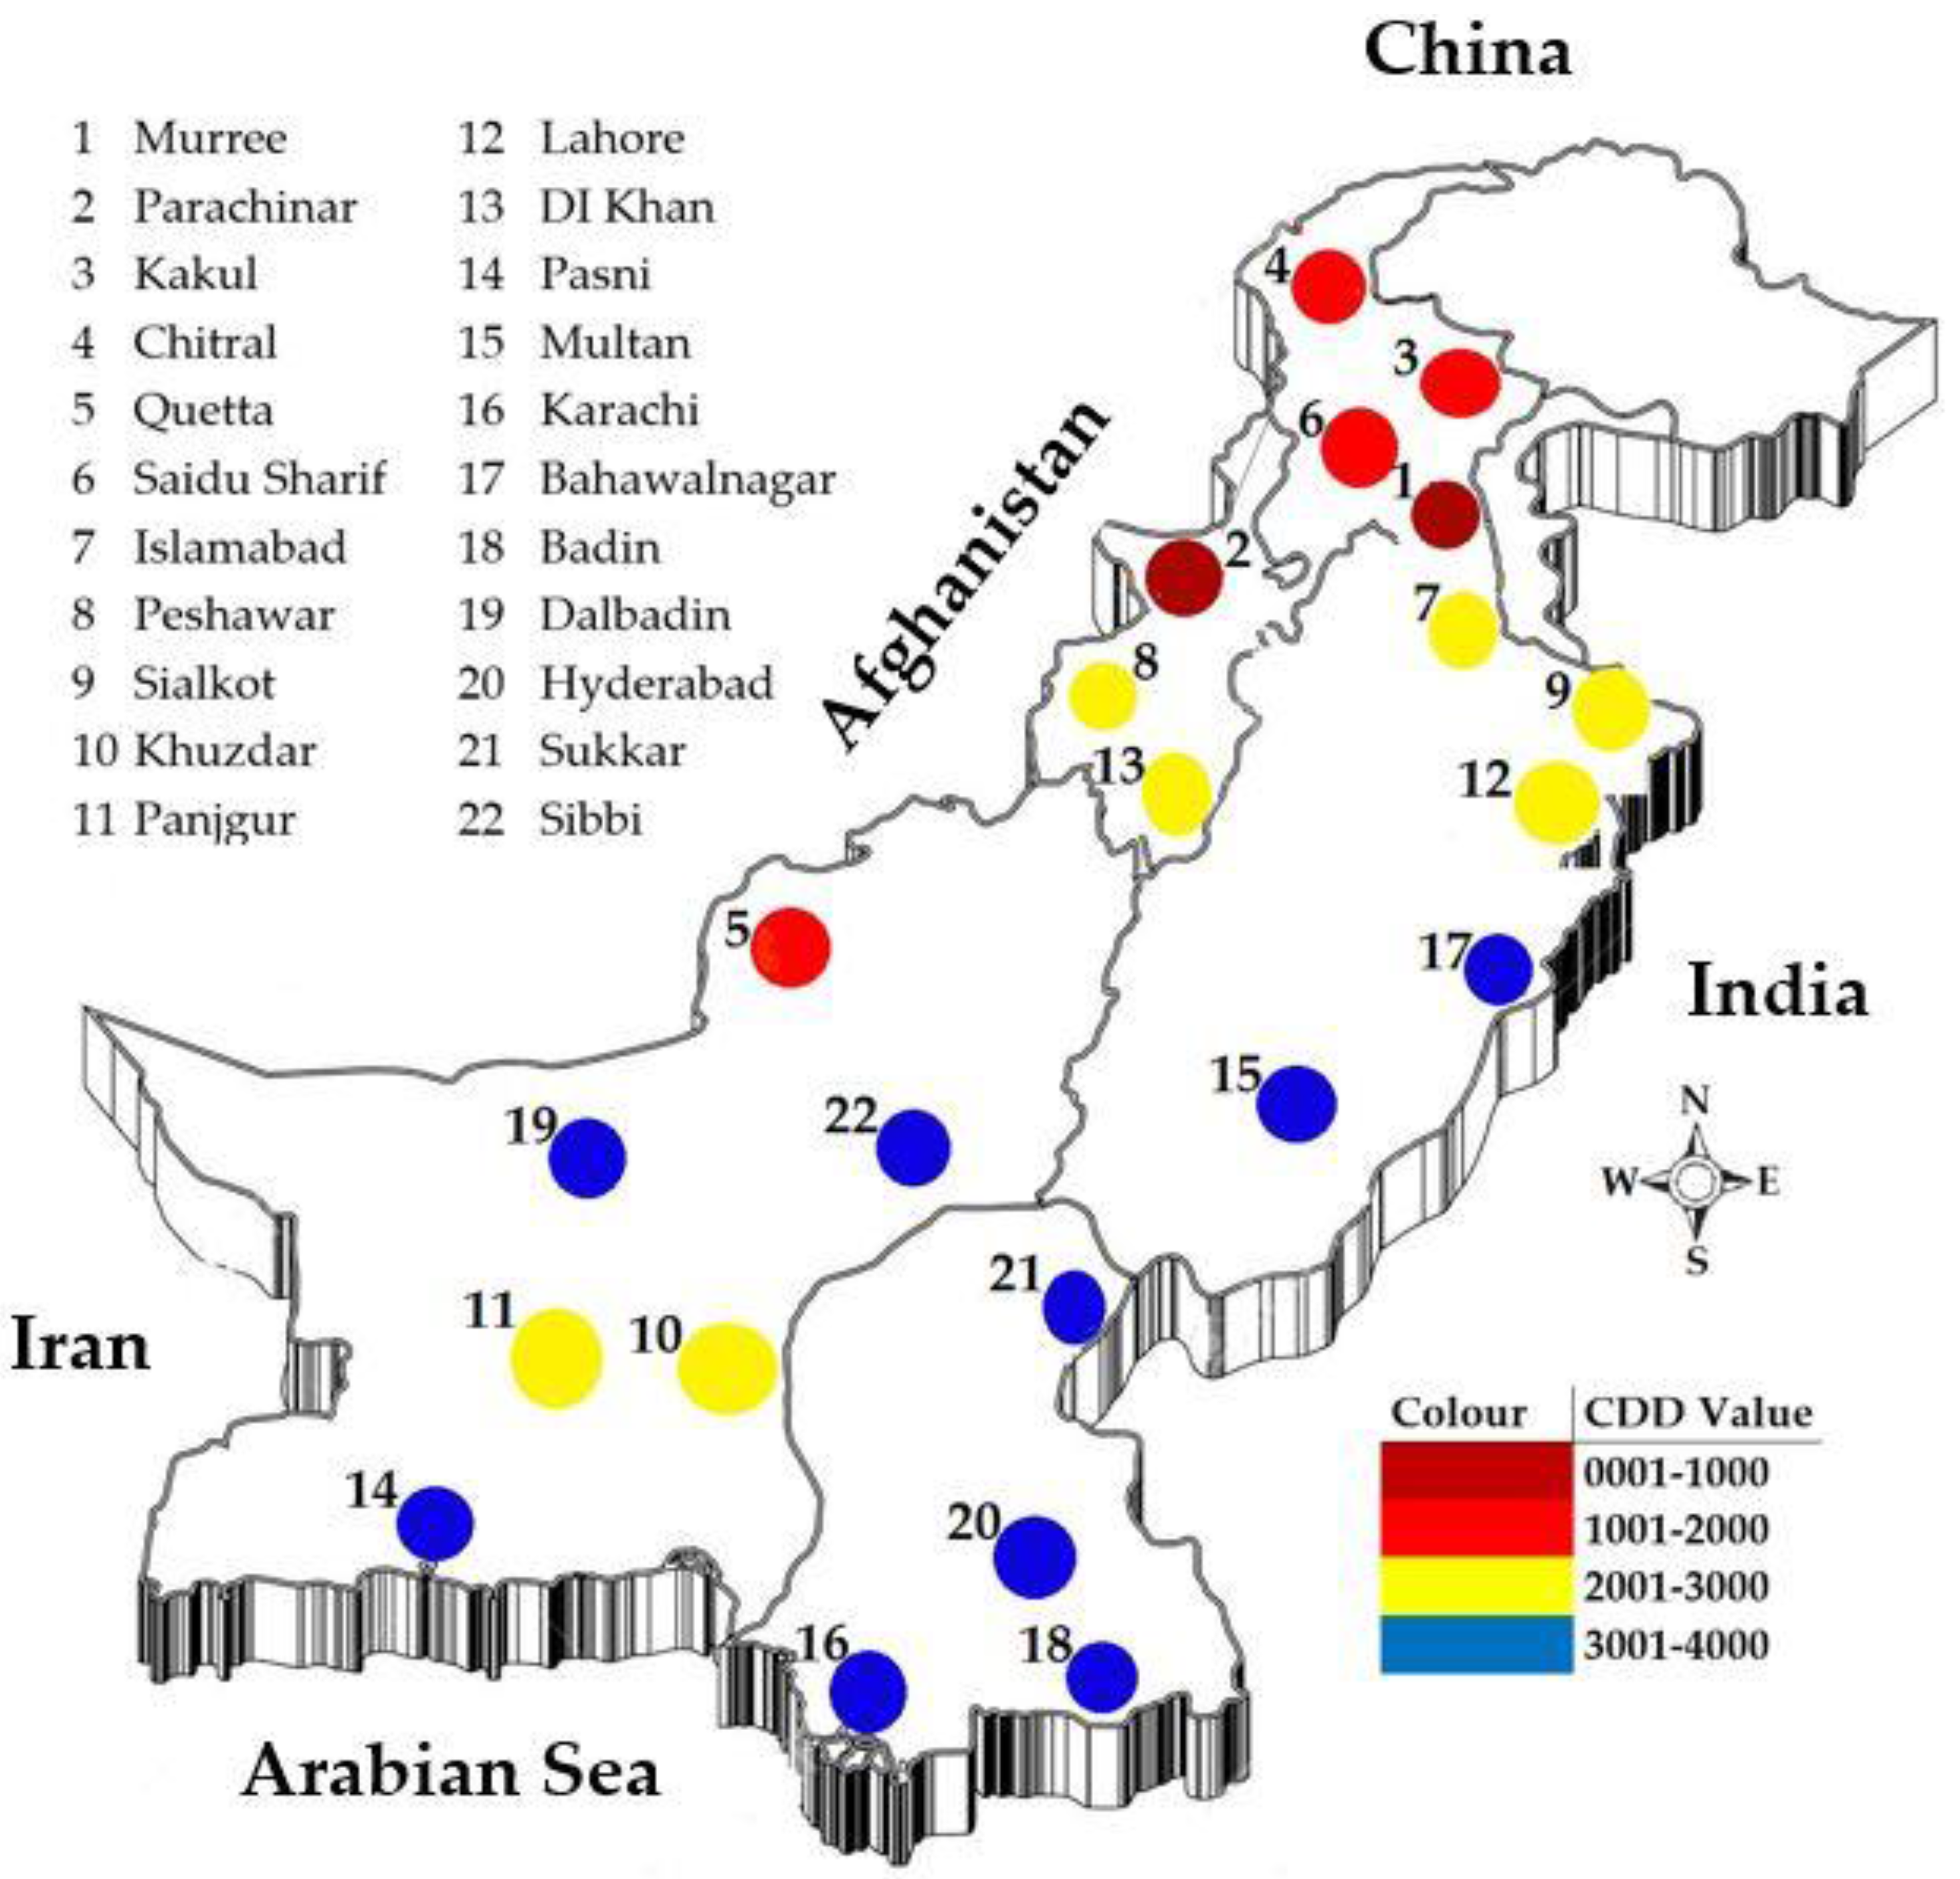
Using the same methodology as for HDDs, CDDs were calculated for the same 22 cities for six different base temperatures, 18 °C, 20 °C, 22 °C, 24 °C, 26 °C and 28 °C. It was observed that cities located in the central and northern end of Pakistan experience lower CDDs whereas cities located on the southern end have a higher number of CDDs. For example, Parachinar has 760 CDDs compared to Sukkur which has the highest number of CDDs among these 22 cities, i.e., 3615 at a same base temperature of 18 °C. This means the cooling energy consumption in Sukkur will be nine times higher in a same building located in Parachinar. CDDs are lower for the cities located at higher altitudes such as Parachinar, Quetta and Murree and vice versa. At higher base temperatures, the CDDs drop linearly showing lower energy demand for cooling purpose.
Figure 8 shows a CDDs map of Pakistan which has been developed based on the calculated CDDs at a base temperature of 18 °C.
Variation in HDDs and CDDs at different base temperature suggests that the set point for the heating/cooling plant should be selected very carefully in order to optimize the operation of the HVAC plant. Usually, by applying energy efficiency measures in the building such as better insulation, optimum values of base temperature could be set. This way the operation and cost of HVAC could be optimized and controlled. After analyzing the data, a set point of 20 °C for heating season and 24 °C for cooling season is recommended for Pakistan. These set points are within the range that is acceptable to 80 percent of the building occupants per ASHRAE Standard 55, Thermal Environmental Conditions for Human Occupancy [
31].
6. Conclusions
Buildings in Pakistan consume about 55% of Pakistan’s annual energy of which a higher proportion is consumed for meeting the heating and cooling demands. Degree days (DD) represent a versatile climatic indicator which is commonly used in the analysis of building energy performance and helps policy makers in analyzing and forecasting energy consumption of different climatic regions. In this study, annual HDDs and CDDs of 22 different cities representing different regions of Pakistan have been established at various base temperatures using the most updated daily mean temperature data for a period of 30 years (i.e., 1985–2015) collected from the metrological department of Pakistan. Cities located at higher altitude such as Quetta, Murree and Parachinar have higher HDDs and lower CDDs whereas cities located in the central and southern end of Pakistan such as Islamabad, Sukkur, and Karachi experience lower HDDs and higher CDDs. Selecting an optimum base temperature for the heating and cooling plants is crucial in order to optimize the performance of HVAC plants and to control HVAC related costs in buildings. Using ASHRAE standards and the collected data, set points of 20 °C and 24 °C are recommended for winter season and summer seasons respectively for Pakistan’s building sector. It is anticipated that this study would directly help the policy makers in the development of energy consumption policies for the buildings sector. Further, this study is valuable for the international investors, building designers, building owners and building managers as it provides a foundation for analyzing and forecasting the performance of buildings based on the data presented in this study.


 ,
, 


