Article

A New Method for Simultaneous Determination of the TDC Offset and the Pressure Offset in Fired Cylinders of an Internal Combustion Engine

Faculty of Mechanical Engineering, University of Ljubljana, Aškerčeva 6, SI-1000 Ljubljana, Slovenia
*
Author to whom correspondence should be addressed.
Energies 2017, 10(1), 143; https://doi.org/10.3390/en10010143
Submission received: 13 December 2016 / Revised: 16 January 2017 / Accepted: 16 January 2017 / Published: 23 January 2017

Abstract

:
An innovative computationally efficient method for the simultaneous determination of top dead centre (TDC) offset and pressure offset is presented. It is based on characteristic deviations of the rate of heat release (ROHR) that are specific for both offsets in compression phase and expansion phase after the end of combustion. These characteristic deviations of the ROHR are derived from first principles and they were also confirmed through manual shifts of the pressure trace. The ROHR is calculated based on the first law of thermodynamics using an in-cylinder pressure trace, engine geometrical parameters and operating point specific parameters. The method can be applied in off-line analyses using an averaged pressure trace or in on-line analyses using a single pressure trace. In both application areas the method simultaneously determines the TDC position and the pressure offset within a single processing of the pressure trace, whereas a second refinement step can be performed for obtaining more accurate results as correction factors are determined more accurately using nearly converged input data. Innovative analytic basis of the method allows for significant reduction of the computational times compared to the existing methods for the simultaneous determination of TDC offset and pressure offset in fired conditions. The method was validated on a heavy-duty and a light-duty diesel engine.

1. Introduction

Reduction of exhaust emissions and simultaneous maintenance or even increasing of engine efficiency and specific power is a major challenge for engine manufacturers. In addition to the well-established emission measurement procedures, in 2017 EU plans to introduce real driving emission tests to tackle the well-known issue of laboratory tests not accurately reflecting the amount of emissions emitted during real driving conditions [1]. Moreover, real driving emission tests will apply also to the vehicles in service [2]. To comply with these requirements, manufacturers are focusing on controlling combustion process with various strategies, which need to be sufficiently robust also for vehicles in service featuring components that are subjected to wear and ageing.
One of the very promising strategies to approach the optima with respect to exhaust emissions and engine efficiency is the closed-loop combustion control (CLCC) using in-cylinder pressure sensors. CLCC thus adapts injection strategies according to the actual in-cylinder pressure trace and parameters that are derived thereof while considering also parameters from other engine sensors.
In-cylinder pressure is measured with high-frequency pressure transducers, which are often based on the piezoelectric technology. These sensors offer short response times but they do not deliver the absolute pressure readings. Therefore, a referencing procedure called pegging, which was an object of research in many studies [3,4,5,6,7,8,9,10,11], needs to be applied. Generally, methods can be divided into two groups. The first group depends on additional sensors and consists of methods that reference measured pressure signal to the pressure measured in the intake [3,4,7,11,12] or the exhaust manifold [8,11] during the intake or the exhaust process. The second group consists of methods that determine pressure offset with numerical algorithms from data gathered during the high-pressure phase of the engine cycle [3,5,9,10,11,13]. Among them, two point referencing method and least-squares method achieve accuracy of about ±0.25 bar as reported in [3]. Three point referencing method, linear least-squares method with 15 referencing points and non-linear least-squares method with 15 referencing points achieve accuracy of about ±0.15 bar as reported in [5], whereas three point referencing method with five-points averaging achieves accuracy of about ±0.1 bar [5]. Conclusion of a study [11], performed at 1750 1/min, while comparing various manifold referencing methods and polytropic referencing methods, was that manifold referencing worked best for the experimental conditions, however polytropic referencing would be superior at higher engine speeds. In a study reported in [7], where inlet manifold pressure referencing and polytropic index pressure referencing methods were compared, it was determined that agreement of approximately ±0.12 bar was achieved. Although many of the numerical methods for determining the pressure offset are based on the in-cylinder pressure of the fired engine [3,5,10,11,13], the TDC position has to be known in order to acquire accurate results.
Determination of the correct absolute angle represents a vital piece of information for calculating the volume of the combustion chamber, which is needed for evaluation of indicated work and combustion parameters. An error of 1 °CA in TDC position can cause up to 10% evaluation error for indicated mean effective pressure (IMEP) and up to 25% error for the total heat released during the combustion [14]. Methods for determining the TDC offset can be divided into two main groups. The first group represents methods supported with additional hardware, while the second one is based on the algorithms that determine the TDC position on the basis of the indicated in-cylinder pressure as a function of the crank angle position. The TDC position can be determined using a dedicated capacitive sensor that is generally inserted into the spark plug or injector hole. In both cases, the measured cylinder has to be “motored” (combustion is not present) and therefore this method cannot be used during normal engine operation. It is not feasible to equip high volume series production engines with very accurate sensors for determination of the absolute pressure and of the TDC position.
The second group consists of thermodynamic methods that are based on the indicated in-cylinder pressure. These methods can further be divided into the methods that are applicable for motored and for fired cycles. Majority of the methods are developed for the motored cycles. The simplest but also in general the least accurate method with accuracy of about ±1 °CA is setting the TDC position to the position where the indicated motored pressure reaches its peak [15]. Other numerical methods determine TDC position based on the pressure trace symmetry [15], on the polytropic exponent values [16,17], on a definition of a “loss angle” that is related to the energy and mass losses [18], on a pressure curve symmetry in combustion and expansion phases on fixed intervals [15], on the heat loss power through the combustion chamber wall [19], on the correlation between IMEP, the maximum cylinder pressure and the phase lag [20] and on the unsymmetrical characteristics of the pressure diagram [21]. These methods feature different accuracies, which are in addition to the selected method dependent also on the engine type and on the quality of the pressure signal. In general, it can be reviewed from the literature that methods based on a definition of a “loss angle” can achieve accuracy below ±0.1 °CA [18], which is similar to the methods based on the polytropic exponents [17] or heat release shaping [19], whereas method based on an unsymmetrical characteristics of the pressure diagram can achieve accuracy below 0.05 °CA [21]. In [15], it was reported that IMEP based calibration method achieved the smallest error between estimated and actual position of TDC of −0.00041 °CA. However, such a good agreement was achieved as the same engine cycle was used for calibration of model parameters and also for analysis and thus this approach is not applicable for real engine operation. In general, all methods applicable for motored cycles feature limited applicability, as they cannot be applied during fired operation of the engine. The literature offers only a few methods for determination of the TDC under fired conditions. Ref. [22] presented a method based on rate of heat release calculation, which can approach accuracy of the polytropic exponent method. It needs to be mentioned that pressure offset needs to be determined accurately to approach errors listed previously in this paragraph.
Alternatively, in [23] a methodology for determination of total compression ratio and errors of the pressure and the TDC offset was presented. The method is based on the polytropic approach and it features multiple case specific parameters. Furthermore, method features moderate accuracy of 1 °CA if the approximation interval ends earlier than 165 °CA and up to 0.05 °CA in the cases where combustion starts after TDC. This characteristic of the method is related to the fact that the method was developed for ship engines, where these limitations can be accepted, whereas in the automotive engines it is in general not possible to apply approximation intervals that allow for achieving high accuracy with the proposed method.
From the review of the existing literature, it can be summarized that despite availability of methods that are dedicated to determine either the absolute pressure or the TDC position, to the best of authors’ knowledge, accurate and generally applicable analytically based methods for simultaneous determination of the TDC and the pressure offset based on the in-cylinder pressure of fired engine are not available. Therefore, if both parameters are unknown, iterative procedures of both adaptions are generally applied using the compression phase of the pressure trace, which is common in commercial software tools. However, results of the iterative approach for determination of TDC and pressure offsets do not necessarily assure convergence to the correct values because of co-dependency of both searched parameters in the compression phase.
To address this issue, an innovative analytically based method for simultaneous determination of the pressure and the TDC offset based on the in-cylinder pressure trace of the fired engine is elaborated in this paper. The method is based on characteristic deviations of the rate of heat release (ROHR) that are specific for the TDC and the pressure offset in compression and expansion phase. For a specific TDC offset, ROHR in compression and expansion phase namely features deviation with the same sign, where the sign of ROHR deviations in compression and expansion phase changes for a specific pressure offset. These characteristic deviations of the ROHR are derived from first principles thus forming analytic basis for correcting both offsets. The method is thus computationally very efficient and allows for determination of both offsets within a single calculation, whereas a second refinement step can be done for obtaining more accurate results as correction factors are determined more accurately using nearly converged input data.
There are numerous applications where TDC position and pressure offset need to be determined simultaneously. These applications go beyond automotive segment, which will be the main focus of this paper, and cover also the segment of large engines, where on-line performance monitoring is one of the important measures to ensure proper engine operation.

2. 0D Thermodynamic Framework

2.1. ROHR Analysis

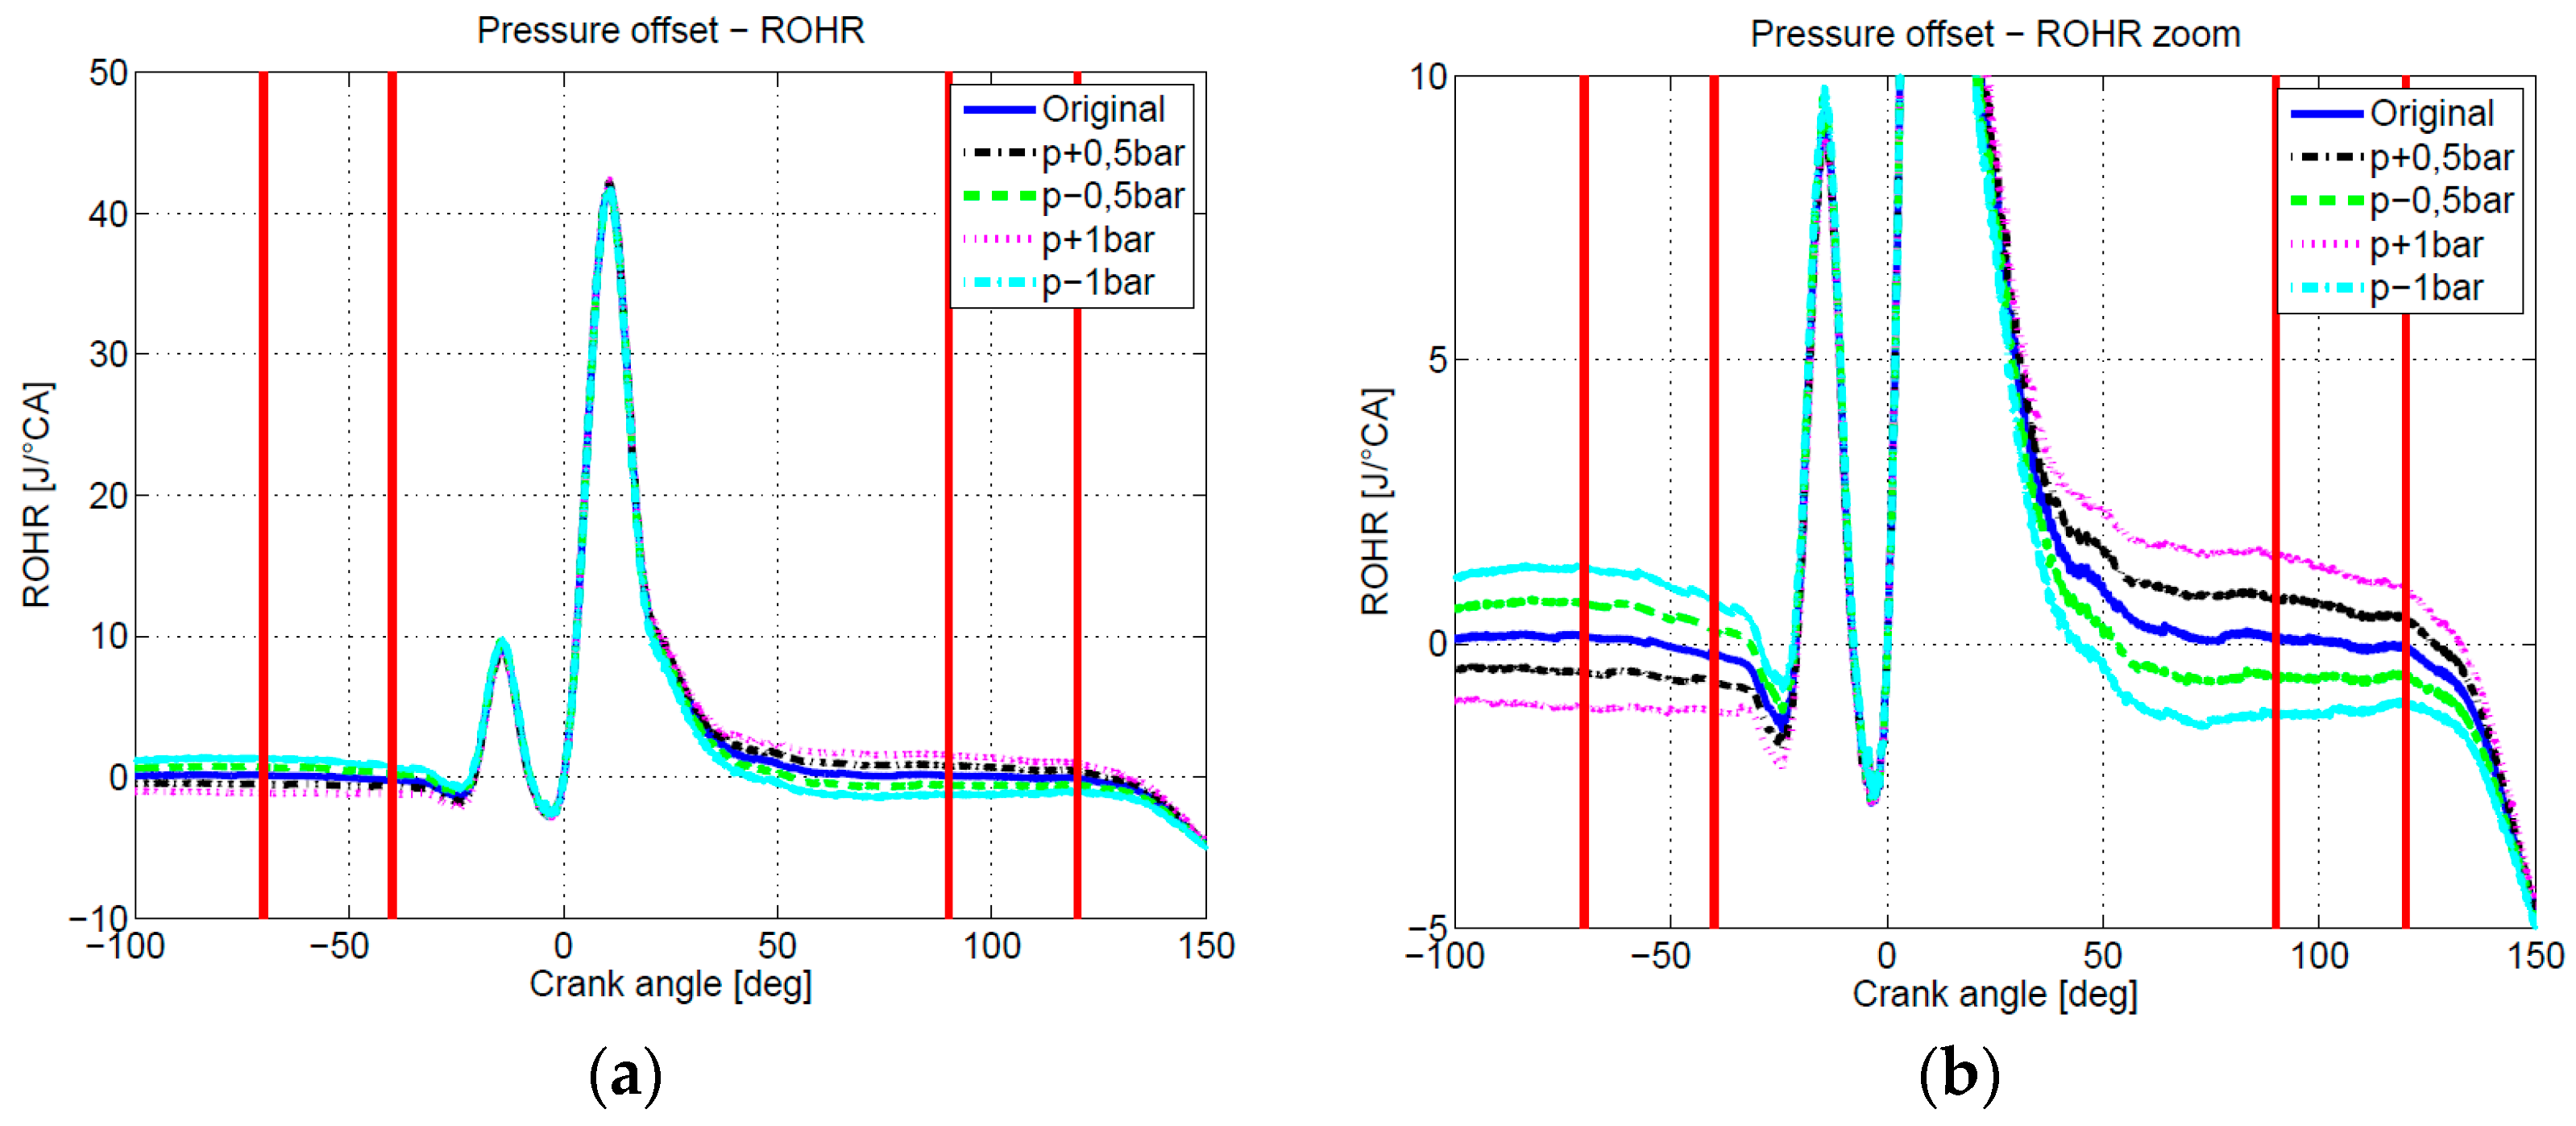
Pressure traces can be used to calculate various thermodynamic parameters, where besides indicated work, ROHR evaluated using the 0D thermodynamic framework is one of the most valuable parameters for combustion analysis. Commonly ROHR is related to the heat released during the combustion period, whereas in diesel engines negative ROHR values before the start-of-combustion indicate fuel evaporation. In an ideal case, ROHR would be zero in the entire compression and expansion phase. This would have been achieved, if the following assumptions would be fulfilled:
-
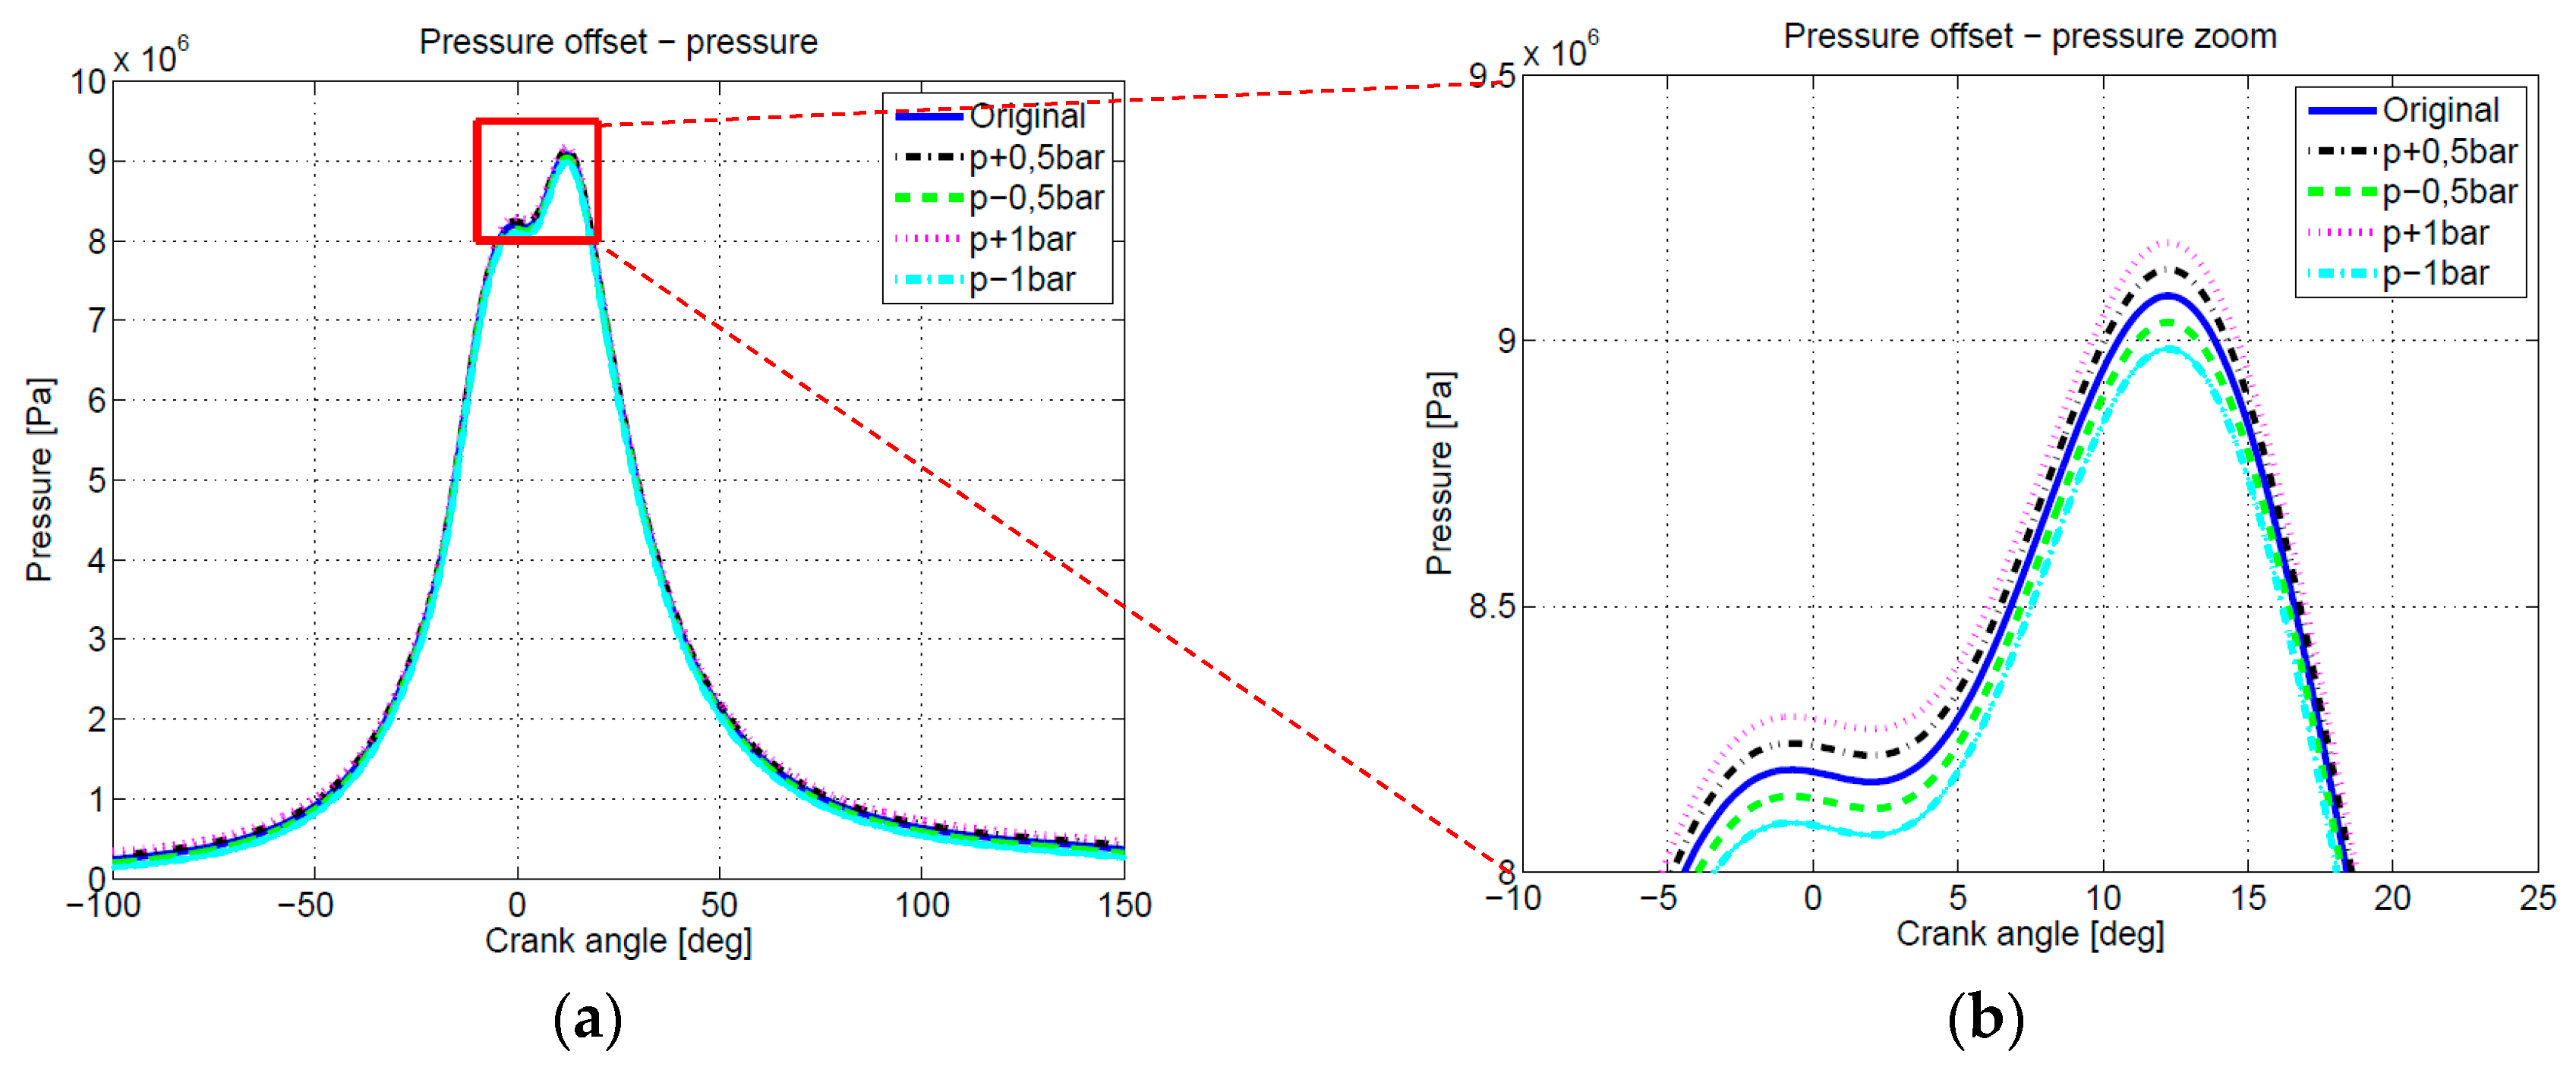
Pressure trace is measured without any errors and disturbances,
-
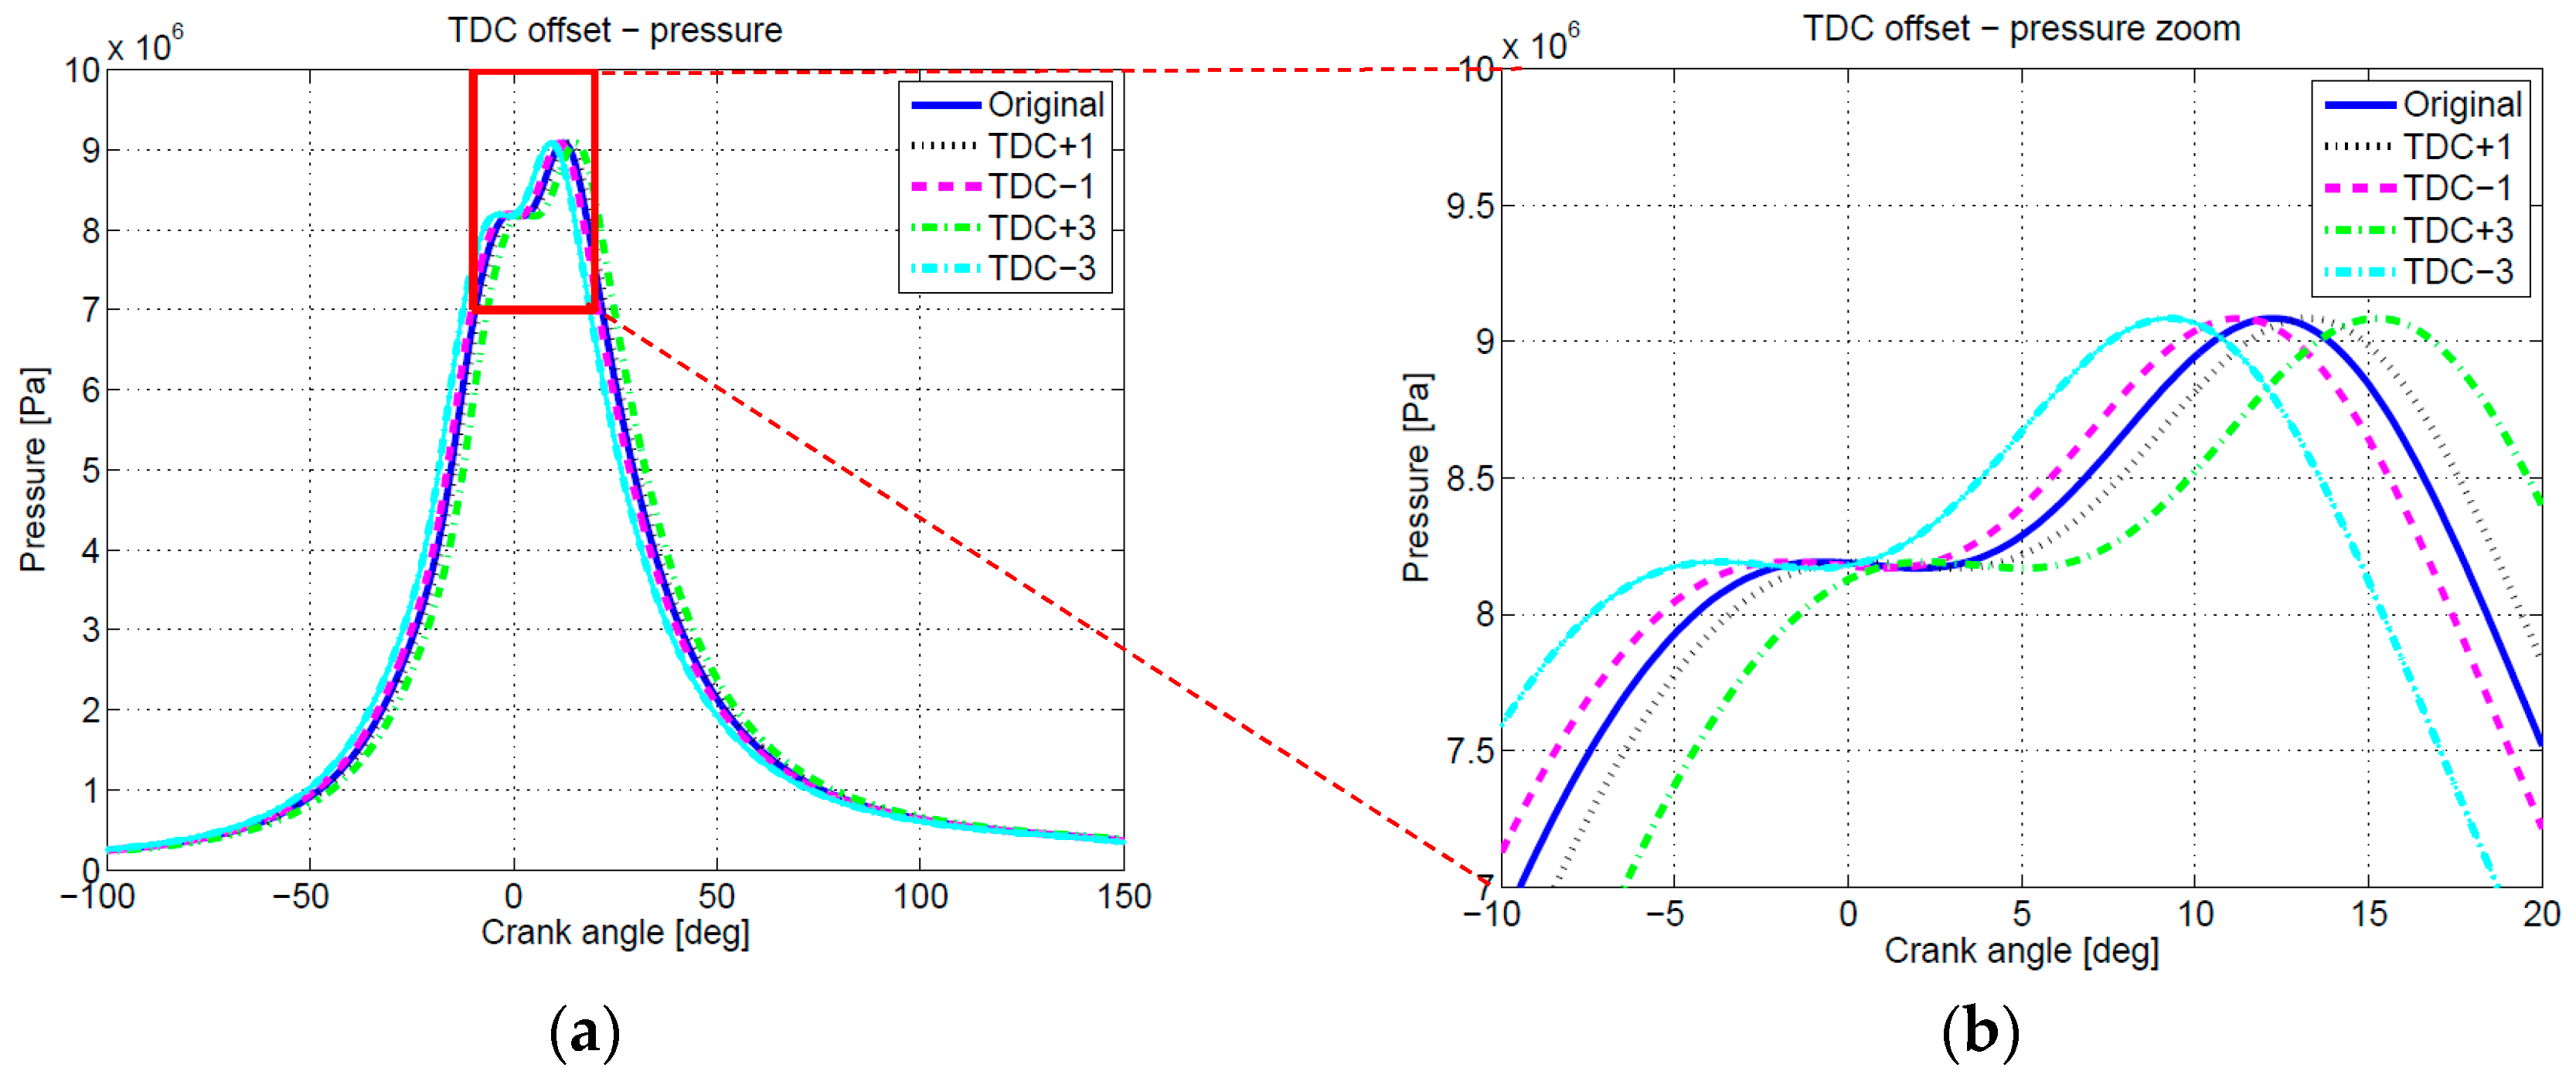
Pressure trace is positioned correctly with respect to the absolute pressure value and the TDC position
-
Pressure trace is processed with the thermodynamic model yielding no discrepancies to the actual heat transfer, gas properties, fuel evaporation and blow-by.
In general, this is not the case especially during the presence of TDC and pressure offsets. Therefore, in this study, the term ROHR (in equations denoted as d Q / d φ ) will be used as indication of the energy imbalance not only during combustion and potential evaporation but in the entire high-pressure phase of the engine cycle. In addition, the term expansion phase will be used for the period between the end-of-combustion and exhaust valve opening and the term compression will be used for the period between the intake valve closing and start of injection in diesel engines or spark initiation in spark ignited engines.
Using the 0D thermodynamic framework, which is similar to the formulations found in classic textbooks, e.g., [24], ROHR is given as:
( d Q d φ ) b a s e = ( 1 + 1 R · A · u T ) · p · d V d φ + ( u T A · u T ) · d m d φ + m · ( u λ T · u T · R λ R · A ) d λ d φ + m ( u p + T · C p · A u T ) d p d φ d H d φ d Q h t d φ ,
where:
A = 1 + T R R T
and:
C = 1 p R R p
are to be inserted into Equation (1). Equation (1), which presents general equation for evaluation of the ROHR, includes terms that are dependent on volume derivative ( ( 1 + 1 R · A · u T ) · p · d V d φ ) , in-cylinder mass derivative ( ( u T A · u T ) · d m d φ ) , relative air-fuel ratio derivative ( m · ( u λ T · u T · R λ R · A ) d λ d φ ) , in-cylinder pressure derivative ( m ( u p + T · C p · A u T ) d p d φ ) , enthalpy flux in and out of the combustion chamber ( d H / d φ ) and heat flux from the gas within the combustion chamber ( d Q h t / d φ ) . With the aim to allow code porting on the real-time hardware and especially the FPGA (Field programmable gate array) chip the computational effort was reduced. Therefore only most significant gas property dependencies were considered in further analyses and thus u / p and R / p were assumed zero because of small dependencies of the pressure on the internal energy ( u ) and the specific gas constant ( R ) at temperatures lower than approximately 2700 K [25]. This approach can additionally be reasoned by the fact that methodology is demonstrated on compression ignition engines generally featuring lower averaged in-cylinder temperatures compared to spark ignition engines. However, it should be noted that analyses presented in the paper could be done using Equation (1) and that all findings presented in the paper are also valid under consideration of gas property dependencies given in Equation (4).
As only high pressure phase of the cycle is analysed and as blow-by is very small in modern well maintained engines, d H is also set to zero to minimize computational effort, whereas again analyses presented in the paper could be done using Equation (1) and findings presented in the paper do not alter based on the consideration of the blow-by. Considering listed assumptions, Equation (1) can be reformulated to:
d Q d φ = ( 1 + 1 R A · u T ) · p · d V d φ + ( u T A · u T ) · d m d φ + m · ( u λ T · u T · R λ R · A ) · d λ d φ + m · T · C p · A · u T · d p d φ d Q h t d φ .
A general equation for calculating the heat flux from the in-cylinder charge to the combustion chamber walls has a form:
d Q h t d φ = α · i = 1 n S i · ( T i T ) ,
where α represents heat transfer coefficient, T charge temperature, T i temperatures of the surrounding walls (liner, cylinder head, piston) and S i surface area or the surrounding walls. For heat transfer coefficient calculation, empirical correlations are generally used, e.g., [24,26]. Proposed, 0D thermodynamic framework is compatible with any heat transfer coefficient correlation, whereas results are presented for the Hohenberg model [27]. Detailed derivation for this specific heat transfer coefficient correlation are presented in Appendix A.

2.2. ROHR Analysis in Compression and Expansion Phases

Innovative method for simultaneous determination of the TDC and the pressure offset is based on the integral values of the ROHR in compression and expansion phases. As combustion phase is not considered in the correction algorithms, Equation (4) can be further simplified as mass variation, which is characteristic for fuel injection in diesel engines, is not present in compression and expansion phases. In addition, change of chemical composition is generally related to either combustion or evaporation, which are both not present in compression and expansion phase of the diesel engines (if it is required to consider evaporation in the compression phase of specific engines, corresponding terms of the Equation (4) need to be retained). Equation (4) can thus be further simplified to:
d Q d φ = ( 1 + 1 R · A · u T ) · p · d V d φ + m · T · C p · A · u T · d p d φ d Q h t d φ .
It can be noted at this point that the proposed method is implemented in a way that the thermodynamic analysis is performed using Equation (4) (in a more general case it could also be Equation (1)), whereas derivatives of Equation (6) that are presented in Section 2.3 are used to calculate correction factors for the TDC and the pressure offset, while using species composition and temperature inputs calculated by Equation (4).

2.3. ROHR Integral Values Depending on the Pressure and TDC Offsets

The main idea of the innovative method for simultaneous determination is based on characteristic deviations of the ROHR that are specific for the TDC and the pressure offset in the compression phase and the expansion phase. To derive these dependencies, Equation (6) is expanded in the Taylor series with the respect to the pressure offset δ p and the angle deviation δ T D C and the linear terms were retained. For the pressure offset series expansion yields:
δ ( d Q d φ ) p = ( 1 + 1 R · A · u T ) · d V d φ · δ p + p R · A · d V d φ δ ( u T ) p + V · C R · A · d p d φ · δ ( u T ) p δ ( d Q h t d φ ) p .
Heat transfer term in the Equation (7) is expanded as:
δ ( d Q h t d φ ) p = ( S h · T h · δ α p S h · T · δ α p S h · δ T p · α p + S l · T l · δ α p S l · T · δ α p S l · δ T p · α p + S p i · T p i · δ α p S p i · T · δ α p S p i · δ T p · α p ) ,
where:
δ T p = V m · R δ p .
and subscripts h ,   l ,   p i represent head, liner and piston, respectively. Full derivation of the Equation (8) for the Hohenberg heat transfer coefficient correlation is given in Appendix A.
Partial derivative of internal energy with respect to temperature, present in the Equation (7), is defined as:
δ ( u T ) p = u T ( T 0 + δ T p ,   λ 0 ) u T ( T 0 ,   λ 0 ) ,
where T 0 and λ 0 represent parameters, calculated with estimated absolute pressure, and δ T p is evaluated by Equation (9).
Table 1 provides a basic insight into contributions of particular terms in Equation (7) to the δ ( d Q / d φ ) p for pressure offset of 1   P a (arbitrary selection for illustration purposes) and for different crank angle positions. The following notation is used: ( 1 + 1 R · A · u T ) · d V d φ · δ p is denoted as (a); p R · A · d V d φ δ ( u T ) p is denoted as (b); V · C R · A · d p d φ · δ ( u T ) p is denoted as (c) and δ ( d Q h t / d φ ) p is denoted as (d). Sign of the term (a) is in the compression and the expansion phase determined by the value of d V / d φ and it thus features negative values in compression phase, whereas in expansion phase it features positive values. Terms (b) and (c) feature opposite signs, which is related to different signs of d V / d φ and d p / d φ in the compression and the expansion phase. Their absolute sum is comparable to the absolute value of term (d), which is two orders of magnitude lower than the magnitude of the term (a). Therefore it can be concluded that the term (a) most significantly influences the ROHR for a given pressure offset in the entire region except around the TDC, whereas these regions are generally not of interest for analyses of fired cycles. As the sum of all terms and thus the δ ( d Q / d φ ) p is mainly driven by the term (a) it also features opposite signs in compression and expansion phase.
Combining Equations (8)–(10) along with the Equation (A3) from Appendix A into Equation (7), yields a linear dependency between ( d Q / d φ ) p , i.e., left hand side of Equation (7), representing the d Q / d φ deviation due to the pressure offset at a particular crank-angle position, and the pressure offset δ p , which can be represented as:
δ ( d Q d φ ) p = k p · δ p ,
where k p represents the proportionality parameter derived by right hand side of Equation (7).
Similar procedure as for the pressure offset can also be performed for the TDC offset, δ T D C . Equation (12) was derived from Equation (5), while the influence of the terms δ p T D C , δ ( u / T ) T D C , δ p T D C / d φ and δ T T D C , dependent on TDC offset were considered in the equation:
δ ( d Q d φ ) T D C = ( 1 + 1 R · A · u T ) · d V d φ δ p T D C + 1 R · A · d V d φ · p · δ ( u T ) T D C + V · C R · A · d p d φ · δ ( u T ) T D C + V · C R · A · u T · δ ( d p d φ ) T D C δ ( d Q h t d φ ) T D C .
The term δ p T D C is defined as:
δ ( d p d φ ) T D C = d p d φ ( φ 0 + δ T D C ) d p d φ ( φ 0 ) ,
where φ 0 represents correct crank angle without TDC offset for each pressure measurement.
In a similar manner as in the derivation of the δ ( d Q / d φ ) p , the term δ T T D C is defined as:
δ T T D C = V m · R · δ p T D C ,
and the term δ ( u / T ) T D C as:
δ ( u T ) T D C = u T ( T 0 + δ T T D C ,   λ 0 ) u T ( T 0 ,   λ 0 ) .
Table 2 provides, similarly as the Table 1, insight into magnitudes of the terms of the Equation (12), which were evaluated for the TDC offset value of 1   ° CA (arbitrary selection for illustration purposes) and for different crank angle positions. The following notation is used: 1 R · A · u T · d V d φ δ p T D C is denoted as (a); 1 R · A · d V d φ · p · δ ( u T ) T D C is denoted as (b); d V d φ · δ p T D C is denoted as (c); V · C R · A · d p d φ · δ ( u T ) T D C is denoted as (d); V · C R · A · u T · δ ( δ p δ φ ) T D C is denoted as (e) and δ ( d Q h t / d φ ) T D C is denoted as (f). The most influential term is term (e), which is directly dependent on δ ( d p / d φ ) T D C , which features same signed values in compression and expansion phase of the engine cycle except around the TDC. This can be related to the fact that as given in Equation (13), δ ( d p / d φ ) T D C 
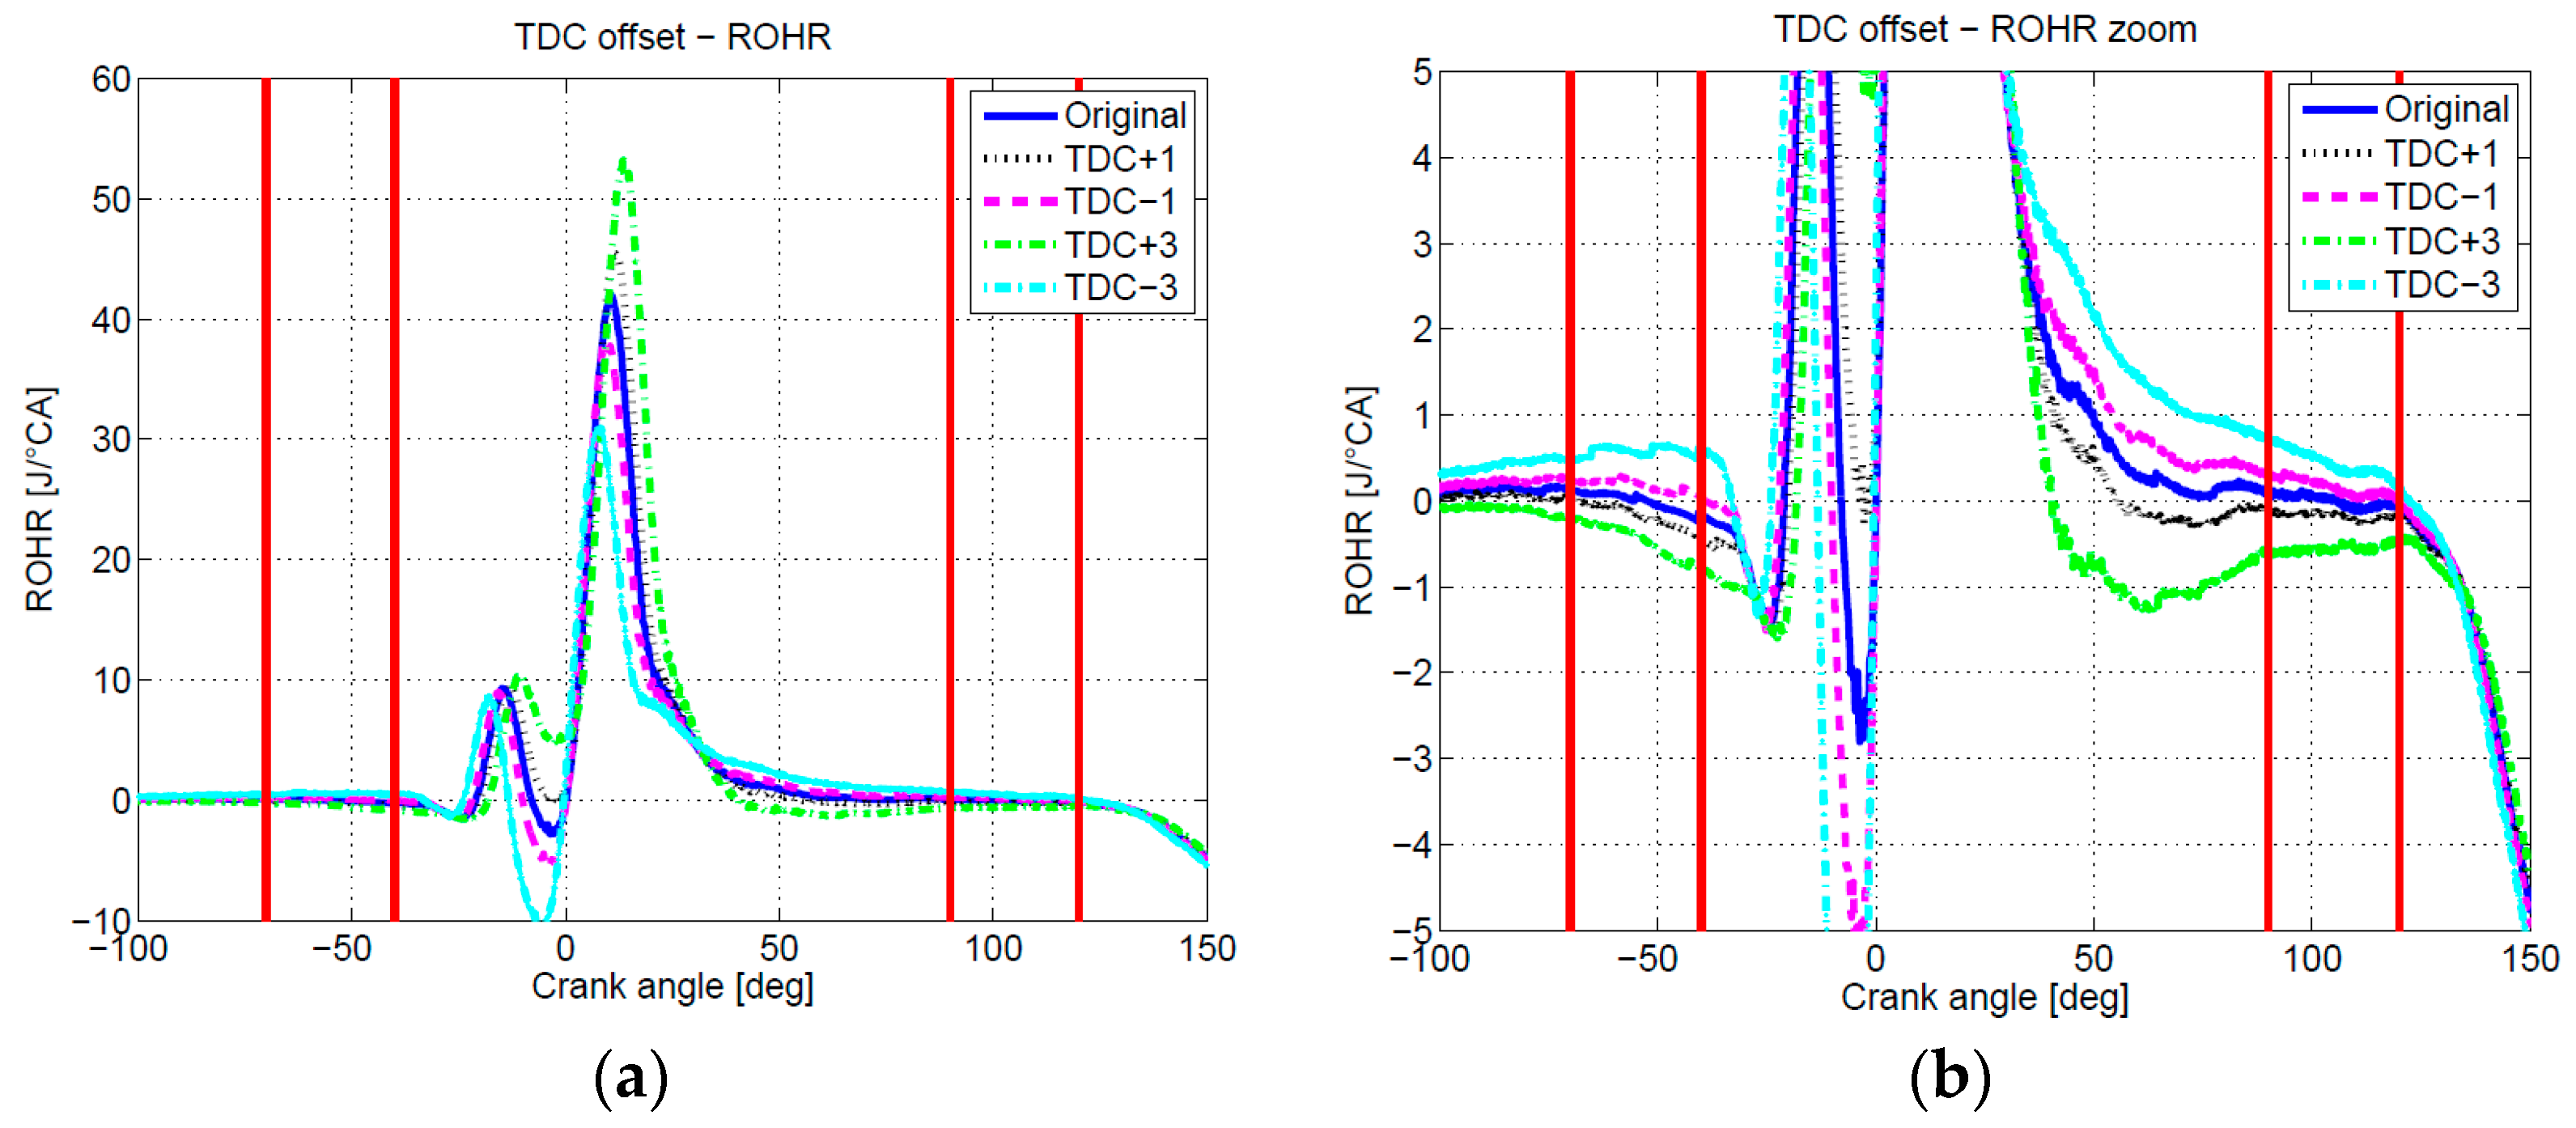
features the same sign as the second derivative of pressure with respect to the crank-angle, which is due to basic characteristic of the polytropic process and piston kinematics positive in compression and expansion phase except around the TDC. The sum of all terms and thus the δ ( d Q / d φ ) T D C therefore follows the trend of the term (e), i.e., δ ( d Q / d φ ) T D C features the same sign in the compression and expansion phase.
Results in Table 1 and Table 2 that were derived from Equations (7) and (12) respectively thus confirm the basic hypothesis of the proposed method stating that ROHR features different characteristic deviations in the compression phase and the expansion phase when subjected to the pressure and the TDC offset.
Combining Equations (12)–(15) along with the Equation (A5) from Appendix A, again gives linear dependency between ( d Q / d φ ) T D C , i.e., left hand side of Equation (12), and the TDC offset δ T D C :
δ ( d Q d φ ) T D C = k T D C · δ T D C ,
where k T D C represents the proportionality parameter derived by right hand side of Equation (12).
In general, the TDC and the pressure offset are not known and thus the framework for simultaneous determination of both offsets is generated by summing Equations (11) and (16). To minimize the impact of uncertainties of the pressure signal on the accuracy of the proposed method, the method does not rely on the single values of slope coefficients k T D C and k p evaluated at a particular crank-angle position, but it rather relies on the integrated values of k T D C and k p over a pre-specified intervals in the compression and the expansion phase. Likewise, to reduce the impact of uncertainties on the δ ( d Q / d φ ) p and δ ( d Q / d φ ) T D C 
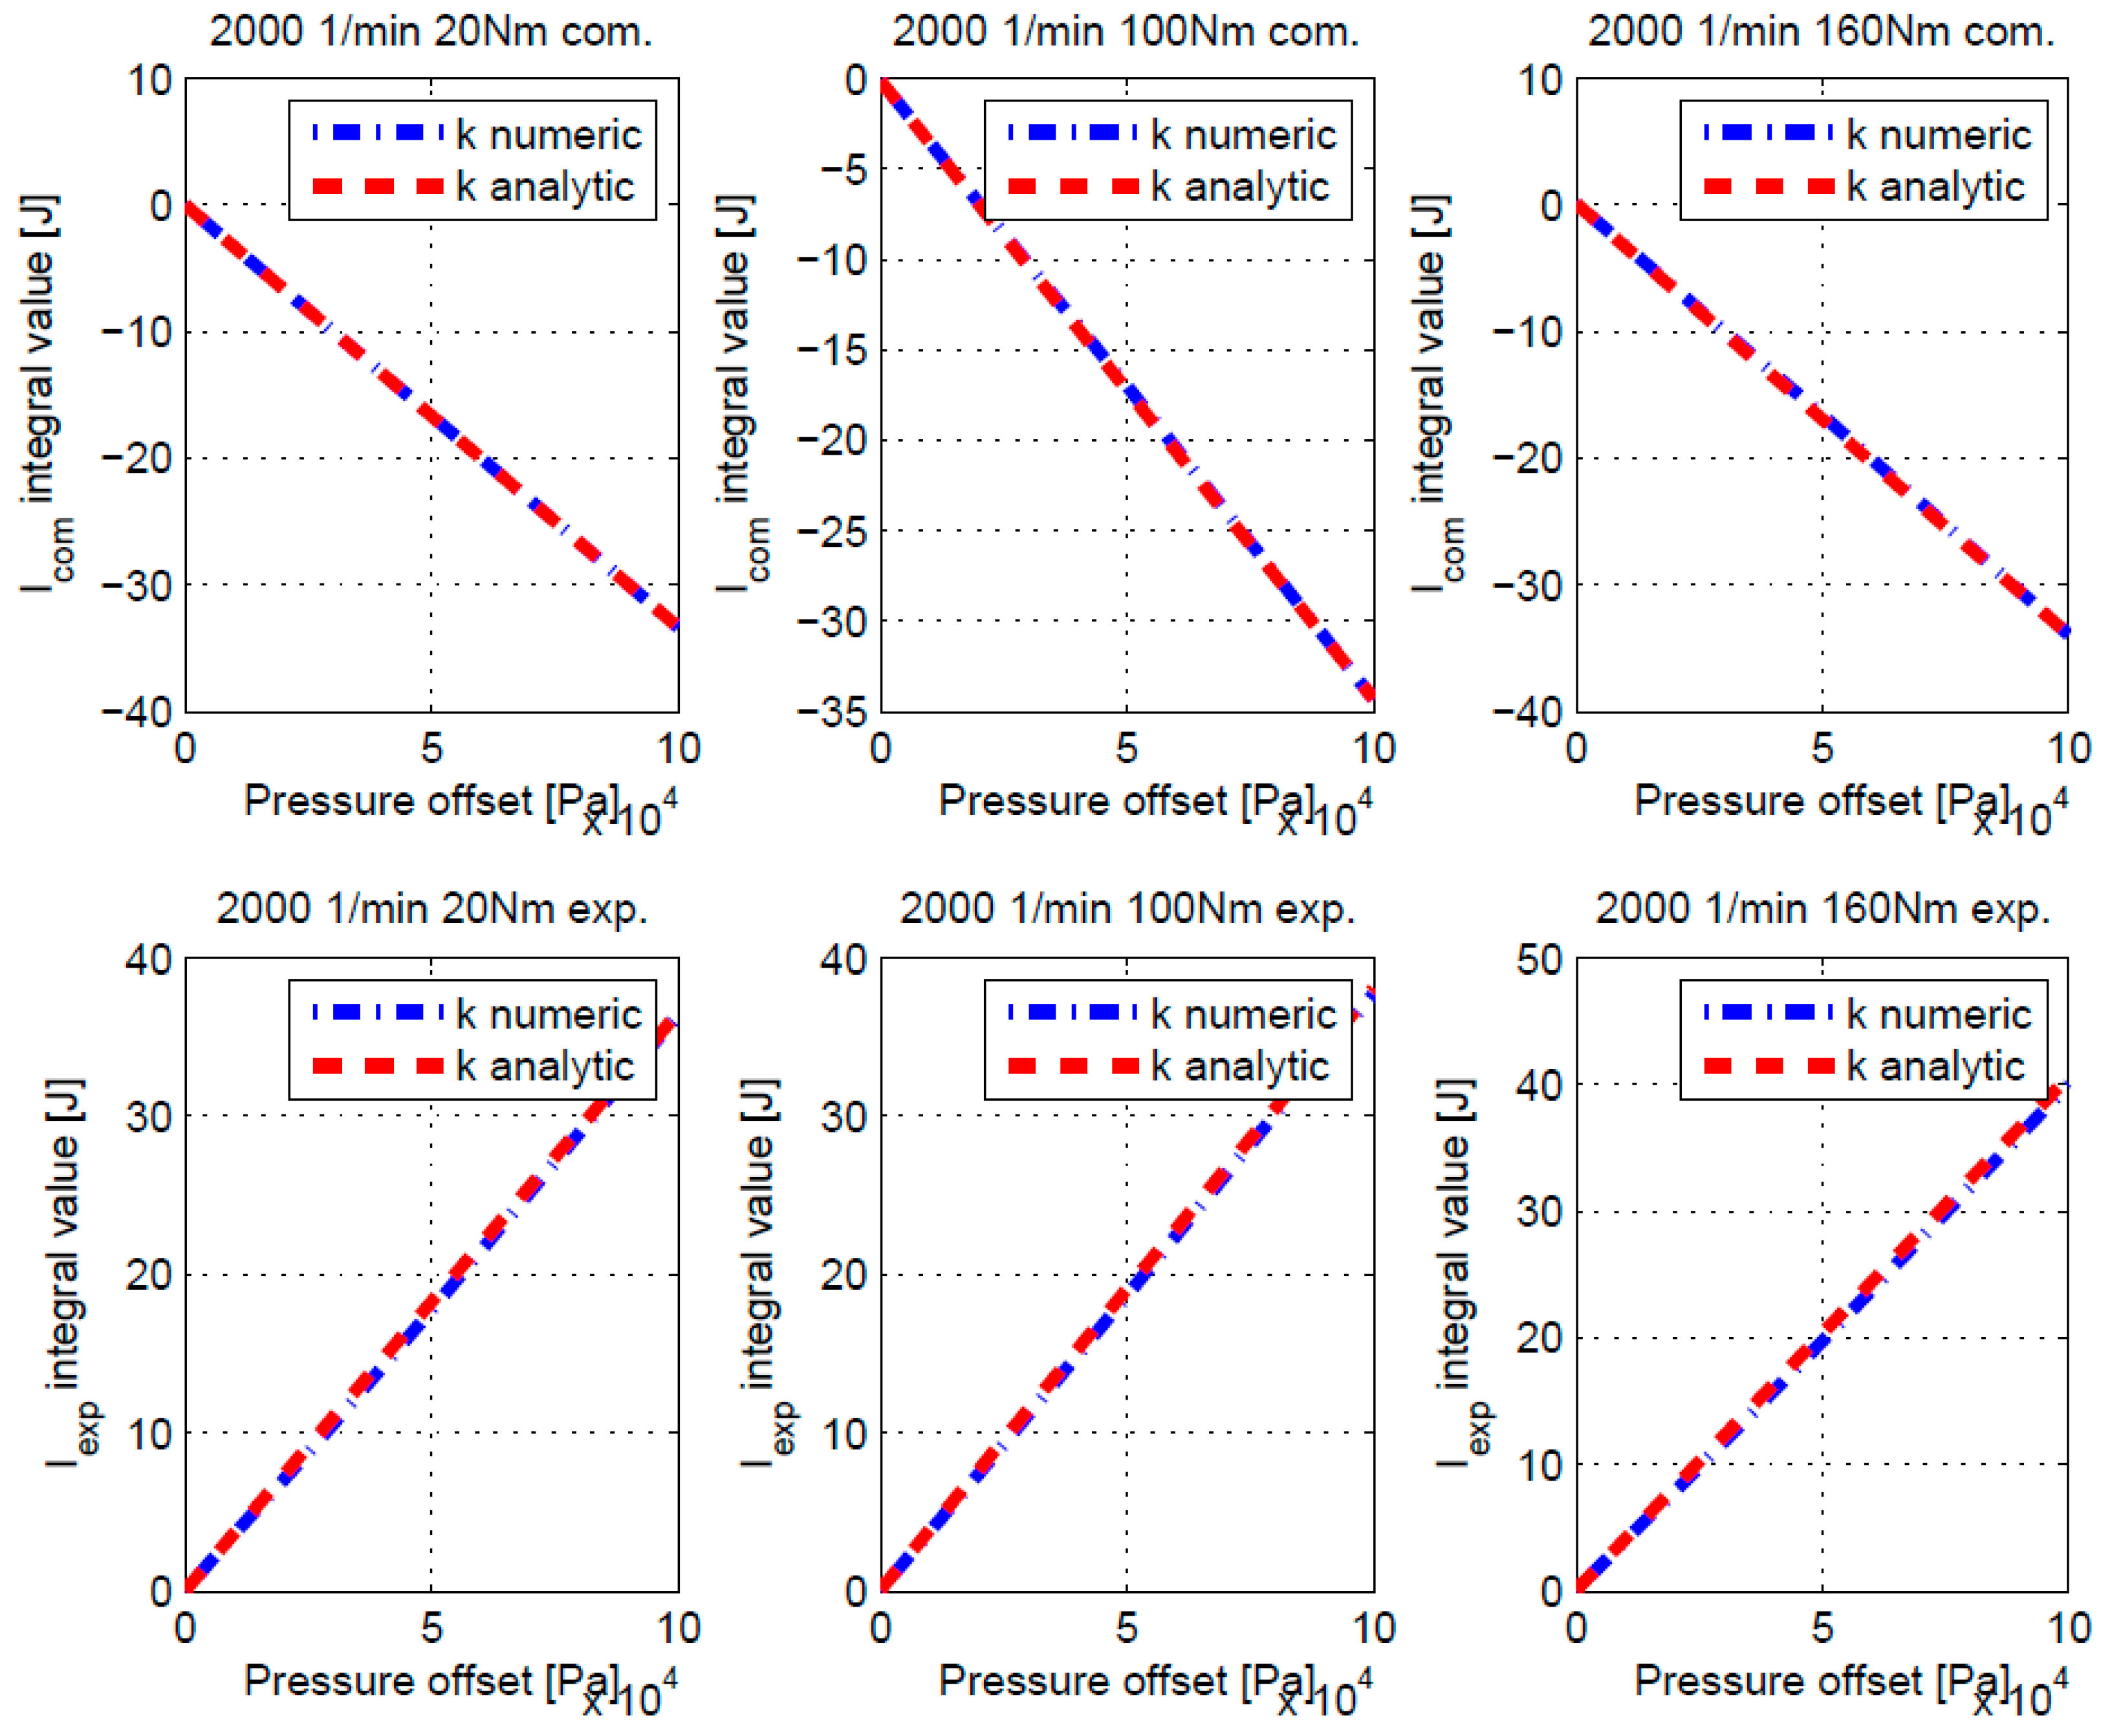
these values are not taken at a particular crank-angle position, but they are integrated over the same pre-specified intervals. Summing of Equations (11) and (16) and integration over pre-specified intervals in the compression and the expansion phase thus yields:
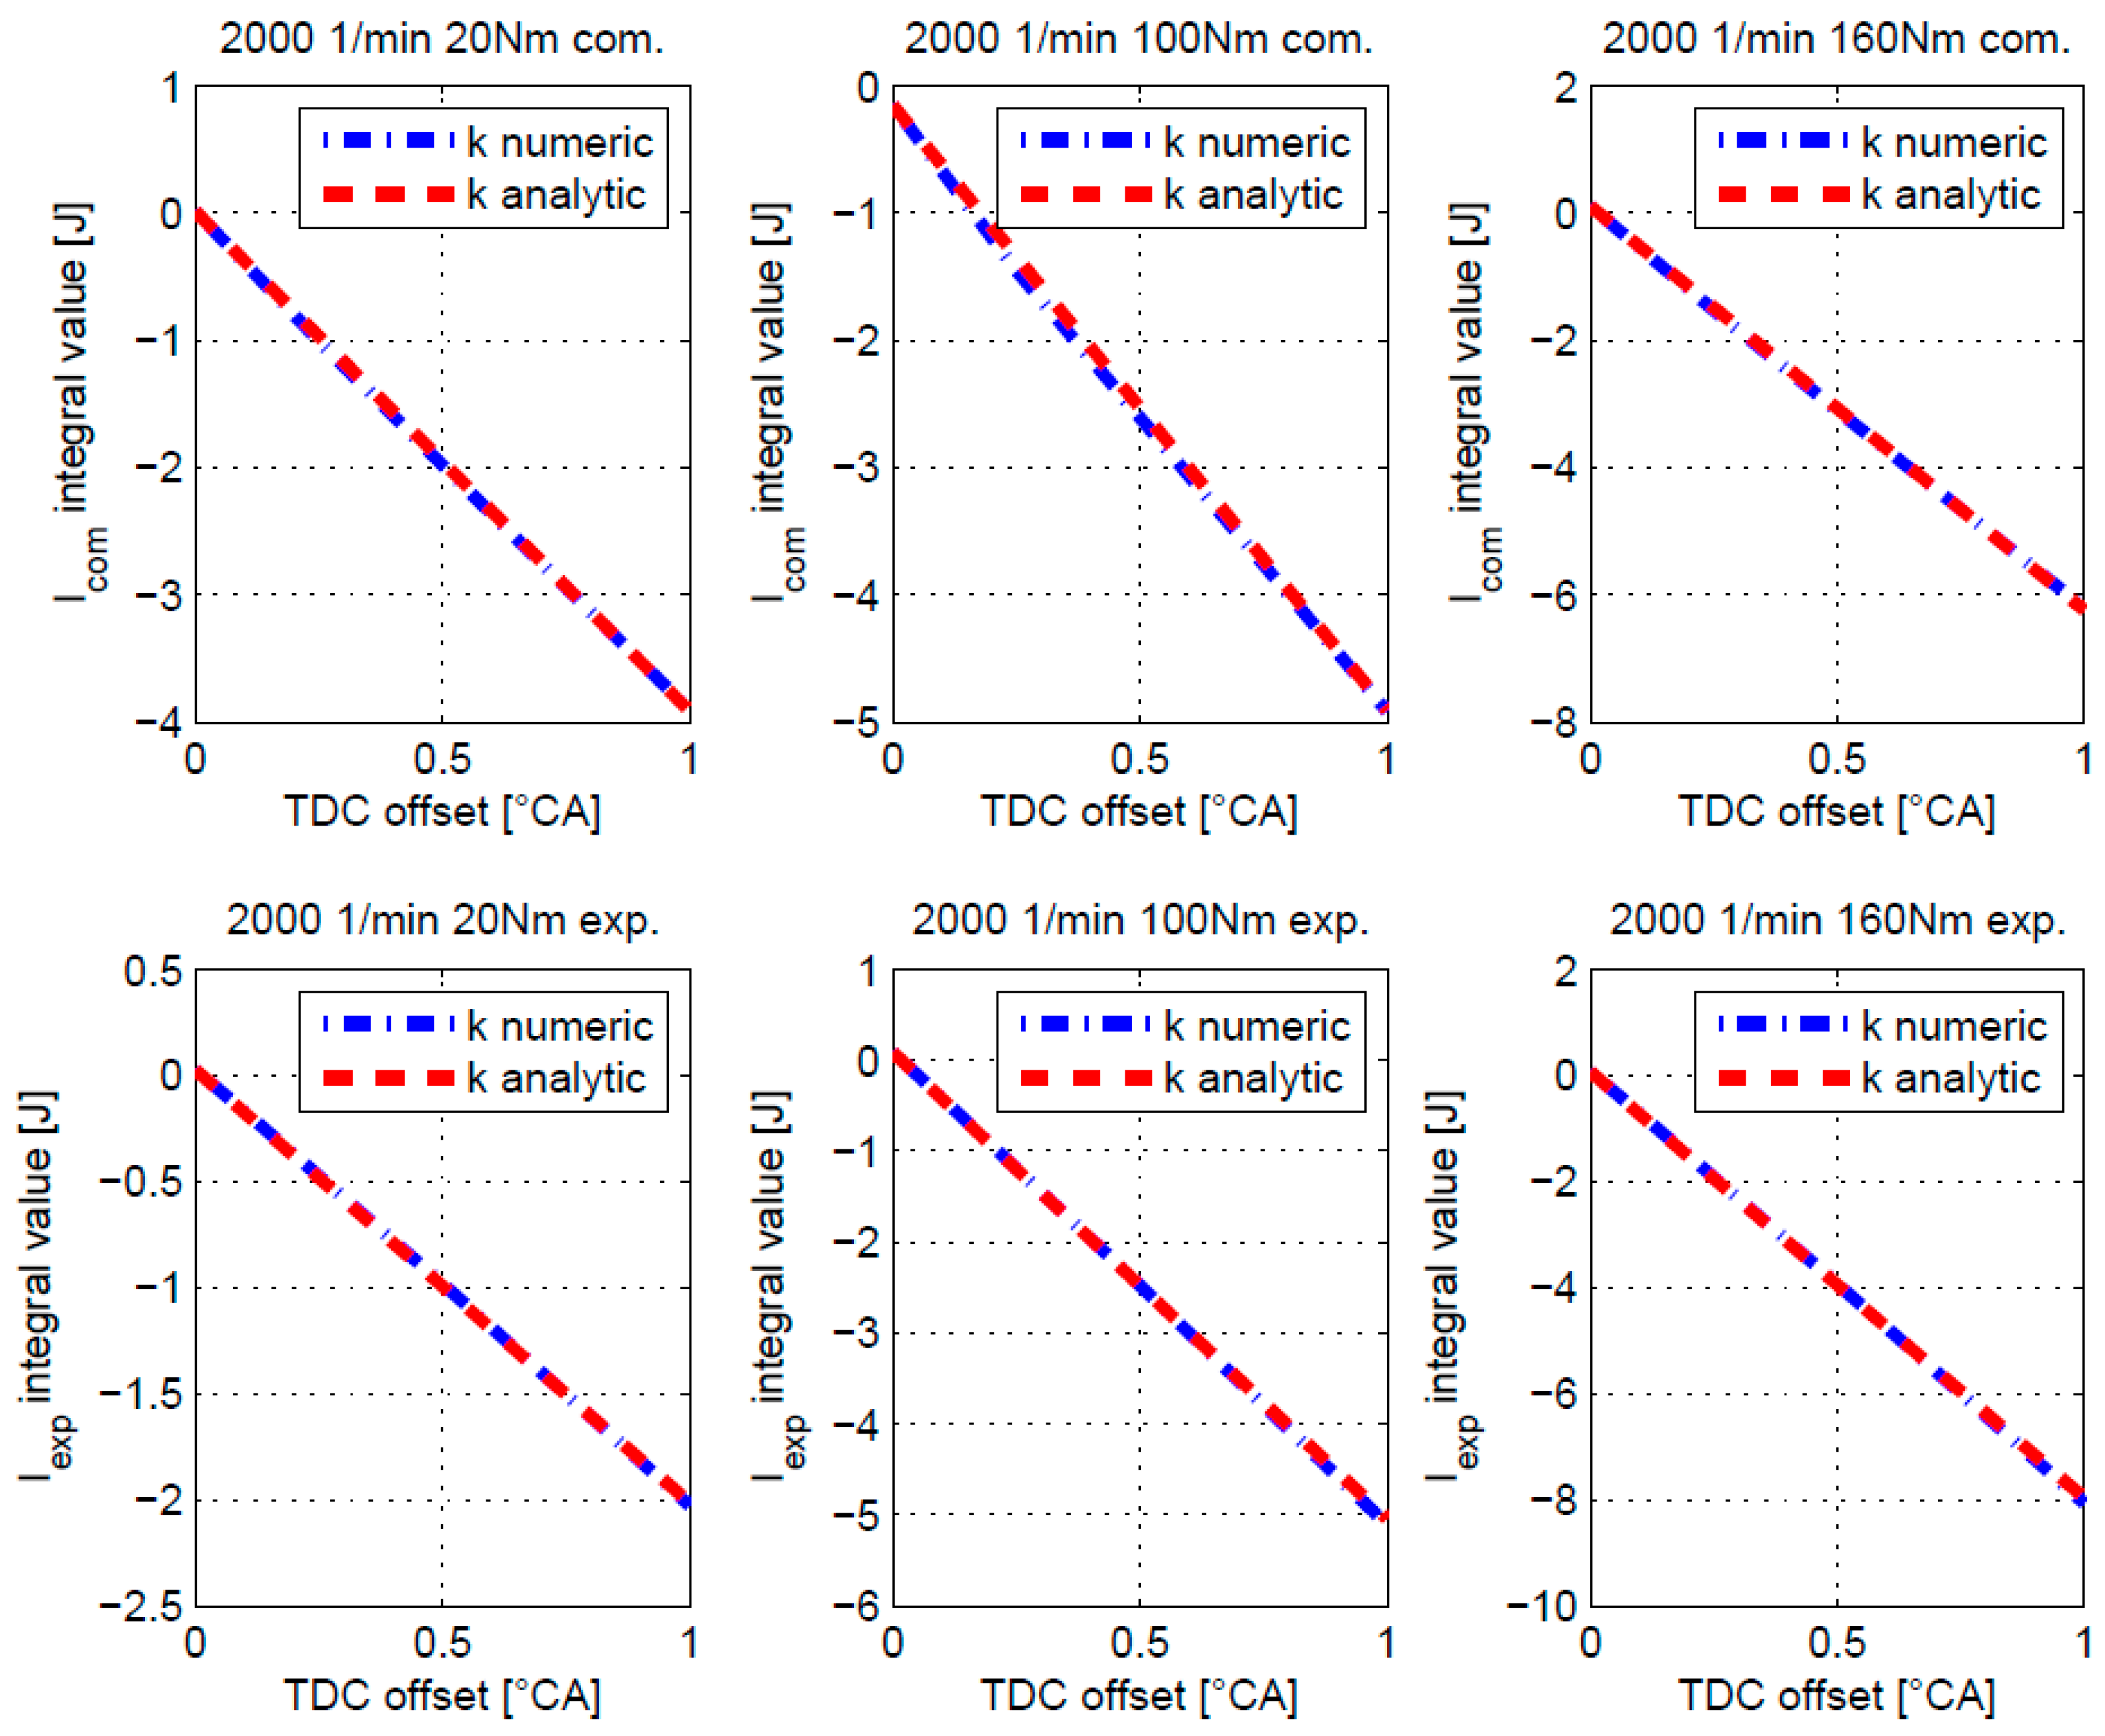
I c o m = c o m ( δ ( d Q d φ ) T D C + δ ( d Q d φ ) p ) · d φ = c o m k p d φ d φ · δ p + c o m k T D C d φ d φ · δ T D C = k c o m , p · δ p + k c o m , T D C · δ T D C ,
I e x p = e x p ( δ ( d Q d φ ) T D C + δ ( d Q d φ ) p ) ·   d φ = e x p k p d φ d φ · δ p + e x p k T D C d φ d φ · δ T D C = k e x p , p · δ p + k e x p , T D C · δ T D C ,
where I c o m and I e x p represent integral values of the ROHR when subjected to arbitrary combination of the TDC and the pressure offset in compression ( c o m ) and expansion ( e x p ) respectively and k c o m , p , k c o m , T D C and k e x p , p , k e x p , T D C represent integrals of k p and k T D C over the same intervals in the compression and the expansion phases.
In Section 2.1 it was stated that in an ideal case, which besides others implies also zero TDC and pressure offset, the values of I c o m and I e x p would be zero. By assuming that values of I c o m and I e x p are more influenced by the TDC and the pressure offset than by the deviations caused by the thermodynamic framework for their processing, it is possible to ascribe most of the deviations of I c o m and I e x p from zero to the TDC and pressure offset. This assumption might be partially justified by the fact that a sophisticated version of the 0D thermodynamic framework is used in Section 2, whose validity and robustness (in this or very similar level of fidelity) is demonstrated in multiple research and industrial studies. Moreover, in subsequent sections, it will be shown that the proposed method yields very accurate results although ROHR of the pressure trace with zero TDC and pressure offset features moderate deviations from zero (as discernible in figures of Section 4), which more adequately resembles real application area of the method and proves its robustness.
Values of I c o m and I e x p at unknown TDC and pressure offset are thus simply calculated by integrating the Equation (4) (in a more general case it could also be Equation (1)) pre-specified intervals in the compression and the expansion phase. Similarly, the values of k c o m , p , k c o m , T D C and k e x p , p , k e x p , T D C are calculated by integrating Equations (11) and (16) over the same intervals, while using species composition and temperature inputs calculated by Equation (4) as indicated in Section 2.2.
All parameters of Equations (17) and (18) are thus calculated during the processing of the pressure trace. Simultaneous determination of the TDC and the pressure offset is afterwards performed by solving of the Equations (17) and (18), i.e., the linear system of two equations with two unknowns. Due to limited additional workload of integrating I c o m and I e x p ( d Q / d φ is often integrated in compression and expansion phase of presents codes and thus these two parameters can be calculated just by simple subtractions) as well as k c o m , p , k c o m , T D C and k e x p , p , k e x p , T D C and solution of the linear system with two equations, the method is very computationally efficient and thus suitable also for low computing power systems and real time systems.

3. Experimental Setup and Procedure

3.1. Experimental Setup

Two significantly different diesel engines were selected to demonstrate general applicability of the developed numerical method for determination of the TDC and the pressure offset. First engine was a 4-cylinder, 4-stroke, turbocharged, 1.6 L light-duty diesel engine (PSA, Paris, France) featuring a common rail fuel system. Its main characteristics are presented in Table 3.
The second engine was a 6-cyliner, 4-stroke, turbocharged 6.87 l heavy-duty diesel engine (MAN Group, Munich, Germany) the characteristics of which are presented in Table 4. Pressure was indicated with a resolution of 0.1 °CA with an AVL GH12D piezo-electric pressure transducer (AVL LIST GmbH, Graz, Austria), which was connected to the AVL MICROIFEM charge amplifier and voltage signal was measured with a 16 bit, four channel National Instruments Corporation (Austin, TX, USA) data-acquisition system with maximum sampling frequency of 1 MS/s/ch. For the pressure indication, external trigger was provided by a CAM UNIT Type 2613B (Kistler Instrumente GmbH, Sindelfingen, Germany).

3.2. Method

First, the application of the proposed method in office or off-line analyses will be presented. In this type of analyses averaged and filtered in-cylinder pressure trace is processed. In the literature, there are many averaging and filtering techniques available for preparing a suitable pressure trace for reliable thermodynamic analysis. Therefore, the pre-processing step includes selection of the number of cycles that are used for averaging and selection of the filtering technique and its parameters.
Averaging is important to suppress the cycle to cycle variations. This procedure not only diminishes signal noise but also allows for achieving higher consistency between the measured parameters like fuel mass flow and air mass flow in the averaged cycle. In general, increased number of cycles that are used for averaging is favoured, however there is a point over which increasing the number of cycles does not lower standard deviation between cycles. Therefore, 100 consecutive cycles were used for averaging of the pressure trace, which is in between the proposed minimum 50 cycles [28] and few hundred cycles [11].
Filtering was performed with digital equiripple finite impulse response (FIR) filter. Pass-band and stop-band frequencies of the digital FIR filter were defined using a Fourier transformation [29]. The pass-band and stop-band frequencies were determined with discrete Fourier transform (DFT) in the region between the frequencies that are mainly the result of the piston kinematics and combustion and the frequencies of first eigen resonance spectra occurrence. The validation of the acquired transition bands was performed with short-time Fourier transform (STFT) analysis and transition bands were corrected if needed.
After defining the above pre-processing steps, the offline procedure comprises the following steps that can be grouped into the baseline and the refinement step. The baseline step comprises:
  • Pressure signal averaging. 100 consecutive cycles were used for averaging in this analysis.
  • Pressure signal filtering. Low-pass filtering procedure with equiripple FIR filter was applied in this analysis.
  • Calculation of slope coefficients. k c o m , T D C and k e x p , T D C are calculated with the Equations (12)–(16) and k c o m , p and k e x p , p are calculated with Equations (7)–(11) as presented in Section 2.3.
  • Calculation of ROHR integrals. Integral values of ROHR for compression and expansion regions are calculated using Equation (6) and denoted as I c o m and I e x p .
  • Determination of the TDC and pressure offsets. Using k c o m , p , k c o m , T D C , k e x p , p and k e x p , T D C as well as I c o m and I e x p , determined in items 3 and 4, pressure and TDC offset values are calculated using Equations (17) and (18). As coefficients in item 3 were calculated with shifted pressures traces their values deviate from the values that would have been calculated for zero TDC and pressure offset. Therefore, a second refinement step can be performed to further improve accuracy of the results. This refinement step comprises:
  • Shift the pressure trace for the TDC and the pressure offset determined in item 5.
  • Performing steps 3 to 5 to obtained refined values of the TDC and the pressure offset.
In general, it is possible to iterate on steps 6 and 7 until convergent offset values are calculated, however in none of the performed analyses there was a need for more than the baseline and one refinement step. The proposed method is applicable also in on-line analyses and it is demonstrated in the paper that it is possible to apply the proposed method on a single filtered in-cylinder pressure trace, which in combination with low computational effort of the method allows for update rates on the cycle-to-cycle basis. The only difference between the off- and on-line methods is absence of pressure cycle averaging in the on-line method, whereas the filter setting might also differ between these two applications. Also filters with orders of several hundred are applicable for the on-line analysis as order of 100 results in only 5 °CA delay when using crank angle resolution of 0.1 °CA. During test on the FPGA integrated circuit the calculation times in the range of 1 ms were achieved for the entire thermodynamic analysis presented in Section 2.1. A basic step of the TDC and pressure offset algorithm consumes approximately 20% of the CPU time of the thermodynamic calculation. Overall computational times below 2 ms therefore allow for real-time applicability of the method. The applied Virtex-5 LX50 FPGA integrated circuit (Xilinx Inc., San Jose, CA, USA) was integrated into National Instruments CompactRIO reconfigurable chassis 9114 and was running with the frequency of 40 MHz.

4. Results and Discussion

4.1. Qualitative Validation of the ROHR for the Pressure and TDC Offset

In this section, ROHR deviations will be analysed for different pressure and TDC offsets to provide experimental evidence on the hypotheses that ROHR features different characteristic deviations in the compression phase and the expansion phase when subjected to the TDC and the pressure offset. It might be worth noting that the results in this section were calculated by applying Equation (4), which is commonly used in ROHR analyses, and equations proposed in Section 2.2 and Section 2.3 were not used to generate any of the results in this section. For this demonstration purpose, pre-processed pressure traces of the PSA DV6ATED4 engine with accurately determined pressure and TDC position, which was measured with the capacitive TDC sensor, were subjected to predetermined manual offsets in the TDC and the pressure. Presented pressure traces were averaged over 100 consecutive cycles and filtered with low-pass FIR filter.
Figure 1 shows the pressure trace with accurately determined pressure and TDC position (denoted as “Original”) and pressure traces which were subjected to shifts of ±1 and ±3 °CA in the operating point at 2000 1/min and 100 Nm. In the Figure 2 ROHR values calculated using Equation (4) are presented. Vertical red lines in compression and expansion regions represent selected integration intervals used in Equations (17) and (18), which will be kept constant for all cases in the presented paper. Integration interval in the compression phase is from −70 to −40 °CA, whereas in expansion phase it is from 90 to 120 °CA.
It can be observed in Figure 1 that for a positive TDC offsets, ROHR curves feature negative values in the compression and the expansion phase, whereas an inverse trend is observed for negative TDC offsets. This observation confirms results, presented in the Table 2 for crank angles in compression and expansion phases.
Similarly as for the TDC offset, the Original pressure trace was also subjected to the pressure offset variations, where the Original pressure trace was shifted by ±0.5 and ±1 bar. Results, presented in the Figure 3 and Figure 4, were acquired with the Equation (4) for different pressure offsets. Unlike for the TDC variation, where a TDC offset resulted in ROHR deviation with the same sign in compression and expansion regions, it can be observed that for a pressure offset variation, ROHR curves feature deviations with different signs in compression and expansion regions, which coincides with the results from the Table 1.
Figure 2 and Figure 4 thus in addition to the governing equations in Section 2.3 and results generated thereof confirm the basic hypothesis of the proposed method stating that ROHR features different characteristic deviations in the compression phase and the expansion phase when subjected to the TDC and the pressure offset. This further proves the hypothesis that, considering assumption stated after Equation (18) in Section 2.3, it is possible to determine both offset simultaneously using Equations (17) and (18) by knowing ROHR integrals in compression and expansion phases and values of k c o m , p , k c o m , T D C , k e x p , p and k e x p , T D C .

4.2. Quantitative Validation of the ROHR for the Pressure and TDC Offset

In Section 4.1 it was proven that by manual shifting of pressure traces the same trends as predicted by Equations (7) and (12) is reproduced. To validate the analytical framework also quantitatively, it is necessary to compare the values of I c o m and I e x p values calculated: (a) by the integrating Equations (11) and (16) over the intervals specified in Section 4.1 (denoted as analytical approach) and (b) by integrating Equation (6) over the same interval for pressure traces that were subjected to predetermined manual offsets in the TDC and the pressure of the original pressure trace as explained in Section 4.1 (denoted as numerical approach). Results are shown for three operating points of the PSA DV6ATED4 engine at an engine speed of 2000 1/min and torques of 20 Nm, 100 Nm and 160 Nm. This analysis is besides validation of the proposed approach important also to prove that first order expansion, which was used in Section 2.3, is sufficient to obtain high fidelity results. In the Figure 5 and Figure 6, comparison between numerical and analytical calculation of ROHR as a function of TDC offset and pressure offset is presented for compression and expansion regions. It can be observed that in all figures analytical and numerical results nearly coincide, which proves adequacy of the proposed approach for the TDC and pressure offsets in compression and expansion regions of the engine cycle.
It is worth noting that coefficients k c o m , p , k c o m , T D C and k e x p , p , k e x p , T D C in Equations (17) and (18) can also be determined by manually shifting the pressure traces as presented in this section. However, this method is not pursuit in this paper due to the two deficiencies. First, to calculate coefficients k c o m , p , k c o m , T D C and k e x p , p , k e x p , T D C using the numerical method it is necessary to first obtain the pressure trace with zero TDC and pressure offset. This means that the final result is needed to initiate the method, which is not plausible. Unlike, for the analytical method the coefficients are calculated during the processing of the pressure trace, as elaborated in the next section, and exact values of the TDC and pressure offset are not needed in this calculation. Second, also under the assumption that the TDC and pressure offset are known the analytical method is more computationally efficient as equations for determining the coefficients k c o m , p , k c o m , T D C and k e x p , p , k e x p , T D C are evaluated and integrated only in a very limited range, whereas additional processing of the entire cycles is needed in the numerical method.

4.3. Validation and Discussion

The proposed procedure was validated on a four cylinder light-duty PSA diesel engine and on a six cylinder heavy-duty MAN diesel engine introduced in Section 3.1. Tests were performed in a way that a full factorial matrix of pre-prescribed shifts in TDC for [−3, −1, 0, 1, 3] °CA and in pressure [−100,000, −50,000, 0, 50,000, 100,000] Pa was applied to the original pressure trace. Afterwards, both off- and on-line method was applied to evaluate the offsets and accuracy of the results was analysed by comparison to the pre-prescribed shifts.

4.3.1. PSA Engine

Accuracy of the off-line approach was tested first and the results are summarized in Table 5 for the operating point at 2000 1/min and 100 Nm. Results of additional operating points are presented in Appendix B. To prove convergence of the method and to prove that in all analysed case on both engines mostly a baselined and one refinement step, i.e., two iterations, are needed, steps 6 and 7 presented in Section 3.2 were called in a loop with pre-specified exiting criteria. Calculation was considered converged when TDC and pressure offset values did not change more than 0.05 °CA and 1000 Pa, respectively, between two iterations. The number of iterations needed to reach the accuracy threshold is given in Table 6. It can clearly be seen that not more than two iterations, i.e., a baselined and one refinement step, are needed to reach converged solution with tight convergence limits, whereas in multiple points only a single calculation was sufficient. As converged solution does not necessary imply that the solution is also accurate, it is important to analyse the absolute errors in the TDC and the pressure offsets given in Table 5. It can be seen that the largest error in pressure corrections is less than 1300 Pa and less than 0.06 °CA for TDC correction, which proves high accuracy of the results.
In cases where compression ratio is not correctly known, the accuracy of the method diminishes due to an error in the calculation of the cylinder volume and its derivative. To quantify this effect, sensitivity analysis was performed for the operating point at 2000 1/min and 100 Nm with off-line approach. It was determined that an error in compression ratio of ±0.5 results in error in determining absolute pressure of less than ±4500 Pa and TDC correction of less than ±0.2 °CA.
Additionally, also accuracy of the on-line application was analysed and the results analogue to those for the off-line application are presented in the Table 7 and Table 8. For this analysis, one of the arbitrary selected pressure traces out the set of the 100 cycles used for off-line analysis was applied. The pressure trace was filtered using the same FIR filter with the same settings as in the off-line case were applied to expose influence of the averaging on the accuracy of the results. Likewise, the same convergence criteria as for the off-line case were applied in this on-line case. It can be seen that all errors in pressure offset are lower than 2000 Pa and that and errors in the TDC offsets are lower than 0.27 °CA. Despite expected lower accuracy of the results compared to the off-line case, it can be concluded that accuracy of the results is good considering the fact that only a single pressure trace was processed.

4.3.2. MAN Engine

Furthermore, the method was validated on the heavy-duty diesel engine, which highly differentiates from PSA engine in size and other specifications, to validate its universal applicability. Results, calculated with the offline approach for simultaneous TDC and pressure offset determination are presented in the Table 9 for operating point at 2400 1/min and 373 Nm.
General conclusions for heavy-duty engine are similar to the ones of the light-duty engine in terms of accuracy of the TDC and the pressure offset correction as well as in terms of number of iterations. In Table 9, highest absolute difference of the pressure offset and the TDC offset reach 866 Pa and 0.06 °CA, respectively. Therefore, also for the heavy duty engine case, calculated TDC and pressure offsets are determined with high enough accuracy in no more than two iterations, as presented in the Table 10. It can therefore be concluded that the methodology is applicable on various engine types.

5. Conclusions

In this paper an innovative method for simultaneous determination of TDC offset and pressure offset from ROHR integrals in compression and expansion regions of the high-pressure phase of engine cycle was developed and validated with two different size four-stroke diesel engines, which verifies its applicability to light- and heavy-duty engines. The method relies on a thermodynamic model that calculates ROHR curve and its dependency on TDC and pressure offsets from pressure trace, geometric data and operating point specific parameters. It is presented in the paper that the proposed method is applicable on averaged filtered in-cylinder pressure trace and also on filtered non-averaged, i.e., single, pressure trace making it suitable for off- and on-line analyses respectively. Expectedly, accuracy of the results is higher when averaged pressure traces are used, where in all analysed cases accuracy in deranging the pressure offset is better than 1300 Pa and accuracy of the TDC offset is better than 0.06 °CA. However, also when single pressure traces is used the accuracy of the method is still very high as presented in the Table 7. Irrespective of the applied pressure trace, converged results are obtained in most two iterations of the method. Therefore the method can be considered as very computationally efficient featuring computational times of few milliseconds on the FPGA integrated circuits.

Author Contributions

Urban Žvar Baškovič and Tomaž Katrašnik developed the method for simultaneous determination of the TDC offset and the Pressure Offset in Fired Cylinders of an Internal Combustion Engine; Urban Žvar Baškovič and Rok Vihar performed measurements, on which the method was validated; Urban Žvar Baškovič, Rok Vihar and Igor Mele implemented the method and calculated all thermodynamic parameters and other data, presented in the article; Urban Žvar Baškovič and Tomaž Katrašnik wrote the article.

Conflicts of Interest

The authors declare no conflict of interest.

Nomenclature

A model parameter (/)
C model parameter (/)
H enthalpy (J)
k c o m , p ; k e x p , p proportionality parameter (J/Pa)
k c o m , T D C ; k e x p , T D C proportionality parameter (J/°CA)
m charge mass (kg)
p in-cylinder pressure (Pa)
Q released energy (J)
R specific gas constant (J/(kg·K))
S surface (m2)
T temperature (K)
u specific internal energy (J/kg)
V combustion chamber volume (m3)
λ relative air-fuel ratio (/)
φ angle (°CA)

Subscripts and Abbreviations

0 at correct TDC and p offset values
0Dzero-dimensional
b a s e base derivation
CLCCclosed-loop combustion control
CAcrank angle
c o m compression
e x p expansion
FPGAfield programmable gate array
FIRfinite impulse response
h cylinder head
h t heat transfer
i combustion chamber walls
IMEPindicated mean effective pressure
l liner
p pressure offset
p i piston
ROHRrate of heat release
T D C top dead centre offset
TDCtop dead centre

Appendix A

Hohenberg heat transfer model:
α = 130 · V 0.06 · p 0.8 · T 0.4 · ( c m + 1.4 ) 0.8 ,
where V ,   p ,   T represent charge properties volume, pressure and temperature, respectively and c m denotes mean piston speed. Linearised Hohenberg heat transfer model for pressure offset:
δ α p = 130 · V 0.06 · ( c m + 1.4 ) 0.8 · ( p 100000 ) 0.8 · ( p · V m · R ) 0.4 · 2 · δ p 5 · p .
Heat transfer for pressure offset:
δ ( d Q h t d φ ) p = H T C F ( A h T h 130 V 0.06 ( c m + 1.4 ) 0.8 ( p 100000 ) 0.8 ( p V m R ) 0.4 2 δ p 5 p A h T δ α p A h V m R δ p α p + A l T l 130 V 0.06 · ( c m + 1.4 ) 0.8 · ( p 100000 ) 0.8 · ( p · V m · R ) 0.4 · 2 · δ p 5 · p A l · T · 130 V 0.06 ( c m + 1.4 ) 0.8 ( p 100000 ) 0.8 2 δ p 5 p A l δ T p · α p + A p i · T p i · 130 · V 0.06 · ( c m + 1.4 ) 0.8 · ( p 100000 ) 0.8 ( p V m R ) 0.4 2 δ p 5 p A p i T δ α p A p i V m R δ p α p )
Linearised Hohenberg heat transfer model for TDC offset:
δ α T D C = 130 · V 0.06 · ( c m + 1.4 ) 0.8 · ( p 100000 ) 0.8 · ( p · V m · R ) 0.4 · 2 · ( p ( φ 0 + δ T D C ) p ( φ 0 ) ) 5 · p .
Heat transfer for TDC offset:
δ ( d Q h t d φ ) T D C = H T C F ( A h T h 130 V 0.06 ( c m + 1.4 ) 0.8 ( p 100000 ) 0.8 ( p V m R ) 0.4 · 2 · ( p ( φ 0 + δ T D C ) p ( φ 0 ) ) 5 · p A h · T · δ α T D C A h · V m · R ( p ( φ 0 + δ T D C ) p ( φ 0 ) ) · α T D C + A l · T l · 130 · V 0.06 · ( c m + 1.4 ) 0.8 · ( p 100000 ) 0.8 · ( p · V m · R ) 0.4 · 2 · ( p ( φ 0 + δ T D C ) p ( φ 0 ) ) 5 · p A l · T · 130 · V 0.06 · ( c m + 1.4 ) 0.8 · ( p 100000 ) 0.8 · ( p · V m · R ) 0.4 · 2 · ( p ( φ 0 + δ T D C ) p ( φ 0 ) ) 5 · p A i · δ T T D C · α T D C + A p i · T p i · 130 · V 0.06 · ( c m + 1.4 ) 0.8 · ( p 100000 ) 0.8 · ( p · V m · R ) 0.4 · 2 · ( p ( φ 0 + δ T D C ) p ( φ 0 ) ) 5 · p A p i · T · δ α T D C A p i · V m · R δ p · α T D C ) ·

Appendix B

Following tables present results of TDC and pressure offset calculation for the additional PSA engine operating points.
Table B1. Calculated pressure and TDC offsets and their absolute errors for the PSA engine and operating point 2000 1/min and 20 Nm using the off-line method.
Calculated Pressure Offset
p\TDC−3−1013
−100,000−99,724−99,936−99,347−99,310−99,788
−50,000−49,652−49,936−49,347−49,310−49,788
034864653690212
50,00050,34850,06450,65350,69050,212
100,000100,348100,064100,653100,690100,212
Calculated TDC Offset
p\TDC−3−1013
−100,000−2.936−0.9940.0081.0143.048
−50,000−2.934−0.9940.0081.0143.048
0−2.934−0.9940.0081.0143.048
50,000−2.934−0.9940.0081.0143.048
100,000−2.934−0.9940.0081.0143.048
Absolute Error—Pressure Offset
p\TDC−3−1013
−100,000276.4864.38652.85689.79212.18
−50,000347.6964.38652.85689.79212.18
0347.6964.38652.85689.79212.18
50,000347.6964.38652.85689.79212.18
100,000347.6964.38652.85689.79212.18
Absolute Error—TDC Offset
p\TDC−3−1013
−100,0000.0640.0060.0080.0140.048
−50,0000.0660.0060.0080.0140.048
00.0660.0060.0080.0140.048
50,0000.0660.0060.0080.0140.048
100,0000.0660.0060.0080.0140.048
Table B2. Number of iterations for the PSA engine and operating point 2000 1/min and 20 Nm using the off-line method.
p\TDC−3−1013
−100,00022112
−50,00022112
022112
50,00022112
100,00022112
Table B3. Calculated pressure and TDC offsets and their absolute errors for the PSA engine and operating point 2000 1/min and 20 Nm using the off-line method.
Calculated Pressure Offset
p\TDC−3−1013
−100,000−99,263−99,827−99,977−99,916−99,392
−50,000−48,996−49,827−49,977−49,916−49,392
010041732384608
50,00051,00450,17350,02350,08450,608
100,000101,004100,173100,023100,084100,608
Calculated TDC Offset
p\TDC−3−1013
−100,000−2.967−1.013−0.0130.9923.023
−50,000−2.976−1.013−0.0130.9923.023
0−2.976−1.013−0.0130.9923.023
50,000−2.976−1.013−0.0130.9923.023
100,000−2.976−1.013−0.0130.9923.023
Absolute Error—Pressure Offset
p\TDC−3−1013
−100,000737.32173.3722.9083.82607.72
−50,0001004.48173.3122.9083.82607.72
01004.48173.3122.9083.82607.72
50,0001004.48173.3122.9083.82607.72
100,0001004.48173.3122.9083.82607.72
Absolute Error—TDC Offset
p\TDC−3−1013
−100,0000.033−0.013−0.013−0.0080.023
−50,0000.024−0.013−0.013−0.0080.023
00.024−0.013−0.013−0.0080.023
50,0000.024−0.013−0.013−0.0080.023
100,0000.024−0.013−0.013−0.0080.023
Table B4. Number of iterations for the PSA engine and operating point 2000 1/min and 20 Nm using the off-line method.
p\TDC−3−1013
−100,00022222
−50,00022222
022222
50,00022222
100,00022222

References

  1. European Commission. Commission Welcomes Member States’ Agreement on Robust Testing of Air; European Commission: Brussels, Belgium, 2015. [Google Scholar]
  2. European Commission. Draft of Commision Regulation as Regards Emissions from Light Passenger and Commercial Vehicles (Euro 6); European Commission: Brussels, Belgium, 2013. [Google Scholar]
  3. Lee, K.; Yoon, M.; Sunwoo, M. A study on pegging methods for noisy cylinder pressure signal. Control Eng. Pract. 2008, 16, 922–929. [Google Scholar] [CrossRef]
  4. Klein, M.; Eriksson, L.; Åslund, J. Compression ratio estimation based on cylinder pressure data. Control Eng. Pract. 2006, 14, 197–211. [Google Scholar] [CrossRef]
  5. Fanelli, I.; Camporeale, S.M.; Fortunato, B. Efficient On-Board Pegging Calculation from Piezo-Electric Sensor Signal for Real Time In-Cylinder Pressure Offset Compensation. SAE Int. J. Engines 2012, 5, 672–682. [Google Scholar] [CrossRef]
  6. Al-Durra, A.; Canova, M.; Yurkovich, S. A real-time pressure estimation algorithm for closed-loop combustion control. Mech. Syst. Signal Process. 2013, 38, 411–427. [Google Scholar] [CrossRef]
  7. Brunt, M.F.J.; Pond, C.R. Evaluation of Techniques for Absolute Cylinder Pressure Correction; SAE Technical Paper 970036; SAE International: New York, NY, USA, 1997. [Google Scholar]
  8. Lim, B.; Lim, I.; Park, J.; Son, Y.; Kim, E. Estimation of the Cylinder Pressure in a SI Engine Using the Variation of Crankshaft Speed; SAE Technical Paper 940145; SAE International: New York, NY, USA, 1994. [Google Scholar]
  9. Leonhardt, S.; Norbert, M.; Isermann, R. Methods for Engine Supervision and Control Based on Cylinder Pressure Information. Mechatronics 1999, 4, 235–245. [Google Scholar] [CrossRef]
  10. Müller, N.; Isermann, R. Control of Mixture Composition Using Cylinder Pressure Sensors; SAE Technical Paper 2001-01-3382; SAE International: New York, NY, USA, 2001. [Google Scholar]
  11. Randolph, A.L. Methods of Processing Cylinder-Pressure Transducer Signals to Maximize Data Accuracy; SAE Technical Paper 900170; SAE International: New York, NY, USA, 1990. [Google Scholar]
  12. Lee, K.; Cho, S.; Kim, N.; Min, K. A study on combustion control and operating range expansion of gasoline HCCI. Energy 2015, 91, 1038–1048. [Google Scholar] [CrossRef]
  13. Verschaeren, R.; Schaepdryver, W.; Serruys, T.; Bastiaen, M.; Vervaeke, L.; Verhelst, S. Experimental study of NOx reduction on a medium speed heavy duty diesel engine by the application of EGR (exhaust gas recirculation ) and Miller timing. Energy 2014, 76, 614–621. [Google Scholar] [CrossRef] [Green Version]
  14. Pipitone, E.; Beccari, A. Reliable TDC position determination: A comparison of different thermodynamic methods through experimental data and simulations. In Proceedings of the 17th SAE Brasil International Mobility Technology Congress Exposition, Sao Paulo, Brazil, 7–9 October 2008.
  15. Nilsson, Y.; Eriksson, L. Determining TDC Position Using Symmetry and Other Methods Reprinted From: Modeling of Spark Ignition Engines. In Proceedings of the 2004 SAE World Congress, Detroit, MI, USA, 8–11 March 2014.
  16. Hribernik, A. Statistical Determination of Correlation Between Pressure and Crankshaft Angle During Indication of Combustion Engines; SAE Technical Paper 982541; SAE International: New York, NY, USA, 1998. [Google Scholar]
  17. Stas, M.J. Thermodynamic Determination of T.D.C. In Piston Combustion Engines; SAE Technical Paper 960610; SAE International: New York, NY, USA, 1996. [Google Scholar]
  18. Pipitone, E.; Beccari, A. Determination of TDC in internal combustion engines by a newly developed thermodynamic approach. Appl. Therm. Eng. 2010, 30, 1914–1926. [Google Scholar] [CrossRef]
  19. Tunestål, P. TDC Offset Estimation from Motored Cylinder Pressure Data based on Heat Release Shaping. Oil Gas Sci. Technol. 2011, 66, 705–716. [Google Scholar] [CrossRef]
  20. Pinchon, P. Calage thermodynamique du point mort haut des moteurs à piston. Oil Gas Sci. Technol. 1984, 39, 93–111. [Google Scholar] [CrossRef]
  21. Wang, X.B.; Deng, K.Y.; He, F.Z.; Zhou, Z.H. A thermodynamics model for the compression and expansion process during the engine’s motoring and a new method for the determination of TDC with simulation technique. Appl. Therm. Eng. 2007, 27, 2003–2010. [Google Scholar] [CrossRef]
  22. Chang, H.; Zhang, Y.; Chen, L. An applied thermodynamic method for correction of TDC in the indicator diagram and its experimental confirmation. Appl. Therm. Eng. 2005, 25, 759–768. [Google Scholar] [CrossRef]
  23. Polanowski, S. Determination of location of Top Dead Centre and compression ratio value on the basis of ship engine indicator diagram. Pol. Marit. Res. 2008, 15, 59–64. [Google Scholar] [CrossRef]
  24. Heywood, J.B. Internal Combustion Engine Fundamentals; McGraw-Hill Book Co.: Singapore, 1988. [Google Scholar]
  25. Chase, M. NIST-JANAF Thermochemical Tables; American Chemical Society: Washington DC, USA; American Institute of Physics for the National Institute of Standards and Technology: Woodbury, NY, USA, 1998. [Google Scholar]
  26. Wimmer, A.; Pivec, R.; Sams, T. Heat Transfer to the Combustion Chamber and Port Walls of IC Engines—Measurement and Prediction; SAE Technical Paper 2000-01-0568; SAE International: New York, NY, USA, 2000. [Google Scholar]
  27. Hohenberg, G.F. Advanced Approaches for Heat Transfer Calculations; SAE Technical Paper 790825; SAE International: New York, NY, USA, 1979. [Google Scholar]
  28. Ceviz, M.A.; Çavuşoğlu, B.; Kaya, F.; Öner, İ.V. Determination of cycle number for real in-cylinder pressure cycle analysis in internal combustion engines. Energy 2011, 36, 2465–2472. [Google Scholar] [CrossRef]
  29. Payri, F.; Luján, J.M.; Martín, J.; Abbad, A. Digital signal processing of in-cylinder pressure for combustion diagnosis of internal combustion engines. Mech. Syst. Signal Process. 2010, 24, 1767–1784. [Google Scholar] [CrossRef]
Figure 1. (a) TDC offset variations (±1, 3 °CA) of the pressure trace with respect to the crank angle at 2000 1/min and 100 Nm; (b) detailed view.
Energies 10 00143 g001
Figure 2. (a) ROHR curves of the TDC offset variations (±1, 3 °CA) dependent of crank angle at 2000 1/min and 100 Nm; (b) detailed view.
Energies 10 00143 g002
Figure 3. (a) Pressure offset variations (±0.5, 1 bar) depending on the crank angle at 2000 1/min and 100 Nm; (b) detailed view.
Energies 10 00143 g003
Figure 4. (a) ROHR curves of the pressure offset variations (±0.5, 1 bar) dependent of crank angle at 2000 1/min and 100 Nm; (b) detailed view.
Energies 10 00143 g004
Figure 5. Values of the I c o m and I e x p depending on TDC offset variation.
Energies 10 00143 g005
Figure 6. Values of the I c o m and I e x p depending on pressure offset variation.
Energies 10 00143 g006
Table 1. Values of terms dependent on pressure offset.
Angle (°CA)−70−40090120
Term (a)−1.30 × 100−1.04 × 100−9.23 × 10−31.44 × 1001.03 × 100
Term (b)−1.87 × 10⁻¹−1.54 × 10−12.21 × 10−31.89 × 10−11.76 × 10−1
Term (c)2.16 × 10−11.93 × 10−11.77 × 10⁻³−2.20 × 10⁻¹−2.20 × 10⁻¹
Term (d)2.23 × 10−21.69 × 10−21.45 × 10−24.34 × 10−25.30 × 10⁻²
Sum−1.24 × 100−9.89 × 10−19.21 × 10−31.46 × 1001.04 × 100
Table 2. Values of terms dependent on the TDC offset.
Angle (°CA)−70−40090120
Term (a)1.20 × 10−14.62 × 10−18.98 × 10−51.52 × 10−13.92 × 10⁻²
Term (b)2.31 × 10−21.10 × 10−1−1.07 × 10−39.23 × 10−23.32 × 10⁻²
Term (c)4.58 × 10−21.66 × 10−12.90 × 10−54.69 × 10−21.24 × 10⁻²
Term (d)−3.21 × 10⁻²−1.49 × 10⁻¹−8.69 × 10⁻⁴−1.17 × 10⁻¹−4.68 × 10⁻²
Term (e)−2.47 × 10⁻¹−8.10 × 10−11.19 × 100−3.91 × 10⁻¹−1.27 × 10⁻¹
Term (f)−2.62 × 10⁻³−9.76 × 10⁻³−1.16 × 10−35.05 × 10−31.93 × 10⁻³
Sum−9.28 × 10⁻²−2.32 × 10−11.19 × 100−2.12 × 10⁻¹−8.70 × 10⁻²
Table 3. PSA engine characteristics.
EnginePSA DV6ATED4
Cylinders4, inline
Displacement1560 cm3
Bore/stroke75/88.3 mm
Compression ratio18:1
Maximum power66 kW @ 4000 1/min
Maximum torque215 Nm @ 1750 1/min
Table 4. MAN engine characteristics.
EngineMAN D 0826 LOH 15
Cylinders6, inline
Displacement6870 cm3
Bore/stroke108/125 mm
Compression ratio18:1
Maximum power162 kW @ 2400 1/min
Maximum torque825 Nm @ 1400–1700 1/min
Table 5. Calculated pressure and TDC offsets and their absolute errors for the PSA engine and operating point 2000 1/min and 100 Nm using the off-line method.
Calculated Pressure Offset
p\TDC−3−1013
−100,000−98,899−99,526−98,784−98,728−99,211
−50,000−48,841−49,526−48,784−48,728−49,211
0115947412161272789
50,00051,15950,47451,21651,27250,789
100,000101,159100,474101,216101,272100,789
Calculated TDC Offset
p\TDC−3−1013
−100,000−2.980−0.9860.0281.0273.052
−50,000−2.973−0.9860.0281.0273.052
0−2.973−0.9860.0281.0273.052
50,000−2.973−0.9860.0281.0273.052
100,000−2.973−0.9860.0281.0273.052
Absolute Difference—Pressure Offset
p\TDC−3−1013
−100,0001100.56473.971216.021272.14788.56
−50,0001158.55473.961216.021272.14788.56
01158.55473.961216.021272.14788.56
50,0001158.55473.961216.021272.14788.56
100,0001158.55473.961216.021272.14788.56
Absolute Difference—TDC Offset
p\TDC−3−1013
−100,0000.0200.0140.0280.0270.052
−50,0000.0270.0140.0280.0270.052
00.0270.0140.0280.0270.052
50,0000.0270.0140.0280.0270.052
100,0000.0270.0140.0280.0270.052
Table 6. Number of iterations for the PSA engine and operating point 2000 1/min and 100 Nm using the off-line method.
p\TDC−3−1013
−100,00022112
−50,00022112
022112
50,00022112
100,00022112
Table 7. Calculated pressure and TDC offsets and their absolute errors for the PSA engine and operating point 2000 1/min and 100 Nm using the on-line method.
Calculated Pressure Offset
p\TDC−3−1013
−100,000−101,499−101,883−101,986−101,946−101,565
−50,000−51,286−51,883−51,986−51,946−51,565
0−1286−1883−1986−1946−1565
50,00048,71448,11748,01448,05448,435
100,00098,71498,11798,01498,05498,435
Calculated TDC Offset
p\TDC−3−1013
−100,000−3.213−1.259−0.2660.7402.779
−50,000−3.218−1.259−0.2660.7402.779
0−3.218−1.259−0.2660.7402.779
50,000−3.218−1.259−0.2660.7402.779
100,000−3.218−1.259−0.2660.7402.779
Absolute Difference—Pressure Offset
p\TDC−3−1013
−100,000−1499.16−1883.05−1985.84−1946.48−1565.04
−50,000−1286.08−1883.01−1985.84−1946.48−1565.04
0−1286.08−1883.01−1985.84−1946.48−1565.04
50,000−1286.08−1883.01−1985.84−1946.48−1565.04
100,000−1286.08−1883.01−1985.84−1946.48−1565.04
Absolute Difference—TDC Offset
p\TDC−3−1013
−100,000−0.213−0.259−0.266−0.260−0.221
−50,000−0.218−0.259−0.266−0.260−0.221
0−0.218−0.259−0.266−0.260−0.221
50,000−0.218−0.259−0.266−0.260−0.221
100,000−0.218−0.259−0.266−0.260−0.221
Table 8. Number of iterations for the PSA engine and operating point 2000 1/min and 100 Nm using the off-line method.
p\TDC−3−1013
−100,00022222
−50,00022222
022222
50,00022222
100,00022222
Table 9. Calculated pressure and TDC offsets and their absolute errors for the MAN engine and operating point 2400 1/min and 373 Nm using the off-line method.
Calculated Pressure Offset
p\TDC−3−1013
−100,000−99,287−99,747−99,133−99,237−99,366
−50,000−49,279−50,082−49,136−49,237−49,366
0721−82864763634
50,00050,72149,91850,86450,76350,634
100,000100,72199,918100,864100,763100,634
Calculated TDC Offset
p\TDC−3−1013
−100,000−2.917−0.972−0.0111.0063.060
−50,000−3.001−1.028−0.0111.0063.060
0−3.001−1.028−0.0111.0063.060
50,000−3.001−1.028−0.0111.0063.060
100,000−3.001−1.028−0.0111.0063.060
Absolute Difference—Pressure Offset
p\TDC−3−1013
−100,000712.86252.90866.71762.75634.48
−50,000720.74−82.36864.15762.74634.48
0720.74−82.36864.15762.74634.48
50,000720.74−82.36864.15762.74634.48
100,000720.74−82.36864.15762.74634.48
Absolute Difference—TDC Offset
p\TDC−3−1013
−100,0000.0830.0280.0280.0060.060
−50,000−0.001−0.0280.0280.0060.060
0−0.001−0.0280.0280.0060.060
50,000−0.001−0.028−0.0110.0060.060
100,000−0.001−0.028−0.0110.0060.060
Table 10. Number of iterations for the MAN engine and operating point 2400 1/min and 373 Nm using the off-line method.
p\TDC−3−1013
−100,00022112
−50,00022112
022112
50,00022112
100,00022112

