Abstract
Causality is a unique feature of human perception. We present here a behavioral investigation of the influence of physical causality during visual pursuit of object collisions. Pursuit and saccadic eye movements of human subjects were recorded during ocular pursuit of two concurrently launched targets, one that moved according to the laws of Newtonian mechanics (the causal target) and the other one that moved in a physically implausible direction (the non-causal target). We found that anticipation of collision evoked early smooth pursuit decelerations. Saccades to non-causal targets were hypermetric and had latencies longer than saccades to causal targets. In conclusion, before and after a collision of two moving objects the oculomotor system implicitly predicts upcoming physically plausible target trajectories.
Introduction
The visual world is organized according to a set of priors (Seriès and Seitz, 2013). For instance, in a natural scene the illumination is expected to come from above. Another essential set of priors concerns the laws of physics. Objects behave according to certain laws and principles like causality. Humans experience cause-effect relationships even during the observation of very simple collisions referred to as ‘launching events’ (Michotte, 1946/1963). In these events a moving object, referred to as the launcher, makes contact with a stationary one, referred to as the target that subsequently starts to move. Human observers quickly attribute physical causality to this type of event if the trajectories of the objects are in agreement with the laws of mechanics (Young and Sutherland, 2009; Young and Falmier, 2007). Importantly, subjects do not report elementary aspects of the stimuli like motion and stopping of the launcher followed by motion of the target. On the contrary, most subjects report a global perception of the event. Therefore, Gestalt psychology suggested that causality perception is processed implicitly by a rapid pre-attentional mechanism that is encapsulated within the early visual system (see e.g. Wagemans et al., 2006).
It is a matter of debate which part of causality perception is a cognitive process (explicit or inferential) or a perceived purely implicitly (low-level) perceptual phenomenon. So far, no reliable neuroscientific evidence would allow to distinguish between these two alternatives. On the one hand, findings in human infants indicate that we perceive physical launching very early in development (Saxe and Carey, 2006; Newman et al., 2008; Muentner and Carey, 2010), which supports the assumption of an implicit causality detector at a low level of the human visual systems that would operate without any acquired knowledge. On the other hand, contextual effects on causality judgments in uncertain events show the potential contribution of top-down mechanisms also, i.e. the possibility for modulation of perceptual impressions of event causation by higher-level cognitive processes (Badler et al., 2012; Blos et al., 2012; Wende et al., 2013). Very likely, both interact and contribute to the process of attributing physical causality to an event.
A simple collision event is more direct and less abstract than all other types of causal relations. For instance, social interactions require inferences on additional invisible “causal chains” as goal attributions in social contexts (see e.g. Scholl and Tremoulet, 2000, Tremoulet and Feldman, 2006; Schlottmann et al., 2006). Likewise, causal relations between semantic concepts have a higher abstractness than launching stimuli (Wende et al, 2012). Only simple collisions could be a purely phenomenological experience of causation. Although this “bottom-up” causality perception is a well-established phenomenon in behavioral psychology (Schlottmann and Shanks, 1992) its neural processes are unknown. Functional neuroimaging findings show that neural activity in the right frontal and parietal cortex correlates with explicit judgments of causality in launching stimuli (Fugelsang et al., 2005; Fonlupt, 2003; Wende et al., 2013). Evidence from brain lesions revealed specifically that the right hemisphere is likely to be responsible of causality perception of moving objects (Roser et al., 2005). However, a major limitation of these measures is their reliance on explicit task instructions given to subjects. Explicit responses or ratings inevitably evoke “top-down” cognitive processes.
We recently showed the existence of an oculomotor bias towards causal motion direction using a tool-launching display (Badler et al., 2010) and shorter reaction times (saccadic latencies) for pursuit of causal than for noncausal motions (Badler et al., 2012). Because human subjects do not control their eye movements voluntarily during pursuit initiation, these results support the hypothesis of an implicit prior for causality in the human visual system. More particularly, prediction mechanisms of the oculomotor system might incorporate an implicit “Gestalt” of physical causation.
During the observation of an ongoing launching motion sequence, the trajectory of the launched target usually follows the same direction as the launcher (see e.g. Choi and Scholl, 2006).The finding of an oculomotor preference for causality could also be explained by suggesting that trajectories that are co-linear with previous motion are preferentially pursued. This will be referred to as the ‘motion continuation’ hypothesis. By contrast, in Michotte’s framework of an early visual ‘causality detector’, physical causation would be perceived as the most likely event, according to the general principle of transfer of momentum (Michotte, 1946/1963); thus, ocular pursuit of a visual target motion should be in favor of the target that moves in a causal direction, even if it deviates from colinearity with the launcher. According to Newtonian mechanics, the causal direction of motion of a target after a collision is provided by the line joining the center of masses of the two colliding objects. This hypothesis will be referred to as the ‘causality’ hypothesis.
In order to confront the continuation and causality hypotheses in the same trial, we developed a modified launching display consisting of a large round object (the ‘launcher’) that collides with two stationary smaller discs and simultaneously sets them into motion. One target moves in a trajectory that has a different direction than the launcher, but is in accordance with the laws of mechanics (referred to as the ‘causal target’).The second target moves straight ahead, thus following a physically implausible trajectory (the ‘non-causal target’). Configurations were randomized so that subjects did not know before the collision which target would move causally. Subjects were required to pursue the launcher with the eyes and to freely select and pursue one of the two smaller targets that were set into motion after collision. We hypothesized that if there is a low-level causality detector, selection of the causal target should induce stronger anticipatory pursuit and a shorter latency of the initial catch-up saccade. On the other hand, selection of the noncausal target would likely violate prior anticipation of a causal, i.e. physically plausible, trajectory, and evoke an oddball perception as prediction error signal that lead to extra processing effort and longer saccadic latencies.
Methods
Subjects
There were 16 participants in the experiment. Except for two external volunteers they were either students or members of the University of Louvain (20 to 33 years old). All subjects had normal or corrected-to-normal vision and no neurological or psychiatric illnesses reported. Participants gave written informed consent to participate but were naive regarding the purpose of the experiments. The experiments were carried out in accord with the declaration of Helsinki and were approved by the Ethics Committee of the Faculty of Medicine (Belgian convention number B403201112044).
Experimental setting and design
Stimuli were displayed on a LaCie Blue CRT screen (800·600 pixels at 100 Hz) at 70 cm from the observer, whose head was held by a chin and front rest.
The left eye position was tracked by an Eyelink 1000 (SR Research Ltd, Kanata, Ontario, Canada). We used the Psychtoolbox running on MATLAB (version 6.5, The Mathworks Inc., Natick, MA) to generate the visual stimulation as frame-by-frame animation (one frame corresponding to 10ms).
In total, three types of experimental stimuli were implemented in the pursuit free selection task. Each trial (~3s) started with an initial fixation period of 750ms. In the launching condition, the red-colored fixation cross appeared at the left or right border of the mask, indicating the direction from which the launcher (a big round object, size of 31 pixels; visual angle of 3 deg) moved from the periphery inside the visible screen range (time of appear-ance ~1250ms after trial start). The fixation cross started to move with the launcher at a similar continuous velocity of 4pixels/frame or 16 deg/s, as soon as it was overlapping with its center. At 2320ms after trial start, the launcher stopped at a central position after contact with two smaller round objects of equal size, which then started to move, one in a causal direction (and oblique, target C) and the second one in a non-causal horizontal direction (non-causal target, NC; see Figure 1 A). Both targets had a radius of 22 pixels (visual angle of 2 deg) which corresponded to half of the launcher area for each of the targets taking as representation of mass the number of pixels. At the time of collision, the line joining the center of masses of the causal target and the launcher formed a 45 degree angle with the trajectory of the launcher. The non-causal target trajectory was in the same direction as the launcher (horizontal). It moved also at a vectorial velocity of 4 pixels/frame or 16 deg/s. Steady-state pursuit was evoked during motion of the launcher before collision.
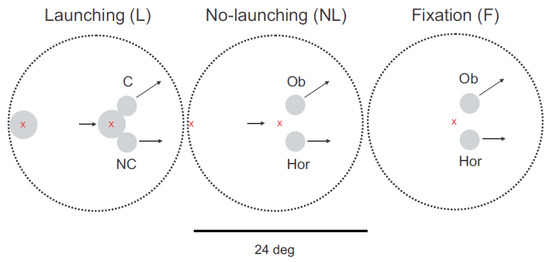
Figure 1.
Experimental stimuli. Launching condition: the launcher (‘L’, a round shape of 3 deg size) moved horizontally towards the center at a constant velocity of 16 deg/s. The moment L made contact with both targets, its motion stopped and targets started to move (moment of collision/target motion onset; after 1second of visible launcher motion onset). No launching (‘NL’): in this condition, only a small fixation cross moved at the same velocity than L before targets started to move. Stationary fixation (‘F’): in this condition targets were selected out of stationary fixation located centrally Overall trial length: ~3000ms. C: causal; NC: non-causal; Ob: oblique; H: horizontal. The dashed circle represents the visible aperture on the screen (diameter: 24 deg).
Two control conditions were implemented. The ‘nolaunching’ condition involved a stimulus variant in which a small fixation cross was moving in place of the launcher (see Figure 1B). This condition was in all other aspects identical to the launching condition. Comparing the launching and no-launching conditions allowed us to distinguish the influence of visuo-spatial factors of physical causality (observation of the launcher in contact to the targets, i.e. collision perception) from other factors induced by pursuit of a moving object before selection of one of the two targets. The second control condition, referred to as ‘fixation’, encompassed a period of stationary fixation of a centrally located location between the two targets (see Figure 1 C). In this case, pursuit was initiated only at target motion onset. This condition controls for factors other than causality that could have had a confounding influence on eye-movements (i.e. configuration of target motion direction with respect to the screen, horizontal / oblique, oculomotor anisotropies).
Experimental procedure
One block consisted of up 64 trials. Within one block, stimulus configuration (position of the causal target left or right with respect to the launcher trajectory, up or down with respect to launcher trajectory) and direction of motion (left-to-right or right-to-left) were randomized. Between trials, a pause of 500ms was implemented. Conditions were presented separately in alternating blocks with breaks for the respective instructions in-between the conditions. Subjects were presented between 3 and 7 blocks per condition, with a minimum of 182 and a maximum of 441 acquired trials per subject and condition.
Data collection and analysis
Eye Link data co-registration with calibration/noise correction and single subject data analysis (saccade detection and pursuit interpolation) was performed in Matlab. Group data were analyzed using SPSS (IBM). An acceleration threshold of 500 deg/s2 was used to detect saccades. Minimum saccadic duration was 15ms. The smooth pursuit velocity signal during saccades was linearly interpolated from the velocity before and after its occurrence (see Coppe et al., 2010). Therefore, trials were excluded if a blink was found from -350 to 500ms after collision.
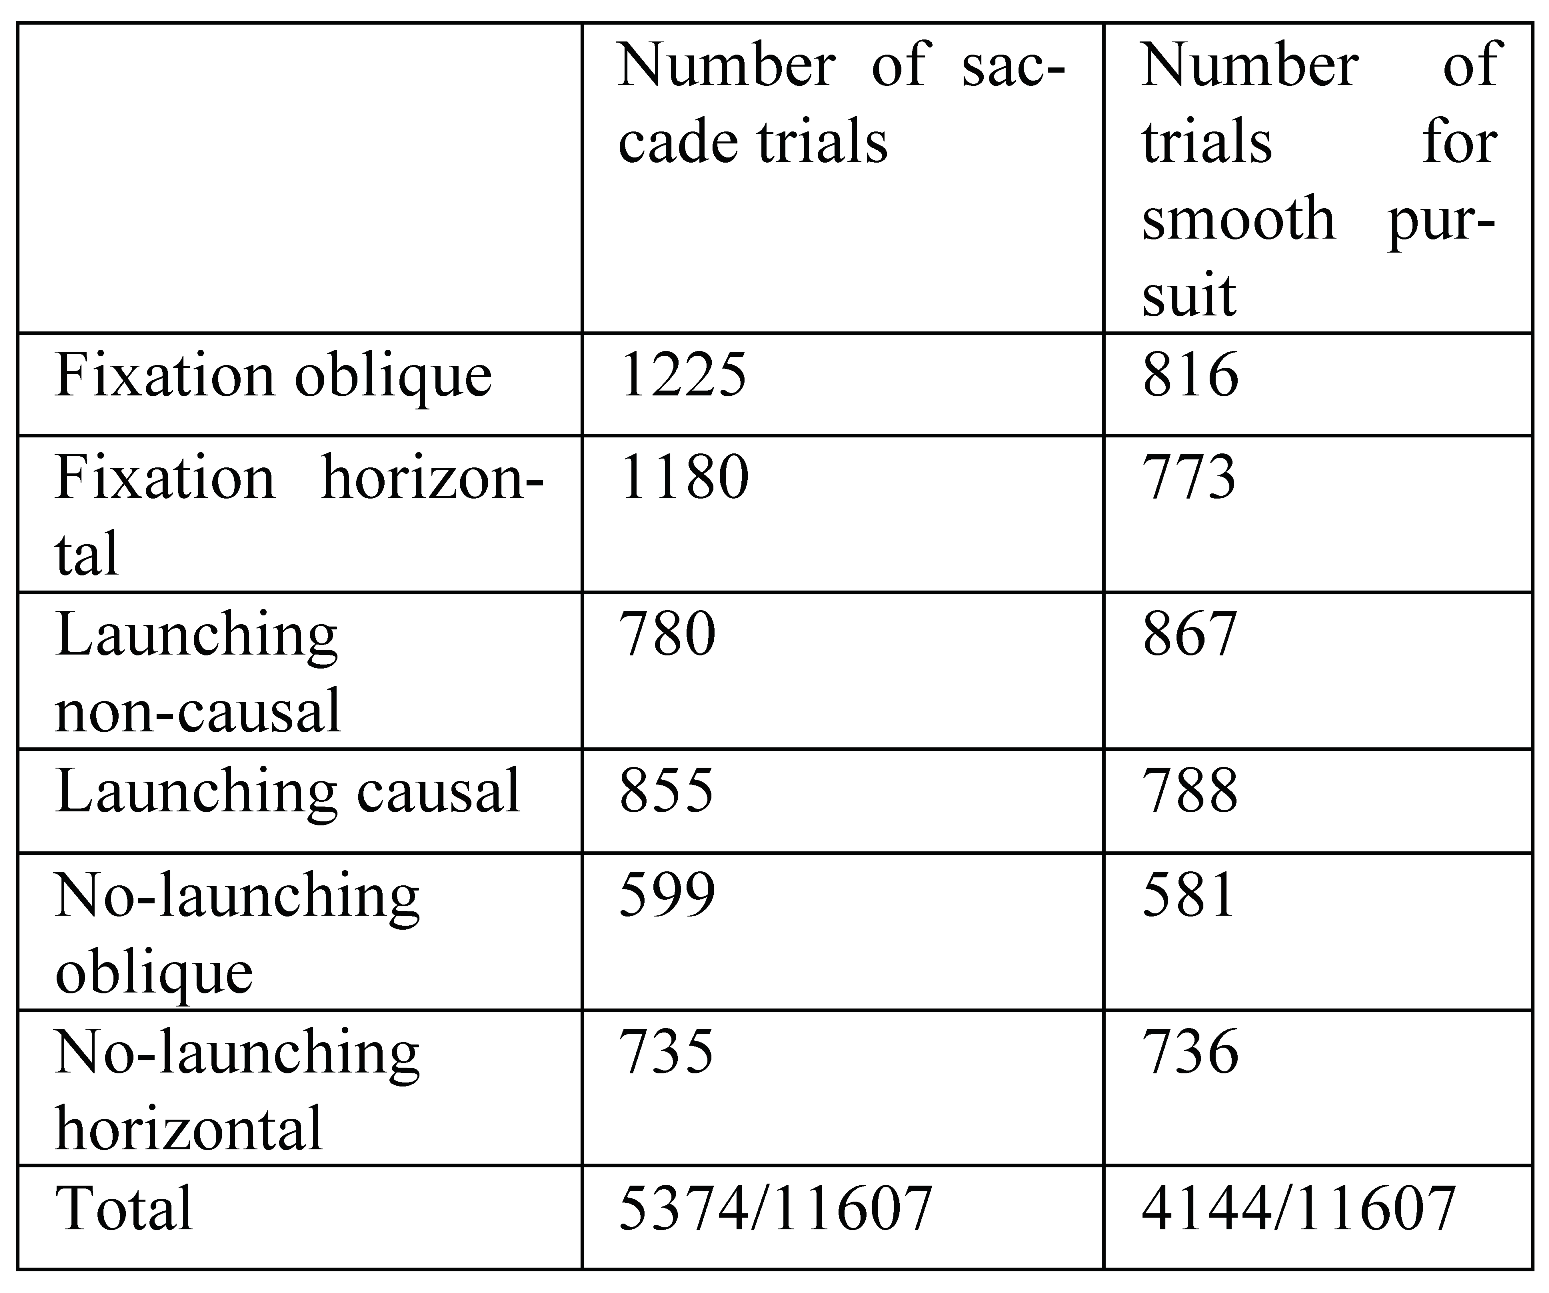
The present analysis will focus on the influence of causality on anticipatory pursuit and the first catch-up saccade. For the smooth pursuit analysis vectorial eye velocity traces during saccades were ‘cut out’ and replaced with a linear interpolation of velocity before and after the saccade. Interpolation cut-offs were set at 25ms before saccade onset and 40ms after offset. Trials were excluded from the smooth pursuit analysis if the time of local maximum in vectorial smooth velocities was at the data points at beginning or at end of for the extracted time window of interest (350ms before to 350ms after collision). Furthermore trials were excluded if the standard deviation exceeded the mean of vertical velocity before target motion onset or with vectorial smooth pursuit velocities overshoots (local maxima) of over 40 deg/s occuring in the time window of interest. Finally, visual inspection ensured that no other artifact was present in the smooth velocity traces. After visual inspection trials were also excluded from the smooth pursuit analysis if more than 12 saccades were detected in the whole trial period (evidence for a very low smooth pursuit gain); if more than 5 saccades were detected after collision (uncertain target selection) and if a saccade was detected from -100 to 80ms relative to collision/target motion onset (period of anticipatory pursuit analysis). Two participants who made more than ten saccades on average in a single condition were excluded. Table 1 summarizes the number of trials used in the analyses of saccadic and smooth pursuit responses. These stringent selection criteria were rendered necessary due to the large variability of oculomotor responses observed. For the statistical analyses of average vectorial eye velocities after collision in the two moving conditions, a less strict threshold was applied, disregarding such eventual overshoots except if they occurred in the time window after collision (number of trials given in brackets).
Saccades with latencies above 500ms were excluded assuming a lack of attention. Saccadic gain (ratio of saccade amplitude to initial error in position) had to be <5. This criterion was applied to exclude large over-shooting saccades probably not aimed at one of the two targets.

Table 1.
total number of observations for the different experimental conditions.
Table 1.
total number of observations for the different experimental conditions.
Dependent variables measured and statistical analysis We analyzed saccadic reaction times (latency of initial saccade after target motion onset, RT) and saccadic gain defined as the ratio of initial position error to the center of the selected target at the onset of the first saccade after collision (or target motion onset) to the amplitude of that saccade.
Effects of behavioral responses (causal/non-causal target selections with the initial saccade after target motion onset) on saccadic latencies and gain were analyzed in univariate analysis of Variance (ANOVA).
The group averages of interpolated vectorial pursuit velocities over time per condition and selection, collapsed across subjects, stimulus position and direction, were calculated in Matlab (2013). A Wilcoxon-Mann-Whitney-Test (Ranksum test) using a sequential Bonferroni correction (α=0.01) was applied to test for significant differences between pursuit velocity averages over time. To assess the predictive effects of average anticipatory pursuit velocity (average interpolated vectorial eye velocity 100 to 90ms before target motion onset) on target selection per moving condition (launching and nolaunching), binary logistic regressions were calculated separately for the two conditions using SPSS 21 (IBM, inc.)
Results
Smooth pursuit
Figure 2 shows eye movement recordings during all conditions tested in the present study, launching (left column), no-launching (middle column) and fixation (right column).
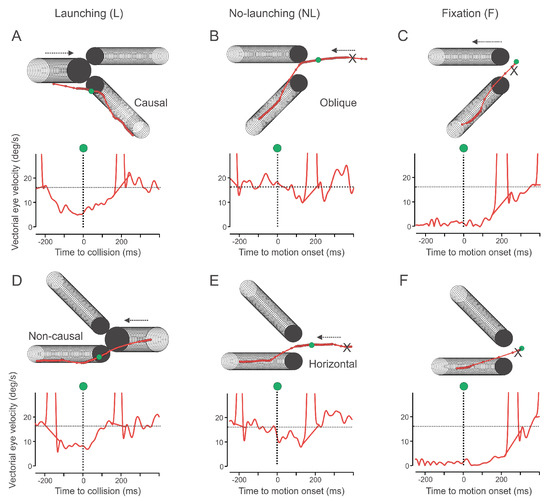
Figure 2.
Examples of representative single trials. Upper row: Causal or oblique selections, lower row: non-causal or horizontal selections. Upper plots shows the X/Y trajectory of eye position before and after collision (time window: from 250ms before until 400ms after target motion onset, represented by a dashed line and a green disk). Dark circles represent the position of the moving objects on the screen, one per CRT. Lower plots show vectorial eye velocity (red). The ‘X’ symbol shows the position of initial fixation.
The upper of Figure 2 row shows eye movement traces when the causal or oblique target was selected (A to C) and the lower row traces when the non-causal or horizontal target was selected (D to F). On average, eye velocity rapidly decayed before expected collision in the launching condition (see vertical dashed line and green dot on Figure 2 for representative single trials; across subjects the average minimum vectorial velocity for causal and non-causal selections were 9.9 deg/s and 9.7deg/s respectively; time of local velocity minima were 99ms or 63ms before collision respectively). This anticipatory deceleration was less prominent in the no-launching condition where eye velocity remained at a sustained level throughout the trial (minimum vectorial velocity for oblique and horizontal selections were 12.0 deg/s and 13.4 deg/s respectively; time of local minima: 28ms before and 58ms after collision respectively). Figure 3 shows that average pursuit velocities over time significantly differed between target selections only for the period after the target motion onset, and for the predictive period in the NLcondition (Ranksum test with Bonferroni correction for multiple comparisons, α=0.01; see lower trace on Figure 3 for a graphical representation of significance).
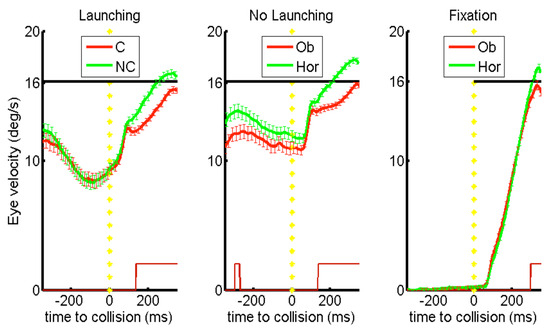
Figure 3.
Smooth pursuit average velocities over time per condition. Graphs show vectorial eye velocity per condition (Launching/No-Launching/Fixation) and target selection. Red lines indicate that the first saccade after collision was closer to the causal/oblique target. Light green lines indicate saccades to the non-causal/horizontal target). Bars indicate standard deviation of average pursuit velocity per 10ms for all subjects. The bottom thin red line indicates significant differences (Ranksum-test with Bonferroni correction, alpha=0.01).
A significant difference of between-condition pursuit velocity averages over time was however found when comparing selections of oblique and horizontal targets between the two moving conditions (Ranksum test with Bonferroni correction for multiple comparisons, α=0.01; see lower trace on Figure 4 for a graphical representation of significance).
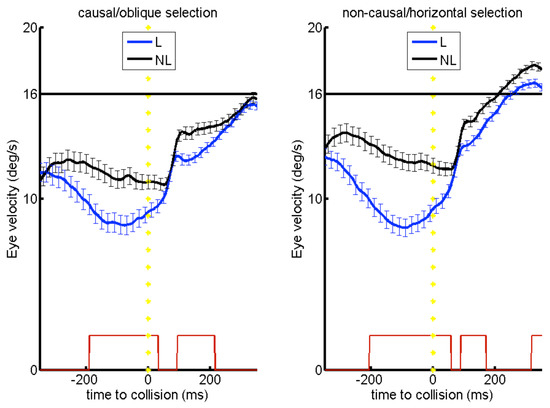
Figure 4.
Smooth pursuit average velocities over time per target selection. Graphs show vectorial eye velocity per target selection (Left plot shows causal/oblique target selections, right plot shows non-causal/horizontal selections). Condition is color coded (Blue lines indicate Launching, black lines indicate No-Launching). Bars indicate standard deviation of average pursuit velocity per 10ms for all subjects. The bottom thin red line indicates significant differences (Ranksum-test with Bonferroni correction, alpha=0.01).
Moreover, average eye velocities 100ms before collision or target motion onset significantly differed between conditions (ANOVA, F=7.64, p=.016). Figure 5 shows that in the launching condition, there was no significant difference between the patterns of anticipatory pursuit deceleration as a function of subsequent target selection. This result is expected, given that the causal trajectory was randomly associated with the upper or lower target. However, in the no-launching condition, there was a significant difference between eye velocity traces before target motion onset. Logistic regression analysis for the two moving conditions revealed that in the no-launching condition, mean anticipatory eye velocity 100 to 90ms before target motion onset had a significant predictive influence on subsequent target selection [Chi-square (Wald)=31.40, df=1, p <.001]. In collision events, this influence was not present [Chi-square (Wald)=3.40, df= 1, p=.063].
After collision, selections of non-causal targets lead to overshooting pursuit velocities over time (see Figure 3) Average eye velocity after collision or target motion onset was 17±4 (n=764) and 18±3 deg/s (n=827) for causal and non-causal selections respectively (mean±SD). Overshooting velocity patterns were also found for horizontal targets in the no-launching condition (see Figure 3) Indeed, average eye velocity after target motion onset was 19±4 (n=714) and 17±4 deg/s (n=558) for oblique and horizontal selections respectively. Between the two moving conditions, the velocity traces of both types of over time also, as mainly pronounced in a later time of re-acceleration in no-launching than in launching (see Figure 4).
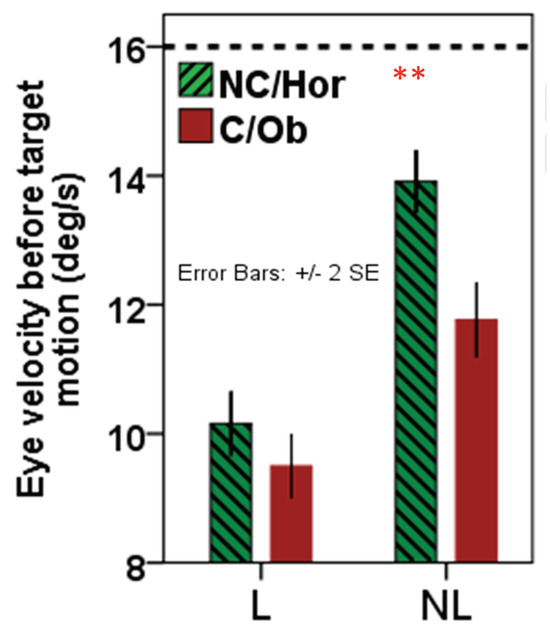
Figure 5.
Influence of anticipatory pursuit velocity on target selection? Vectorial pursuit velocities 100-90ms before collision or target motion onset per condition. The grey dotted line indicates target velocity. Bar plots indicate average anticipatory velocity 100-90ms before collision or target motion onset per condition and target selection.
Saccades
Test conditions (launching/no-launching/fixation) in interaction with target selection (non-causal vs causal) had a significant effect on saccadic latencies (ANOVA, F=18.78, p<.001). Selection itself had also a significant influence on latency (F=42.34, p<.001, mean latencies for oblique selections: 176 +/- 50ms; horizontal selections: 195 +/- 65ms). There was a significant effect of condition also in a two-factor ANOVA for launching/no-launching (F=10.31, mean difference launching-no launching 19ms, p=.003). In launching saccadic latencies were longer to non-causal than to causal targets (for non-causal targets: 210 ± 72ms, n=780, for causal targets: 178 ± 44ms, n=855; t=4.34, p<.001, see Figure 6, ‘L’).
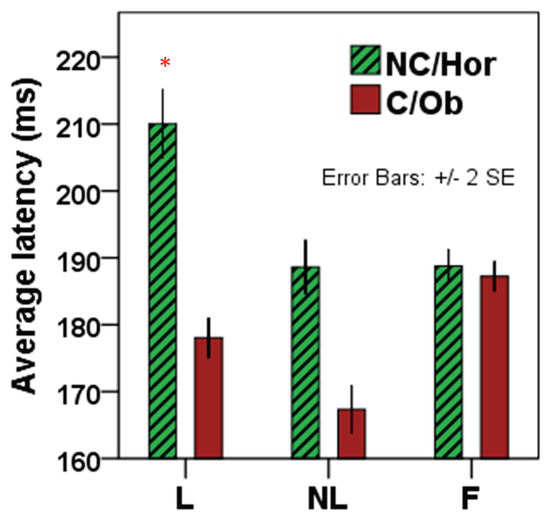
Figure 6.
Mean saccadic latencies per condition (Launching/No-Launching/Fixation) and target selection (color coded: red bars indicate that the first saccade after collision was closer to the causal/oblique target. Green, dashed bar plots indicate saccades to the noncausal/horizontal target). Plotted are group means/SDs for the first saccade after collision.
In the no-launching condition a difference in saccadic latencies between oblique and horizontal target selections was also observed but did not reach significance (mean latencies for oblique selections: 167 +/- 43ms, n=599; horizontal selections: 188 +/- 55ms, n=735, p= .736; see Figure 6 ‘NL’). No difference between saccadic latencies was found between selections of oblique/horizontal targets from a stationary fixation (mean latencies for oblique selections: 188 ± 40ms n=1225; horizontal selections: 187 +/- 44ms, n=1180; see Figure 6 ‘F’). Figure 7 shows the cumulative latency distribution for the same data set. A significant main effect of condition (Launching>No-Launching>Fixation) on the gain of the initial saccade after collision/target motion onset was found (F=21.84, p<.001). Saccades were more accurate in the launching condition (mean gain 1.02 ± 0.67, t=9.17, p<.001). In the no-launching condition initial saccades were more accurate (mean gain 0.89 ± 0.52) than in the fixation condition (mean gain: 0.71 ± 0.35; t=2.76,p=.006).
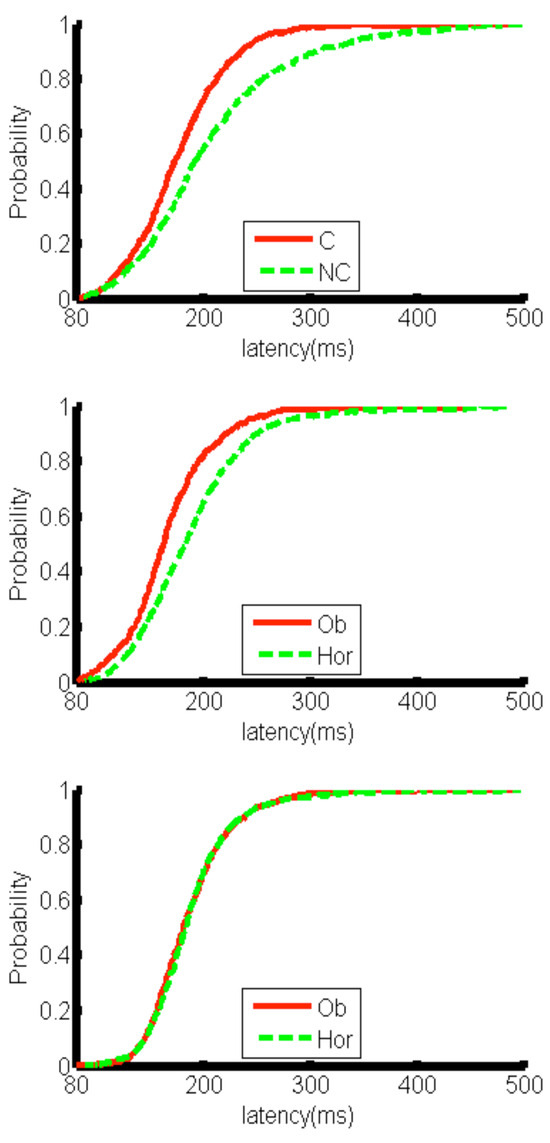
Figure 7.
Latency distributions of the first catch-up saccade after collision.
Discussion
We suggest that before collision of moving objects, anticipatory pursuit is guided by a “Gestalt” of physical causality. Smooth pursuit before collision more strongly decelerated in the launching condition. Compared to the no-launching condition, the deceleration was stronger and earlier before collision across the group of subjects. During launching, pursuit reacceleration occurred 40ms earlier than actual collision (see Figure 3). By contrast, in the no-launching condition reacceleration started only approximately 40ms after the onset of target motion (see Figure 4). In the no-launching condition, target selection depended of the anticipatory pursuit velocity before collision (see Figure 5). Indeed, average anticipatory pursuit velocity significantly predicted target selection in the no-launching condition with a faster velocity increasing the chance to select the horizontal (continuous) target. This shows that in the absence of a physical collision, a continuation of the mere motion direction does determine target selection behavior out of pursuit, at least when tracking one of two objects that are simultaneously launched into different directions (White, 2012).
Behaviorally, in the no-launching condition, dependent on the eye velocity before target motion onset subjects thus selected preferably the horizontal target (i.e., the higher the eye velocity during pursuit of the launcher motion, the more likely that subjects pursued the horizontal target at/after target motion onset, see Figure 3 and Figure 5).
Here it is noteworthy that in launching trials, during pursuit of the launcher moving but before collision, subjects did most frequently already make a saccade to a target and the anticipatory deceleration of the eye was then behaviorally reflected in the eye „breaking down“ on the target before collision (see Figure 2).
Contrarily, in no-launching trials, subjects did behaviorally not tend to preselect a target, but were pursuing the cross until the point where it stopped to move. Therefore the slopes of velocity over time differed between conditions; the average local minimum of eye velocity / point of re-acceleration was temporally shifted beyond the onset of target motion in no-launching, opposed to launching where re-acceleration started before the launcher even made contact with the two targets (see Figure 4).
At the behavioral level we can regard this result as support for the direction continuation hypothesis in absence of launching, from the point of view that a higher eye velocity ahead of target motion onset was leading more likely to a selection and pursuit of the “straightforwardly” (horizontally) moving target, opposed to no such predictive influence of eye velocity ahead of target motion onset in the launch condition. Opposed to that, a collision event is anticipated (i.e., pursuit of a launcher is triggering an earlier deceleration of the eye than in the no launching condition, see Figure 4), resulting in the behavior that at the point of impact the eye had to “react” to the (and that it does differently to the physically implausible than to the plausible) launch event from the (selected) target’s position (considering that the gaze position at the time of collision/target motion onset was most often already on one of the two targets, see Figure 2).
Overall, this indicates that when an actual launching is presented the general ‘motion continuation prior’ could be overruled by the underlying prior of physical plausibility as representation of a general law of nature (causality; Michotte, 1946/1963).
This interpretation is further supported by the result that saccades were more accurate in the launching condition. Saccadic latencies also significantly differed between causal and non-causal selections: subjects responded with prompter saccades in causal selections, whereas latencies of the initial saccade towards non-causal targets were significantly longer. This result confirms the bias of visual and oculomotor systems for perceptions of physical causality (Badler et al., 2010, 2012), extending previous evidence. Indeed, whereas in Badler et al. (2010) the configuration of the stimuli was not physically realistic with respect to the laws of mechanics, in the present study the relationship between mass (number of pixels) and motion trajectories was a simplified representation of Newtonian mechanics. Moreover, the different deceleration profiles in the two moving conditions (launching and no-launching) and their role in target selection is a new finding of the present study.
During pursuit of a moving object, implicit expectation of physical causation might indeed serve as “sensory prior” in the oculomotor systems producing the perception of launches as best continuation of motion and as a single event (causality).
The selective increase in saccade latency for non-causal target selections in the launching condition supports the assumption that non-causal target motion after a perceived physical collision is violating a form of “default prior/heuristic” of saccadic systems that monitor pursuit prediction. On average, the longest latencies were found for saccades to non-causal trajectories after launching. This increase in reaction time is likely reflecting a prediction error signal. A prediction error occurs if motion trajectory deviates from the prediction based on stimuli configuration (Adams et al., 2013). When selecting a non-causal target after a launch, the eye is thus following an “odd” direction of motion. This oddball effect induces a violation of the default anticipation of physical causality thus leading to longer reaction times for saccades (Figure 6 and Figure 7). Thus, results of the present study show that causality is probably represented at an early pre-attentional stage of visual-oculomotor processing as a form of implicit prediction about the future state of the world (Michotte, 1946/1963).
References
- Adams, R. A., S. Shipp, and K. J. Friston. 2013. Predictions not commands: active inference in the motor system. Brain Structure & Function 218, 3: 611–643. [Google Scholar]
- Ameqrane, I., P. Pouget, N. Wattiez, R. Carpenter, and M. Missal. 2014. Implicit and explicit timing in oculomotor control. PLoS One 9, 4: e93958. [Google Scholar] [CrossRef]
- Badler, J., P. Lefevre, and M. Missal. 2010. Causality attribution biases oculomotor responses. The Journal of Neuroscience 30, 31: 10517–10525. [Google Scholar] [CrossRef] [PubMed]
- Badler, J. B., P. Lefevre, and M. Missal. 2012. Divergence between oculomotor and perceptual causality. Journal of Vision 12, 5: 3. [Google Scholar] [CrossRef] [PubMed]
- Blos, J., A. Chatterjee, T. Kircher, and B. Straube. 2012. Neural correlates of causality judgment in physical and social context The reversed effects of space and time. Neuroimage 63: 882–893. [Google Scholar] [CrossRef]
- Choi, H., and B. J. Scholl. 2006. Measuring causal perception: connections to representational momentum? Acta Psychologica 123, 1-2: 91–111. [Google Scholar] [CrossRef]
- Coppe, S., J. J. de Xivry, M. Missal, and P. Lefevre. 2010. Biological motion influences the visuomotor transformation for smooth pursuit eye movements. Vision Research 50, 24: 2721–2728. [Google Scholar] [CrossRef]
- Fonlupt, P. 2003. Perception and judgement of physical causality involve different brain structures. Brain Research. Cognitive Brain Research 17, 2: 248–254. [Google Scholar] [CrossRef]
- Fugelsang, J. A., M. E. Roser, P. M. Corballis, M. S. Gazzaniga, and K. N. Dunbar. 2005. Brain mechanisms underlying perceptual causality. Brain Research. Cognitive Brain Research 24, 1: 41–47. [Google Scholar] [CrossRef]
- Michotte, A. 1963. The perception of causality. Oxford, England: Basic Books. [Google Scholar]
- Muentener, P., and S. Carey. 2010. Infants' causal representations of state change events. Cognitive Psychology 61, 2: 63–86. [Google Scholar] [CrossRef]
- Newman, G. E., H. Choi, K. Wynn, and B. J. Scholl. 2008. The origins of causal perception: evidence from postdictive processing in infancy. Cognitive Psychology 57, 3: 262–291. [Google Scholar] [CrossRef] [PubMed]
- Roser, M. E., J. A. Fugelsang, K. N. Dunbar, P. M. Corballis, and M. S. Gazzaniga. 2005. Dissociating processes supporting causal perception and causal inference in the brain. Neuropsychology 19, 5: 591–602. [Google Scholar] [CrossRef] [PubMed]
- Saxe, R., and S. Carey. 2006. The perception of causality in infancy. Acta Psychologica 123, 1-2: 144–165. [Google Scholar] [CrossRef]
- Schlottmann, A., E. D. Ray, A. Mitchell, and N. Demetriou. 2006. Perceived physical and social causality in animated motions: spontaneous reports and ratings. Acta Psychologica 123, 1-2: 112–143. [Google Scholar] [CrossRef]
- Schlottmann, A., and D. R. Shanks. 1992. Evidence for a distinction between judged and perceived causality. The Quarterly Journal of Experimental Psychology. A, Human experimental psychology 44, 2: 321–342. [Google Scholar] [CrossRef]
- Scholl, B. J., and K. Nakayama. 2004. Illusory causal crescents: misperceived spatial relations due to perceived causality. Perception 33, 4: 455–469. [Google Scholar] [CrossRef]
- Scholl, B. J., and P. D. Tremoulet. 2000. Perceptual causality and animacy. Trends in Cognitive Science 4, 8: 299–309. [Google Scholar] [CrossRef] [PubMed]
- Series, P., and A. R. Seitz. 2013. Learning what to expect (in visual perception). Frontiers in Human Neuroscience 7: 668. [Google Scholar] [CrossRef]
- Tremoulet, P. D., and J. Feldman. 2006. The influence of spatial context and the role of intentionality in the interpretation of animacy from motion. Perception & Psychophysics 68, 6: 1047–1058. [Google Scholar]
- Wagemans, J., R. van Lier, and B. J. Scholl. 2006. Introduction to Michotte's heritage in perception and cognition research. Acta Psychologica 123, 1-2: 1–19. [Google Scholar] [CrossRef]
- Wende, K. C., A. Nagels, J. Blos, M. Stratmann, A. Chatterjee, T. Kircher, and B. Straube. 2013. Differences and commonalities in the judgment of causality in physical and social contexts: An fMRI study. Neuropsychologia 51, 13: 2572–80. [Google Scholar] [CrossRef] [PubMed]
- Wende, K. C., B. Straube, M. Stratmann, J. Sommer, T. Kircher, and A. Nagels. 2012. Neural correlates of continuous causal word generation. Neuroimage 62, 3: 1399–407. [Google Scholar] [CrossRef] [PubMed]
- White, P. A. 2012. Visual impressions of causality: Effects of manipulating the direction of the target object's motion in a collision event. Visual Cognition 20: 121–142. [Google Scholar] [CrossRef]
- Young, M. E., and O. Falmier. 2008. Launching at a distance: the effect of spatial markers. Quarterly Journal of Experimental Psychology 61, 9: 1356–1370. [Google Scholar] [CrossRef]
- Young, M. E., and S. Sutherland. 2009. The spatiotemporal distinctiveness of direct causation. Psychonomic Bulletin & Review 16, 4: 729–735. [Google Scholar]
Copyright © 2016. This article is licensed under a Creative Commons Attribution 4.0 International License.