Article

Bank Competition Using Networks: A Study on an Emerging Economy

by
Molla Ramizur Rahman
* and
Arun Kumar Misra
Vinod Gupta School of Management, Indian Institute of Technology Kharagpur, Kharagpur 721302, West Bengal, India
*
Author to whom correspondence should be addressed.
J. Risk Financial Manag. 2021, 14(9), 402; https://doi.org/10.3390/jrfm14090402
Submission received: 16 June 2021 / Revised: 2 August 2021 / Accepted: 11 August 2021 / Published: 25 August 2021
(This article belongs to the Special Issue Bank Regulation and Risk Management)

Abstract

:
Interconnectedness among banks is a key distinguishing feature of the banking system. It helps mitigate liquidity problems but on the other hand, acts as a curse in propagating systemic risk at times of distress. Thus, as banks cannot function in isolation, this study uses the Contemporary Theory of Networks to examine banking competition in India for five distinct economic phases, emphasizing upon the Global Financial Crisis (GFC) and the ongoing COVID-19 pandemic. This paper proposes a Market Power Network Index (MPNI), which uses network parameters to measure banks’ market power. This network structure shows a formation of bank clusters that are involved in competition. Specifically, network properties, such as centroid, average path length, the distance of a node from the centroid, the total number of connections in the inter-bank market, and network density, do go on to explain banking competition. It is interesting to note that crisis periods witness a lower level of competition, with GFC bearing the least competition. The ongoing COVID-19 pandemic shows a lower trend, but it is of a higher magnitude than GFC. It was also found that big-sized, profitable, capital adequate, and public banks dominate the banking system. Notably, this study was conducted on a sample of 33 listed Indian banks from April 2008 to December 2020.

1. Introduction

A bank’s competitive attitude is majorly influenced by its risk-taking behavior; generally, banks with a higher risk-taking capability tend to be more competitive. However, such competitive nature without an efficient risk management framework often leads to insolvencies, which, in turn, may lead to ‘bank-run’, which is responsible for risk spillover onto the larger banking system, thereby resulting in systemic risk accumulation.
Interconnectedness within banks is a distinguishing feature of the banking system on the whole; this is responsible for propagating systemic risk (Yellen 2013), as was witnessed during the Global Financial Crisis (GFC) in 2007. Herein, it was the interconnectedness that led to the failure of a series of financial institutions due to the contagion effect. Generally, the contagion effect arises when individual banks have a higher degree of interconnectedness, thereby supporting the statement ‘too interconnected to fail’. Post GFC, banking regulators have adopted stricter regulatory frameworks, whereby they have considered micro-prudential measures that have been applied to financial institutions with a macro-prudential angle (Badarau and Lapteacru 2020). However, such regulatory frameworks have considerably changed the risk-taking attitude of banks, affecting the bank’s competitiveness.
There are two major hypotheses that serve as a fulcrum around which the theory of banking competition stands—competition stability and competition fragility. While the former (i.e., competition stability) is based on two approaches (i.e., ‘too big to fail’ and the ‘risk-shifting paradigm’), the latter (i.e., competition fragility) revolves around the ‘franchise value hypothesis’.

1.1. Competition Stability

Banking regulators from every country try hard to prevent bankruptcy, especially that of large-sized banks, as they have many interconnections due to their large asset base. Thus, if they fail, the effect of the failure would cascade on to their interconnections, thereby resulting in an aggregation of systemic risk (Clark et al. 2018), which ultimately turns multiple banks insolvent. Thus, to prevent multiple bank-run, regulators infuse capital into larger banks. With this capital infusion, larger banks look to regain their competitive advantage and tend to take on additional risks by disbursing loans at lower net-interest margins. This activity, in turn, again increases the probability of a bank failure, making the banking system more fragile (Mishkin 1999; Schaeck et al. 2009; Yeyati and Micco 2007). In fact, the situation is further amplified with the depositors’ confidence in large-sized banks, as they have the preconceived thought that the government would protect them in case of severe economic downturns, thereby increasing the chances of bank-run (Beck 2008).
On the other hand, banks with higher market power tend to charge higher interest rates from their borrowers. This causes borrowers to invest in riskier projects to achieve higher returns and hence reduce the probability of repaying their loans, aggregating the non-performing assets thereof (Boyd and De Nicolo 2005). Notably, this deteriorating asset quality makes the bank more vulnerable to crisis.

1.2. Competition Fragility Hypothesis

The competition fragility hypothesis highlights the negative relationship between competition and bank soundness, indicating that a bank with higher market power has lesser chances of bank-run. In fact, this hypothesis mainly revolves around a bank’s competitive environment along with its risk-taking attitude, which brings us to the franchise value hypothesis, which emphasizes the liability side of the balance sheet that is related to the bank’s depositors (Carletti and Hartmann 2002). For instance, a bank with high franchise value restricts itself from taking risks to maintain solvency. Notably, this ‘high franchise value’ only exists when banks have higher market power, characterized by reduced competition, risk-taking attitude, proper customer screening, and maintenance of high-profit margins. On the contrary, when banks have ‘reduced market power’, the franchise value shrinks, as at this point, banks tend to disburse loans at lower profit margins, simply to position themselves in a competitive environment. Importantly, such loan sanctioning takes place without the proper scrutinization of borrowers, thereby resulting in the accumulation of non-performing assets (NPAs).
Albaity et al. (2019) examined the competition fragility hypothesis for MENA countries between 2006–2015 and found that the hypothesis is more pronounced for Islamic banks than conventional banks. Further, they observed that banks with lower competition make higher profits, as they tend to disburse loans at higher margins. Examining the relationship between competition, efficiency, and stability during 2004–2014 for China, Hong Kong, Malaysia, and Vietnam, Phan et al. (2019) supported the competition fragility hypothesis.

1.3. Lerner Index and Its Extended Measure of Competition

The Lerner index is defined as the ratio of differences between price and marginal cost to price. This is a popular measure to estimate market power and is based on the static oligopoly theory. The Lerner index is based on the assumption that firms produce a single product. However, in today’s competitive environment, firms make multiple products, and banks are no exception; they too offer numerous products and services. Hence, the concept of the multi-product Lerner index (MPLI) evolved, where Ten Kate and Kate (2013) proposed a method to aggregate product by product elasticities instead of a group of products. Besides the above-mentioned drawback, there are other limitations of the Lerner index, which have been addressed and improved using the scale-corrected price-cost margin Lerner index (Spierdijka and Zaourasa 2018), the copula-based stochastic frontier model (Huang et al. 2017), the frontier-based measure using service line (Bolt and Humphrey 2015), etc.
Clerides et al. (2015) measured competition using three methods, namely the Lerner index, the adjusted Lerner index, and profit elasticity. They found that competition in the banking system was reduced from 1998 to 2006 but increased thereafter until 2008. Notably, the competition level was more for high-income regions but low in low-income countries. Thus, their study illuminated that with the approach of GFC, the banking system essentially became more competitive. Further, Bolt and Humphrey (2015), while examining competition for US banks, indicated that traditional measures such as the Lerner index, H-statistic, and HHI are not sufficient to assess bank competition. They suggested a frontier-based measure to estimate banking competition, using a service line capable of evaluating competition even with missing output and price data. Huang et al. (2017) proposed a method of estimating market power and cost efficiency in two markets using the copula-based stochastic frontier model. This method measures potential Lerner indices comprising of the Lerner index and marginal cost gap ratio. New Lerner indices are evaluated using three simultaneous equations consisting of cost frontier and two output price frontier equations.
Spierdijk and Zaouras (2017) indicated that the positive value of the Lerner index highlights market power, but its magnitude cannot rightly justify the strength of the market power. Spierdijka and Zaourasa (2018) proposed a scale-corrected price-cost margin preferred over the traditional Lerner index, as a positive Lerner index may measure banks’ capability to earn non-negative profits over market power, especially in situations of economies of scale, when margin-cost pricing yields negative profits. This corrected Lerner index was empirically validated for US banks (2000–2014), showing significant market power for sample banks. Huang et al. (2018) jointly estimated market power and cost efficiency in a single step and used copula to incorporate the dependency between the two. The Lerner index is used to measure market power, while the stochastic frontier method assesses cost efficiency.
The network theory is used to examine the interconnectedness between the global and other systemically important institutions (Andries et al. 2020). In fact, this theory is widely used to examine the contagion effect, resulting in systemic risk spillover. However, the network topology remains unexplored in assessing banking competition. In the past, several pieces of literature have indicated that a bank’s market power is influenced by size, capitalization, profitability, and phases of the economy (Bikker et al. 2006; Santoso et al. 2021; Torre Olmo et al. 2021; Apergis 2015). Bikker et al. (2006) implemented the extended version of Panzar–Rosse model to examine bank competition for 18,000 banks across 101 countries. They found that big-sized banks have more market power than small-sized banks. Torre Olmo et al. (2021) examined the impact of sustainable banking practices on the profitability and insolvency risks of 1236 banks from 48 countries. They noted that banks that operate in the market with a higher concentration have higher profitability. Bank capitalization has higher market power and thereby helps in enhancing stability (Santoso et al. 2021). Apergis (2015) used the Panzar–Rosse model to examine banking competition for emerging economies during 2000 to 2012; they found a decrease in banking competition after GFC.
In India, banking competition is strong and is characterized by a monopolistic nature (Li et al. 2019). This intense competition is due to various government policies that have promoted the same. Bhattacharya and Das (2003) highlighted a significant change in the market structure of banks during the early 1990s; interestingly, they remained majorly unaffected even with mergers during the latter part of the decade. Prasad and Ghosh (2005) stated that the Indian banking system is competitive with considerable revenue earnings, thereby indicating its monopolistic nature. Arrawatia et al. (2019) examined banking competition using the risk-adjusted Lerner index and found improvements in competition for Indian banks.
COVID-19 has hammered the global economy to a great extent. Batool et al. (2020) talked about massive economic fallouts due to the lockdowns that were imposed. They used Google trend data and examined the changes in the search patterns. They found that sectors such as transportation and accommodation were negatively impacted by the lockdowns; on the other hand, sectors such as freelance work, streaming services, and online deliveries showed an increase in Google searches. Mehdiabadi et al. (2020) illustrated the integration of Banking 4.0 with Industry 4.0. The authors highlighted that banks should match themselves with technology advancements and should be more customer-centric. They recommended that fourth-generation banks should work in association with knowledge-based companies to provide better-operating methods. Furthermore, while studying the stock market performance of 80 countries during COVID-19, Burdekin and Harrison (2021) found that there was a deterioration in stock market performance with an increase in the number of COVID-19 cases. Importantly, during this ongoing pandemic, banks should closely work with industries to improve the economy.
Extant literature has covered various methods to estimate market power. The most widely used technique is the Lerner index. However, literature has cited that such methods to have drawbacks (Spierdijk and Zaouras 2017; Bolt and Humphrey 2015; Spierdijka and Zaourasa 2018) and hence has covered extended measures of the Lerner index. As banks operate in an interconnected environment, they are constantly faced with competition from network banks. Thus, it becomes imperative to examine competition from the perspective of the banking system at large. However, extant literature does not seem to have enough empirical evidence to factor in the ‘interconnectedness’ among banks while assessing competition. Therefore, we attempt to use the contemporary network theory to analyze banking competition, both at the system and the bank level. Ever since the GFC, India has witnessed several booms and busts within its own economy that have specifically impacted its banking system. Specifically, post-GFC, India did witness an economic upsurge, characterized by a high credit off-take. However, in early 2015, large amount of banking assets were declared non-performing with a handful of corporate defaults, raising questions on financial stability. Thus, it becomes a crucial research objective to examine whether lower banking competition leads to the sanctioning of loans at a high net-interest margin, which results in the curse of rapid growth in NPAs. Again, in early 2020, the ongoing COVID-19 pandemic posed a global challenge, with India being no exception. Therefore, there is an urgent need to understand banking competition during such rare global events encompassing public health turmoil.
In this context, we frame the following objectives:
(1)
Estimate the Lerner index to examine the market power of banks.
(2)
Construct a competitive network structure for the Indian banking system, estimate the system and nodal properties, and identify cluster formation using the page-rank algorithm.
(3)
Develop a Market Power Network Index (MPNI), which measures the market power of banks by considering their operation within an interconnected environment.
The Indian banking system passed through a Non-Performing Loan (NPL) crisis in early 2015, as there were multiple corporate loans, which at that point were defaulted. In fact, even during the ongoing COVID-19 pandemic, we have witnessed a major economic slowdown with the banking system being no exception. Although network theory is widely used to examine the contagion effect, the method remains unexplored in the field of banking competition. Effectively, this is what motivated us to explore banking competition in India, using the contemporary network theory.
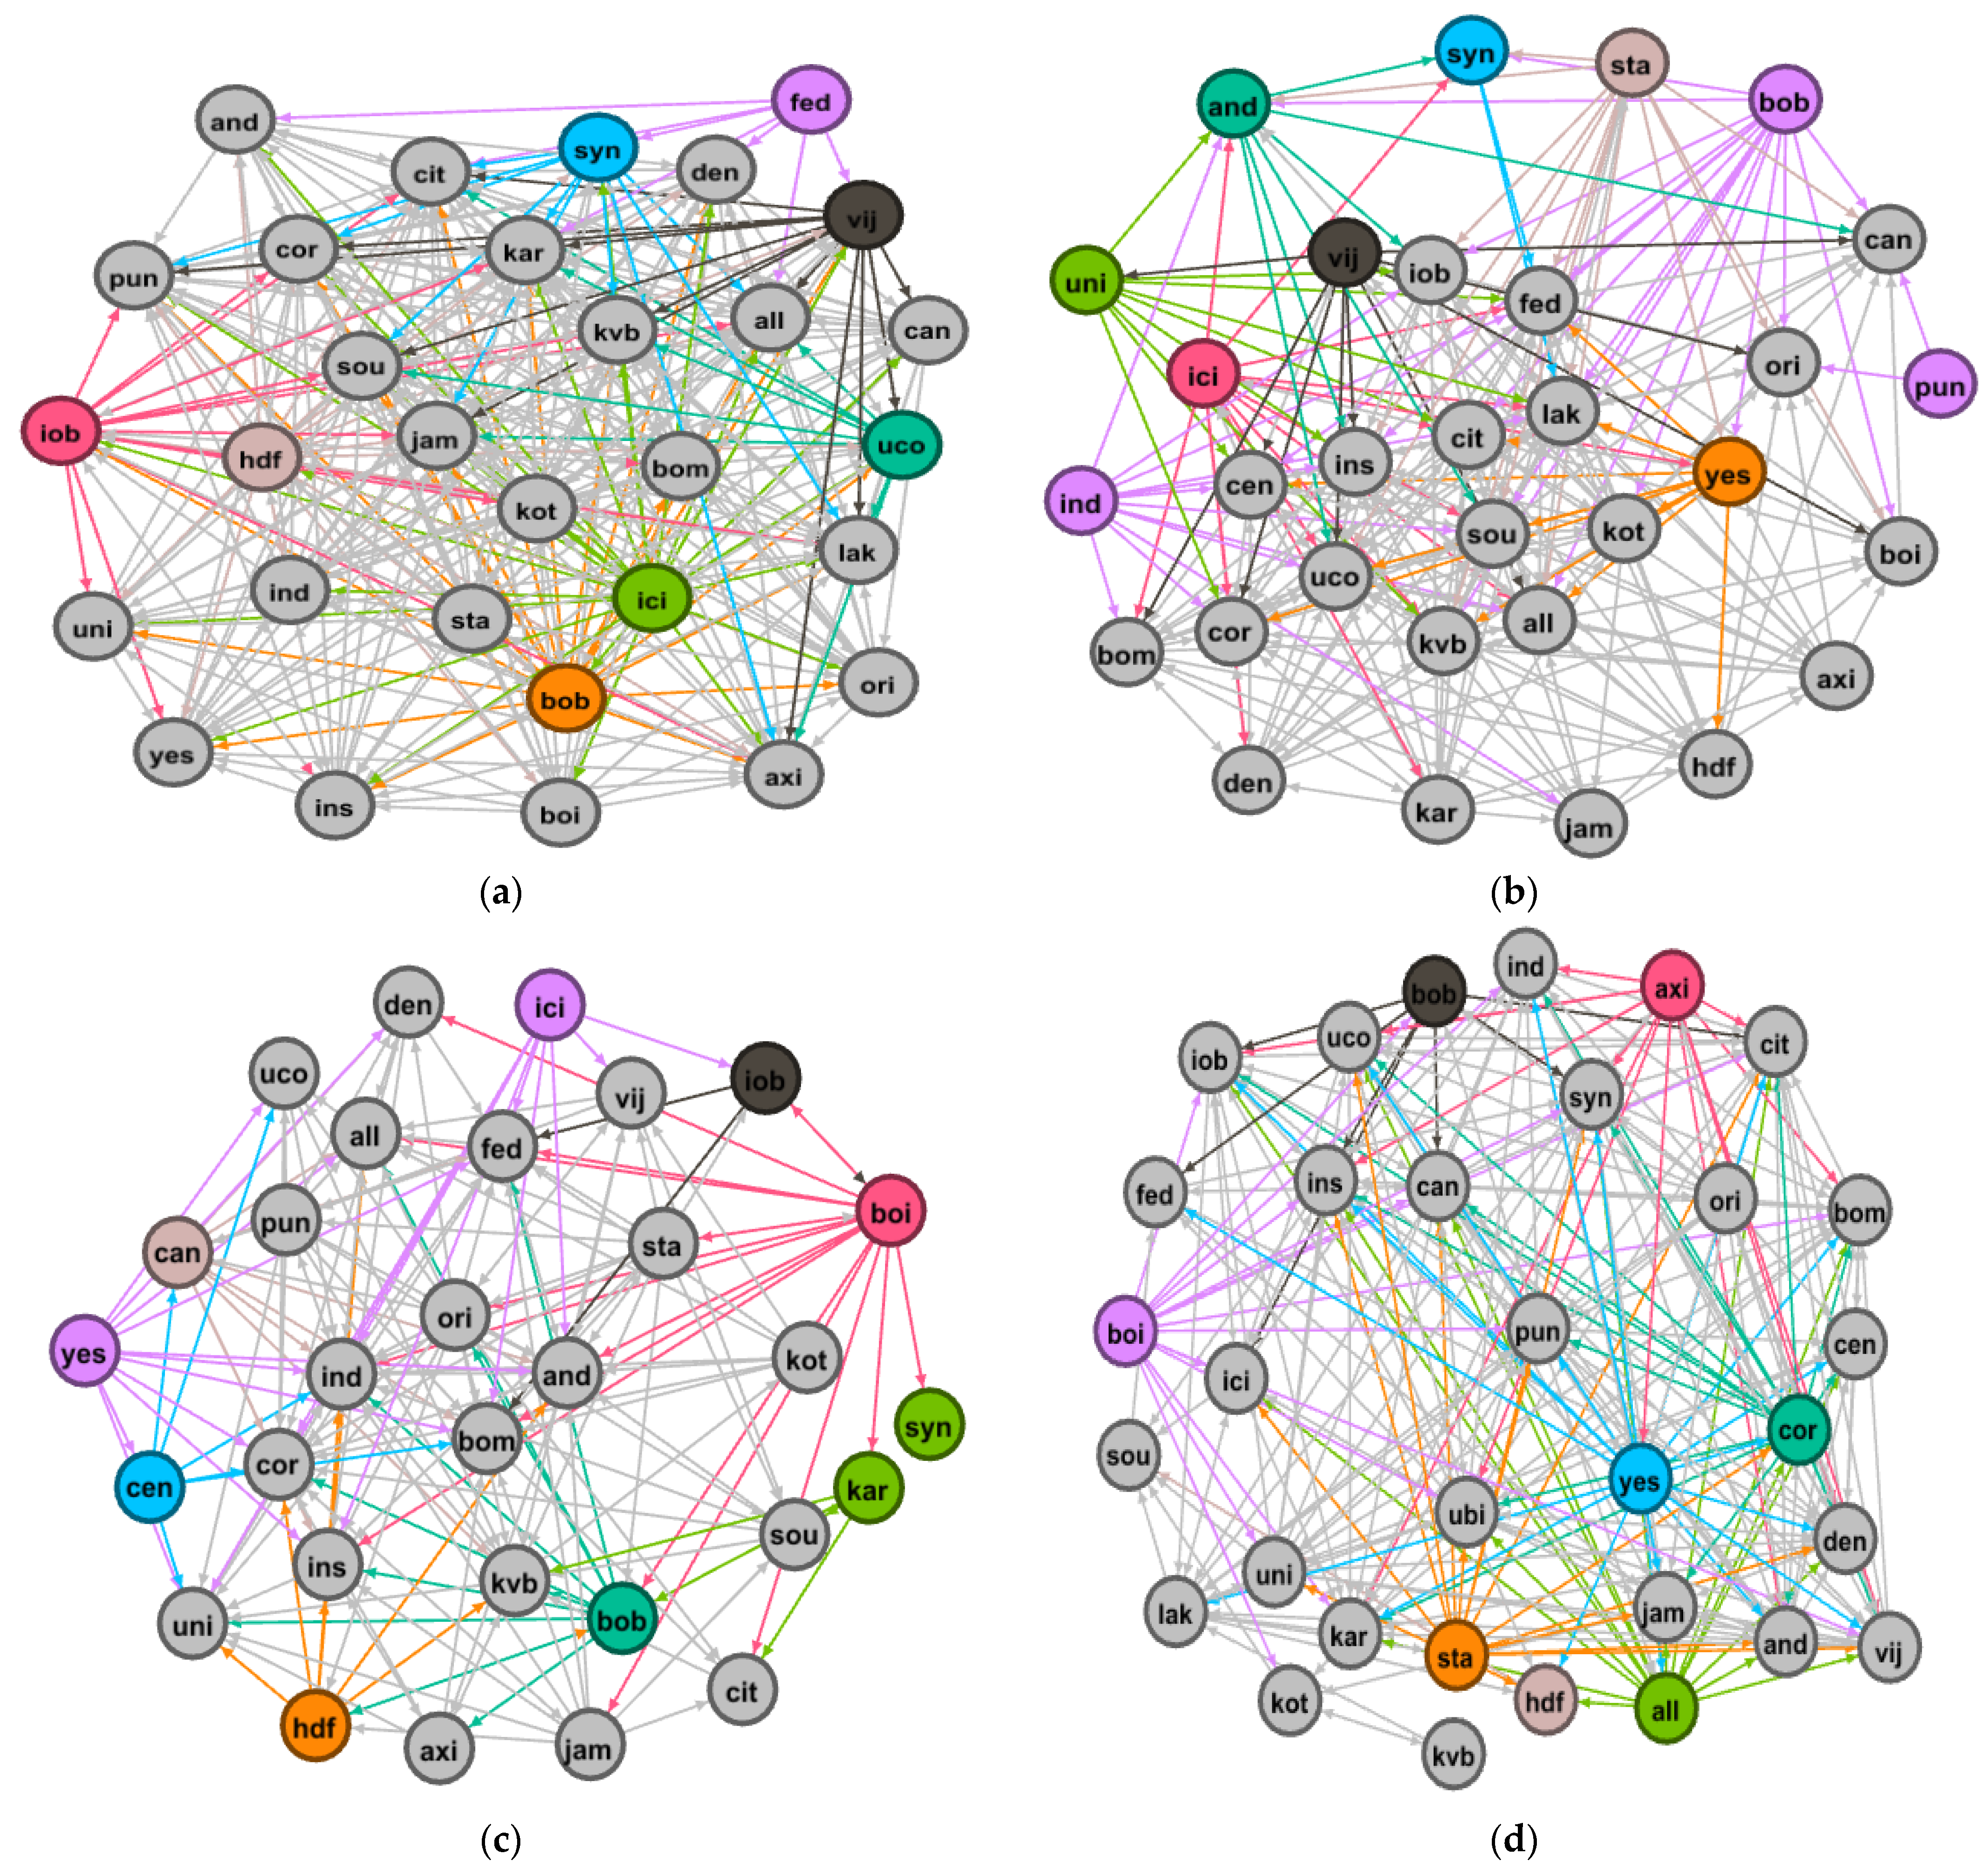
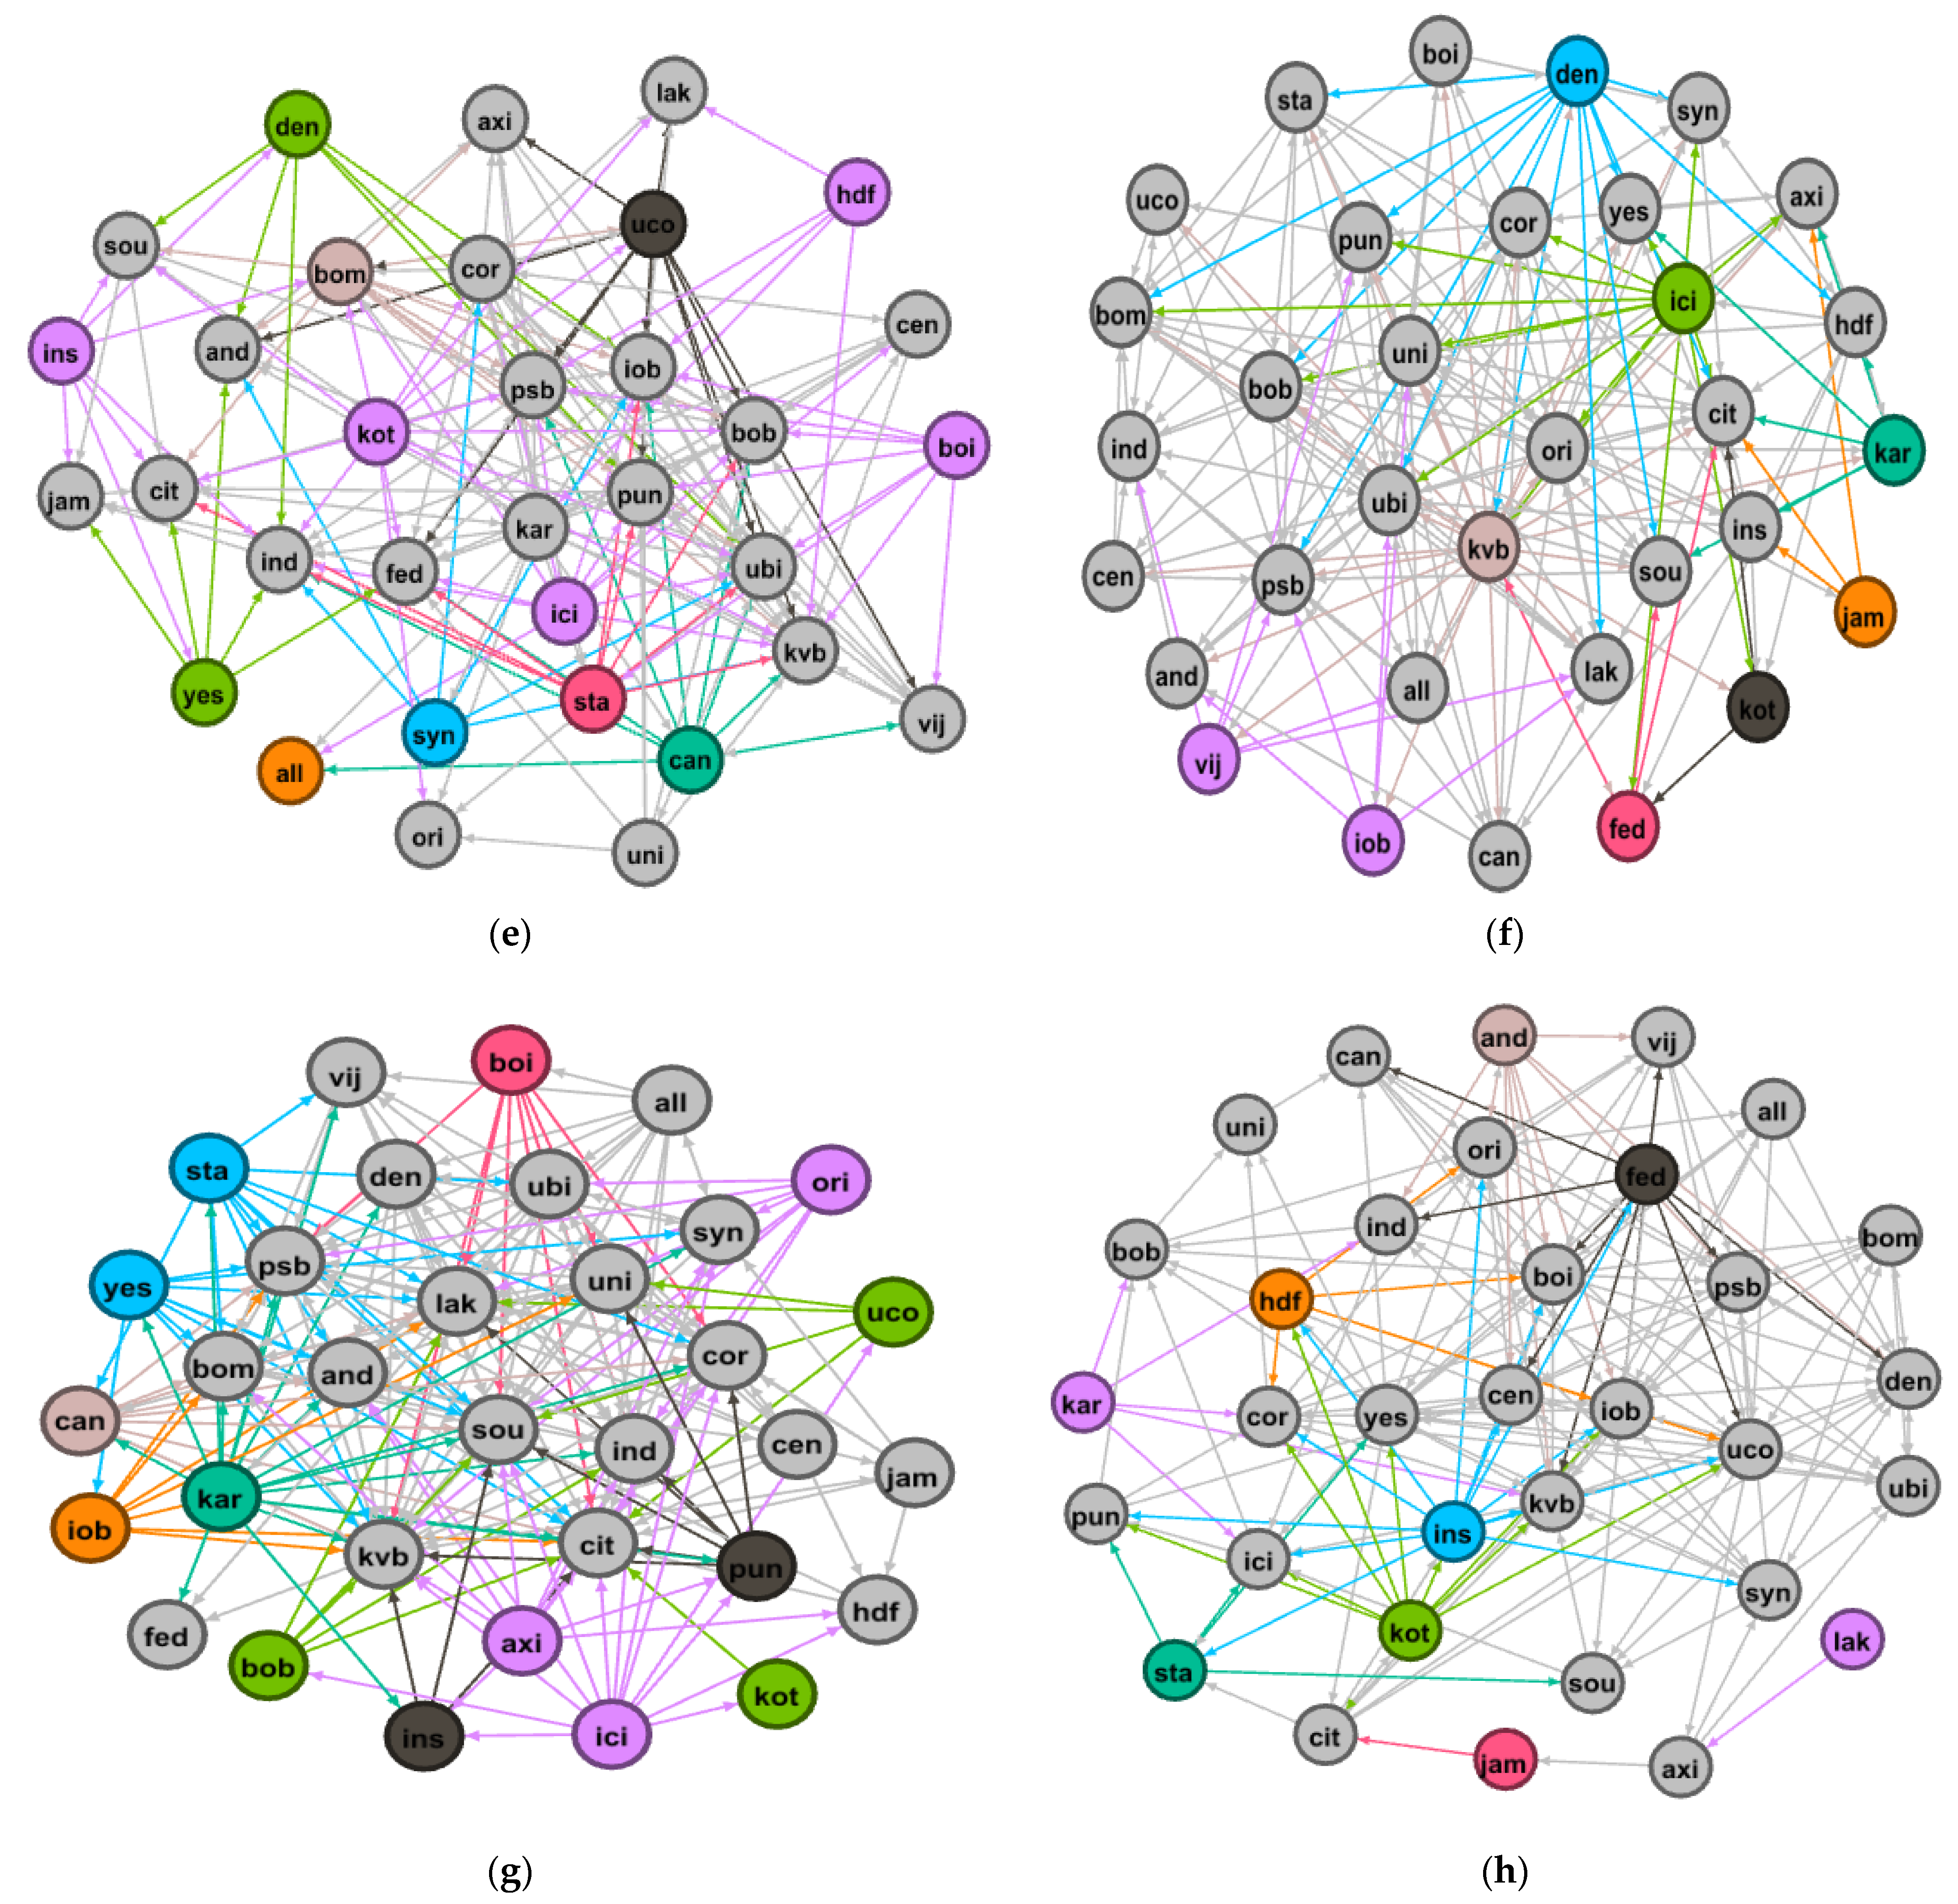
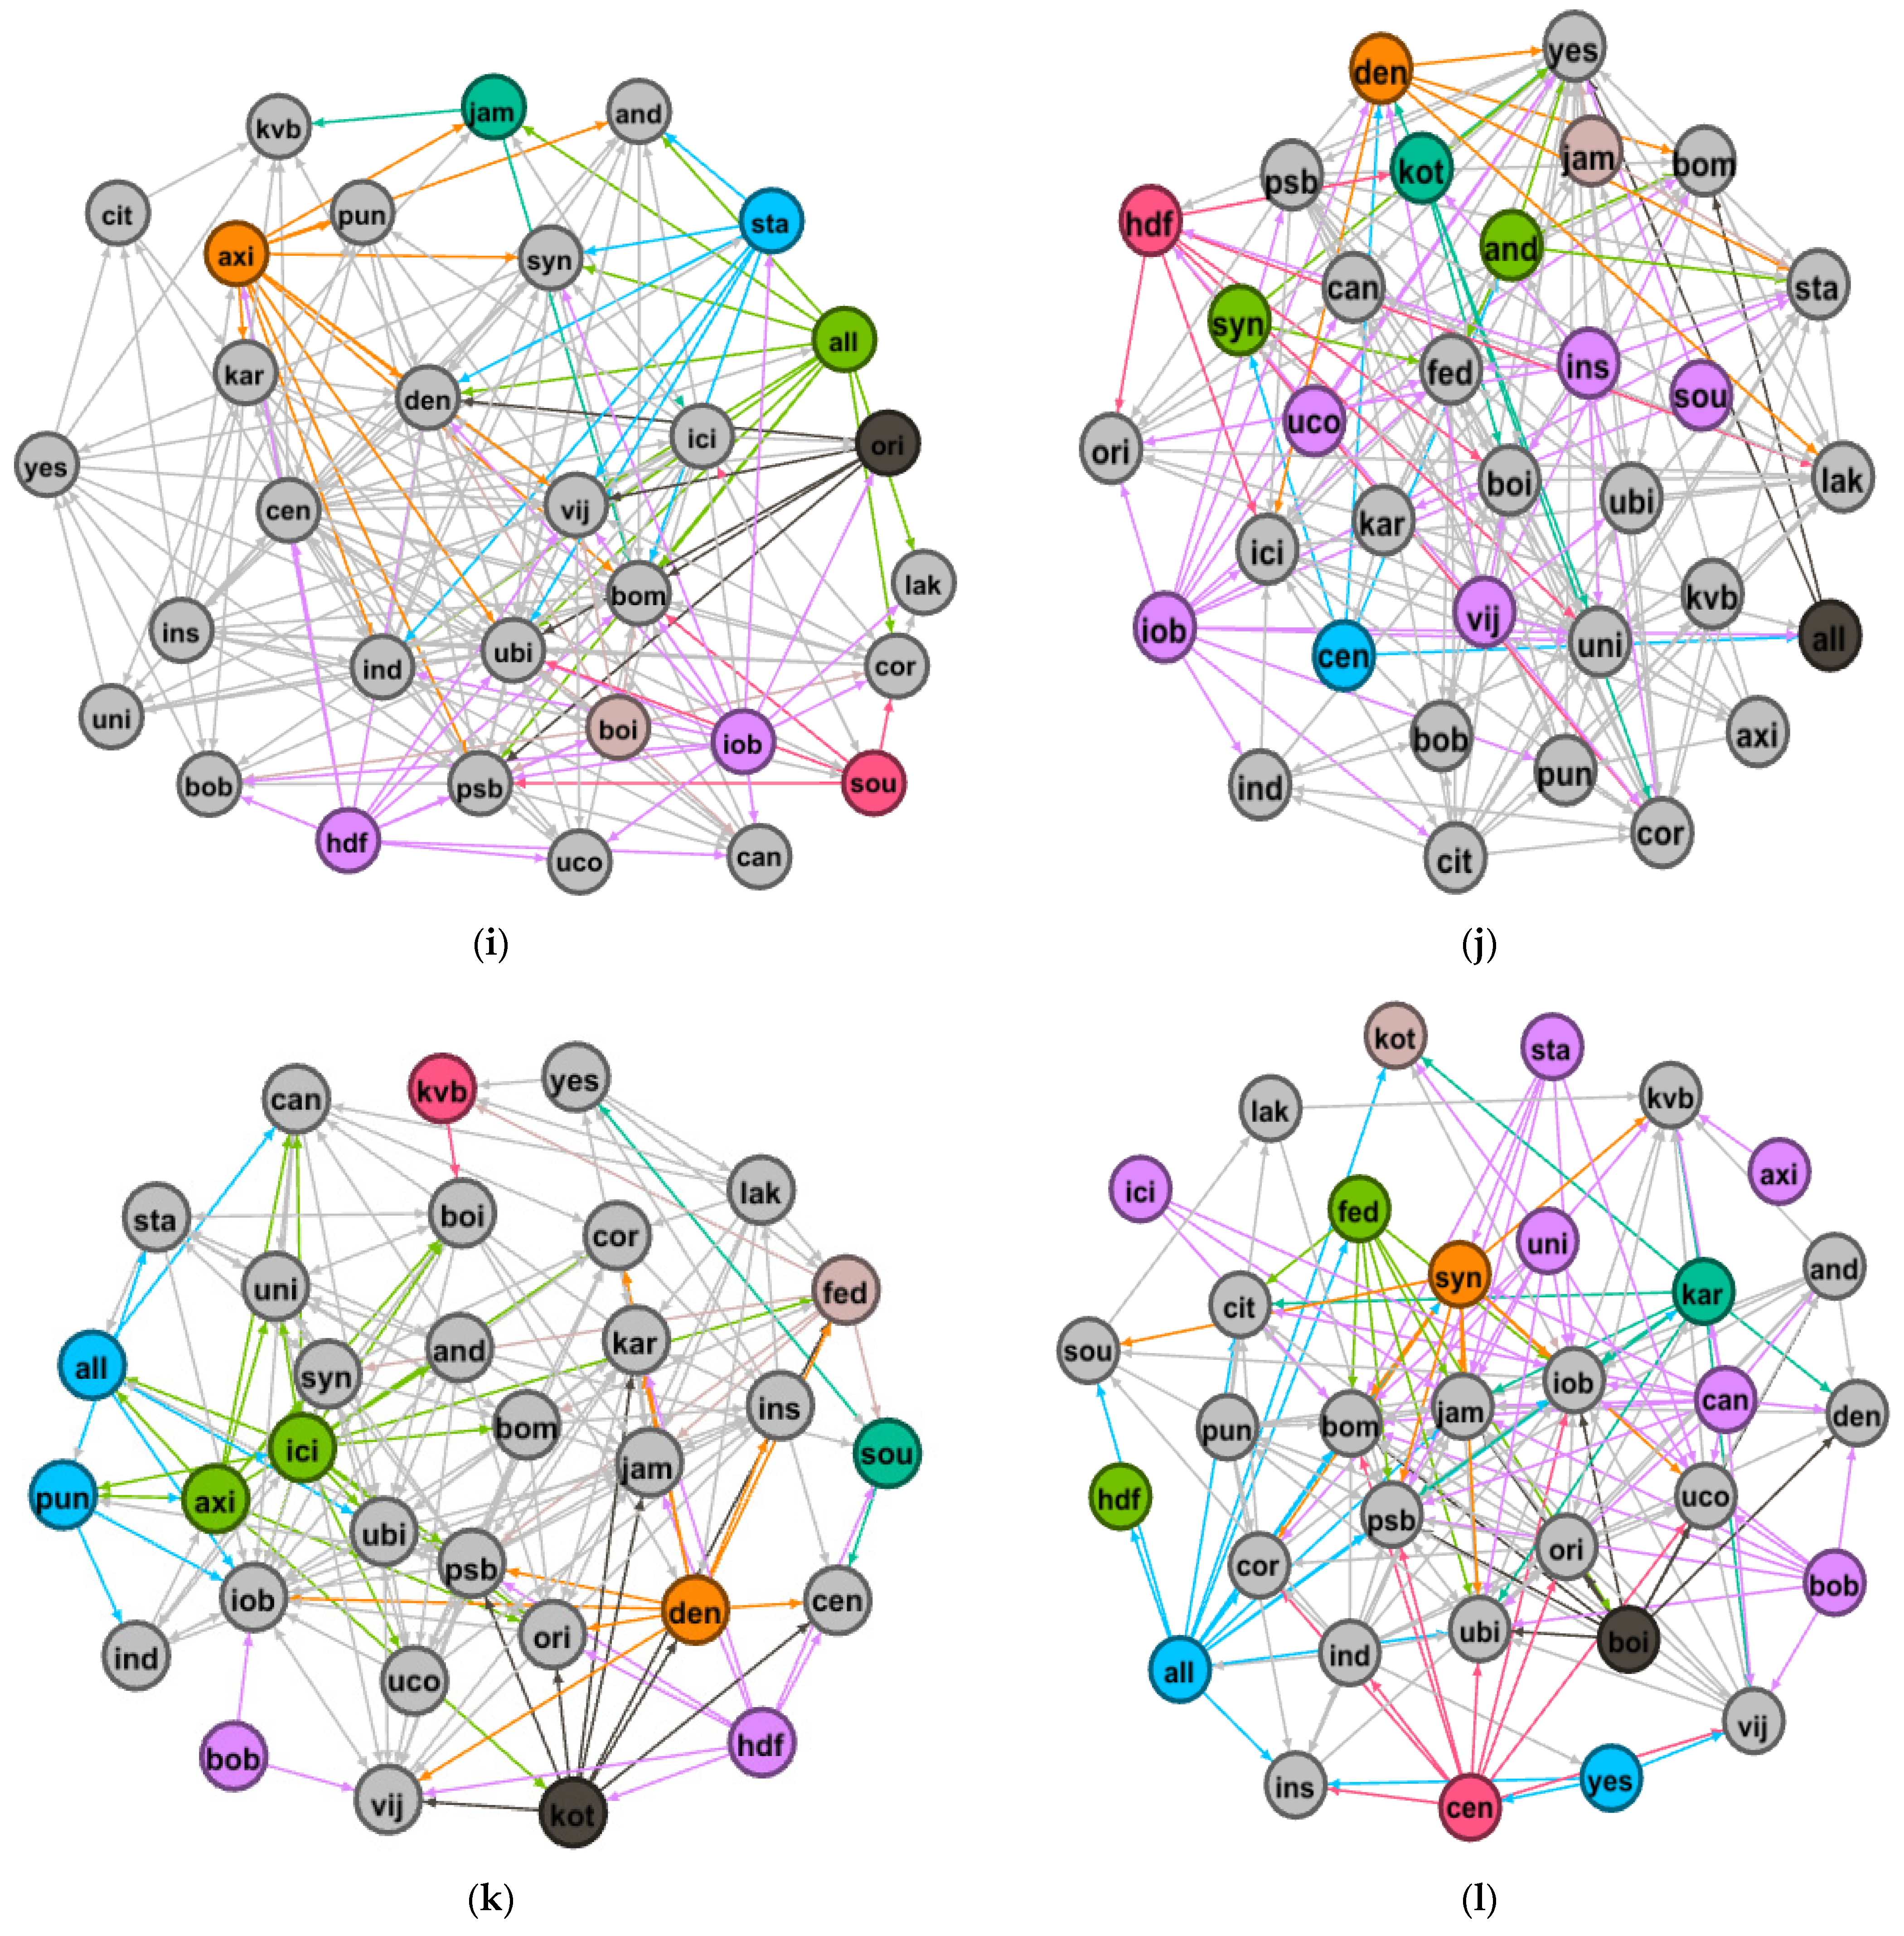
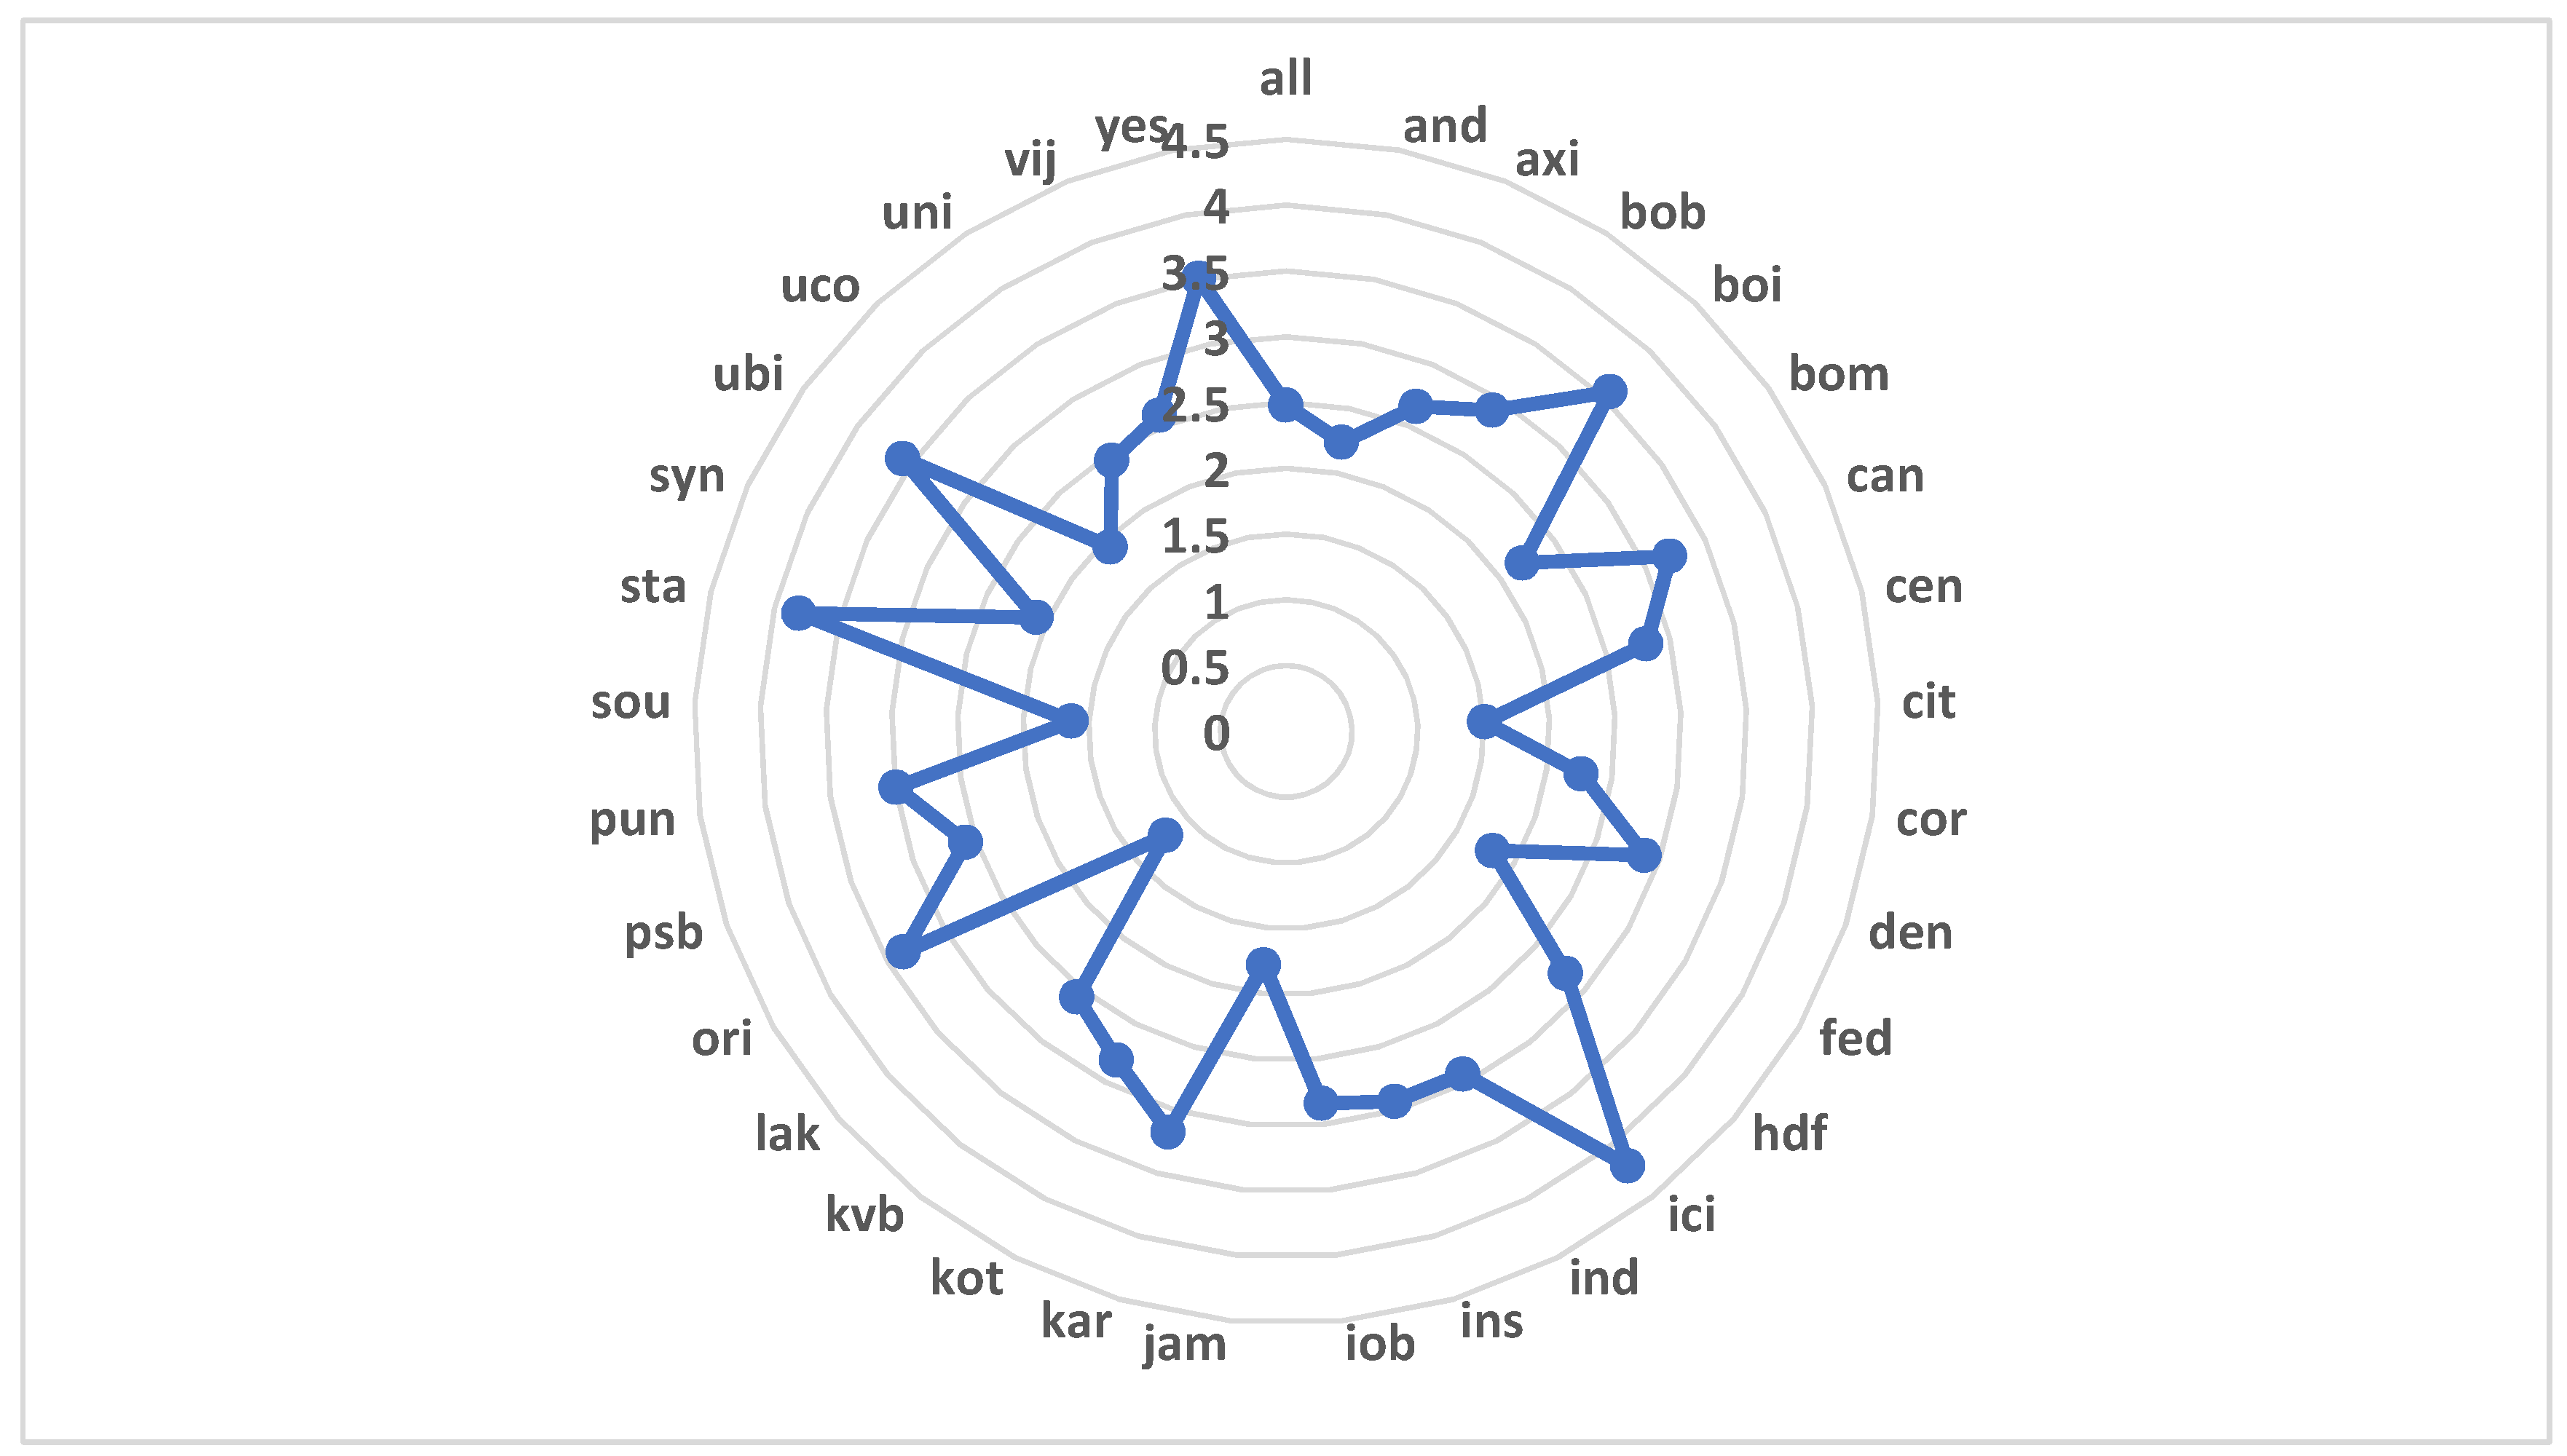
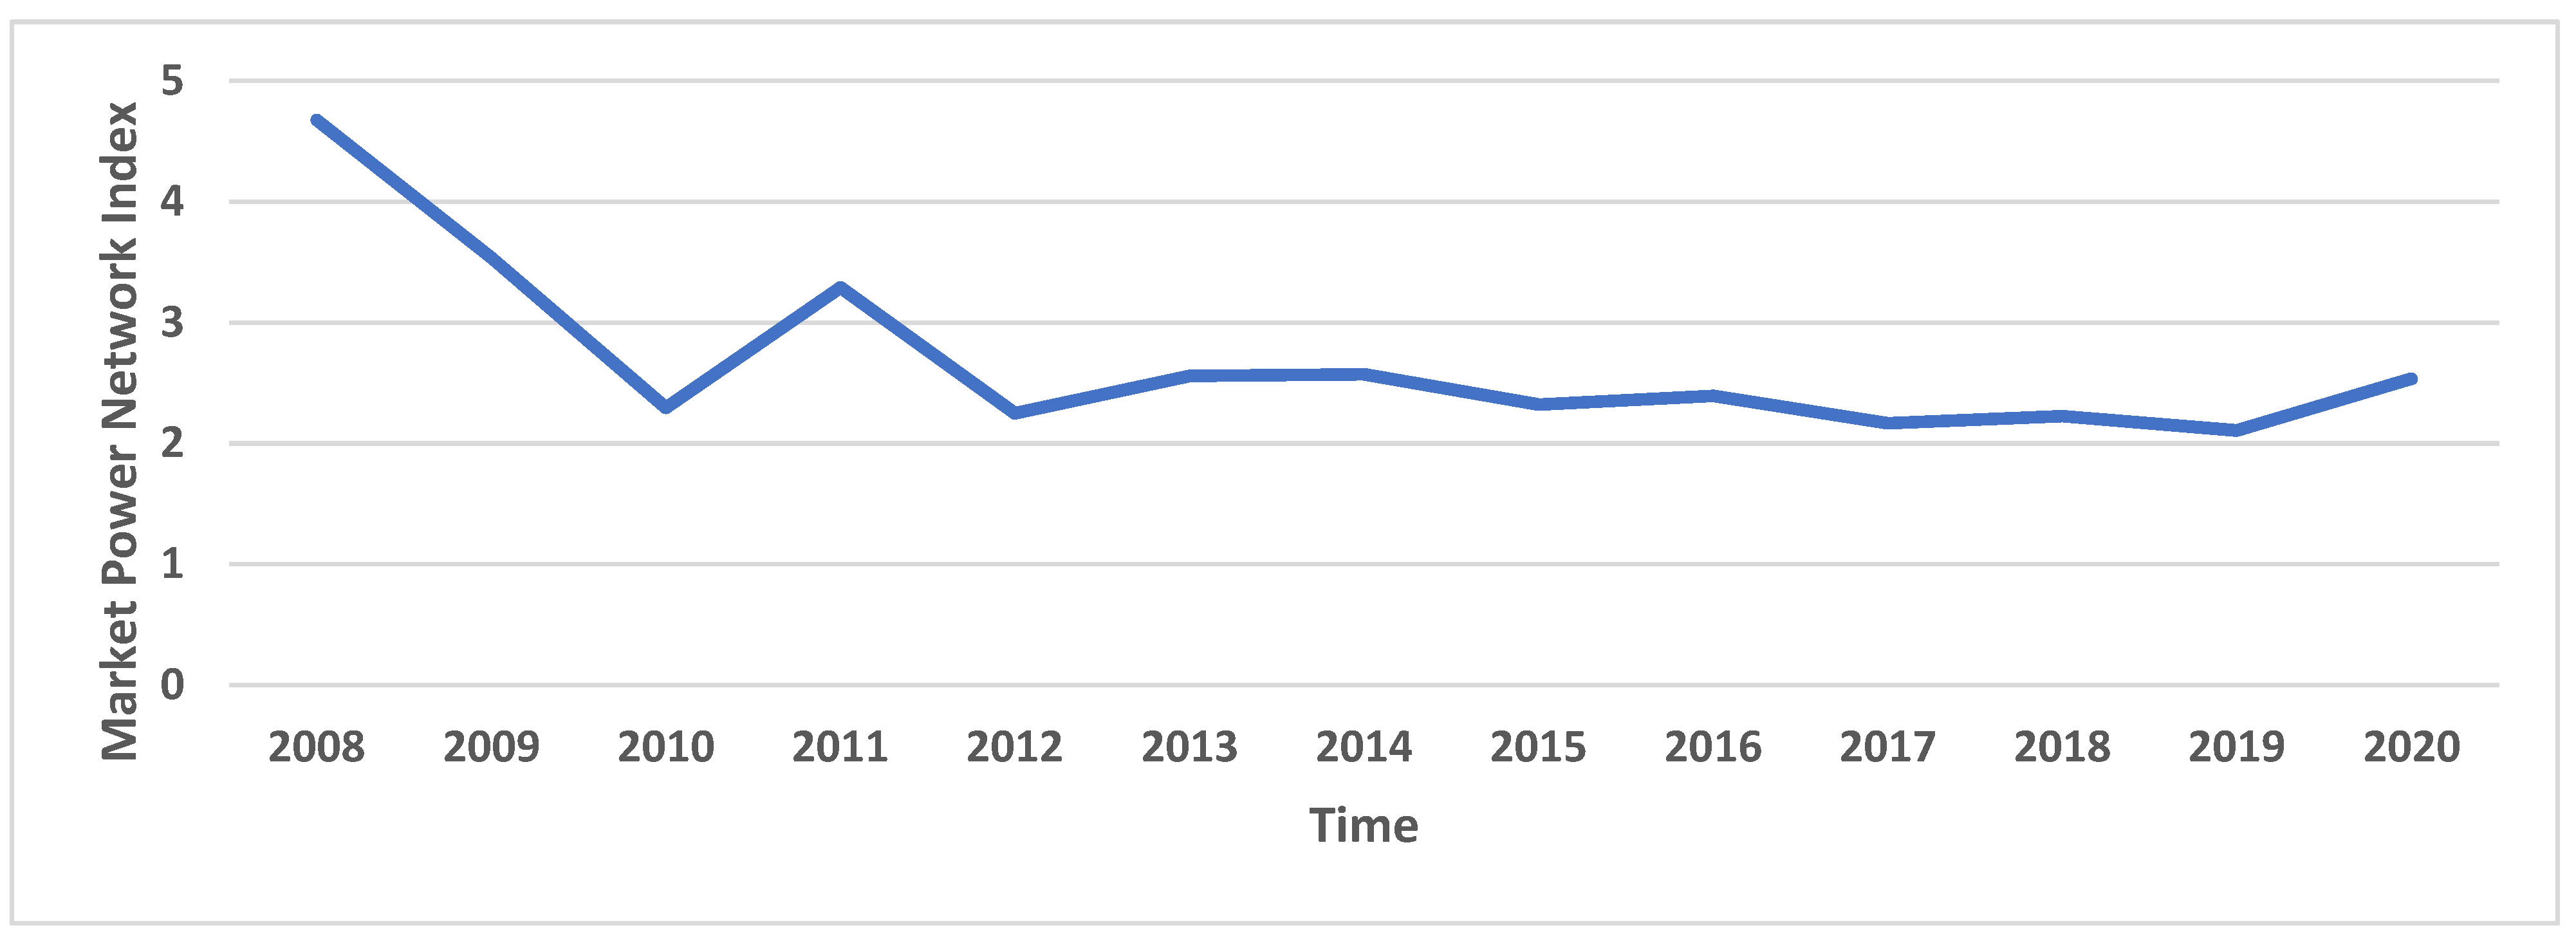
This paper built network structures for the Indian banking system, clearly showing the clusters of banks that were involved in competition. Network properties, namely centroid, average path length, distance of a node from the centroid, total number of connections in the inter-bank market, and network density are estimated and have the potential to explain banking competition. Our findings show that the estimated network properties indicate a lower level of competition during crisis periods. In effect, we used network properties to propose the Market Power Network Index (MPNI), which can be considered as an alternative method to assess banking competition. Interestingly, the MPNI showed the highest value during GFC followed by the COVID-19 pandemic, thereby indicating a lower level of competition during said periods. Further, we observed that big-sized, profitable, capital adequate, and public banks have higher market power.
The salience of this paper is that it is one of the first to examine banking competition using the Network Theory. Notably, the design implemented herein to examine banking competition using the contemporary network model has its own advantages, as it measures competition by considering the banking system at large, rather than assessing competition on a standalone basis.
The period of our study is from 2008 to 2020, covering the periods of the GFC (2008–2009), the high credit off-take period (2010–2014), the non-performing loan crisis (2015–2018), the pre-COVID-19 periods (2019), and the COVID-19 periods (2020). This broad timeframe enables us to examine the nature of banking competition during different time horizons. This would also enable us to scrutinize the market power of banks during rare events, such as the ongoing COVID-19 pandemic.
The remaining paper is organized as follows: Section 2 discusses the methodology to construct a competitive network structure and proposes a new index to measure a bank’s market power. Section 3 discusses the results of competitiveness among Indian banks, and the banking system overall; specifically, it focuses on different economic phases. Section 4 concludes by providing policy implications while highlighting the future scope of the study.

2. Empirical Design

The listed banks in India have been considered as a sample, covering almost 80% of Indian banking assets. Notably, the sample comprises both public as well as private banks.

2.1. Interbank Competitive Network Structure

We used the Lerner index, one of the most prominent techniques used to assess market power among banks, as shown in Equation (1)
L e r n e r i , t = P i , t M C i , t P i , t
where M C i , t = marginal cost for a specific bank i at a given time t.
P i , t = average price of bank assets for a specific bank i at a given time t.
The returns of banking stocks are obtained using Equation (2)
R i , t = l n P i , t P i , t 1
where, R i , t and P i , t are stock return and price, respectively.
The interconnection between a pair of banks was established using the Granger-causal relation, as depicted in Equations (3) and (4). A significant relation indicates the existence of a link between a pair of banks.
R i , t = a = 1 n A a   R j , t a + b = 1 n B b   R i , t b + ε 1 t
R j , t = a = 1 n X a   R j , t a + b = 1 n Y b   R i , t b + ε 2 t
The existence of interconnection between a pair of banks i and j obtained from Equations (3) and (4) can be represented in the form of a matrix (5). The elements in the matrix bear a logical value ‘0’ or ‘1’, where ‘1’ represents the existence of a link and vice versa.
k m n = [ k 11 k 12 k 1 n k 21 k 22 k 2 n k n 1 k n 2 k n n ]
Lerner index values are considered nodal weights within a network, and thus, various network and nodal parameters were estimated. Among network properties, centroid, the total number of connections, network density, and average path length are calculated. Nodal parameters such distance of the bank from the centroid, total distance possessed by a bank, and density of the bank within the network were assessed.
In the network, centroid is considered to be the point with the most market power and can be estimated using Equation (6)
Centroid sys , t = i = 1 n L e r n e r   I n d e x i , t n
Network density indicates the concentration of market power and is estimated using Equation (7). A banking system with high network density is considered the least competitive against a lower density system.
Network   Density sys , t = L i n k s s y s , t C 2 n
Interconnections possessed by a bank i indicate a bank’s market power over other banks and is estimated using Equation (8). A higher number of connections signify that a bank has influential market power over other banks. The total number of interconnections in the entire network is estimated using Equation (9), describing the competitive nature of the banking system, where a smaller number of interconnections within a network highlight that the system to be more competitive.
L i n k s i , t = j = 1 n K i j
L i n k s s y s , t = i = 1 n j = 1 n K i j
where K i j represents the elements of the matrix k m n The distance of a bank from the centroid indicates a bank’s influence in determining market power, which is estimated using Equation (10). A smaller distance implies that the bank is closer to the point bearing the highest market power within the network (Centroid) and hence has significant influence in the market. Notably, for the entire network, the average distance from the centroid is computed, where a greater distance implies that the banking system is indeed competitive.
D C i , t = ( L e r n e r i , t C e n t r o i d s y s , t ) 2
D C sys ,   t = i = 1 n ( L e r n e r i , t C e n t r o i d s y s , t ) 2 n
Distance possessed by banks within the network indicates the market power of a bank in the form of distance, as depicted in Equation (12). A higher distance is due to more connections, thereby indicating the market power of the bank. On similar lines, a larger average path length for the entire network signifies that the banking system is influenced by a small number of banks and is assessed using Equation (13)
Dis i , t = j = 1 n K i j ( L e r n e r i , t L e r n e r j , t ) 2
Avg .   Path   length   sys , t = i = 1 n j = 1 n K i j ( L e r n e r i , t L e r n e r j , t ) 2 n
where K i j indicates the existence of interconnection between bank i and j and are elements of the matrix (5); n is the total number of banks in the banking system.
The density of a bank indicates its influence within the banking system, as depicted in Equation (14). Notably, higher interconnections possessed by a bank in the interbank network increase its density, thereby implying the bank’s market power.
Density i , t = L i n k s i , t L i n k s s y s , t
Clusters in the network are developed using a page-rank algorithm to examine various groups of banks involved in competitions.

2.2. Market Power Network Index (MPNI)

Nodal properties estimated from a constructed network have the potential to explain the market power of banks. We developed MPNI to examine the level of competition by considering banks that have been operating within the network structure using Principal Component Analysis (PCA), as shown in Equation (15).
M P N I i , t = W 1   D i s i , t + W 2 L i n k s i , t + W 3 D C i , t
where, W 1 ,   W 2 ,       and   W 3 are weights generated from PCA for the distance possessed by a bank in the network ( D i s i , t ), the total number of interconnections ( L i n k s i , t ) , and the distance of a bank from the centroid ( D C i , t ) , respectively.
Further, based on extant literature, we formulated five hypotheses with a null hypothesis (H0) for each of the five categories, namely size, profitability, capital adequacy, ownership, and crisis periods, which does not seem to have any association with MPNI. The following are our alternative hypothesis:
  • Size: Big-sized banks have many interconnections, thereby making the system ‘too interconnected to fail’, as their failures would break down the entire banking system. Thus, regulators prevent such banks from a bank run due to which big banks tend to have more market power.
Hypothesis 1a (H1a).
Big-sized banks have more market power than small-sized banks.
  • Profitability: Profitable banks have a greater profit margin that is characterized by higher franchise value with less risk-taking attitude, and they possess significant market power.
Hypothesis 2a (H2a).
Profit-making banks have more market power than loss-making banks.
  • Capital adequacy: Capital adequate banks have a wider capital base, enabling them to sanction loans at a lower profit margin and thereby have more power in the market.
Hypothesis 3a (H3a).
Capital adequate banks have more market power than less capital adequate banks.
  • Ownership: Public banks are often infused with capital by the government. With this infused capital, banks disburse loans at a lower profit margin and experience higher market power.
Hypothesis 4a (H4a).
Public banks have more market power than private banks.
  • Crisis: The banking system witnesses lesser competition during a crisis, as economic activities become restricted during such periods. The Global Financial Crisis (GFC) for instance, erupted due to a systemic failure of financial institutions, thereby creating a contagion effect, directly impacting the overall stability of the banking system. COVID-19, on the other hand, is an ongoing pandemic, which has indirectly impacted the banking system. Therefore, the GFC is a more severe crisis over COVID-19 regarding its effects on the banking system, and so is its competitive in nature.
Hypothesis 5a (H5a).
During the GFC, banks were less competitive than during the COVID-19 pandemic.

3. Results and Discussion

Table 1 depicts the descriptive statistics of the Lerner index along with its estimating variables. The mean Lerner index for Indian banks is 0.9833, with the HDFC bank having the highest Lerner index value. Interestingly, the United Bank of India has the lowest Lerner index value, which was observed during the year 2020. Notably, 55% of observations have a Lerner index value above its mean value.

3.1. Interbank Competitive Network Structure

Table 2 depicts the estimated competitive network properties for different periods of the economy. It was observed that during the GFC, the number of connections along with density was the highest, thereby indicating that interconnectedness increases among banks during a crisis. A similar higher trend in density and links is also observed during the COVID-19 pandemic. Herein, the average path length is the maximum followed by the GFC, thereby indicating a lower degree of competitiveness. Importantly, banks are found to be closer to the centroid during a high credit off-take period, followed by GFC, highlighting the reduced competitive nature during such periods. The centroid value highlights that the market power is the highest during COVID-19, thereby indicating a lower level of competitiveness during crisis periods. In fact, a similar situation was observed during the GFC as well. However, the high credit off-take period also witnessed a low degree of competition, as a significant amount of business growth was evident during this period. Appendix A provides the estimated annual network properties explaining competition.
Figure 1 depicts the network structures signifying market power among Indian banks constructed annually. The dense interconnections among banks are evident during the GFC (2008–2009), the high credit off-take period, especially during 2011, 2013, and 2014, and the COVID-19 pandemic (2020). Each network has evidence of cluster formation with many banks, indicating that such banks are involved in competition.

3.2. Market Power Network Index

Table 3 depicts the descriptive statistics of estimated market power in the form of a network index for the five distinct economic phases. Notably, the median value for market power is highest during the GFC followed by the COVID-19 period. This indicates that in crisis periods, competition among banks decreases, with GFC being characterized by a lower level of banking competition than COVID-19. In fact, we noted a similar phenomenon for standard deviation as well, where variation among samples is higher during crisis periods, thereby indicating that a cluster of banks has significant power in the market. This characteristic was also prominent during the GFC as opposed to during COVID-19.
In the form of a radar map, Figure 2 depicts bank-wise market power using the constructed network index. Banks that are far away from the center possess higher market power. For the entire sample period, ICICI has had the highest market power followed by the State Bank of India, the Union Bank of India, and the Bank of India. However, the Lakshmi Vilas Bank and Citi Union Bank had least market power. Appendix B highlights bank-wise market power for the five distinct phases. Notably, during the GFC, the Kotak Mahindra Bank exhibited the highest market power, followed by ICICI Bank, the State Bank of India, and the Bank of Baroda, while Allahabad Bank, followed by Corporation Bank, had the least market power. During the COVID-19 pandemic, the Karur Vaisya Bank has had the highest market power, followed by the Bank of India and the Punjab National Bank, while the Kotak Mahindra Bank followed by the Lakshmi Vilas Bank exhibited the lowest market power.
Figure 3 depicts the time-varying annually estimated market power in the form of a network index for the Indian banking system. The index value was the highest during the GFC, thereby indicating that banking competition is the least during periods of crisis. The COVID-19 period is also marked with an increasing index value trend, indicating lower competition but still more than the GFC.
The quartile scale is used to demarcate the stages of the bank market power by providing ranges of the MPNI, as depicted in Table 4. The classification is based on a quartile scale, with a bank having a MPNI below the first quartile being considered as low, an MPNI between first quartile and median is classified as semi-moderate, an MPNI between median and third quartile is identified as moderate, and an MPNI above the third quartile is considered to have high market power. Further, during GFC, 15 banks (almost 50% of our sample) fell under the category of bearing high market power. However, during the COVID-19 period, eight banks fell into the high and moderate categories.
Table 5 depicts hypothesis testing for various bank-specific variables with respect to competition. We accept the hypothesis that big-sized banks have more market power due to their large asset base with more connections over small banks. We accept the hypothesis that profitable banks have higher market power over loss-making banks at a 1% level of significance. Due to their high franchise value, profitable banks charge high net-interest margins, scrutinizing borrowers before disbursing loans, characterizing high market power thereof. Further, we also accept the hypothesis at a 1% significance level that capital-adequate banks tend to have high market power due to their broader capital base. We further accept the hypothesis at a 1% level of significance that public banks, owing to capital infusion from time to time from the central government, tend to have high market power. However, we fail to accept the hypothesis about the significant difference in competition between periods of the GFC and COVID-19.

4. Conclusions

Generally speaking, banks operate in an interconnected environment for liquidity mitigation, interbank payments, and settlement processes. However, this interconnectedness may lead to the contagion of systemic risk. Thus, as risk-taking behavior governs banking competition, the contemporary network theory can explain banking competition and market power.
We used the network theory to examine competition for the Indian banking system. We proposed a network index to assess the market power of banks, and the system’s overall competitive environment. Further, we formulated a scale of references to categorize banks into low, moderate, semi-moderate, and high levels of market power, where regulators can periodically monitor a bank’s dominancy in the market. We also estimated network properties, both at the system and nodal levels, thereby enabling regulators to learn the competitive nature of the banking system at large. Additionally, we observed a lower level of competition during and just after the GFC; notably, this result concurs with the findings of Apergis (2015). Furthermore, we showed that the GFC period witnessed the lowest level of competition followed by high credit-off take followed by the COVID-19 pandemic period. Specifically, during the GFC, there was a contraction in financial activities, making the banking system the least competitive. During the high credit-off take period, economic activities took an upsurge, witnessing an increase in the need for loans, thereby decreasing inter-bank competition. In fact, within this period, banks tended to disburse loans at a higher net interest margin without proper customer screening, which effectively led to an accumulation of NPAs. Based on these observations, we suggest that regulators should have a prudent approach towards the market power of banks, especially during crisis and high-credit off-take periods.
We accept the hypothesis that big-size banks exerted more market power due to their large asset base and interconnections, which is consistent with the findings of Bikker et al. (2006). We also accept the hypothesis that profitable banks have more market power than loss-making banks (Torre Olmo et al. 2021), thereby indicating that profitable banks do tend to uphold a higher net interest margin by maintaining high franchise value. Moreover, we also noted that capital adequate banks have higher market power due to their capital cushion, thereby accepting our hypothesis (Santoso et al. 2021). Due to periodic capital infusion from the government, public banks do tend to have higher market power over private banks, thereby accepting our hypothesis again.
Our proposed contemporary network model can efficiently explain the market power of banks and the system’s overall competitive nature, as banks function in an interconnected environment. We believe that the network parameters and the constructed network index would certainly facilitate regulators to supervise the bank dominancy. This study provides evidence for the nature of competition for different economy phases, thereby enabling regulators to take proactive measures during such stages. Further, we believe that this study would help regulators to examine the complexity of banking competition through a network approach. A dispersed or concentrated competition network defines the level of competition within the banking system. Additionally, a concentrated network indicates the pressure of monopolistic competition, and hence, it prevails upon regulators to reduce the monopoly power through regulatory policy initiatives. However, a dispersed network indicates stiff competition, leading to high credit off-take, without necessarily following a judicious loan screening process, which again calls for stricter regulatory intervention to prevent systemic crisis in the banking system. We also noted that big-sized banks exert market power, and therefore, regulatory intervention is required to reduce their monopoly.
Importantly, the study sample was confined to commercial banks; however, Non-Banking Financial Companies (NBFCs) and cooperative banks do also influence banking competition, and this has not been considered in our case. Future research could include NBFCs, foreign banks, and cooperative banks in order to examine the competitive network of the entire financial system. Though this study was conducted for Indian banks, it is applicable for all countries that follow the BASEL guidelines.

Author Contributions

Conceptualization, M.R.R. and A.K.M.; methodology, M.R.R. and A.K.M.; validation, M.R.R. and A.K.M.; formal analysis, M.R.R.; investigation, M.R.R.; resources, M.R.R.; data curation, M.R.R.; writing—M.R.R.; writing—review and editing, A.K.M.; visualization, M.R.R.; supervision, A.K.M. All authors have read and agreed to the published version of the manuscript.

Funding

This research received no external funding.

Conflicts of Interest

The authors declare no conflict of interest.

Appendix A

Table A1. Annual Network Properties explaining competition for Indian banks.
YearsCentroidPath LengthDistance from CentroidConnectionsDensity
20080.983375.220.203570.41
20090.983203.650.182790.30
20100.983282.310.251810.19
20110.983493.120.222680.27
20120.983691.440.111890.18
20130.983621.110.112150.20
20140.983441.720.182160.20
20150.983361.810.181950.18
20160.983036.400.352010.19
20170.982843.170.371820.17
20180.983006.200.501870.18
20190.982964.860.591770.17
20200.983627.010.482000.22

Appendix B

Table A2. Bank-wise average Market Power Network Index (MPNI) for five distinct economic phases.
BanksGFCHigh Credit Off-TakeNPL Crisis Pre-COVID-19COVID-19
all1.37552.90822.16155.50210.7860
and2.75101.49342.65282.75112.7510
axi3.34052.59382.75110.39303.5371
bob6.87752.75100.88433.14413.5370
boi3.34054.00862.45633.53706.2881
bom5.50201.72922.06330.78600.0000
can3.34053.77281.27735.10915.8951
cen5.50202.20083.04583.93001.1790
cit4.71600.31441.96500.00000.7860
cor1.76853.53701.57200.78601.1790
den4.91252.98682.35800.3930N/A
fed2.16150.94322.35802.75112.3580
hdf5.50212.04363.04590.00003.1440
ici7.66364.32303.93011.17900.7860
ind6.28801.80782.16154.71613.1440
ins3.73351.72924.22480.78604.3231
iob4.51951.96503.83181.96500.7860
jam2.94751.65060.58951.57205.1090
kar3.14403.93002.84933.53710.3930
kot8.64611.96502.25980.39300.0000
kvb3.34053.06540.88430.39307.4671
lak3.14400.70741.27730.78600.0000
ori2.75104.79461.86685.10901.5720
psbN/A2.09603.14400.78603.5371
pun1.96503.45841.96503.53706.2881
sou3.93000.94321.27730.78602.7510
sta7.46704.55882.25982.35800.3930
syn2.35801.57202.16153.53702.3580
ubiN/A5.50201.76861.17905.5027
uco2.75102.04361.96500.78600.7860
uni3.53702.90821.27733.53711.5720
vij4.32302.12222.35802.3580N/A
yes4.12653.53704.51951.17900.3930

Appendix C

Table A3. Studied banks along with their abbreviations.
BankSymbol
Allahabad Bankall
Andhra Bankand
Axis Bankaxi
Bank of Barodabob
Bank of Indiaboi
Bank of Maharashtrabom
Canara Bankcan
Central Bank of Indiacen
City Union Bankcit
Corporation Bankcor
Dena Bankden
Federal Bankfed
HDFC Bankhdf
ICICI Bankici
Indian Bankind
Indian Overseas Bankiob
Indusind Bankins
Jammu & Kashmir Bankjam
Karnataka Bankkar
Karur Vysya Bankkvb
Kotak Mahindra Bankkot
Lakshmi Vilas Banklak
Oriental Bank of Commerceori
Punjab and Sind Bankpsb
Punjab National Bankpun
South Indian Banksou
State Bank of Indiasta
Syndicate Banksyn
UCO Bankuco
Union Bank of Indiauni
United Bank of Indiaubi
Vijaya Bankvij
Yes Bankyes

References

  1. Albaity, Mohamed, Ray Saadaoui Mallek, and Abu Hanifa Md Noman. 2019. Competition and bank stability in the MENA region: The moderating effect of Islamic versus conventional banks. Emerging Markets Review 38: 310–25. [Google Scholar] [CrossRef]
  2. Andries, Alin Marius, Steven Ongena, Nicu Sprincean, and Radu Tunaru. 2020. Risk Spillovers and Interconnectedness between Systemically Important Institutions. Swiss Finance Institute Research Paper. Zürich: Swiss Finance Institute, pp. 20–40. [Google Scholar]
  3. Apergis, Nicholas. 2015. Competition in the banking sector: New evidence from a panel of emerging market economies and the financial crisis. Emerging Markets Review 25: 154–62. [Google Scholar] [CrossRef]
  4. Arrawatia, Rakesh, Arun Misra, Varun Dawar, and Debasish Maitra. 2019. Bank Competition in India: Some New Evidence Using Risk-Adjusted Lerner Index Approach. Risks 7: 44. [Google Scholar] [CrossRef] [Green Version]
  5. Badarau, Cristina, and Ion Lapteacru. 2020. Bank risk, competition and bank connectedness with firms: A literature review. Research in International Business and Finance 51: 101017. [Google Scholar] [CrossRef]
  6. Batool, Maryam, Huma Ghulam, Muhammad Azmat Hayat, Muhammad Zahid Naeem, Abdullah Ejaz, Zulfiqar Ali Imran, Cristi Spulbar, Ramona Birau, and Tiberiu Horațiu Gorun. 2020. How COVID-19 has shaken the sharing economy? An analysis using Google trends data. Economic Research-Ekonomska Istraživanja, 2374–86. [Google Scholar] [CrossRef]
  7. Beck, Thorsten. 2008. Bank Competition and Financial Stability: Friends or Foes? Available online: https://ssrn.com/abstract=1152483 (accessed on 27 May 2021).
  8. Bhattacharya, Kaushik, and Abhiman Das. 2003. Dynamics of market structure and competitiveness of the banking sector in India and its impact on output and prices of banking services. Reserve Bank of India Occasional Papers 24: 123–59. [Google Scholar]
  9. Bikker, Jacob A., Laura Spierdijk, and Paul Finnie. 2006. The Impact of Bank Size on Market Power. (No. 120). Amsterdam: Netherlands Central Bank, Research Department. [Google Scholar]
  10. Bolt, Wilko, and David Humphrey. 2015. A frontier measure of US banking competition. European Journal of Operational Research 246: 450–61. [Google Scholar] [CrossRef]
  11. Boyd, John H., and Gianni De Nicolo. 2005. The theory of bank risk taking and competition revisited. The Journal of Finance 60: 1329–43. [Google Scholar] [CrossRef]
  12. Burdekin, Richard C. K., and Samuel Harrison. 2021. Relative Stock Market Performance during the Coronavirus Pandemic: Virus vs. Policy Effects in 80 Countries. Journal of Risk and Financial Management 14: 177. [Google Scholar] [CrossRef]
  13. Carletti, Elena, and Philipp Hartmann. 2002. Competition and Stability: What’s Special about Banking? European Central Bank (No. 146). Working Paper Series; Frankfurt am Main: European Central Bank. [Google Scholar]
  14. Clark, Ephraim, Nemanja Radić, and Alma Sharipova. 2018. Bank competition and stability in the CIS markets. Journal of International Financial Markets, Institutions and Money 54: 190–203. [Google Scholar] [CrossRef]
  15. Clerides, Sofronis, Manthos D. Delis, and Sotirios Kokas. 2015. A new data set on competition in national banking markets. Financial Markets, Institutions & Instruments 24: 267–311. [Google Scholar]
  16. Huang, Tai-Hsin, Dien-Lin Chiang, and Shih-Wei Chao. 2017. A new approach to jointly estimating the Lerner index and cost efficiency for multi-output banks under a stochastic meta-frontier framework. The Quarterly Review of Economics and Finance 65: 212–26. [Google Scholar] [CrossRef]
  17. Huang, Tai-Hsin, Nan-Hung Liu, and Subal C. Kumbhakar. 2018. Joint estimation of the Lerner index and cost efficiency using copula methods. EmpLerner Index, Adjusted Lerner Index and Irical Economics 54: 799–822. [Google Scholar] [CrossRef]
  18. Li, Zhiheng, Shuangzhe Liu, Fanda Meng, and Milind Sathye. 2019. Competition in the Indian banking sector: A panel data approach. Journal of Risk and Financial Management 12: 136. [Google Scholar] [CrossRef] [Green Version]
  19. Mehdiabadi, Amir, Mariyeh Tabatabeinasab, Cristi Spulbar, Amir Karbassi Yazdi, and Ramona Birau. 2020. Are we ready for the challenge of Banks 4.0? Designing a roadmap for banking systems in Industry 4.0. International Journal of Financial Studies 8: 32. [Google Scholar] [CrossRef]
  20. Mishkin, Frederic S. 1999. Financial consolidation: Dangers and opportunities. Journal of Banking & Finance 23: 675–91. [Google Scholar]
  21. Phan, Hien Thu, Sajid Anwar, W. Robert J. Alexander, and Hanh Thi My Phan. 2019. Competition, efficiency and stability: An empirical study of East Asian commercial banks. The North American Journal of Economics and Finance 50: 100990. [Google Scholar] [CrossRef]
  22. Prasad, Ananthakrishnan, and Saibal Ghosh. 2005. Competition in Indian Banking. IMF Working Paper No. 05/141. Available online: https://ssrn.com/abstract=888010 (accessed on 28 May 2021).
  23. Santoso, Wimboh, Inka Yusgiantoro, Wahyoe Soedarmono, and Agustinus Prasetyantoko. 2021. The bright side of market power in Asian banking: Implications of bank capitalization and financial freedom. Research in International Business and Finance 56: 101358. [Google Scholar] [CrossRef]
  24. Schaeck, Klaus, Martin Cihak, and Simon Wolfe. 2009. Are competitive banking systems more stable? Journal of Money, Credit and Banking 41: 711–34. [Google Scholar] [CrossRef] [Green Version]
  25. Spierdijk, Laura, and Michalis Zaouras. 2017. The Lerner index and revenue maximization. Applied Economics Letters 24: 1075–79. [Google Scholar]
  26. Spierdijka, Laura, and Michalis Zaourasa. 2018. Measuring banks’ market power in the presence of economies of scale: A scale-corrected Lerner index. Journal of Banking & Finance 87: 40–48. [Google Scholar]
  27. Ten Kate, Adriaan, and Adriaan Kate. 2013. A Multi-Product Lerner Index and Elasticity Aggregation. Available online: https://papers.ssrn.com/sol3/papers.cfm?abstract_id=2341258 (accessed on 26 May 2021).
  28. Torre Olmo, Begoña, María Cantero Saiz, and Sergio Sanfilippo Azofra. 2021. Sustainable Banking, Market Power, and Efficiency: Effects on Banks’ Profitability and Risk. Sustainability 13: 1298. [Google Scholar] [CrossRef]
  29. Yellen, Janet. 2013. Interconnectedness and Systemic Risk: Lessons from the Financial Crisis and Policy Implications: A Speech at the American Economic Association/American Finance Association Joint Luncheon, San Diego, CA, USA, January 4; (No. 631). Board of Governors of the Federal Reserve System (US). Available online: https://EconPapers.repec.org/RePEc:fip:fedgsq:631 (accessed on 24 May 2021).
  30. Yeyati, Eduardo Levy, and Alejandro Micco. 2007. Concentration and foreign penetration in Latin American banking sectors: Impact on competition and risk. Journal of Banking & Finance 31: 1633–47. [Google Scholar]
Figure 1. Interbank network structure for banks in India. (am) represents network structure for the year 2008, 2009, 2010, 2011, 2012, 2014, 2015, 2016, 2017, 2018, 2019, and 2020, respectively. Source: Authors’ own contribution.
Jrfm 14 00402 g001aJrfm 14 00402 g001bJrfm 14 00402 g001cJrfm 14 00402 g001d
Figure 2. Market Power Network Index for Indian banks. Source: Authors’ own contribution.
Jrfm 14 00402 g002
Figure 3. Time-varying Market Power Network Index Source: Authors’ own contribution.
Jrfm 14 00402 g003
Table 1. Descriptive statistics of the Lerner index and its estimating variables.
NMeanMedianStd Dev.MaxMin
Fund Cost4275.88%5.78%0.91%8.79%3.99%
Wage Cost4270.94%0.90%0.26%2.96%0.51%
MC4270.14%0.14%0.02%0.21%0.10%
YoF (Price)4278.68%8.62%1.08%13.70%6.24%
Lerner Index4270.98330.98310.00170.98810.9759
Source: Authors’ own contribution.
Table 2. Network properties for different economic phases.
Economic PhasesNetwork Properties
CentroidPath LengthDistance from CentroidConnectionsDensity
GFC0.98334.440.193180.36
High credit off-take0.98351.940.172140.21
NPL Crisis0.98314.400.351910.18
Pre-COVID-190.98304.860.591770.17
COVID-190.98367.010.482000.22
Source: Authors’ own contribution.
Table 3. Descriptive statistics of Market Power Network Index for different periods.
Market Power Network Index
GFCHigh Credit Off-TakeNPL CrisisPre-COVID-19COVID-19
Mean4.09752.59332.27762.10792.5355
Median3.93001.96501.96501.57202.3580
Std. Dev.2.43692.05851.61621.65522.1618
Source: Authors’ own contribution.
Table 4. Classification for stages of market power along with number of sample banks.
StagesRange
(MPNI)
Number of Banks
GFCHigh Credit Off-TakeNPL CrisisPre COVID-19COVID-19
Low<1.180431312
Semi-Moderate1.18 to 2.364131653
Moderate2.36 to 3.541291098
High>3.54157468
Source: Authors’ own contribution.
Table 5. Hypothesis testing for competition network Index.
VariablesF StatProbability
Size1.240720.0600 *
Profitability1.686010.0001 ***
Capital Adequacy1.657750.0019 ***
Ownership1.469520.0029 ***
GFC and COVID-191.270740.2397
Source: Authors’ own contribution. Note: *, **, *** indicate 10%, 5%, and 1% level of significance
Publisher’s Note: MDPI stays neutral with regard to jurisdictional claims in published maps and institutional affiliations.

