Abstract
This study intends to examine the impact of selling expense structure on the business growth of 255 Vietnamese large-scale enterprises in three different industries (Consumer Staples, Industrials, and Manufacture) listed on the Vietnamese Stock Exchange over four years from 2015 to 2018. By using STATA software (StataCorp LLC, 4905 Lakeway Drive, College Station, Texas 77845-4512, USA), the research outcomes indicate that both labour expense and depreciation expense have a negative influence on revenue growth and firm size growth but positive influence on profit growth while materials and tools expenses negatively affect all three dependent variables. Furthermore, an increase in the proportion of outsourcing expenses and other selling expenses would result in a significant increase in revenue but a decline in the profit of these companies. From this research results, large-scale enterprises should consider changing the selling expense structure as they spend too much on outsourcing and other selling expenses (60%–70% total selling expense) but too little on labour, which plays an important role in upgrading the profitability of these enterprises.
1. Introduction
Recently, the tension among large economies has caused world trade and investment to decline. The International Monetary Fund forecasts that the global economy is facing a difficult period when 70% of the world’s economies fall into a slowdown growth (Nelson 2019). In the context of the global economy’s deterioration with several unpredictable factors, the General Statistics Office of Vietnam also predicts that the economic growth in Vietnam must face more challenges and difficulties. In fact, enterprises play a significant role in the national economy development, especially contributing decisively to financial recovery and growth (World Bank 2018); hence, business growth is a core element of a healthy national economy, partly contributing to global economic growth.
Theoretically, there are many different definitions of “business growth” in accordance with many different theories built. In general, most previous studies have shown that enterprises have to go through many challenging stages to grow based on two different approaches: the first direction indicates that growth is a natural and necessary element (Henrekson and Johansson 2010; Hermans et al. 2015; Stam and Wennberg 2009; Wong et al. 2005), while the second direction defines growth as the result of the whole process in which enterprises try to develop and achieve goals (Biesebroeck 2005; Caves 1998; Audretsch and Klepper 2000; Freel and Robson 2004). There are different ways to measure the growth of a business such as comparing revenue between the present year and the previous year (Davidsson et al. 2010) basing on industrial characteristics and corporate goals in a manner (Delmar et al. 2003; Koga and Kato 2017) or relying on the scale of the business (Hölzl and Friesenbichler 2010; Mansfield 1962; Hart and Oulton 1996; Jones and Miskell 2007).
Previous studies have also pointed out factors affecting business growth. These factors include several characteristics of the enterprise’s owners such as personal incentives, owner relationships, education background, and the features of that enterprise such as age, size, legal form, industry type, strategy, and financial structure (Harabi 2005; Storey 2009; Davidsson and Delmar 1997; Kumar 1985; Variyan and Kraybill 1992; Marris and Wood 1971; Chen et al. 1985; Pavitt 1984; Nguyen et al. 2019). However, in the context of a harshly competitive market, spending on sales and marketing has increasingly affirmed the role of promoting the development of businesses; it not only helps businesses achieve higher sales and profit but also attain customer loyalty, thus gaining market shares before accomplishing sustainable growth for these businesses (Melfi 2016; Jena 2013; Haas et al. 2012; Levitt 1960; Lindgreen and Wynstra 2005; Ramsey and Sohi 1997).
Selling expenses are the costs associated with any activities of selling a good or making a sale such as: publicity costs, demonstration costs, advertising costs, sale commission, warranty charges of goods and products, maintenance charges, cost of packing, and transportation (Ministry of Finance 2014). As a periodic expense, at the end of each accounting period, the actual selling expenses incurred in the period will be deducted directly from the business results of the enterprise. Because each selling expense is different in nature, in content as well as in relation to the volume of goods and services consumed, the size of each expense is, therefore, different. The study of the selling expense structure is the consideration of the proportion and fluctuation in the proportion of each part of selling expenses in comparison with total selling expenses that occurred in a given period.
This research paper is necessary when assessing the impact of the selling expense structure on the growth of enterprises as well as comparing and evaluating the selling expense structure strategy of large enterprises in Vietnam. Moreover, for large enterprises, in general, understanding and controlling the selling expenses are essential to allocate both financial and human resources, to “communicate their value proposition to their customers in fun and interesting ways” (Gross 2016), and to promote their sales, which seem to be more difficult than promoting sales in a smaller enterprises. Hence, enterprises can avoid wasting budget and uncertain risks to improve the cost structure allocation and endorse sustainable growth.
However, most studies mentioned above have been conducted in developed countries and concentrated on the importance of selling and marketing expenses instead of their structure. Therefore, in this study, we measure the growth of businesses through the changes in revenue, profits, and size to get the most objective and comprehensive results. This paper also goes into large-scale enterprises, unlike previous research articles that focus on SMEs to examine the role of selling expense structure to business growth (Okpara 2011; Gupta et al. 2013; Nguyen 2016; Phung 2018). The reason why we pay attention to large-scale enterprises is that while numerous studies on the necessity of capital structure reorganisation, or on profitability, have been taken, the number of studies on the relationship between selling expense structure and growth is very little (Connor and Weimer 1986). In addition, the need for evaluating the potential growth of large-scale businesses is giant due to the significant concern of employees, managers, shareholders, investors, creditors, and even government. Therefore, this study will solve some issues remained and create an objective view for businesses on the importance of selling expense to business growth, thereby proposing an appropriate expense structure.
The study analyses large-scale companies’ selling expense structure regarding five accounts (Labour expense, Material and Tool expenses, Depreciation expense, Outsourcing expenses, Other expenses). This is because most Vietnamese enterprises apply the regulation of Circular 200/2014/TT-BTC (Ministry of Finance 2014) to record and present financial information to Financial Statement, and this regulation states that selling expenses occurring in a business are divided into seven accounts: (1) Labour expense, (2) Material and Packaging expense, (3) Instruments and tools expense, (4) Depreciation expense, (5) Warranty expense, (6) Outsourcing expenses (warehouse, rental property, delivery fees, commission to sales agents, etc.), and (7) Other selling expenses (cost of guests meeting in the sales department, introducing products, branding and advertising, holding customer conferences, etc.). However, the authors combine (2) and (3) as materials and tools expenses and (5) and (7) as other selling expenses. This is because the proportion of these parts do not dominate in comparison with that of (1), (3), or (6), so most Vietnamese enterprises report (2) and (3), (5), and (7) in one part in their Note to financial statements.
The research results show that despite labour expense having a positive influence on profit growth and firm size growth, it affects negatively on revenue growth during the given period. By contrast, a reversed trend occurs in the interaction between other selling expenses and business growth when they impact positively on revenue growth but negatively on the other dependent variables. Furthermore, depreciation expense has a significant positive impact on profit growth as opposed to the negative impact on the remainders. In addition, a negative impact can be seen in the relationship between outsourcing expense and profit growth, as well as between material and tool expenses and all dependent variables.
Our article is structured into five sections. After this introduction, Section 2 reviews related documents. Next, Section 3 deals with the hypotheses, empirical models, and research methods used in this article. The research results are presented in Section 4. Finally, Section 5 presents conclusions, limits, and recommendations for changes in the cost structure of sales to have the most positive impact on business growth.
2. Literature Review
Enterprise growth has always been a subject of interest and attention of scientists in the world, especially scientists in developed countries. This is because business growth represents the ability of a business to meet the goal of maximising profits and improving business value and contributes dominantly to the national economic growth. Therefore, it has attracted interest not only from company managers but also from researchers or even from the government. In fact, there are many different definitions of “business growth” as this term is related to various topics from increasing customer loyalty, sales volume, productivity, and market share to technology development. All the elements are imperative to business growth, but they are not enough to be a fully understandable definition or measurement method. This is since enterprise growth should be evaluated through both firm’s factors such as assets, employees, revenue, or profit, and industrial factors including competitors, industrial technology, or customer commitments.
In terms of theories related to firm growth, many different theories have been constructed, but they can be easily grouped into two different clusters of thoughts. The first type of doctrine illustrates that, for a business, growth is a naturally cumulative factor, and is indispensable based on the “lifecycle rule” of the business (Davidsson 1989; Davidsson and Delmar 1997; Henrekson and Johansson 2010; Hermans et al. 2015; Stam and Wennberg 2009; Wong et al. 2005). In other words, with this flow of thinking, we can implicitly identify that business growth seems to be like the “natural growth of a baby” and always is existed and obtainable to any business over time. On the other hand, firm growth, in the second point of view, is a consequence of the governance plan and is a result of several direction strategies of the firm’s managers (Delmar et al. 2003; Huynh and Petrunia 2010; Davidsson and Delmar 1997). This means that the growth of the business is not a natural factor, but rather an “expected one” as a result of objectives and strategies of the business itself. Although two of these approaches are reverse, they all refer to that if a business wants to grow, it must go through many initial challenging stages (life cycle) with different appropriate strategies in accordance with each stage. Indeed, there are many business owners in the world have helped their business grow from a very small-scale to a medium-sized business, and then to a billion USD corporation over the world such as Google and Facebook, while 90% of start-up entrepreneurs fail from a very early start when their business is on the laboratory even though they have received million USD of support from angel investors. Therefore, in this research, we believe that the growth of a business has changed over time as a result of changing in the macro-economic environment, industrial revolutions, and firms’ nature.
Disagreeing with any theoretical concepts above, Davidsson (1989) indicated that firm growth is “an indication of continued entrepreneurship” because he did not believe in previous theoretical studies, which all assumed of the desire and preparedness to grow of all types of businesses. He ensured that, by designing and testing many small business owners, it could be said that these owners are disinclined to grow “even if there is room for profitable expansion and that profitable firms of different sizes co-exist within industries” (Davidsson 1989). In fact, Davidson believed that the probability and level of business growth are dominantly dependent on its owner-manager while maximising firm value is only one conceivable motivation for its owner-manager. This is because previous researchers always assumed that there is no distinction between business motives and their owner’s interest while Davidson did not rely on this assumption. In fact, according to the “Need for Achievement” motivation theory, individuals differ in the degree they strive for achievement satisfaction. If profit is used as a measure of success, then striving for achievement coincides with the behaviour predicted by profit maximisation, but he stressed that the latter is neither the sole nor the dominant motive for growth.
There are different ways to measure the growth of a business. Many earlier studies have shown that changes in size, in sales and service delivery, and ultimately corporate profitability are the best separation measurement for both the volume and substance of the business. In fact, it is necessary to consider many business targets to evaluate business growth, but no measurement method would be the most optimal. This is because the growth measurement method is mostly based on the information users’ purpose which can be firm value, profit after tax, or sale figure. Specifically:
- Koga and Kato (2017) thought that the traditional way many businesses using to measure growth is to compare their revenues between this year and the previous year instead of comparing the respective profits annually (Delmar et al. 2003; Storey 2009; Huynh and Petrunia 2010; Davidsson et al. 2010). With this traditional way of measurement, however, it is easy to lead administrators and businesses to an “illusion” in growth: while corporate revenue increases, the profitability of the business decreases. This is because the “growth in that dream” is made by the trade-off between the decrease in selling price and the increase in the quantity of sold products, whereas the production cost remains constant or even higher. Many other scientists such as Delmar et al. (2003) agreed with Koga and Kato’s (2017) opinion that business growth is dependent on the characteristics of the industry and the objectives of the business in a phased manner. More specifically, for some service sectors, the growth of the business is measured by the number of customers that the business serves in specific years such as the tourism industry. With several newly established companies, the growth of these businesses is decided through the business pricing (firm value) in merger and acquisition transactions. Ultimately, in large-scale companies, the best way to measure business growth is to compare the performance of your business to that of competitors (Delmar et al. 2003).
- Coad and Hölzl (2010) have made a separate rule and doctrine entitled Gibrat’s Law Gibrat (1931) to measure the growth rates of a business. Gibrat’s law indicated that the best way to measure business growth is to rely on the scale of the business. Many scientists also agreed with this measurement method such as Mansfield (1962), Hart and Oulton (1996), Dunne and Hughes (1994), Lotti et al. (2010), Calvo (2006), and Mengistae (1999). Indeed, these scientists have pointed out that firm size is one of the most important factors to compare the growth of businesses to each other or to evaluate the growth factor of businesses in the present year with the previous year. Any change in the enterprise size can directly influence the business growth in the present period or in the subsequent period.
About the impact of the structure of the selling expenses on the growth of the business, several different studies have been taken such as Agarwal et al. (2009), Lindgreen and Wynstra (2005), Ramsey and Sohi (1997), and Konak (2015). However, instead of taking concentration directly on evaluating the influence of different types of selling expenses on business growth, these previous studies indicated the importance of marketing to the expansion of enterprise market share, to the growth of sales, or to maximising profitability. More specifically:
- (i).
- Upgrading sales means encouraging customer commitments, which help the company with reputation and market share achievement. This is because if the customers are more interested in buying products from a company, they tend to make several “free marketing” these products to their friends and family members with a great review. In the digital age, attracting more customers is an important key to quickly increase sales and service provision, for any type of business. Approving with this opinion, Melfi (2016), Jena (2013), Haas et al. (2012), Levitt (1960), Lindgreen and Wynstra (2005), and Ramsey and Sohi (1997) indicated that “sales are tied to revenue, and setting sales goals makes it possible to forecast quarterly performance”. Sales not only guarantee the ability of any business to achieve its growth goals but also plays an important role in motivating employees and helping managers set strategies in the right direction (Ramsey and Sohi 1997). This is the reason why many large enterprises have spent over 10% of their annual revenue on marketing for dominating the market and becoming a “monopoly” in the industry (Markdao 2019).
- (ii).
- Affirming the position of sale staffs in generating revenue and, thereby, motivating business growth is one of the vital aspects that previous researchers tend to. Indeed, finding the right weighted formula for who (individuals, stores, e-commerce personnel) gets what is the challenge (Haas et al. 2012, Lindgreen and Wynstra 2005, Ramsey and Sohi 1997). In other words, this sentence means that finding ways to make sales and marketing strategies reasonable to a customer audience through different sales channels is the best method to achieve business goals (Drucker 1973, Woodruff 1997, Ramsey and Sohi 1997). Furthermore, sales employees act as a bridge between businesses and customers, building relationships and creating value from these relationships (Haas et al. 2012).
- (iii).
- The impact of marketing on business growth showed that marketing and advertising expenditures are recognised as an essential element influencing the profitability negatively in the short term, but they can add more value for the firm in the long-term (Konak 2015). In each marketing campaign or a business’s sales strategy launched, the most important purpose of business is not just upgrading the revenue figure or the amount of money that customers are willing to spend on products and services provided by that business, but it is for developing customer loyalty and competitive advantages (Konak 2015; Kumar 1985; Blattberg et al. 2009). Therefore, it is possible to assume that the cost of marketing and selling activity is directly correlated to the revenue and market size of the business, influencing significantly the business growth.
In Vietnam, the number of studies related to business growth, especially those that assess the impact of selling expenses on business development, is small. This is because Vietnamese researchers are interested in finding factors affecting firms’ competitiveness for SMEs (Nguyen 2016), or designing suitable growth models for SMEs (Phung 2018).
The above literature review shows that the drawbacks of previous studies are the assessment of business growth in small and medium enterprises rather than in large enterprises and the attention to selling and marketing expenses importance instead of selling expense structure. Therefore, in this study, we have determined that the research objective is to consider the impact of the selling expense structure on the growth of large enterprises in Vietnam. This is because, although small- and medium-sized enterprises account for 97.5% of total businesses, their GDP accounts for only about 40% total national GDP while large enterprises represent only 2.5% of total businesses but their GDP is created accounting for 60% of national GDP (Ha 2018). In addition, every year, large enterprises in Vietnam always spend over 10% of the total revenue on marketing activities with the purpose of dominating the market and achieving the growth rate (Markdao 2019). This shows that researching and assessing the impact of the selling expense structure on business growth is necessary and urgent, especially for large enterprises in Vietnam. This paper will focus on analysing and comparing the impact of the selling cost structure on the growth of the 255 largest enterprises in Vietnam’s stock market during the four-year period from 2015 to 2018 (with 1020 observations) in all three directions: revenue growth, profit growth, and business size growth. In addition, this paper will assess the impact of five different types of selling expenses, including labour expense, outsourcing expenses, depreciation expenses, materials and tool expenses, and other selling expenses on business growth.
3. Hypothesis, Empirical Models, and Research Methods
3.1. Hypothesis
To assess the impact of selling expense structure on enterprise growth, the authors pay concentration on building five research hypotheses below, corresponding to five different independent variables: labour expense, material and tool expenses, depreciation expense, outsourcing expense, and other selling expenses in sequence.
H1:
Labour expense (LAB) is related positively to enterprise growth.
Tyagi and Block (1983), Chandle and Jansen (1992), Wiklund (1999), Mendelson (2000), Nunes et al. (2013), and Teau (2013) concluded the costs (wages, rewards, commissions, …) enterprises have to pay for salespeople are one of the most significant factors influencing on their motivation and their productivity; thereby correlating with enterprise growth in terms of revenue and profit. This would mean that a salesman having a higher level of motivation is likely to perform better in his job, which reinforces his belief about the greater monetary rewards (Nunes et al. 2013). Furthermore, staffs in the sales department are responsible not only for accomplishing their obligations but also for building and retaining long-term relationships with customers (Mendelson 2000). For all these reasons, increasing labour expense proportion would influence the salespeople’s motivation for higher performance, hence rewarding higher revenue, before enlarging the firm size and facilitating growth.
H2:
Material and tool expenses (MAT) are related negatively to enterprise growth.
Material and tool expenses include the expenses of materials, packages, and tools used to sell goods and services, such as packaging, storage, etc. for the sales department. There are few previous pieces of literature considering the interaction between MAT and enterprise growth; however, these expenses are deemed as a part of the total business costs and they are also analysed through the following basic accounting principle known as net income formula (net profit):
Profit = Total Revenues − Total Expenses
Profit = Total Revenues − (Material and Tool Expenses + The Remainders)
Thus, when material and tool expenses increase without generating any rise in revenue, profit would begin shrinking. MAT, as a result, have a negative influence on enterprise growth.
H3:
Depreciation expense (DEP) is related negatively to enterprise growth.
DEP is an indispensable cost in a business (Hiemstra 1962) and it comprises the depreciation expenses of fixed assets used for the sale department such as for storehouses for shops, for unloading means, for transportation, and for measurement facilities. To put it another way, DEP is a part of the total business costs influencing directly on profits in a company’s income statement; hence, the higher the depreciation expense in a fiscal year, the lower the company’s reported net income (profit). On the other hand, it is hard to seek from the previous literature who studied the relationship between depreciation expense and business growth; however, many scientific types of research have focused on the interaction between profit and enterprise growth. According to Alchian (1950), Coad (2007), Jang and Park (2011), and Goddard et al. (2004), profit could be a driving force of growth because it leads the companies to expansion, and this may mean that once profit decreases, the opportunity for enterprise growth begins shrinking. As a result, we predict that depreciation expense would have a negative influence on business growth.
H4:
Outsourcing expenses (OUT) are related either negatively or positively to enterprise growth.
These expenses include the costs acquired outside for the sales department, namely fixed assets guarantee, storage, transportation, entrusted export, agency commissions, etc. Some scholars showed that outsourcing is an alternative method to reduce costs and enhance competitiveness contributing to the attraction of more consumers and the rise in revenue (Carey et al. 2006, Ketler and Walstrom 1993). The costs of constructing distribution systems in manufacturing companies, for instance, could also become increasingly more difficult and expensive (Martin and Lavine 2000); so, a more effective alternative to choose is more economical. This is because external providers can gain economies of scale and develop technological efficiencies (Lowe et al. 1999), therefore helping the business with efficiency enhancement and productivity improvement. This point is also strengthened by Loh and Venkatraman (1992); while Scott (1997) and Maltz (1994), on the other hand, suggested that the outsourcing fees resulted in a significant decrease in profit and an increase in tax liability, leading to a negative impact on the profit growth. Therefore, we hardly conclude the exact causality of outsourcing expenses and business growth.
H5:
Other selling expenses (OTH) are related either negatively or positive to enterprise growth.
Other selling expenses are all expenses incurring in the selling process except for the above-mentioned expenses, such as the expenses for receptions of salesmen, costs of product introduction, marketing, advertising costs, or customer conference expenses. In general, enterprises focus mainly on costs that possibly promote the consumption of goods and services from the sales promotion strategy of a company such as product introduction costs or advertising costs; hence, these expenses account for a dominant part of other expenses. Ailawadi and Neslin (1998) and Nijs et al. (2001) pointed out that the investment in promotion activities that incur promoting costs is positive in connection with the upgrade in consumption and revenues. Nevertheless, Ailawadi et al. (2007) in the research titled “Quantifying and Improving Promotion Effectiveness at CVS” supposed that more than 50% of promotions are not profitable; even the profitability could increase if the promotions in some ineffective performing categories were eliminated. Therefore, whether the interaction between other expenses and enterprise growth is negative or positive has not been concluded.
A conceptual framework is displayed in Figure 1:
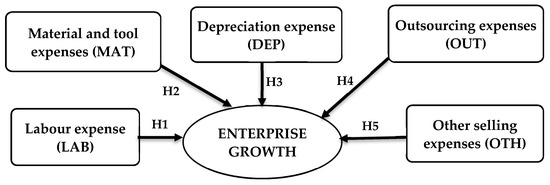
Figure 1.
Conceptual framework. Source: Compilated by the authors based on research results.
3.2. Empirical Models
In this research, the authors use STATA version 2015 and apply quantitative research into regression models, which comprise labour expense (LAB), material and tool expenses (MAT), depreciation expense (DEP), outsourcing expenses (OUT), and other selling expenses (OTH) as the independent variables and firm size growth ratio (SGR), revenue growth ratio (RGR), and profit growth ratio (PGR) as dependent variables. The main regression models are developed in accordance with three different dependent variables:
- -
- Model 1: PGRit = α + β1 × LABit + β2 × MATit + β3 × DEPit + β4 × OUTit + β5 × OTHit + ε
- -
- Model 2: RGRit = α + β1 × LABit + β2 × MATit + β3 × DEPit + β4 × OUTit + β5 × OTHit + ε
- -
- Model 3: SGRit = α + β1 × LABit + β2 × MATit + β3 × DEPit + β4 × OUTit + β5 × OTHit + ε
where: α, β1, β2, β3, β4, and β5 are coefficients and ε is error.
In the quantitative method, there are three types of data including time series, cross-section, and panel data. Time series data is a set of observations on value at different points of time (e.g., GDP, population, or production value). Cross-section data are collected at the same time for one or several individuals with different spaces or units. Finally, panel data is a mixture of those types above when cross-section data are collected for a period of time. Thus, authors used panel data to analyse this research since the chosen observations were several indicators from financial statements of 255 large-scale enterprises over four years. The use of panel data is considered the more advantageous method compared to other methods, as follows: provides data that is more informative, more effective, more diverse, less collinear among variables, and offers more degrees of freedom.
- -
- Suitable to study the dynamics of change.
- -
- Detect and measure efficiently effects that could not be observed in time series data and cross-section data.
- -
- Used to study more complex behavioural models
- -
- Minimises discrepancies if authors aggregate individuals or businesses into aggregate figures.
From the collected panel data, authors built three linear regression models and the difference among them is the dependent variables since each model represents a particular dependent variable. Model 1 evaluates the impacts of the independent variables in selling expense structure on Profit while Model 2 for Revenue and Model 3 for Firm Size. Additionally, three dependent variables have different calculations including SGR, which is based on the natural logarithm of total asset, and PGR and RGR, which are calculated from net income and net sales, respectively (Table 1). On the other hand, all three regression models have the same independent variables that are labour expense, material and tool expenses, depreciation expense, outsourcing expenses, and other selling expenses. In conclusion, we can generalise the relationship between selling expense structure and business growth from the three linear regression models above.

Table 1.
List of dependent and independent variables of the regression models.
3.3. Research Method
In this research, we will follow both the qualitative research by citing the scientific theories from the previous research and quantitative research into correlation regression models and descriptive statistics. The authors established three regression models in accordance with three different dependent variables measuring the revenue growth, profit growth, and size growth that are supported by STATA version 2015.
The study demonstrated representativeness, objectivity, distinction, and reliability thanks to the research data collected from the financial statements of 255 large-scale enterprises listed on the Vietnamese stock exchanges under the following criteria:
- -
- Time period: Data is collected from financial statements of large enterprises throughout the last four years from 2015 to 2018 when Vietnam’s economy witnessed a recovery period of positive GDP growth and lower inflation compared to the financial difficulties during the period of 2011–2014 despite facing various challenges from the global economic environment (World Bank 2018). Vietnam’s economy has witnessed a strong domestic demand in export-oriented Industrial and Manufacture sectors, which are significantly contributed to by large enterprises. Moreover, the last four-year period helps the study to ensure the updated information to provide topical results before giving an overview of the whole process as well as tracking in detail the specific fluctuations each year.
- -
- The observations scale: To ensure the validity and reliability of the study, we proceeded to select relevance sampling, which is also called purposive sampling (Krippendorf 2004). This paper selects the sample by the business scale rather than the industry, which is the way previous studies often do, thereby increasing the justice and objectivity in assessing the selling cost structure and the growth of businesses with the same size. The study of large enterprises in Vietnam is essential because the number of large enterprises accounts for only 2.5% of enterprises nationwide but contributes up to 60% of GDP in Vietnam (Ha 2018).
- -
- The number of observations: Currently, there are 1533 companies listed on the three biggest stock exchanges in Vietnam including HNX, HOSE, and UpCom, from which the authors selected 255 enterprises (including Consumer Staples, Industrials and Manufacture sectors) to ensure the criteria: meeting the large enterprise standards according to the Decree No. 39/2018/ND-CP (Goverment 2018), having full financial statements for the 2015–2018 period, and especially having full explanation of the selling expense structure on notes to financial statements. Like most countries in the world, the classification of large, small, medium, and micro enterprises in Vietnam is also based on criteria such as the number of employees and either turnover or balance sheet total (European Commission 2015; Dotdash 2019). Table 2 indicates the list of criteria for the big enterprise in Vietnam according to Decree No. 39/2018/ND-CP (Goverment 2018).
Table 2. List of criteria for the big enterprise in Vietnam.
Data source research: In order to collect data for this research, we searched for audited consolidated financial statements in four years between 2015 and 2018 of all 255 chosen companies from step 1 from three different sources: http://s.cafef.vn/ (VCCorp Joint Stock Company 2019), https://finance.vietstock.vn/ (Vietstock 2019), and https://www.vndirect.com.vn/ (Vndirect Securities Corporation 2019). These sources are ranked as the most popular and reputable websites for financial data and security investment data in Vietnam. The process of collecting data from sources is fundamentally similar. For example, collected from the source http://s.cafef.vn/: We first logged into the Website http://s.cafef.vn/, selected DATA, and then entered a company’s stock code in the search box. Similar to the Vndirect website, all the information about this company would be displayed on the Cafef website. Next, in “The Company Profile” section, we chose “Download Financial Statements” and downloaded the consolidated financial statements of the chosen companies between 2015 and 2018. The full set of financial statements, including balance sheets, income statements, cash flow statements, and notes to financial reports, are attached on that file.
The research process can be summarised in the following Figure 2:
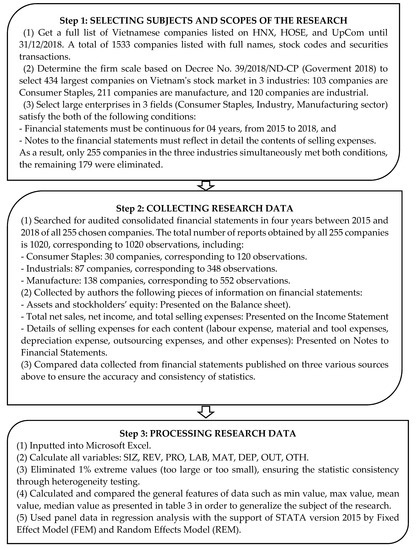
Figure 2.
The research process. Source: Compilated by the authors based on research results.
With regards to FEM, assuming that each observation has its own feature that could affect the explanatory variables, FEM can analyse the correlation between the residual of each observation and the independent variables to control and separate the effects of individual characteristics from the independent variables. Hence, we could estimate the net effects of independent variables on dependent variables. The difference between random effect model (REM) and FEM is seen in a variety of observations. In other words, the variation of observation is correlated with the independent variables in FEM, whereas those in REM are assumed to be random and incompatible with independent variables. Additionally, in order to define which model should be correspondent with which empirical model, the Hausman Test was implemented.
4. Results
4.1. Descriptive Analysis
Table 3 indicates the descriptive analysis results of three different dependent variables (SGR, RGR, and PGR) as well as five independent variables (LAB, MAT, DEP, OUT, OTH) with the number of their mean, median, the maximum and minimum value, standard deviation, and observations in 255 chosen companies in Vietnam from 2015 to 2018. In general, the mean of PGR is the highest number at 0.653. In some case, business growth can be accelerated with good profitability. This may mean that the higher profit companies could gain, the faster growth they could motivate; otherwise, most firms do business inefficiently as well as have negative profitability. This is followed by the figures for SGR at 0.145, which is quite small compared to PGR. It means that business growth does not require a big improvement in firm size, which is measured by the total asset. Hence, it is believed that in business growth, the total asset rarely increases dramatically in a short period of time. By contrast, the lowest level was recorded in the mean of RGR with −1.540. Therefore, it was least reflected on the growth of large-scale enterprises—those that focus on sustainable growth rather than growth hacking.
Table 3.
Descriptive analysis.
For the independent variables, the result points out that the mean of OUT comes at 0.427, which is the highest level. This means that the outsourcing of things plays the most significant role in the growth of enterprises. The next highest value belongs to the mean of OTH (0.300) and the mean of LAB (0.226) in sequence. Expenses such as sales staff, costs of product introduction, marketing, and advertising costs have a positive impact on business growth. Meanwhile, the mean of MAT and DEP are small at 0.035 and 0.033, respectively. Therefore, materials, tools, and depreciation expenses have the least effect on business growth of big enterprises.
The correlation among independent variables and dependent variables is presented in Table 4, which is based on secondary data collected from financial statements between 2015 and 2018 in the 255 biggest companies in Vietnam. Overall, most of the independent variables have a negative influence on three dependent variables.
Table 4.
Correlation analysis.
Regarding PGR, DEP plays the most important role in profit growth at 0.069. This is followed by the figures for LAB and OTH at 0.018 and 0.005 in sequence. By contrast, the adverse impacts on profit growth belong to MAT (−0.008) and OUT (−0.029). In terms of RGR, all of the independent variables influence negatively the revenue development of large businesses except for OTH (0.036). More importantly, LAB is the variable having the most negative effect on revenue growth. When it comes to SGR, OUT is the one and only factor affecting firm size growth positively (at 0.132) while OTH has an adverse effect.
Moreover, the most considerable correlation is witnessed for DEP and PGR positively and for MAT and SGR negatively; by contrast, almost all of no interaction arise between OTH and PGR in a positive way and between DEP and RGR in a negative way. Another standout from this table is that apart from DEP, all independent variables have a high level of correlation with each other; thus, the prediction is that autocorrelation among independent variables would occur and lead to regression defects for models.
The Figure 3 below compares the profit growth level in three different industries including Consumer Staples, Industrials, and Manufacture between 2015 and 2018. Overall, it is clear that all the profit growth rate of large enterprises increased over the period shown. In general, a much higher growth level of business profit was seen in Industrials in comparison with others, and Industrial enterprises experienced the fastest growth in profit. More importantly, in the last year of the given period, Industrials was the sector witnessing the most significant rise in profit growth; meanwhile, its counterparts showed the opposite trend.
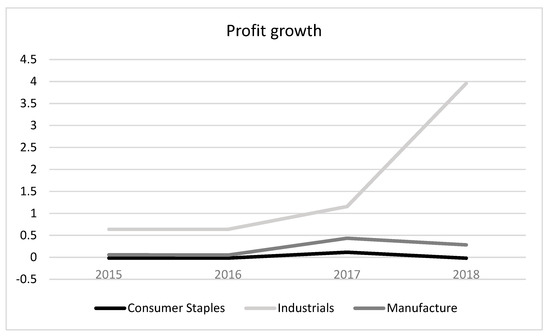
Figure 3.
Profit growth. Source: Compiled by the authors based on research results.
In the first year of the period, each industry experienced a period of stability when Consumer Staples and Industrials remained constant at 1.457 and 0.825, respectively, compared to Manufacture, which saw a very gentle rise by 0.004 times. Between 2016 and 2017, all researched enterprises showed a slight increase while a much higher level of profit growth was recorded in the Industrials at 0.637 and 1.155 by 2016 and 2017, respectively. In 2018, the profit growth of Industrial companies reached the highest level by almost 4 times; meanwhile, the figures for Manufacture and Consumer Staples dropped to just around 0.284 and −0.020, after reaching a peak at 0.433 and 0.115.
Figure 4 gives information about the revenue growth of large-scale businesses in three sectors above in the given period. Overall, all big enterprises in these three sectors experienced a significant decline in revenue over the given period but the biggest downward trend in profit growth level was seen in the Manufacture companies.
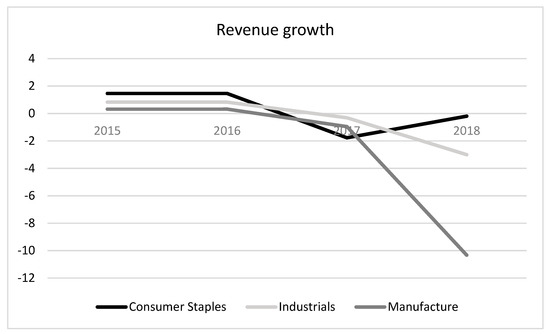
Figure 4.
Revenue growth. Source: Compiled by the authors based on research results.
In the beginning, revenue growth of Consumer Staples was at the highest level at 1.457, which was replaced by Industrials in the middle of 2016, while that of Manufacture made up the lowest level during the given period excepted for 2017. From 2015 to 2017, the revenue growth rate of Industrials and Manufacture decreased by around 1 time, but the number of Consumer Staples sector declined tremendously by more than 3 times. In 2018, the figure for Consumer Staples enterprises was almost equal to the balanced point at 0 after a year of recovery; the rates for Industrials and Manufacture were much lower than that at −3.004 and −10.327, respectively, after seeing a sharp decline in the last year.
In order to evaluate the enterprise growth effectively, the Figure 5 below compares the level of enterprise-scale growth in three industries from 2015 to 2018. Clearly, the scale development rate in the three sectors experienced a fluctuation, which caused an upward trend in Industrials and Manufacture and a downward trend in the other throughout the period.
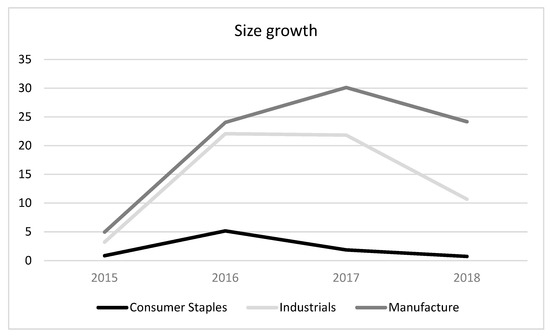
Figure 5.
Size growth. Source: Compiled by the authors based on research results.
In the first year of the period, all researched companies had the size growth rates surging over the period shown, but the figure for Consumer Staples was much lower than its counterparts (at 0.850 and 5.154 in 2015 and 2016, respectively). There were slight fluctuations in the size growth level of big enterprises in three industries during the rest period from 2016 to 2018, when the figure for Consumer Staples business size experienced a gentle drop by about 4 times and that for Industrials saw a significant decline a half from 22.070 to 10.675 after a period of stability from 2016 to 2017. In contrary to the two aforementioned industries, Manufacture company size development rate saw a dramatic rise and reached a peak at around 30 in 2017. At this point, the numbers started to fall significantly and dropped by 24.165 times. Overall, Manufacture was the industry having the largest enterprise-scale all the time in the given period.
The Figure 6 below compare the selling expense structure of large-scale enterprises in three sectors, namely Consumer Staples, Industrials, and Manufacture over a four-year period from 2015 to 2018. It is noticeable that all three sectors require a significant investment in Labour, Outsourcing, and Others rather than Materials and Depreciation expense for the fixed assets.
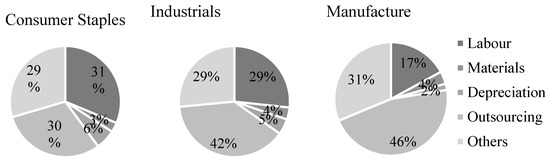
Figure 6.
Selling expense structure in three sectors. Source: Compiled by the authors based on research results.
Overall, Outsourcing accounted for the largest proportion of the total expenses in three sectors. Expenses for outsourcing made up 46% of the selling expense for the Manufacturers; this was 4% higher than the proportion of outsourcing cost in the Industrial companies and 16% more than that of the Consumer Staples ones. On the other hand, large Manufacturing companies spent a greater expenditure on Other expenses including marketing, product introduction, and others (31%) than those for their counterparts (both at 29%). Expenditure on sales staff played a vital role in the selling expense structure of these enterprises especially in the Consumer Staples industry, where it accounted for 31%, 29%, and 17% at Consumer Staples, Industrials, and Manufacture, respectively. In contrast, large-size companies in the three sectors spent very little in Materials and Depreciation. Specifically, the proportions of investment in Materials and Depreciation of these enterprises were about 11% and 13%, respectively, when Consumer Staples companies spent more in Depreciation but less on Material and tool than their counterparts.
4.2. Empirical Models
The empirical method is necessary for scientific research. It usually involves systematic collection and data analysis, which are used in quantitative research. Besides qualitative research, the quantitative method contributes to the objectivity and reliability of the research results. In this part, we will indicate the empirical process to test the above hypothesis and then summarise the results.
Table 5 shows the regression results of the independent and dependent variables in the three models. More specifically, the first three columns are the results of the correlation regression for the dependent variable PGR (profit growth ratio); the next three columns are the results of the correlation regression for the dependent variable RGR (revenue growth ratio). The final two columns present the correlation regression results for the dependent variable SGR (size growth ratio). The authors use both the fixed effect model (FEM) and the random effect model (REM) methods to try for each model. Then, to choose which method is more suitable for each specific model, the author will use the Hausman Test and find that REM model will be used for two models PGR and RGR, but FEM is appropriate for the SGR model.
Table 5.
Empirical models.
More specifically, the Hausman Test results of the PGR model show the p-value (Hausman Test of PGR model) = 0.1187 > 0.05. Thus, REM model is chosen for the PGR model. p-value (Hausman test of RGR model) = 0.7111 > 0.05. Thus, REM model is chosen for the RGR model. p-value (Hausman test of SGR model) = 0.0000 < 0.05. Thus, FEM model is chosen for the SGR model.
Going deeper into the PGR model (column 3), we see that only the labour costs and the depreciation costs have a positive impact on the growth of profits in the 255 biggest corporations in Vietnam. However, only the depreciation costs impact significantly the PGR variable. All remaining types of selling expenses have a negative and insignificant impact on the change in profit growth ratio. For the RGR model, on the other hand, all types of selling expenses have an insignificant impact on this dependent variable with a confidence level of 95%. In terms of signs of the impact, the labour costs, material costs, and depreciation expenses for sales departments all have a negative impact on the growth of revenue in the business, while other types of selling expenses are on the reverse pattern. For the SGR model, by contrast, almost all types of selling expenses have a significant impact on the change of firm size. More specifically, while the outsourcing expenses have a positive and significant effect on SGR, those of Materials and Depreciation have a negative and significant impact on this dependent variable.
In order to increase the reliability of the models, the author continues to use the tests to check for the autocorrelation phenomenon; the variance of variation errors still exist in all three models of PGR, RGR, and SGR. For testing whether the autocorrelation exists, the author will compare the p-value of the test with 0.05: if the value is greater than 0.05, the autocorrelation does not exist, otherwise, there will be autocorrelation. With the PGR model, because p-value (Model 1) = 0.0000 < 0.05 → Model PGR has autocorrelation. For the RGR model, because p-value (Model 2) = 0.0082 > 0.05 → Model RGR has autocorrelation. For the RGR model, because p-value (Model 3) = 0.1381 > 0.05 → Model SGR has no autocorrelation.
Continuing to use the White test to determine whether the models have variance or not, the author finds that all three models do not exist. The reason is that both the PGR Model and the RGR Model use the random-effects model (REM), so they do not have any change in error variances, while p-value (Model 3) = 0.23621 > 0.05, so the SGR model does not have any change in error variances.
In order to fix the autocorrelation problem in Model 1 and Model 2, it is necessary to apply for this model an adjusted REM as REM* in Table 5. Thus, through the correlation regression results, the PGR, RGR, and SGR models no longer exist any defects, and they can be written as follows:
- Model 1:
- PGRi,t = 1.162 + 0.170 × LABi,t − 0.377 × MATi,t + 2.237* × DEPi,t − 0.826 × OUTi,t −0.729 × OTHi,t + εi,t.
- Model 2:
- RGRi,t = −3.930 − 0.850 × LABi,t − 3.946 × MATi,t −0.281 × DEPi,t + 2.122 × OUTi,t + 5.153 × OTHi,t + εi,t.
- Model 3:
- SGRi,t = 0.150*** + 0.000491 × LABi,t − 0.240 × MATi,t − 0.148 × DEPi,t + 0.105* × OUTi,t −0.121 × OTHi,t + εi,t.
5. Conclusions and Recommendation
5.1. Conclusions
The study showed that while all 255 firms in the country had a good growth trend in terms of profit and total assets size during four years from 2015 to 2018, the changes in the three industries are completely different. Specifically, a much higher growth level of business profit was seen in Industrials in comparison with other industries, and Industrial enterprises experienced the fastest growth in profit. For revenue growth, on the other hand, all big enterprises in these three sectors experienced a significant decline in revenue over the given period but the biggest downward trend in profit growth level was seen in the Manufacture companies. Finally, the scale development rate in the three sectors experienced a fluctuation, which caused an upward trend in Industrials and Manufacture and a downward trend throughout the period.
In terms of selling expense structure, these businesses have a common feature of using relatively little sales costs for labour but allocating dominant resources to outsourcing and other selling expenses. This is unreasonable because although sales staff compensation plays a vital role in encouraging the performance of businesses, it accounts for 31%, 29%, and 17% total selling expenses in Consumer Staples, Industrials, and Manufacture, respectively. Meanwhile, outsourcing expenses and other selling expenses are only expenses for unimportant purposes such as insurance, travel, reception, and transportation: they make up 69%–77% of the total selling expenses in these industries.
From the results presented in Table 5, it can be said that if the proportion of staff cost increases by 10%, profit will grow by 1.7%, but revenue and firm size will decrease by 8.5% and 1.67%, respectively. Meanwhile, if the material cost is increased by 10%, the profit and size of the business will decrease by 3.8%, and 7.2%, respectively; however, this expense has no effect on the change of revenue in the business. For depreciation expenses, with a confidence level of 99%, it can be said that for each increase of 10% of this expense, it will lead to a reduction of business size by 6.1. Additionally, with the confidence level of 90%, an increase by 2.4 will be expected in the profit of the business after the increase by 10% of the depreciation expense. Other selling expenses, on the other hand, do not have a statistic significant impact on all the three variables dependent on measuring business growth, while outsourcing expense has a positive impact on firm size growth.
5.2. Limitations
Besides the achieved results, this study still has some shortcomings. Firstly, the study only looks at three dimensions of business growth, namely profit growth, revenue growth, and size growth, which means this can lead to a biased result without concerning some critical indicators such as shareholders’ wealth and market value. Therefore, the following research in the future can mention other indicators of firm growth by comparing the business performance to competitors (Delmar et al. 2003) or mentioning other internal aspects of firm size, including the number of employees or customers loyalty instead of only looking at assets. Secondly, this study has not considered sustainable growth rates even though most big businesses today are extremely interested in this indicator as a replacement for profit and revenue volume. The main reason is that sustainable development is not only an urgent need but also an inevitable trend of social development (Minh 2019).
In addition, this study only conducts research on the 255 large-scale listed companies; hence, it remains uncertain whether these conclusions hold for private firms and SMEs. Moreover, research data is collected from the financial statements of enterprises, which are not always accurate. Consequently, there are variations in building and testing regression models explaining the influences of selling expense structure on business growth.
Finally, because of the limited public data on the financial statements of Vietnamese enterprises, this paper has just studied and analysed the duration of four years (from 2015 to 2018), which is quite short compared to numerous global papers. Moreover, from 2015 to 2018, the Vietnam domestic market was strongly influenced by the financial crisis as well as the challenges of the global economy. As a result, the data collected during the given period carries many potential risks, leading to bias in the research results.
5.3. Recommendation
5.3.1. For the State
Generally, the State plays an essential role in a competitive market economy when resolving market difficulties as well as creating fair competition for all businesses to ensure that the economy can grow and stay firm. In fact, SMEs account for about 90% of the total number of businesses in Vietnam; nevertheless, large enterprises contribute to most of the national GDP while they also face many challenges and difficulties. Therefore, the government should promote the promulgation and implementation of policies to support large enterprises as well as coordinate with appropriate authorities to support big businesses most effectively.
Specifically, the State could help large enterprises in various ways; however, the State should start with developing high-quality human resources through support in the training courses and budget for staff at these companies. In addition, the State also needs to pay special attention to policies on supporting production premises, especially when large enterprises need to move out of urban areas or need to expand the factory scale. Furthermore, the State should help large enterprises in terms of technology and techniques such as research, technological innovation, technology transfer, etc. Finally, the State also should support large enterprises to expand markets, especially in import and export activities so that businesses can reach more potential customers, thereby increasing market share and contributing to the process of reviving a stainable economy.
5.3.2. For Vietnamese Enterprises
For large-scale listed companies in Vietnam, it is essential to determine the impact of the selling expense structure on business growth because businesses cannot grow as expected with an inappropriate selling expense structure. The research outcomes show that a reasonable selling expense structure can optimise the enterprise growth; moreover, big companies need to allocate optimal selling expense as well as efficient use of budgets in the context of challenging economic conditions. The reason is that if businesses do not optimise their selling expenses, they will waste large budgets without bringing much value to their revenue or profit before growing firmly.
Large enterprises in Vietnam can restructure their selling expenses based on annual reports to come up with timely solutions, including focusing on the investment on factors that are conducive to business growth as well as strictly controlling the expenditure on the factors having adverse effects on the growth of enterprises. On the one hand, the types of selling expenses which large businesses need to pay more attention are sales staff and other expenses, especially marketing expense. It is mainly because improving the quality of human resources is the right and long-term investment decision. Employees who have excellent competence and are grateful to the company will be likely to stay longer and contribute harder for the company. Other costs, especially marketing, play a significant role in branding the company, thereby bringing revenue, profits, and market share, and can grow the business afterwards. On the other hand, large companies need to manage and report carefully about spending on materials and outsources to avoid wasting budgets; hence, big enterprises can have a reasonable selling cost structure, which contributes effectively to the business growth.
Author Contributions
Conceptualization, V.C.N.; data curation, T.N.L.N.; formal analysis, V.C.N., T.N.L.N., T.H.P., and S.H.V.; investigation, T.N.L.N., T.H.P., and S.H.V.; methodology, V.C.N.; Supervision, V.C.N.; writing—original draft, T.N.L.N., T.H.P., and S.H.V.; writing—review and editing, V.C.N. All authors have read and agreed to the published version of the manuscript.
Funding
This research received no external funding.
Acknowledgments
The authors are most grateful to the three anonymous referees for their helpful comments and suggestions.
Conflicts of Interest
The authors declare no conflict of interest.
References
- Agarwal, Anupam, Eric Harmon, and Michael Viertler. 2009. Cutting Sales Costs, Not Revenues. Available online: https://www.mckinsey.com/business-functions/marketing-and-sales/our-insights/cutting-sales-costs-not-revenues (accessed on 9 October 2019).
- Ailawadi, Kusum L., and Scott A. Neslin. 1998. The Effect of Promotion on Consumption: Buying More and Consuming it Faster. Journal of Marketing Research 35: 390–98. [Google Scholar] [CrossRef]
- Ailawadi, Kusum L., Bari A. Harlam, Jacques César, and David Trounce. 2007. Quantifying and Improving Promotion Effectiveness at CVS. Marketing Science 26: 566–75. [Google Scholar] [CrossRef]
- Alchian, Arfiguremen A. 1950. Uncertainty, Evolution, and Economic Theory. Journal of Political Economy 58: 211–21. [Google Scholar] [CrossRef]
- Audretsch, David B., and Steven Klepper. 2000. Innovation, Evolution of Industry and Economic Growth. The International Library of Critical Writings in Economics Series; Pittsburgh: Carnegie Mellon University. [Google Scholar]
- Biesebroeck, Johannes Van. 2005. Firm Size Matters: Growth and Productivity Growth in African Manufacturing. Economic Development and Cultural Change 53: 543–83. [Google Scholar] [CrossRef]
- Blattberg, Robert C., Edward C. Malthouse, and Scott A. Neslin. 2009. Customer Lifetime Value: Empirical Generalizations and Some Conceptual Questions. Journal of Interactive Marketing 23: 157–68. [Google Scholar] [CrossRef]
- Calvo, José L. 2006. Testing Gibrat’s Law for Small, Young and Innovating Firms. Small Business Economics 26: 117–23. [Google Scholar] [CrossRef]
- Carey, Peter, Nava Subramaniam, and Karin Chua Wee Ching. 2006. Internal audit outsourcing in Australia. Accounting and Finance Association of Australia and New Zealand 46: 11–30. [Google Scholar] [CrossRef]
- Caves, Richard E. 1998. Industrial Organization and New Findings on the Turnover and Mobility of Firms. Journal of Economic Literature 36: 1947–82. [Google Scholar]
- Chandle, Gaylen N., and Erik Jansen. 1992. The founder’s self-assessed competence and venture performance. Journal of Business Venturing 7: 223–36. [Google Scholar] [CrossRef]
- Chen, Kwo-Shin, Emerson M. Babb, and Lee F. Schrader. 1985. Growth of large cooperative and proprietary firms in the US food sector. Agribusiness 1: 201–10. [Google Scholar] [CrossRef]
- Coad, Alex. 2007. Testing the principle of ‘growth of the fitter’: The relationship between profits and firm growth. Structural Change and Economic Dynamics 18: 370–86. [Google Scholar] [CrossRef]
- Coad, Alex, and Werner Hölzl. 2010. Firm Growth: Empirical Analysis. WIFO Working Papers. Available online: https://www.wifo.ac.at/jart/prj3/wifo/resources/person_dokument/person_dokument.jart?publikationsid=38423&mime_type=application/pdf (accessed on 18 February 2018).
- Connor, John M., and Scott Weimer. 1986. The intensity of advertising and other selling expenses in food and tobacco manufacturing: Measurement, determinants, and impacts. Agribusiness An International Journal 2: 293–319. [Google Scholar] [CrossRef]
- Davidsson, Per. 1989. Entrepreneurship—And after? A study of growth willingness in small firms. Journal of Business Venturing 4: 211–26. [Google Scholar] [CrossRef]
- Davidsson, Per, and Frederic Delmar. 1997. High-growth firms: Characteristics, job contribution and method observations. In RENT XI Conference. Mannhiem: Queensland University of Technology. [Google Scholar]
- Davidsson, Per, Leona Achtenhagen, and Lucia Naldi. 2010. Small Firm Growth. Foundations and Trends in Entrepreneurship 6: 69–166. [Google Scholar] [CrossRef]
- Delmar, Frédéric, Per Davidsson, and William Gartner. 2003. Arriving at the High-Growth Firm. Journal of Business Venturing 18: 189–216. [Google Scholar] [CrossRef]
- Dotdash. 2019. SME Definition. Available online: https://www.thebalancesmb.com/sme-small-to-medium-enterprise-definition-2947962#us-sme-definition (accessed on 30 September 2019).
- Drucker, Peter. 1973. Management: Tasks, responsibilities, practices. In Management: Tasks, Responsibilities, Practices. Edited by P. Drucker. New York: Harper & Row, pp. 23–29. [Google Scholar]
- Dunne, Paul, and Alan Hughes. 1994. Age, Size, Growth and Survival: UK Companies in the 1980s. Journal of Industrial Economics 42: 115–40. [Google Scholar] [CrossRef]
- European Commission. 2015. What Is an SME? Available online: https://web.archive.org/web/20150208090338/http://ec.europa.eu/enterprise/policies/sme/facts-figures-analysis/sme-definition/index_en.htm (accessed on 15 September 2019).
- Freel, Mark S., and Paul J. A. Robson. 2004. Small Firm Innovation, Growth and Performance: Evidence from Scotland and Northern England. International Small Business Journal: Researching Entrepreneurship 22: 561–75. [Google Scholar] [CrossRef]
- Gibrat, Robert. 1931. Les Inégalités Économiques. Paris: Librairie du Recueil Sirey. [Google Scholar]
- Goddard, John, Phil Molyneux, and John O. S. Wilson. 2004. Dynamics of Growth and Profitability in Banking. Journal of Money Credit and Banking 36: 1069–90. [Google Scholar] [CrossRef]
- Goverment, Vietnamese. 2018. The Decree Details Some Articles of the Law Supporting Small and Medium-Sized Businesses. 39/2018/NĐ-CP. Hanoi. Available online: http://vanban.chinhphu.vn/portal/page/portal/chinhphu/hethongvanban?class_id=1&_page=1&mode=detail&document_id=193166 (accessed on 26 December 2019).
- Gross, Jenna. 2016. Why Marketing Is SO Important? Business Market. Available online: https://movingtargets.com/blog/business-marketing/why-marketing-is-so-important/ (accessed on 15 April 2019).
- Gupta, Priya Dhamija, Samapti Guha, and Shiva Subraman. 2013. Firm growth and its determinants. Journal of Innovation and Entrepreneurship 2: 15. [Google Scholar] [CrossRef]
- Hölzl, Werner, and Klaus Friesenbichler. 2010. High-growth firms, innovation and the distance to the frontier. Economics Bulletin 30: 1016–24. [Google Scholar]
- Ha, Anh. 2018. Announcing and Introducing ASEAN’s Small and Medium-Sized Enterprise Policy in 2018. Available online: http://www.dangcongsan.vn/preview/newid/499741.html (accessed on 1 October 2019).
- Haas, Alexander, Ivan Snehota, and Daniela Corsaro. 2012. Creating value in business relationships: The role of sales. Industrial Marketing Management 41: 94–105. [Google Scholar] [CrossRef]
- Harabi, Najib. 2005. Determinants of Firm Growth: An Empirical Analysis from Morocco. Northwestern Switzerland: University of Applied Sciences. [Google Scholar]
- Hart, Peter E., and Nicholas Oulton. 1996. Growth and Size of Firms. Economic Journal 106: 1242–52. [Google Scholar] [CrossRef]
- Henrekson, Magnus, and Dan Johansson. 2010. Gazelles as job creators: A survey and interpretation of the evidence. Small Business Economics 35: 227–44. [Google Scholar] [CrossRef]
- Hermans, Julie, Johanna Vanderstraeten, Arjen Van Witteloostuijn, Marcus Dejardin, Dendi Ramdani, and Erik Stam. 2015. Ambitious Entrepreneurship: A Review of Growth Aspirations, Intentions, and Expectations. In Advances in Entrepreneurship, Firm Emergence, and Growth. Emerald: Emerald Group Publishing Limited, vol. 17, pp. 127–60. [Google Scholar] [CrossRef]
- Hiemstra, Stephen J. 1962. Depreciation: A Rising Cost of Processing Food Products. Journal of Farm Economics 44: 1577–82. [Google Scholar] [CrossRef]
- Huynh, Kim P., and Robert J. Petrunia. 2010. Age effects, leverage and firm growth. Journal of Economic Dynamics and Control 34: 1003–13. [Google Scholar] [CrossRef]
- Jang, SooCheong (Shawn), and Kwangmin Park. 2011. Inter-relationship between firm growth and profitability. International Journal of Hospitality Management 30: 1027–35. [Google Scholar] [CrossRef]
- Jena, Abhinash. 2013. Project Guru. PG. Available online: https://www.projectguru.in/publications/importance-marketing-success-organization/ (accessed on 12 November 2018).
- Jones, Geoffrey, and Peter Miskell. 2007. Acquisitions and firm growth: Creating Unilever’s ice cream and tea business. Business History 49: 8–28. [Google Scholar] [CrossRef]
- Ketler, Karen, and John Walstrom. 1993. The outsourcing decision. International Journal of Information Management 13: 449–59. [Google Scholar] [CrossRef]
- Koga, Maiko, and Haruko Kato. 2017. Behavioral Biases in Firms’ Growth Expectations. Ideas. Available online: https://ideas.repec.org/p/boj/bojwps/wp17e09.html (accessed on 10 June 2019).
- Konak, Fatih. 2015. The Effects of Marketing Expenses on Firm Performance: Empirical Evidence from the BIST Textile, Leather Index. Journal of Economics, Business and ManagementJournal of Economics Business and Management 3: 1068–71. [Google Scholar] [CrossRef]
- Krippendorf, Klaus. 2004. Content Analysis—An Introduction to Its Methodology, 2nd ed. California: Sage Publications, Inc. [Google Scholar]
- Kumar, Manmohan S. 1985. Growth, acquisition activity and firm size: Evidence from the United Kingdom. Journal of Industrial Economics 33: 327–38. [Google Scholar] [CrossRef]
- Levitt, Theodore. 1960. Marketing myopia. Harvard Business Review 38: 45–56. [Google Scholar] [CrossRef]
- Lindgreen, Adam, and Finn Wynstra. 2005. Value in business markets: What do we know? Where are we going? Industrial Marketing Management 34: 732–48. [Google Scholar] [CrossRef]
- Loh, Lawrence, and Natarjan Venkatraman. 1992. Determinants of Information Technology Outsourcing: A Cross-Sectional Analysis. Journal of Management Information Systems 9: 7–24. [Google Scholar] [CrossRef]
- Lotti, Francesca, Enrico Santarelli, and Marco Vivarelli IV. 2010. The relationship between size and growth: The case of Italian newborn firms. Applied Economics Letters 8: 451–54. [Google Scholar] [CrossRef]
- Lowe, D. Jordan, Marshall A. Geiger, and Kurt Pany. 1999. The Effects of Internal Audit Outsourcing on Perceived External Auditor Independence. Auditing A Journal of Practice & Theory 18: 41–44. [Google Scholar]
- Maltz, Arnold. 1994. Outsourcing the warehousing function: Economic and strategic considerations. Logistics and Transportation Review 30: 245–65. [Google Scholar]
- Mansfield, Edwin. 1962. Entry, Gibrat’s Law, Innovation, and the Growth of Firms. The American Economic Review 52: 1023–51. [Google Scholar]
- Markdao. 2019. Hire Marketing Agency—How Much Money That Business Should Spend? Markdao_Digital Marketing Solutions. Available online: https://www.markdao.com.vn/blog/thue-marketing-agency-doanh-nghiep-nen-chi-bao-nhieu-tien (accessed on 3 October 2019).
- Marris, Robin, and Adrian Wood. 1971. Growth, Competition, and Innovative Potential. Cambridge: Harvard. [Google Scholar]
- Martin, Charles L., and Michael K. Lavine. 2000. Outsourcing the internal audit function. The CPA Journal 70: 58–59. [Google Scholar]
- Melfi, Michael S. 2016. The Importance of Sales for an Entrepreneurial Organization. National Association of Sales Professionals. Available online: https://www.nasp.com/article/E7E6606D-4E51/the-importance-of-sales-for-an-entrepreneurial-organization.html (accessed on 12 October 2019).
- Mendelson, Haim. 2000. Organizational Architecture and Success in the Information Technology Industry. Management Science 46: 1–596. [Google Scholar] [CrossRef]
- Mengistae, Taye. 1999. Indigenous Ethnicity and Entrepreneurial Success in Africa: Some Evidence from Ethiopia. WB Policy Research Working Paper. Washington: SSRN. [Google Scholar]
- Minh, Hai. 2019. Business Grows Fast, but Must Be Sustainable. Available online: https://tinnhanhchungkhoan.vn/thoi-su/doanh-nghiep-phat-trien-nhanh-nhung-phai-ben-vung-278805.html (accessed on 11 October 2019).
- Ministry of Finance. 2014. Guidance on Enterprise Accounting Regime. Hanoi: Finance. [Google Scholar]
- Nelson, Eshe. 2019. The Global Economy Has Entered a Synchronized Slowdown. Available online: https://qz.com/1590499/the-global-economy-has-entered-a-synchronized-slowdown/ (accessed on 15 September 2019).
- Nguyen, Nguyen Phuc. 2016. Improve the Dynamic Competitiveness of Businesses: Research in the Field of Tourism. Research Gate. Available online: https://www.researchgate.net/publication/323474461_Nang_cao_nang_luc_canh_tranh_dong_cua_cac_doanh_nghiep_Nghien_cuu_trong_linh_vuc_du_lich (accessed on 26 December 2019).
- Nguyen, Thang Cong, Tan Ngoc Vu, Duc Hong Vo, and Dao Thi Thieu Ha. 2019. Financial Development and Income Inequality in Emerging Markets: A New Approach. Journal of Risk and Financial Management 12: 1–14. [Google Scholar] [CrossRef]
- Nijs, Vincent R., Marnik G. Dekimpe, Jan-Benedict E. M. Steenkamps, and Dominique M. Hanssens. 2001. The Category-Demand Effects of Price Promotions. Marketing Science 20: 1–22. [Google Scholar] [CrossRef]
- Nunes, Paulo Maçãs, Zelia Serrasqueiro, Antonio Nunes, and Luis Mendes. 2013. The Relationship Between Companies Growth and Labour Productivity in Portuguese SMEs: A Dynamic Panel Data Approach. Transformations in Business and Economics 12: 20–39. [Google Scholar]
- Okpara, John O. 2011. Factors constraining the growth and survival of SMEs in Nigeria: Implications for poverty alleviation. Management Research Review 34: 156–71. [Google Scholar] [CrossRef]
- Pavitt, Keith. 1984. Sectoral patterns of technical change: Towards a taxonomy and a theory. Research Policy 13: 343–73. [Google Scholar] [CrossRef]
- Phung, Hai Trong. 2018. Vietnamese Enterprises. 2 Options: Growth Directions for SEMs. Available online: https://doanhnghiepvn.vn/doanh-nghiep/2-lua-chon-mo-hinh-tang-truong-cho-smes/20181116092546424 (accessed on 16 November 2019).
- Ramsey, Rosemary P., and Ravipreet S. Sohi. 1997. Listening to your customers: The impact of perceived salesperson listening behavior on relational outcomes. Journal of the Academy of Marketing Science 22: 127–37. [Google Scholar] [CrossRef]
- Scott, Lever. 1997. An Analysis of Managerial Motivations Behind Outsourcing Practices in Human Resources. Human Resource Planning 20: 37–47. [Google Scholar]
- Stam, Erik, and Karl Wennberg. 2009. The roles of R&D in new firm growth. Small Business Economics 33: 77–89. [Google Scholar]
- Storey, David J. 2009. Understanding the Small Business Sector: Reflextions and Confessions. SSRN. Available online: https://papers.ssrn.com/sol3/papers.cfm?abstract_id=1496214 (accessed on 4 November 2019).
- Teau, Anna Miheala. 2013. Sales Force Motivation and Compensation. Romanian Statistical Review Supplement 61: 44–50. [Google Scholar]
- Tyagi, Pradeep K., and Carl E. Block. 1983. Monetary incentives and salesmen performance. Industrial Marketing Management 12: 263–69. [Google Scholar] [CrossRef]
- Variyan, Jayachandran N., and David S. Kraybill. 1992. Empirical evidence on determinants of firm growth. Economic Letters 38: 31–36. [Google Scholar] [CrossRef]
- VCCorp Joint Stock Company. 2019. Enterprise Data. Available online: http://s.cafef.vn/du-lieu-doanh-nghiep.chn (accessed on 20 September 2019).
- Vietstock. 2019. A-Z Enterprise. Available online: https://finance.vietstock.vn/doanh-nghiep-a-z?page=1 (accessed on 16 September 2019).
- Vndirect Securities Corporation. 2019. Select Symbol. Available online: https://www.vndirect.com.vn/portal/thong-tin-co-phieu/nhap-ma-chung-khoan.shtml?request_locale=en_GB (accessed on 30 September 2019).
- Wiklund, Johan. 1999. The Sustainability of the Entrepreneurial Orientation-Performance Relationship. Entrepreneurship Theory and Practice 24: 37–48. [Google Scholar] [CrossRef]
- Wong, Poh Kam, Yuen Ping Ho, and Erkko Autio. 2005. Entrepreneurship, Innovation and Economic Growth: Evidence from GEM data. Small Business Economics 24: 335–50. [Google Scholar] [CrossRef]
- Woodruff, Robert B. 1997. Customer value: The next source for competitive advantage. Journal of the Academy of Marketing Science 25: 139–53. [Google Scholar] [CrossRef]
- World Bank. 2018. Review Updated Situation of Vietnam’s Economy. Available online: http://documents.worldbank.org/curated/en/188661544471831249/pdf/132828-VIETNAMESE-REVISED-Taking-Stock-December-2018-Vietnamese.pdf (accessed on 12 September 2019).


© 2019 by the authors. Licensee MDPI, Basel, Switzerland. This article is an open access article distributed under the terms and conditions of the Creative Commons Attribution (CC BY) license (http://creativecommons.org/licenses/by/4.0/).