Abstract
This study examines the whether or not family firms are financially healthier than non-family in terms of capital structure and leverage. It therefore takes into consideration the existence of any significant differences between the leverage and risk choices of family and non-family firms. Using a panel data set of 888 firms and 7104 firm-year observations of unlisted small and medium size firms over the period 2007–2014, we present that family owned businesses have lower financial structure than those of non-family owned businesses. This indicates that most family firms use less debt financing than non-family firms, and as such maintain a lower level of debt. Secondly, family firms demonstrate lower risk as illustrated by the Altman Z-score. The Altman Z-score scale illustrates a contrary relationship of significance with respect to family firms and their counterparts in terms of the operation aspect of the business’s risk factors. Family firms managed their business operations with lower risk and are generally healthier financially than their counterpart firms. Lastly, findings from the robust tests for the hypotheses using a sample of bankrupt firms in Iberian Balance sheet Analysis System (SABI) reveal that the proportion of failure of family firms as opposed to their counterpart firms is relatively low. Analyzing the bankruptcy files of firms from 2002 to 2014 shows a considerably low ratio of family firms at the 5% significant level. This affirms that the low risk illustrated in the Altman Z-score regression is consistent to the lower ratio of family firms that were declared bankrupted over the study period, which makes Spain an important case in this study.
JEL Classification:
G1; G32; G38
1. Introduction and Literature Review
Following the evidence cited by several researchers over the years (such as Shleifer and Vishny 1986; DeAngelo and DeAngelo 2000; Anderson and Reeb 2003), one principal characteristic to influence the management of firms is that of its risk profile. Even though very little empirical research has shown light on this topic, the small amount of existing empirical research suggests that the characteristics of family owned companies could be a possible reason for family business risk aversion and the choice of capital structure.
Anderson and Reeb (2003) argue that the agency problems that exist between management and stakeholders is reduced when the structure of a family firm is adopted by a company. They suggest however that the risk averse nature of the controlling families is disintegrated through monitoring. DeAngelo and DeAngelo (2000) add that the risk nature of family firms achieved through engaging in lower risky activities that promote net present value by large and undiversified shareholders might impose costs to well-diversified shareholders with minority power. Following the illustration in (Miller et al. 2007; Villalonga and Amit 2006; Pison et al. 2014), 65%–80% of firms around the world are managed by one or more families, and generate approximately 70%–90% of the gross domestic product. Neubauer and Lank (2016) add that family owned businesses create approximately 70%–80% of jobs on a yearly basis. Meanwhile, evidence from the European Family Business (2012) present that over the globe, 85% of business startups are family orientated.
The fundament reason for the said study using Spain as the case is due to the peculiarities of the Spanish system being made up of approximately 90% family orientedbusinesses contributing to 60% of the country’s GDP. In (Pérez and Lluch 2015; Pison et al. 2014; European Family Businesses 2012), family-oriented businesses generate over two-thirds of the total employment, and often these firms are thought to be small and medium size enterprises. Yet little attention has been provided to the financial health of the business in terms of capital structure and leverage.
A review of both management and finance empirical evidence regarding the risk profile of family businesses suggests the main hypothesis that family-oriented businesses have lower leverage and lower risk, which could actually benefit the company during times of economic downturn. Thus, from a financial standpoint, this paper presents indicators that are specific to family-orientedbusiness with long-time horizon, family orientation, and generational continuity as potential reasons for family business risk aversion and the choice of capital structure for medium and small oriented family companies in Spain.
In order to answer the hypothesis, we first examine the characteristics of family firms in term of the operation aspect of the business’s risk factors and whether family firms managed their business operations with lower risk and are generally healthier financially than their counterpart firms. Next, we examine a series of bankruptcy filings in Spain from 2002 to 2014 and evaluate the proportion of family businesses in the sample.
Accordingly, March and Shapira (1987) consider decision investment as the deal between expected return and risk per the conventional theory. Masulis (1988, pp. 14−16) suggests that “managers in both family and non-family businesses will prefer having less leverage than shareholders in order to reduce the risk of their undiversified investment in the company”. Consistent with this view, Grossman and Hart (1986) argue that increased leverage reduces the agency cost of type I associated with managerial discretion and managers’ discretion over corporate decisions. In Bangladesh, Dey et al. (2018) present findings of financial risk disclosure indices in annual reports of 48 manufacturing companies over six-year period (2011–2015) using 30 disclosure identifiers. Their results show that there is a positive and significant relationship between the level of financial risk disclosure and firm size, financial performance, and auditor type.
A more recent study suggests “that risk is an unavoidable part of life, including business life and therefore, it exists in the content of uncertainty” (Garland 2003, p. 4). Furthermore, “it is no surprise that predicting the future is an uncertain task, involving, at best, probabilities, and inferences since the memory of the past is sometimes flawed and our knowledge of the present is incomplete” (Garland 2003, pp. 4–5). Hollenbeck et al. (1994) find that individuals treat risk as a dynamic factor, because the future carries its opportunities as well as it risks. They add that the “perspective of change in value rather than total value to evaluate a decision and to separate gains but not losses from initial outlay” is preferred by most risk analysis treating risk as a dynamic factor.
Furthermore, Bernstein and Bernstein (1996) add that the nature of risk has been sharp by the time horizon. May (1995) posits that the reason behind managers using only approximate time frames in their planning rather than the accurate time forecast is due to the personal risk when making decisions regarding firms risk. De Vries (1993) add that family businesses have a longer-term perspective than non-family businesses, (Oswald and Jahera 1991; Ntoung et al. 2016a), which may “improve decision-making resulting in higher earnings and dividends. After controlling for a variety of factors that affect cross-sectional debt levels among all firms”, Mishra and McConaughy (1999) conclude that family-controlled firms using less debt. This is indeed true because the use of less debt creates the founding family’s aversion to the risk of loss of control.
2. Family Control and Firm Value
Family control businesses have been debated over century by prior research that it enhances family firm value. Some classical research argues that the ownership structures in widely held firms create opportunities for conflicts of interest between managers and shareholders. This can reduce the value of the firm since managers of such firms are more concerned about the maximization of private benefits at the expense of the owner of the firms (Agency Cost of Type I). Other school of thought claim that the most suitable instrument to correct the action of such sulphurous management behaviour is through concentrated ownership, (Ntoung et al. 2017, p. 127). For instance, in (Ntoung et al. 2016a) (Jensen and Meckling 1976; Sraer and Thesmar 2007) claim that separation between ownership and control can involveimportant costs and problems forshareholders. Their classical agency problem suggests that one way to resolve the conflict of interest between shareholders and managers is to increase the proportion of shares in the hands of the controlling shareholder.
“In light of the above, minority shareholders are victimised as ownership becomes more concentrated, while controlling shareholders tend to engage in undesirable behaviours. In a similar way, Schulze et al. (2001) examine the consequences of altruism concept and pay of incentives by controlling shareholder, and their influence in the level family firm’s performance. They affirm that family firms with concentrated ownership are more exposed to agency danger. Chrisman et al. (2004) conclude that agency cost affects the performance of family business. Researches in Austria, Italy, and Spain show a positive and signification relationship between incentive and performance”, (Ntoung et al. 2016b).
Furthermore, Asghar Butt et al. (2018) add that most family owners are less likely to use derivatives for hedging purposes as compared to non-family owners. Examining corporate derivatives and the ownership concentration of 101 Pakistani non-financial firms over the period 2012–2016, they concluded that non-family firm are more likely to use derivativemeasures to increase the value of their stocks.
Meanwhile, Yang et al. (2018) conclude by attesting that in order to perform risk management practices in a way that will guarantee competitive position in the market, the top management need to have enough financial skills. Finally, “their findings suggest that these characteristics of family firms do influence their performance. In Europe, Barontini and Caprio (2006) provide similar evidence to those of Villalonga and Amit. According to them, family firms with a founder or descendants as CEO or Chairman outperform other firms. However, family firms with a founder as CEO outperform family firms with descendants as CEO. Also, if no member of the family is involved in the management (passive), then the firms perform worse” (Ntoung et al. 2017, p. 125).
Hypotheses
With respect to the mixed empirical evidence from prior research, one can clearly argue that financial and capital structure choices by family businesses are motivated by the level of risk assumed. Anderson and Reeb (2003) argue that “the principal-agent cost and the asymmetric information between shareholders and managers” is reduced when a structure of family firm is adopted in a company. They suggest however that the risk averse nature of the controlling families is disintegrated through monitoring. DeAngelo and DeAngelo (2000) add that the risk aversion of family companies is achieved through avoiding high risk projects even when they have positive net present value as large and undiversified shareholders might impose costs to well-diversified shareholders with minority power. Thus, our first hypothesis:
Hypothesis 1 (H1).
Family firms have lower leverage than non-family peers.
Hypothesis 2 (H2).
Family owned companies are less risky than non-family firms.
These hypotheses suggest that family owned firms possess some characteristics, such as family legacy, generational succession, and longer-term horizons, which might potentially be responsible for the capital structure choice and make family business more risk averse and conservative.
3. The Hypothesis, Methods and Data
3.1. Empirical Model
This study examines if family firms are financially healthier than their counterpart firms. This led us to two specific factors that determine the financial health of the firm as shown in Section 3.1.1 and Section 3.1.2 below.
3.1.1. Leverage
“We use a panel regression analysis to evaluate whether a family owned company has a different level of leverage to a similar non-family” (Ntoung et al. 2017) to examine the level of a firm’s leverage (debt/EBITDA ratio and interest coverage ratio). One reason for excluding the usual ratio of debt/capital is because it is influenced not only by the choice of debt level the company makes, but also by the level of equity the company has. Also, the debt/capital ratio induced the market perception of the firm into the equation, thus it wouldn’t provide aclean estimate of the leverage choices made by the firm.
We run five regression equations regarding our two dependent variables for leverage.
The regression equation is illustrated as follows:
where,
Leverage = α1 × (Family dummy) + α2 × Age + α3 × Size measure + α4 × Industry Dummy
+ α5 × Profitability measure + α6 × Interactive Variables
+ α5 × Profitability measure + α6 × Interactive Variables
- Leverage: Debt/EBITDA and Interest Coverage Ratio.
- Family firm takes: dummy equals 1 when a firm is a family firm or zero otherwise
- Profitability measure: refers to return of equity, return on assets, EBITDA margin, netincome margin
- Size measure: refers to number of employees, total revenues, total assets
- Age: calculate based on the company date of establishment.
- Industry dummy: equaling 1 as dummy for each IAC classification code,
- Year dummy: equals 1 for each year considered in the analysis.
Furthermore, to correct the presence of heteroskedasticity and serial correlation in the data, we employ the Huber–White sandwich estimator for variance (Ntoung et al. 2017).
3.1.2. Risk Exposure
“To critically analyze the risk profile of family businesses as opposed to their non-family peers, it is vital to examine beyond leverage, factors that reflect overall risk. We further evaluate these factors by employing the Altman Z-score, a predictive model developed to determine acompany’s probability of filing for bankruptcy in the next subsequence of years and to measure the overall financial health of a company” (Ntoung et al. 2016b).
Altman Z-score: We consider the Altman Z-score as a dependent variable. “The choice of variable regarding a company risk’s of survival was based on four balance sheet and income statement variables, namely profitability, leverage, solvency, liquidity, and activity. The result of the combination of ratios gives rise to a discriminantscore, otherwise called the Z-Score. The ratios are X1 = working capital/total assets, X2 = retained earnings/total assets, X3 = earnings before interest and taxes/total assets, X4 = market value of equity/book value of total debt, and X5 = sales/total assets. In 1998, Altman redefined his model by excluding X5 (sales/total assets) to forecast the corporate risk of survival for manufacturing firms in Mexico. The weighted coefficients thus have different values” (Ntoung et al. 2017).
Z″ = 6.5X1 + 3.2X2 + 6.72X3 + 1.0X4
Source: Altman et al. (1998, p. 3).
The analysis of family business risk characteristics using Altman Z-score provides information about risk exposure the company is willing to take on, hypothesizing that family firms would have a tendency to be more risk averse, if all things being equal.
We run five regression equations regarding our two dependent variables for leverage.
The regression equation is illustrated as follows:
where,
Altman Z-Score = α1 × (Family dummy) + α2 × Age + α3 × Size measure + α4 × Industry
Dummy + α5 × Profitability measure + α6 × Interactive Variables
Dummy + α5 × Profitability measure + α6 × Interactive Variables
- Altman Z-Score: 6.5X1 + 3.2X2 + 6.72X3 + 1.0X4
- Family firm takes: dummy equals 1 when a firm is a family firm or zero otherwise
- Profitability measure: refers to return of equity, return on assets, EBITDA margin, netincome margin
- Size measure: refers to number of employees, total revenues, total assets
- Age: calculated based on the company date of establishment.
- Industry dummy: equaling 1 as dummy for each IAC classification code,
- Year dummy: equals 1 for each year considered in the analysis.
Furthermore, to correct the presence of heteroskedasticity and serial correlation in the data, we employ the Huber–White Sandwich estimator for variance (Ntoung et al. 2017).
3.2. Data
In this section we examine the hypothesis that family owned companies have lower leverage and lower risk than non-family peersof unlisted small and medium size sing data constructed based on the Iberian Balance sheet Analysis System (SABI) of the Bureau Van Dijk, containing detailed financial information on more than 2,000,000 Spanish businesses. Next, we employ the IAC2015 classification code excludingall financial and utilities firms using the industry classification. The reason for the exclusion of firms in these industries is due to the fact that firms are strongly regulated and influenced by the government. We also excluded all firms with incomplete accounting information. Our final sample consists of 888 firms and 7104 firm-year observations of unlisted small and medium size firms over the period 2007–2014. The study is based on Spain because Spain was one of the European countries that suffered greatly duringthe 2008 financial crisis. Many small and medium size businesses experienced bankruptcy and, as a result of this, it reveals an important case to study. We were interested to investigate whether the businesses failure was due to a high leverage or risk profile.
3.3. Variables Measurement
3.3.1. Dependent Variables
Leverage is measured using the debt/EBITDA and interest coverage ratio and Altman Z-score. This is consistent with (Shleifer and Vishny 1986; DeAngelo and DeAngelo 2000; Anderson and Reeb 2003).
3.3.2. Independent Variables—Ownership structure
The criteria used for the ownership structure of firms in Spain are based on the Iberian balance sheet analysis system (SABI). These criteria focus on the holding of a shareholder’s ultimate voting rights across these firms, which differ from the ultimate cash flow rights. In cases where information was available about the ownership structure of a company, we search this property directly on the company websites. Firms in Spain were classified through the aid of the BvD independence indicator available in SABI. The BvD independence indicator has five levels, namely “A”, “B”, “C”, “D”, and “U”. According to SABI, independent indicator “A” denotes that a company is said to be independent if the shareholder must be independent by itself (i.e., no shareholder with more than 25% of ownership of ultimate voting rights), whereas independent indicator “B” is when no shareholders with more than 50% exist but one shareholder with voting rights between 25.1% to 50%. For a company to be classified with independent indicator “C”, the company must have a recorded shareholder with a total or calculated ownership of 50.1% or higher, whereas a company is classified as “D” when a recorded shareholder demonstrates direct ownership of over 50% with branches and foreign companies (Ntoung et al. 2017).
Independent indicator “U” is applied when a company does not fall into the categories “A”, “B”, “C” or “D”. Based on the above features and prior studies, a company with a shareholder having more than 25% is classified as family-run firm, while firms with no shareholder with more than 25% areclassified as widely held firms. This threshold of 25% allows shareholder to have significant influence on the firm. Therefore, firms categorized as “A” are widely held firms while firms in “B”, “C”, and “D” are family firms. Our next criteria for family is that, in a family firm, an individual or a family must be the largest shareholder and be categorized in “B”, “C”, and “D”. The individual must be part of the founding family. If this is not the case, the controlling shareholder must have had the largest percentage of ultimate voting right over a long time period.For each firm, we identify founding family presence using information provided by SABI about corporate proxy statements on board structure and characteristics, ECO attributes, equity ownership structure, and founding-family attribute” (Ntoung et al. 2017). In case where there weremissing data, we directly search the company website for extra detail.
3.3.3. Other Independent Variables
Profitability measure refers to the return of equity, return on assets, EBITDA margin, and net income margin. Size measure refers to number of employees, total revenues, and total assets. Age is calculated based on the company’s date of establishment. Table 1 provides a detailed definition of the variable used.

Table 1.
Definition of variable.
3.4. Descriptive Statistics
Table 2 shows a simple t-test analysis and itssignificance of the difference between family and non-family firms on each of the independent variables used in this study. With respect to the dependent variables, from our t-test presented in Table 2, both family and non-family firms exhibit the same risk profiles, even though family firms seem to be less risky than non-family firms. However, further examination is needed for the relationship between the variables in the form of regression estimates while controlling for other possible explanations for the outcome, as revealed in the t-test.
Table 2.
Descriptive Statistics.
Also, the outcomes of the different t-tests indicate that most of the controlling variables are different for both family and non-family firms. With respect toprofitability measures, non-family firms appear to be more profitable than their peers. The proxy of age reveals that family firms have a longer time-horizon than non-family firms.
Lastly, across the different industrial sectors, the outcome from the t-test shows that, for construction, other services, and restaurant and lodging trades, family firms significantly dominate their non-family counterparts. However, for transport, communication, management and insurance activities, as well as energy, water, and metal transforming industries, non-family firms significantly dominate family firms (See Table 2).
4. Empirical Analysis
4.1. Leverage
Table 3 and Table 4 summarize the panel regression outcomes for the leverage variable used in the study. We executed five regressions for each of the two dependent variables (debts/EBITDA and interest coverage ratio). This analysis helps us to prove whether a family firm has a different level of leverage than a similar non-family firm. For both analyses, we controlled for other possible proxy variables such as profitability measure (return of equity, return on assets, EBITDA margin, and net income margin), size measure (number of employees, total revenues, and logarithm of total assets), and age of firm based on the date of establishment
Table 3.
Debt/EBITDA Regression.
Table 4.
Interest Coverage Ratio Regression.
With respect to debts/EBITDA as a dependent variable for leverage, our results from Table 3 show negative significance at the debt level for the first regression. This indicates that most family firms use less debt financing than non-family firms, and as such maintain a lower level of debt.Regarding the profitability measure, the result from regression 1 illustrates a negative and statistically significant relationship between level of debt and profitability at the 5% level. These results suggest that most families tend to increase their reserves during the profitable circle of their firms and later reinvest this surplus profit when there is a need for expansion. They employ equity finance rather than debt finance for investment.
Further, to examine the cross-influence of family business age and size on debt, we execute regression 2 with interactive terms of two controlling variables and the family dummy. Specifically, the cross-influence of family business age and size on debt is positive and statistically significantly at the 5% level. The average age of most family examined in this study is 28, indicating that most of the firms are first generation. This result suggests that most family firms in their earlier developmentdepend on equity finance;however, as years go by, they more fully depend on debt finance for their activities. This is consistent with a positive and statistically significant correlation with the interactive term of family and size. Early in their development, most family firms depend on equity finance, but as they grow bigger, huge debt finance is needed to finance their activities.
In addition, regressions 3, 4, and 5 exclude some of the controlling variables and include some combination of interaction variables between size and family, profitability and family, and age and family, and are negative and statistically significant at the 5% level. These regressions using different combinations of variables indicate positive coefficients for the family dummy on debt. The results of these regressions illustrate that family firms actually have lower levels of debt than non-family firms. This result is consistent with several prior research papers which have examined the characteristics of family-controlled business. One possible reason for this could be that family ownership and control is responsible for most family businesses adopting a more risk averse structure and the tendency to avoid high risk activities. These results support the hypothesis that family owned companies have lower leverage than non-family firms (See Table 3).
With respect to the interest coverage ratio as a dependent variable for leverage, our results from Table 4 show a similar result in Table 3, with negative significance at the debt level for the first regression. This indicates that most family firms use less of debt financing than non-family firms, as such maintain a lower level of debt. Regarding the profitability measure, the result from regression 1 illustrates a negative and statistically significant relationship between the level of debt and profitability at the 5% level. These results suggest that most family firms tend to increase their reserves during the profitable cycle of their firms and later reinvest this profit when there is a need for expansion. They employ equity finance rather than debt finance for investment.
Further, to examine the cross-influence of family business age and size on debt, we execute regression 2 with interactive terms of two controlling variables and the family dummy. Specifically, the cross-influence of family business age and size on debt is positive and statistically significantly at the 5% level. The average age of most family firms examined in this study is 28, indicating that most of the firms are first generation. This result suggests that most family firms in their earlier developmentdepend on equity finance, however, as years go by, they come to fully depend on debt finance for their activities. This is consistent with a positive and statistically significant correlation for the interactive terms of family and size. During their earlier development, most family firms depend on equity finance, but as they grow bigger, huge debt finance is needed to finance their activities.
In addition, regressions 3, 4, and 5 exclude some of the controlling variables and include some combination of interaction variables between size and family, profitability and family, and age and family, and are negative and statistically significant at the 5% level. These regressions, using different combinations of variables, indicate positive coefficients for the family dummy in the case of debt. The results of these regressions illustrate that family firms actually have lower levels of debt than non-family firms. This result is consistent with several prior research papers that examined the characteristics of family-controlled businesses. One possible reason for this could be that family ownership and control is responsible for most family business adopting a more risks adverse structure and the tendency to avoid high risk activities. These results support the hypothesis that family owned companies have lower leverage than non-family firms (see Table 4).
4.2. Risk Exposure
In this section of our study, we prove the risk exposure of family businesses by applying the Altman Z-score, a predictive model developed to evaluate the possibility of a firm going bankrupt in the subsequent years and to measure the overall financial health of companies (Altman et al. 2013; Altman and Hotchkiss 2006). We run five regressions for the leverage analysis in Table 3 and Table 4.
Table 5 shows the positive significance of family orientated businesses as independent variables of the Z-score at the 5% level. These results suggest that a family-oriented business is actually healthier than its counterpart.
Table 5.
Altman Z-Score Regression.
We further examine the cross-influence of family business age and size on risk exposure. Specifically, the cross-influence of family business age and size on risk exposure is positive and statistically significantly at the 5% level. The positive sign shows the relationship between age and size to risk exposure. Following the Altman Z-Score, “to check the bankruptcy situation of these firms, Altman and Hotchkiss (2006) and Ntoung et al. (2016b) matched a correspondencebetween the Standard and Poor’s rating and the score, which makes the model reliable and consistent” (Ntoung et al. 2017). Therefore, the higher the Z-Score, the lowerthe possibility ofa firm being categorized in the distress zone, and this suggests that, at any size and age, family firms are less risky than their counterpart firms.
In addition, regressions 3, 4 and 5 “exclude some of the controlling variables and include some combination of interaction variables between size and family, profitability and family, and age and family” and are positive and statistically significant at the 5% level. This result confirms the results obtained in the first and second regressions.These regressions using different combinations of variables indicate positive coefficients for the family dummy on debt. The results of these regressions illustrate that family firms are actually less risky than their counterpart firms. This result is consistent with several prior research papers which examined the characteristics of family-controlled businesses. One possible reason for this could be that family ownership and control is the responsible for most family businesses adopting a more risk averse structure and the tendency to avoid high risk activities. These results support the hypothesis 2 that family owned companies are less risky than non-family firms (see Table 5).
4.3. Robustness Test
“The endogeneity of ownership structures of firmsbe theyfamily or non-family, post an important concern regarding the validity of the result obtained. Several authors fail to consider ownership as endogenous, and have reported a positive, negative, insignificant, nonlinear reverse relationship between ownership and firm performance. No study so far has provided evidence for the risk profile of Spanish family firms. Meanwhile, other authors have tested ownership as endogenous to obtain theconclusion of there being no significant relationship using either a panel-fixed effect or instrumental variables” (Ntoung et al. 2016a).
In this study, we argue that family ownership and control can be motivated by the lower leverage and risk aversion of family businesses as opposed to the school of thought that says thatfamily ownership and control is responsible for most family businesses adopting a more risk averse structure and the tendency to avoid high risk activities. This is indeed true because the use of less debt and lower risk strategies makes the founding family’s aversion to the risk of loss of control. Also, imagine that high leverage and high risk are associated with family ownership, this will either result to bankruptcy or disintegration of the family ownership and control. As usual, every business is characterized byboth ups and downs. To see if high leverage and high risk is the sole cause of family firms changing to non-family firms or to be categorised as bankrupt, or the reason why family businesses in Spain don’t attain the second and third generation, we sampled a series of bankruptcy filings of small and medium size firms in SABI from 2002 to 2014, evaluating the ratio of family to non-family companies in the sample. We selected a longer horizon time because these years represent the financial crisis of 2008–2014, as well as 2005 to 2007, and stable (2002–2004) markets in the Spanish economy. These different cycles in the economy will have a huge effect on family firm’s bankruptcies, due to the high inherent risk. The sample includes 534 companies that have been declared bankrupt in SABI. We collect information over the period 2002–2014. Big and listed firms were eliminated from the list. Only small and medium size firms are considered, giving us a total 526 small and medium firms that filed for bankruptcy from 2002 to 2014. We collected data on bankruptcy date, industry, year founded, number of employees, debt level at bankruptcy, a list of large shareholders at bankruptcy, as well as information about ownership and control. The ownership and control information helped us to categorize which firm is a family firm or non-family firm.
In Ntoung et al. 2017, “according to SABI, the shareholder ultimate voting rights across these firms differs from the ultimate cash flow rights. In cases where information was available about the ownership structure of a company, we search this property directly on the company websites. Family firms in Spain were classified through the aid of the BvD independence indicator available in SABI.” “The BvD independence indicator has five levels, namely “A”, “B”, “C”, “D”, and “U”. According to SABI, independent indicator “A”, denotes that a company independent if the shareholder must be independent by itself (i.e., no shareholder with more than 25% of ownership of ultimate voting rights), whereas independent indicator “B” is when no shareholder with more than 50% but one shareholder with voting rights between 25.1% to 50% exist. For a company to be classified with independent indicator “C”, the company must have a recorded shareholder with a total or a calculated ownership of 50.1% or higher, whereas a company is classified with “D” when a recorded shareholder has direct ownership of over 50% with branches and foreign companies”.
“Independent indicator “U” is applied when a company does not fall into the categories “A”, “B”, “C” or “D”. Based on the above features and prior studies, a company with a shareholder having more than 25% is classified as a family firm while firms with no shareholder with more than 25% areclassified as widely held firms. This threshold of 25% allows shareholders to have a significant influence on the firm. Therefore, firms categorized with “A” are widely held firms while firms in “B”, “C”, “D” are family firms. Our next criterion for a family firm is that an individual or a family must be the largest shareholder, and be categorized in “B”, “C”, and “D”. The individual must be part of the founding family. If this is not the case, the controlling shareholder must have had the largest percentage of ultimate voting rights over a long time period. After building a database by classifying which firm is family or non-family firm, Figure 1 shows the filingsforbankruptcy over 2002 to 2014”.
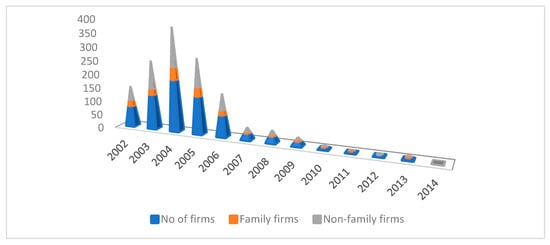
Figure 1.
Number of Bankrupt firms over the period 2002–2014. Source: Authors’ elaboration.
Analysing Figure 1 shows that family firms are less likely to file for bankruptcy in the years of difficult financial pressure and economic downturn, as opposed to the years of growth or stagnation. This is because family firms are characterised with lower debt and are less risky. The proportion of firms that filed for bankruptcy during the financial crisis 2008 to 2013 is relatively lower than those that filed in for bankruptcy during 2003–2004 for family firms. Also, the proportion of family firms that filed for bankruptcy isrelatively lower than their counterpart firms. Thus, high leverage and high risk cannot be the sole cause of family firms changing to non-family, or to be categorised as bankrupt, or the reason why family businesses in Spain don’t attain the second orthird generation.Therefore, the hypothesis that family firms have lower debt and manage their operations in a less risky manner is true.
We also back up the analysis in Figure 1 by running a t-test. The t-test evaluates whether there are significant differences between family and non-family firms with respectto four variables, namely the number of employees, age of firms, debt level, andratio of amortization over cash flow.The number of employees is a proxy for company size, while age distinguishes between younger and older firms, as well as being a proxy of generational succession.The ratio of amortization and cash flow is a proxy for the risk ofbankruptcy, while debt levels show the level of debt at bankruptcy.
Table 6 shows that the ratios of family/non-family firms in the sample in each year are 0.00 for 2012, 0.29 for 2008, 0.32 for 2004, and 0.44 for 2002, and statistically significant at the 5% level.This initial observation rejects the hypothesis that high debt and high risk cause family firms to file for bankruptcy, or causes family ownership to dissolve. Family firms have lower debt and are less risky thantheir counterpart firms. The ratio of family firms filing for bankruptcy is higher for 2004 (32.2%) and 2002 (44.2%) and lower for 2014 (0.0%), 2012 (0.0%), and 2008 (29.4%). This shows that family ownership involvement, in the management or ownership ofa significant holding, in the firms reveals a unique characteristic of the firms and thus maintains a lower percentage of bankruptcy cases. Comparing thisproportion of bankruptcy cases, we conclude that family firmshave lower debts and are less risky than non-family firms.
Table 6.
Bankrupt Firms over the period 2014–2002.
According to the difference between family and non-family with regards to number of employees, the age of firm, debt at bankruptcy, and the ratio of amortization/cash flows, our findings are significant at 5% and 10% levels. However, when evaluating the age of the firms that file for bankruptcy, it is apparent that family firms are younger on average. A potential explanation for this significant difference is that many of the firms categorized as family firms following the definition are start-ups or in their early stage in their life cycle. Such young firms are at greater risk to fail as compared to more established firms as in Table 7.
Table 7.
Bankrupt Firms over the period 2014 to 2002.
Younger firms tend to have founders present due to their phase in the cycle and therefore are categorized as family companies in this sample. However, these firms do not necessarily share the characteristics associated with family firms, such as long-term time horizon, succession planning considerations, and risk aversion. To eliminate this bias, we re-runa t-test for firms that filed for bankruptcy with the age of 10 years and above. Table 8 shows a duplicated version of Table 7, but only includes firms with an age above 10 years before declaring bankruptcy. As expected, the sample of family firms decreases in each of the years except for 2004. Specifically, in the year of financial crisis (2008–2013), the ratio of family firms filing for bankruptcy waslower than in the years of economic prosperity (2004–2007). This confirmed the fact that family businesses filing for bankruptcy is not due to the high debt and riskiness of the business. Using this sample, we can validate our hypothesis that family firms have lower leverage and are less risky than their counterpart firms.
Table 8.
Firms older than 10 years.
5. Conclusions
Numerous scholars have debated the uniqueness of the characteristics of family firms in terms of performance as opposed to their counterpart firms. The perception that families possess a more conservative attitude towards the management of the business makes family firms less risky. The risk profile of family business has been argued to be one of the characteristics significantly impacting the management of family business. In the light of the above, this paper has as its main objective to predict if family firms have lower leverage and manage their operations in a less risky manner as compared to their counterpart firms. The analysis conducted in this study yields some interesting results regarding the risk profile of the family firm.
Firstly, family firms have a lower financial structure than non-family firms. This indicates that most family firms use less debt financing than non-family firms, and as such maintain a lower level of debt. Regarding the profitability measure, this result suggests that most families tend to increase their reserves during the profitable cycle of their firms and later reinvest this reserved profit during economic downturn, rather than using debt finance. In other words, they employ their equity finance rather than debt finance for investment.
Secondly, family firms demonstrate lower risk as illustrated by the Altman Z-score. The Altman Z-score captures the financial risk inherent in a firm by examining four financial ratios (such as working capital/total assets, retained earnings/total assets, EBITDA/total assets, and market value of equity/book value of total debt). The significant difference between family firms and non-family firms on the Altman Z-score scale indicates that the lower inherent risk of family firms arises from the operation aspect of the business. Family firms managed their business operation with lower risk and are generally healthier financially than their counterpart firms. This explains the uniqueness of the capital structure of family businesses.
Lastly, the robust tests for the hypotheses using a sample of bankrupt firms in SABI reveal that the proportion of failure of family firms as opposed to theircounterpart firms is relatively low. Analyzing the bankruptcy files of firms from 2002 to 2014 shows a considerably low ratio of family firms at the 5% significance level. This affirms that the low risk illustrated in the Altman Z-score regression is consistent withthe lower ratio of family firms that were declared bankrupt over the study period. Lastly, the average debt at bankruptcy was lower and statistically significant for family firms as opposed to non-family firms. Therefore, the findings herein confirm the hypothesis that family firms have a lower capital structure and maintain more financially healthy operations than non-family firms.
Author Contributions
Conceptualization, methodology, software, and formal analysis, L.A.T.N.; validation, visualization, supervision and project administration, H.M.S.d.O.; formal writing, software and funding acquisition, B.M.F.d.S.; investigation and data curation and methodology, L.M.P.; visualization, formal analysis and resources, S.A.M.C.B. All authors have read and agreed to the published version of the manuscript.
Funding
This research was funded by Center for Studies in Business and Legal Sciences (CECEJ) and Research Centre for the Study of Population, Economics and Society (CEPESE).
Acknowledgments
We will like to give special thanks to the reviewers for their valuable comments. More thanks to Professor Paul Ntungwe Ndue for his remarkable review and assistance. Lastly, thanks to the Center for Studies in Business and Legal Sciences (CECEJ) and Research Centre for the Study of Population, Economics and Society (CEPESE) for all the financial funding and support provided by its members during this research.
Conflicts of Interest
The authors declared no potential conflict of interest with respect to the research, authorship, and publication of this article.
References
- Altman, Edward I., John Hartzell, and Matthew Peck. 1998. Emerging market corporate bonds a scoring system. In Emerging Market Capital Flows. Boston: Springer, pp. 391–400. [Google Scholar]
- Altman, Edward I., Alessandro Danovi, and Alberto Falini. 2013. ‘Z-Score Models’ Application to Italian Companies Subject to Extraordinary Administration’. Journal of Applied Finance 23: 128–37. [Google Scholar]
- Altman, Edward I., and Edith Hotchkiss. 2006. Corporate Financial Distress & Bankruptcy, 3rd ed. Hoboken: John Wiley & Sons. [Google Scholar]
- Anderson, Ronald C., and David M. Reeb. 2003. Founding-family ownership and firm performance: Evidence from the S&P 500. The Journal of Finance 58: 1301–28. [Google Scholar]
- Asghar Butt, Affaf, Main SajidNazir, Hamera Arshad, and Aamer Shahzad. 2018. Corporate Derivatives and Ownership Concentration: Empirical Evidence of Non-Financial Firms Listed on Pakistan Stock Exchange. Journal of Risk and Financial Management 11: 33. [Google Scholar] [CrossRef]
- Barontini, Roberto, and Lorenzo Caprio. 2006. The effect of family control on firm value and performance: Evidence from continental Europe. European Financial Management 12: 689–723. [Google Scholar] [CrossRef]
- Bernstein, Peter L., and Peter L. Bernstein. 1996. Against the Gods: The Remarkable Story of Risk. New York: Wiley, pp. 1269–75. [Google Scholar]
- Chrisman, James J., Jess H. Chua, and Reginald A. Litz. 2004. Comparing the agency costs of family and non‐family firms: Conceptual issues and exploratory evidence. Entrepreneurship Theory and Practice 28: 335–54. [Google Scholar]
- DeAngelo, Harry, and Linda DeAngelo. 2000. Controlling stockholders and the disciplinary role of corporate payout policy: A study of the Times Mirror Company. Journal of Financial Economics 56: 153–207. [Google Scholar] [CrossRef]
- De Vries, Manfred FR Kets. 1993. The dynamics of family controlled firms: The good and the bad news. Organizational Dynamics 21: 59–71. [Google Scholar]
- Dey, Ripon, Syed Hossain, and Zabihollah Rezaee. 2018. Financial risk disclosure and financial attributes among publicly traded manufacturing companies: Evidence from Bangladesh. Journal of Risk and Financial Management 11: 50. [Google Scholar] [CrossRef]
- European Family Businesses. 2012. Family Business Statistics. Available online: http://www.europeanfamilybusinesses.eu/uploads/Modules/Publications/family-business-statistics.pdf (accessed on 30 September 2018).
- Garland, David. 2003. The rise of risk. In Risk and Morality. Toronto: University of Toronto Press, pp. 48–86. [Google Scholar]
- Grossman, Sanford J., and Oliver D. Hart. 1986. The Costs and Benefits of Ownership: A Theory of Vertical and Lateral Integration. Journal of Political Economy 94: 691–719. [Google Scholar] [CrossRef]
- Hollenbeck, John R., Daniel R. Ilgen, Jean M. Phillips, and Jennifer Hedlund. 1994. Decision risk in dynamic two-stage contexts: Beyond the status quo. Journal of Applied Psychology 79: 592. [Google Scholar] [CrossRef]
- Jensen, Michael C., and William H. Meckling. 1976. Theory of the firm: Managerial behavior, agency costs and ownership structure. Journal of Financial Economics 3: 305–60. [Google Scholar] [CrossRef]
- March, James G., and Zur Shapira. 1987. Managerial perspectives on risk and risk taking. Management Science 33: 1404–18. [Google Scholar] [CrossRef]
- Masulis, Ronald W. 1988. The Debt/Equity Choice. Tampa: Financial Management Assoc, pp. 14–16. [Google Scholar]
- May, Don O. 1995. Do managerial motives influence firm risk reduction strategies? The Journal of Finance 50: 1291–308. [Google Scholar] [CrossRef]
- Miller, Danny, Isabelle Le Breton-Miller, Richard H. Lester, and Albert A. Canella Jr. 2007. Are family firm’s really superior performers? The Journal of Corporate Finance 13: 829–58. [Google Scholar] [CrossRef]
- Mishra, Chandra S., and Daniel L. McConaughy. 1999. Founding family control and capital structure: The risk of loss of control and the aversion to debt. Entrepreneurship: Theory and Practice 23: 53. [Google Scholar] [CrossRef]
- Neubauer, Fred, and Alden G. Lank. 2016. The Family Business: ItsGovernance for Sustainability. Berlin/Heidelberg: Springer. [Google Scholar]
- Ntoung, Agbor Tabot Lious, Helena Maria Santos De Oliveira, Cláudia M. F. Pereira, Benjamim Mamuel Ferreira De Sousa, Susana A. M. C. Bastos, and Cacilia Kome. 2017. Family Involvement in Ownership, Management and Firm Performance in Spain. Revista Contabilidade e Gestão, 21/Novembro. Lisboa: Ordem dos Contabilistas Certificados, pp. 123–53. [Google Scholar]
- Ntoung, Agbor Tabot Lious, Carlos Ferro Soto, and Ben C. Outman. 2016a. Ownership Structure and Financial Performance of Small Firms in Spain. Corporate Ownership & Control 13. [Google Scholar] [CrossRef]
- Ntoung, Agbor Tabot Lious, Puime Guillén Felix, and Miguel Angel Crespos Cibrán. 2016b. The Effectiveness of Spanish Banking Reforms: Application of Altman’s Z-Score. Risk Governance & Control: Financial Markets & Institution 6: 40–47. [Google Scholar]
- Oswald, Sharon L., and John S. Jahera. 1991. The influence of ownership on performance: An empirical study. Strategic Management Journal 12: 321–26. [Google Scholar] [CrossRef]
- Pérez, Paloma Fernández, and Andrea Lluch, eds. 2015. Familias Empresarias y Grande Sempresas Familiares en América Latina y España: Una Visión de Largo Plazo. Madrid: Fundacion BBVA. [Google Scholar]
- Pison, F. Irene, Cibrán F. Pilar, and Ntoung A. T. Lious. 2014. Cash flow fixing: A new approach to Economic Downturn (Small and Medium Size Enterprise). International Journal of Current Research and Academic Review 2: 271–90. [Google Scholar]
- Schulze, Willam S., Michael H. Lubatkin, Richard N. Dino, and Ann K. Buchholtz. 2001. Agency relationships in family firms: theory and evidence. Organization Science 12: 99–116. [Google Scholar] [CrossRef]
- Shleifer, Andrei, and Robert W. Vishny. 1986. Large shareholders and corporate control. The Journal of Political Economy 94: 461–88. [Google Scholar] [CrossRef]
- Sraer, Dvid, and David Thesmar. 2007. Performance and behavior of family firms: Evidence from the French stock market. Journal of the European Economic Association 5: 709–51. [Google Scholar] [CrossRef]
- Villalonga, Belen, and Raphael Amit. 2006. How do family ownership, control and management affect firm value? Journal of Financial Economics 80: 385–417. [Google Scholar] [CrossRef]
- Yang, Songling, Muhammad Ishtiaq, and Muhammad Anwar. 2018. Enterprise risk management practices and firm performance, the mediating role of competitive advantage and the moderating role of financial literacy. Journal of Risk and Financial Management 11: 35. [Google Scholar]

© 2019 by the authors. Licensee MDPI, Basel, Switzerland. This article is an open access article distributed under the terms and conditions of the Creative Commons Attribution (CC BY) license (http://creativecommons.org/licenses/by/4.0/).