Article

Research on Design Pattern Detection Method Based on UML Model with Extended Image Information and Deep Learning

1
School of Computer Science & Technology, Beijing Institute of Technology, Beijing 100081, China
2
College of Mathematics and Computer Science, Yan’an University, Yan’an 716000, China
3
Shaanxi Key Laboratory of Intelligent Processing for Big Energy Data, Yan’an 716000, China
*
Author to whom correspondence should be addressed.
Appl. Sci. 2022, 12(17), 8718; https://doi.org/10.3390/app12178718
Submission received: 3 August 2022 / Revised: 21 August 2022 / Accepted: 25 August 2022 / Published: 30 August 2022
(This article belongs to the Special Issue Reliability and Safety of Software Systems)

Abstract

:
Detecting relevant design patterns from system design or source code helps software developers and maintainers understand the ideas behind the design of large-scale, highly complicated software systems, thereby improving the quality of software systems. Currently, design pattern detection based on machine learning has become a hot research direction. Scholars have proposed many design pattern detection methods based on machine learning. However, most of the existing literature only reports the utilization of traditional machine learning algorithms such as KNN, decision trees, ANN, SVM, etc., which require manual feature extraction and feature selection. It is very difficult to find suitable and effective features for the detection of design patterns. In the previous research, we have initially explored a design pattern detection method based on graph theory and ANN. Based on the research work done, we speculate that if we can realize the end-to-end design pattern detection from system design or source code to design pattern with the help of the powerful automatic feature extraction and other advantages of deep learning, the detection effect can be further improved. This paper intends to first explore a UML model that extends image information, called colored UML, so as to transform the design pattern detection problem into an image classification problem; on this basis, the positive and negative sample sets and the system to be recognized are all expressed in the form of colored UML models, the convolutional neural network VGGNet is used to train the data set to extract features, and the extracted features are trained by the SVM for binary classification to judge the pattern instances. Experiments were carried out on three open-source projects. We used three non-machine learning design pattern detection methods and five design pattern detection methods based on traditional machine learning algorithms, as well as the method in this paper. In general, the method proposed in this paper achieved higher precision and recall, and for different programs and their patterns, the precision and recall were stable at more than 85% in most cases. The experimental results demonstrate that this paper can achieve a better effect in recognizing design patterns. The research is, therefore, of both theoretical significance and application value.

1. Introduction

A design pattern [1,2,3] is a specific method to solve a specific object-oriented software problem, realizing a more simple and convenient reuse of successful designs and architectures. Design patterns are widely used in the modern software industry to reuse best practices and improve the quality of software systems.
However, records on the use of design patterns are frequently lacking in systems amid the real-world software development process. When a system is lacking in information related to patterns, the system’s comprehensibility and maintainability will be significantly lowered, posing a constraint on potential benefits that would otherwise be brought by design patterns. Using computer algorithms to automatically or semi-automatically detect relevant design patterns (also known as recognize, identify, mine, discover, or recover relevant design patterns) from system design or source code, helps software developers and maintainers understand the ideas behind the design of large-scale, highly complicated software systems [4]. Soon after the GoF design patterns were proposed, a small number of scholars conducted research on the identification of design patterns. For example, in 1996, Krämer et al. [5] proposed a method to automatically search for structural design patterns in object-oriented software. These early works provide useful research directions and ideas for later researchers. At present, many scholars have incorporated such technologies as logical reasoning [5,6], graph theory [7,8,9], extensible markup language (XML) [10,11,12], abstract syntax tree (AST) [13,14], ontology technology [12,15], abstract semantic graph (ASG) [16], formal technologies [17], rules [18,19,20] into the research of design pattern recognition.
The emergence of machine learning technology in recent years has opened up a new route toward design pattern detection. As a central field of AI research, machine learning enables computers to simulate humans’ learning behaviors, acquire knowledge and life skills through spontaneous learning and constantly upgrade their performance in the learning process, thereby achieving self-improvement [21]. Design pattern detection in itself is a process of classifying numerous candidate pattern instances, while classification happens to be the main strength of machine learning, making it highly suitable for solving design pattern detection problems. Therefore, machine learning-based design pattern detection (also known as design pattern recognition, identification, mining, discovery, recovery) has become an intensively studied area in research of software reverse engineering.
At present, mainstream design pattern detection technologies can be roughly divided into two categories: non-machine learning design pattern detection methods and machine learning design pattern detection methods. Non-machine learning design pattern detection methods extract detection rules from theoretical descriptions of design patterns, limiting the effectiveness of these methods. Comparatively, existing literatures on machine learning design pattern detection methods are largely concerned with traditional machine learning algorithms such as k-nearest neighbor (KNN), decision trees, artificial neural network (ANN), and support vector machine (SVM), where deep learning cannot be directly applied to design pattern detection.
To address the above problems, this paper aims to explore a design pattern detection method based on the unified modeling language (UML) model with extended graph information and deep learning by building upon precedent works conducted by the authors [22,23,24]. In this paper, the traditional UML model is first extended to propose an extended UML model called colored UML, which extends graph information. On this basis, the positive and negative samples of pattern instances collected are converted to colored UML models in graph form; then, the convolutional neural network VGGNet is employed to train the dataset and extract features, and SVM are used to train the extracted features to obtain the binary classifier for each design pattern. After the classification models are generated, design pattern detection can be performed on unknown systems based on the binary classifier of each pattern. Deep learning technology has advantages, such as powerful automatic feature extraction, while SVM classifiers excel at binary classification problems. Pioneeringly, this paper converts the design pattern detection problem into a graph classification problem and leverages deep learning technology in combination with the SVM to recognize design patterns. In this way, we can realize the end-to-end design pattern detection from system design (here, mainly referring to the system UML model) or source code to design patterns. The experimental results show that the proposed method has a better detection effect compared with non-machine learning design pattern detection methods and the ones based on traditional machine learning algorithms, and can distinguish behavioral patterns with similar structural features. This paper breaks through the effective bottleneck of design pattern detection methods based on graph theory, formal techniques, XML, and other non-machine learning techniques, as well as KNN, decision trees, SVM, and other traditional machine learning algorithms, providing a brand-new idea and direction for future research and development in the field of design pattern detection. In addition, this paper also provides a reference idea and solution for UML model correctness and consistency checking, data flow diagram description and checking, software architecture description and checking, and other similar problems. Expanding to the field of reliability and safety of software systems, this paper introduces the most cutting-edge machine learning technology—deep learning into various aspects such as program correctness proof, automatic testing and BUG repair, code automatic completion, and code analysis, etc., making the field of reliability and safety of software systems truly enter the “intelligence era”.
At present, we have developed a prototype supporting tool system for the above design pattern recognition theory and method. The achievement of this paper can be applied to the detection of design patterns in the software development process of software companies or individuals. Users can more conveniently and quickly detect the corresponding design patterns from software systems, which can improve the quality of the software systems on the basis of saving a lot of human, financial, and material costs. Therefore, this study has both theoretical significance and broad application prospects. Processes such as system division and training of deep learning models are transparent to users. Users only need to master the preliminary knowledge of the object-oriented language or UML and design patterns, and then they can use this method and its supporting tool.

2. Research Status of Design Pattern Detection

2.1. Non-Machine Learning Design Pattern Detection Methods

As mentioned above, at present, scholars have proposed many design pattern detection methods based on non-machine learning technologies. These non-machine learning technologies include logical reasoning [5,6], graph theory [7,8,9], extensible markup language (XML) [10,11,12], abstract syntax tree (AST) [13,14], ontology technology [12,15], abstract semantic graph (ASG) [16], formal technologies [17], rules [18,19,20], etc.
Non-machine learning design pattern detection methods are generally divided into two stages: detection rule acquisition stage and pattern detection stage. The detection rule acquisition stage acquires detection rules from the theoretical description of design patterns and stores them in advance. The general process of the pattern detection stage is first extract the relevant information of the system to be recognized from the source code or system design, such as classes, attributes, operations, and different relationships between classes; then, according to the extracted system information, convert the system into a certain form with strict semantics; after the system is converted into a form with strict semantics, the system is divided into smaller units to be recognized, and the units to be recognized can be matched with the template design patterns according to the detection rules. If a to-be-identified unit matches a template design pattern successfully, the unit is considered to be a (candidate) instance of this pattern, otherwise, it is excluded (as shown in Figure 1).
These methods have had some success. However, the identification rules for these methods are all derived from theoretical descriptions of design patterns. The use of design patterns is very flexible, and there are often various pattern variants in practical engineering projects. It is difficult for the rules derived from the theoretical description of design patterns to take into account all situations. In addition, there are also cases where multiple classes in a pattern instance are associated with the same pattern role or a subsystem contains multiple instances of the same pattern, while these rules are often only for cases where one class is associated with the same pattern role and a subsystem contains only one instance of the same pattern. Therefore, using rules derived from theoretical descriptions of design patterns for design pattern detection will introduce a large number of false-negative or false-positive instances, limiting the precision and recall of these methods.

2.2. Machine Learning Design Pattern Detection Methods

In recent years, machine learning has increased, providing a new way to design pattern detection. Design pattern detection rules are very complex and flexible, while machine learning algorithms can learn rules from design pattern instances implemented in practical applications. Scholars have used machine learning techniques such as decision trees [25,26,27], clustering [25,26], KNN [27], SVM [27,28,29], linear regression [29], ANN [30,31,32], association analysis [33], and ensemble learning [34,35,36] to identify design patterns.
Design pattern detection methods based on machine learning are generally divided into two stages: model training stage and pattern detection stage. The general process of the model training stage is: first construct positive and negative samples from actual software systems; after obtaining positive and negative samples, perform feature extraction and feature selection, as well as feature transformation; finally, use machine learning algorithms to learn feature vectors to obtain design pattern classifier models and stored. The general process of the pattern detection stage is: first input the design models or source code of the system to be recognized; then extract the design model or source code information and construct smaller units to be recognized; and finally, use the trained design pattern classifier models to classify the to-be-identified units and output the classification results (as shown in Figure 2).
Traditional machine learning algorithms require manual feature extraction and feature selection. For the design pattern recognition problem with extremely flexible and complex rules, finding the most suitable and effective features is a very difficult task. Therefore, the design pattern recognition technologies based on traditional machine learning algorithms are difficult to popularize and develop. Deep learning, as the most concerned branch in the field of machine learning at present, is a key technology for realizing artificial intelligence [37]. Deep learning is a method in machine learning based on the representation learning of data without manual extraction and selection of features. It has been widely used in computer vision, target detection, natural language processing, sentiment analysis, and recommendation systems and has achieved very good results. However, deep learning is mainly applicable to continuous dense data forms [38] with local correlation, such as images [39,40,41], texts [42,43,44], and speech [45,46,47], and cannot be directly applied to design pattern recognition problems. The current literature on machine learning design pattern detection still mainly uses traditional machine learning methods such as KNN, decision trees, SVM, and ANN. Thaller et al. [34] presented Feature Maps, a flexible human- and machine-comprehensible software representation based on micro-structures, and represented pattern instances as feature maps and used them as input to train convolutional neural networks (CNNs). However, feature maps themselves are not in the form of continuous dense data, so this paper is actually still equivalent to using traditional ANN algorithm, and the trained CNNs do not give full play to the advantages of deep learning. The experimental results show that the detection effect of the CNN classifiers trained by Thaller et al. [43] is not significantly improved compared to the traditional ANN.

3. Extended UML Model with Graph Information—Colored UML

In this paper, information and features in the traditional UML model are expressed by different colors, different geometric shapes and different line types. This information and characteristics include classes, operations, relationships between different classes, call relationships between different methods, class names and operation names, and so on. This provides graph-based semantics to the UML model and makes it possible to use deep learning technology to recognize design patterns. In this paper, such an extended UML model with graph information is called colored UML. Here, only the extension of traditional UML class diagram and sequence diagram is discussed, and the extension of other UML diagrams will be explored in future studies.

3.1. Extension of Traditional UML Class Diagram

A class diagram is composed of classes and the relationships between classes, which are used to describe classes and the static relationship between classes. The structural features and information of the system are one of the important bases for identifying design patterns, mainly referring to entities (classes/interfaces/objects) and the relationships between entities.

3.1.1. Representation of Classes in Colored UML

A class encapsulates name, attributes, and operations. Attributes are temporarily not considered in this paper. In the colored UML, the graph symbol of class is a rectangle filled with yellow color (RGB: (255, 255, 0)), the border of the rectangle is 5 pixels thick, colored red (RGB: (255, 0, 0)) and drawn as solid lines. The rectangle is divided by a 3 pixel thick, blue (RGB: (0, 0, 255)) horizontal and solid line into the upper and lower parts. Within the upper area is a smaller rectangle with a 1 pixel thick, black (RGB: (0, 0, 0)) border, which is used to store a class name. The smaller rectangle has a dashed border if the class is abstract and a solid border if otherwise. Within the lower area are several smaller rectangles with 1 pixel thick, black (RGB: (0, 0, 0)) borders, with each smaller rectangle storing an operation. A smaller rectangle has a dashed border if the operation is abstract and a solid border if otherwise. For the representation of class name, access control modifiers of operations and operation names, see Section 3.3.

3.1.2. Representation of Classes in Colored UML

In UML, the relationships between classes include generalization (also known as inheritancy), association, aggregation, composition, and dependency; additionally, a solid circle is also defined to denote “more than one”. Both aggregation and composition are special cases of association, which specify a whole-part relationship between classes, which will not be separately defined by a graph in colored UML.
In the colored UML representation, class inheritance is denoted as a triangle and a connecting line from a subclass to a superclass filled with green (RGB: (0, 255, 0)). Specifically, the connecting line is 3 pixels thick and solid. Composition is represented by an arrow with a purple (RGB: (160, 32, 240)) solid rhombus at the root, from the combining class to the combined class, and the thickness and line type of the connecting line are the same as the inheritance relationship. Aggregation is represented by an arrow with a purple (RGB: (160, 32, 240)) hollow rhombus at the root, from the aggregating class to the aggregated class, and the thickness and line type of the connecting line are the same as the inheritance relationship. “More than one” is represented by a solid dot with a diameter of 5 pixels. When the dot is at the head of the arrow, it means to combine or aggregate multiple objects. Dependency is represented by a pink-filled (RGB: (255, 192, 203)) dashed arrow with a sharp angle from the depending class to the depended class, and the thickness of the connecting line is the same as the inheritance relationship.

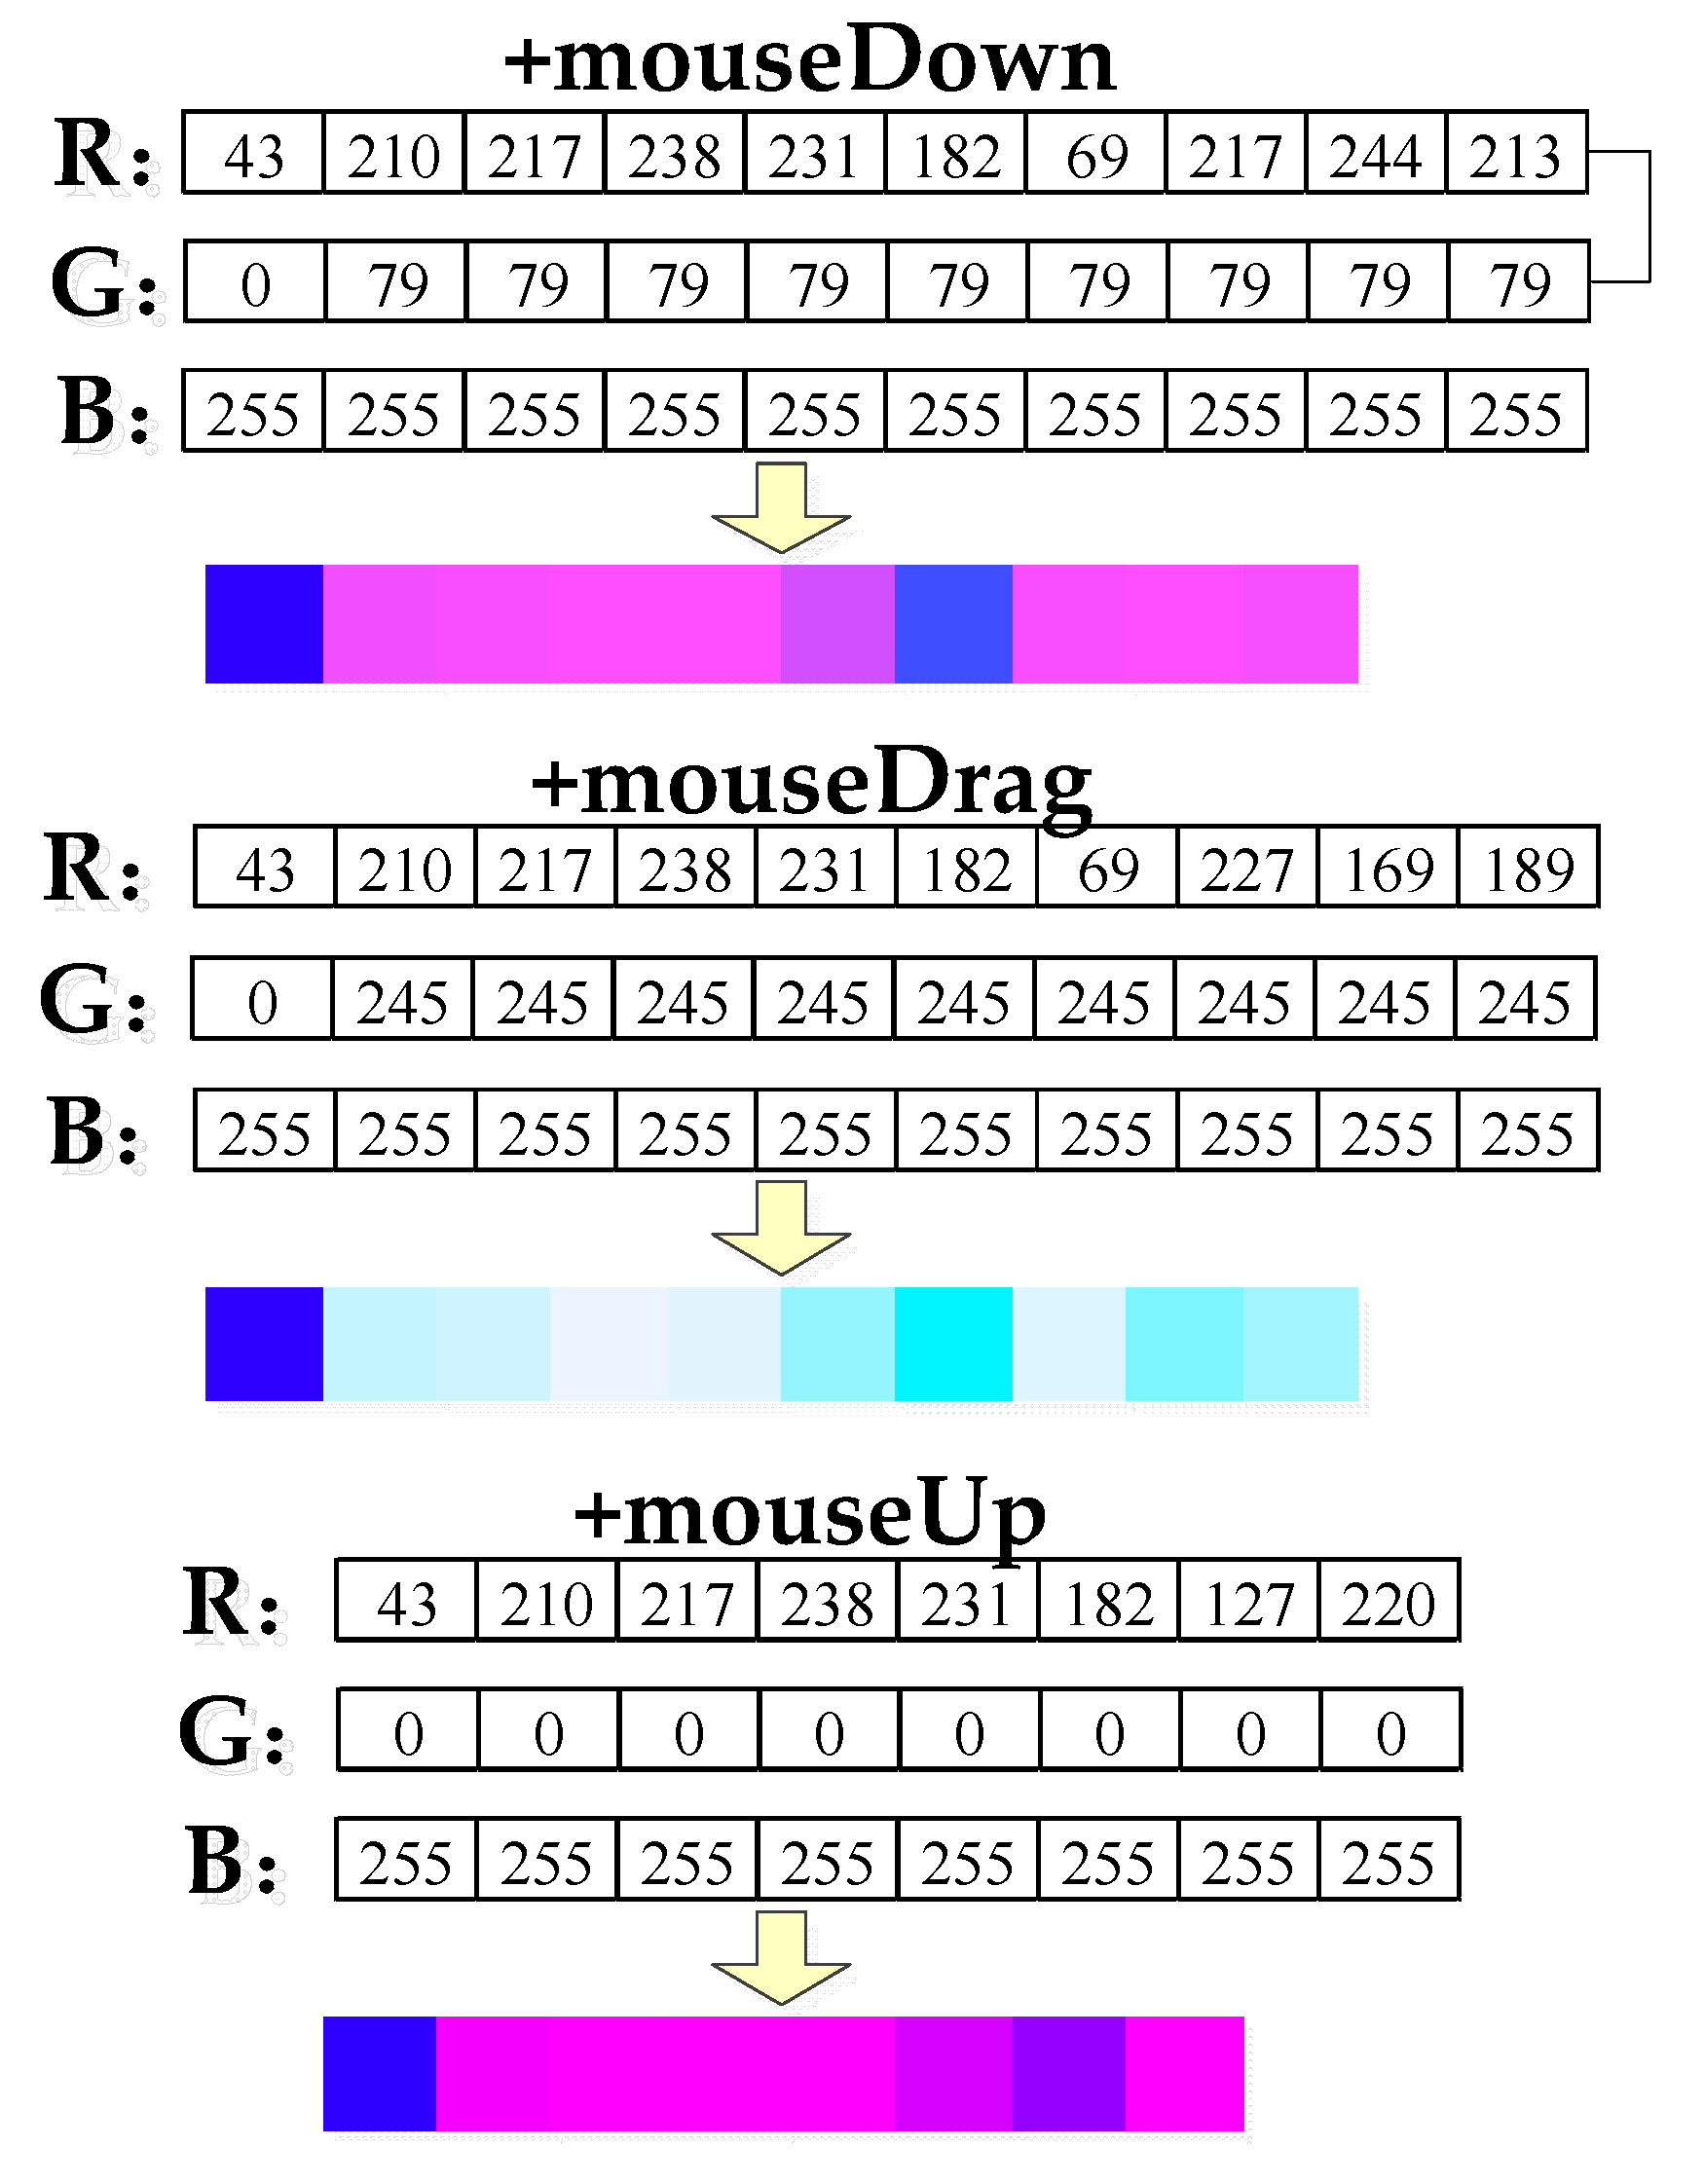
3.2. Expansion of Traditional UML Sequence Diagram

The static structure of the system is described by a class diagram. Besides, it is necessary to describe the dynamic interaction between objects. A sequence diagram is one of the most common dynamic interaction diagrams. It is used to show the inter-object interaction, with a focus on the time sequence of message transmission between objects. Behavioral patterns are distinguished from each other mainly by the interaction between classes and objects and the assignment of their responsibilities, so the detection of behavioral patterns may require a consideration of behavioral characteristics, which refer to the execution behaviors of a program, including both static and dynamic behavior characteristics. Behavioral characteristics can be reflected by the invocation relationships between operations in a sequence diagram, so such relationships is due to be focused on here.
In the colored UML, the invocation relationships between operations are integrated into the color-block representation of operation names, as detailed in Section 3.3.2.

3.3. Expansion of Traditional UML Names

Program code resembles natural language to a certain degree since the identifiers in code, like words in natural language, have rich semantic information [48]. Such information is useful for distinguishing patterns that have similar structural and behavioral properties, such as the State pattern, the Strategy pattern, and the Bridge pattern.

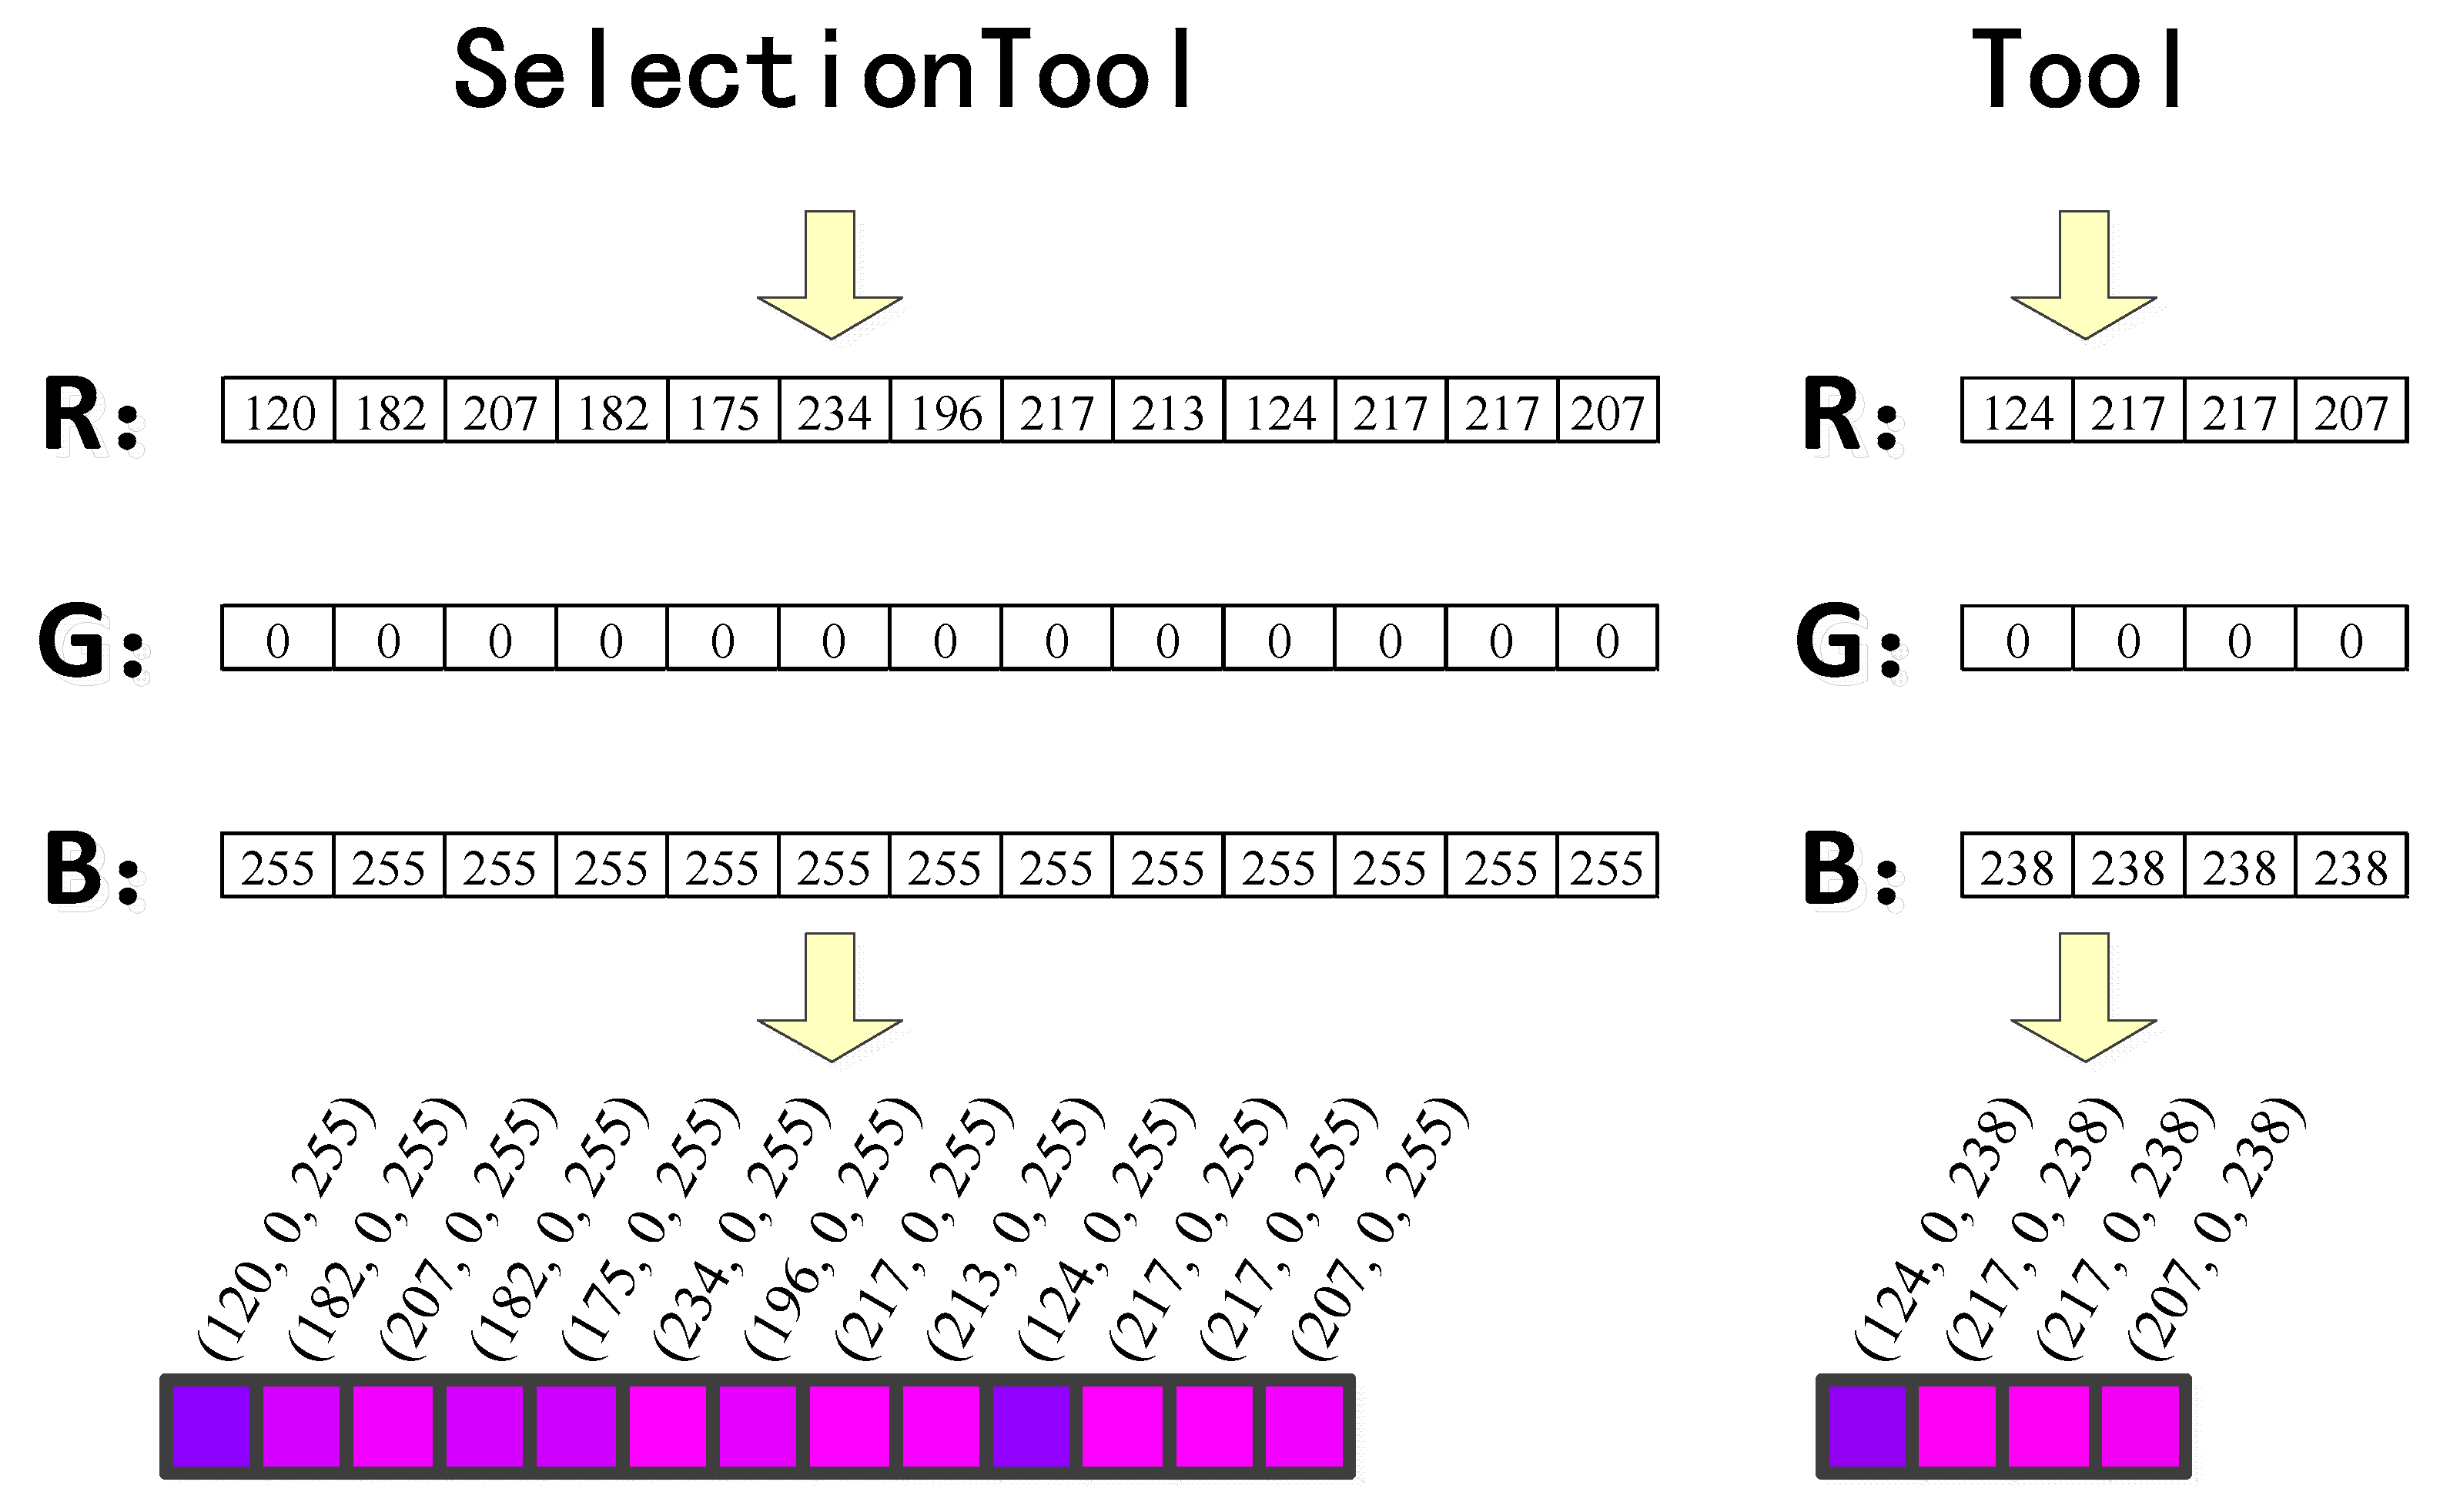
3.3.1. Representation of Class Names in Colored UML

In the colored UML, each character of the class name is represented by a color block with a height and width of 5 pixels. Let there be two classes, i.e., X and Y. The class name of X is x 1 x 2 x 3 x n , where x i   ( i = 1 , 2 , n ) represents the i-th character of the class name and n is the number of characters in the class name. Similarly, the class name of Y is set as y 1 y 2 y 3 y m . Let the function ASCII(x) denote the ASCII code value of character x. The names in the programming language are composed of uppercase letters, lowercase letters, numbers, and underscores, and the ASCII code takes values in the range of 48 to 122. The following formula is used to map the ASCII value of character x to [0, 256], noted as:
ASCII ( x ) = 0 + 255 0 122 48 × ( ASCII ( x ) 48 ) = 3.45 × ( ASCII ( x ) 48 )
Suppose there is no creation relationship between class X and class Y (and no such relationship with other classes), i.e., no object of class Y is created in class X and no object of class X is created in class Y. Then, the values of the pixel points in the RGB’s first channel (red) of the color blocks for the class names in class X, from left to right are, respectively, as follows:
ASCII ( x 1 ) , ASCII ( x 2 ) , , ASCII ( x n )
The values of the pixel points in the second channel (green) from left to right are as follows:
0 , 0 , , 0
The values of the pixel points in the third channel (blue) from left to right are as follows:
255 , 255 , , 255
The representation of class names of class Y adopts a similar way.
With x = i = 1 n ASCII ( x i ) and y = i = 1 m ASCII ( y i ) , the pixel values in the second channel (green) are used to indicate which class objects are created by the class, and those in the third channel (blue) are to show which classes create objects for the class. If objects of class Y are created in class X, the values of the pixel points in the second channel (green) of class X, from left to right, are the ones in the original second channel (green) (initially 0 , 0 , , 0 ), plus y, respectively, and then modulo with 255 as follows:
( 0 + y )   MOD   255 , ( 0 + y )   MOD   255 , , ( 0 + y )   MOD   255
where MOD indicates the remainder operation.
The values of the pixel points in the third channel (blue) of class Y are the ones in the original third channel (blue) from left to right, respectively, minus x to take the absolute value and then modulo with 255 as follows:
| 255 x |   MOD   255 , | 255 x |   MOD   255 , , | 255 x |   MOD   255
If there are other creation relationships, the above formula shall be applied for addition and subtraction according to the order of creation.
The class names of SelectionTool and Tool, which are classes in the second-level subsystem (see Section 6.3) s 14 in Figure 3, are shown in the colored UML representation in Figure 4.

3.3.2. Representation of Operation Names in Colored UML

In the colored UML, each character of the operation name is represented by a color block with a height and width of 5 pixels, and there is an additional color block at the top for the access control character. Let there be an operation in class X with the name c 1 a 1 a 2 a 3 a p , where c 1 denotes the operation as visible (i.e., public (denoted by the character ‘+’), protected (denoted by the character ‘#’) and private (denoted by the character ‘−’)). Furthermore, a i   ( i = 1 , 2 , p ) represents the i-th character of the operation name, and p is the number of characters in the operation name. Similarly, let the name of an operation in class Y be c 2 b 1 b 2 b 3 b q .
Suppose that there is no invocation relationship between the operation c 1 a 1 a 2 a 3 a p of class X and the operation c 2 b 1 b 2 b 3 b q of class Y (and no such relationship with other operations), i.e., the operation c 1 a 1 a 2 a 3 a p of class X does not invocate the operation c 2 b 1 b 2 b 3 b q of class Y, and the operation c 2 b 1 b 2 b 3 b q of class Y does not invocate the operation c 1 a 1 a 2 a 3 a p of class X. Then, the values of the pixel points in the RGB’s first channel (red) of the color blocks for the operation name of the operation c 1 a 1 a 2 a 3 a p in class X, from left to right are, respectively, as follows:
ASCII ( c 1 ) , ASCII ( a 1 ) , ASCII ( a 2 ) , , ASCII ( a p )
The values of the pixel points in the second channel (green) from left to right are as follows:
0 , 0 , , 0
The values of the pixel points in the third channel (blue) from left to right are as follows:
255 , 255 , , 255
The representation of the operation name of the operation c 2 b 1 b 2 b 3 b q in class Y adopts a similar way.
With x = i = 1 n ASCII ( x i ) and y = i = 1 m ASCII ( y i ) , the pixel values in the second channel (green) are used to indicate which operations are invocated by the operation, and those in the third channel (blue) are to show which operations have invocated the operation. If the operation c 1 a 1 a 2 a 3 a p of class X invocates the operation c 2 b 1 b 2 b 3 b q of class Y, then the value of the first pixel in the second channel (green) for the operation c 1 a 1 a 2 a 3 a p of class X is as follows:
( 0 + y )   MOD   255
The values of the pixel points from the second to the last are the ones in the original second channel (green) (initially 0 , 0 , , 0 ) from left to right, plus b, respectively, and then modulo with 255 as follows:
( 0 + b )   MOD   255 , ( 0 + b )   MOD   255 , , ( 0 + b )   MOD   255
where MOD indicates the remainder operation.
The value of the first pixel in the third channel (blue) for the operation c 2 b 1 b 2 b 3 b q of class Y is as follows:
| 255 x |   MOD   255
The values of the pixel points from the second to the last, from left to right, are the ones in the original third channel (blue), minus a, respectively, to take the absolute value and then modulo with 255 as follows:
| 255 a |   MOD   255 , | 255 a |   MOD   255 , , | 255 a |   MOD   255
where | | indicates the operation of taking the absolute value.
If there are other invocation relationships, the above formula shall be applied for addition and subtraction according to the order of invocation.
The operation names of the three operations of the class SelectionTool, which is a class in the second-level subsystem (see Section 6.3) s 14 in Figure 3, are shown in the colored UML representation in Figure 5.
Based on the above discussion, it can be seen that the colored UML model of the second-level subsystem s 14 in Figure 3 is as shown in Figure 6.

4. Construction of the Sample Set

After extending graph information for the traditional UML, it is needed to construct a high-quality (balanced positive and negative samples, low ratios of null and missing values, and low percentage of noise samples) and large-scale sample set in the form of colored UML, which lays a foundation for the training of the classification models.

4.1. Acquisition of Positive and Negative Samples

To construct a positive sample set, a large multitude of design pattern instances need to be acquired. Some open design pattern instance libraries, such as the P-Mart [49], DPB [50], and Percerons [51], have been provided by scholars. Nazar et al. [52] also openly published their design pattern library DPDF-Corpus on GitHub. In this paper, pattern instances extracted from these publicly available design pattern instance libraries are used to construct the positive sample set.
For design pattern detection problems, it is easier to obtain positive samples (design pattern instances can be extracted from readily available instance libraries as positive samples), while it is more difficult to obtain negative samples. This is because if all to-be-identified units that do not fall in a certain pattern in a project are regarded as negative samples of this pattern, too many negative samples will be generated and these negative samples are not representative enough either. In this paper, six non-machine learning existing design pattern detection methods, including the method previously developed by the authors of this paper, are employed to acquire negative pattern instances. We used these methods to recognize design patterns from many open source projects and treated recognized false-positive instances as negative ones. In addition, a number of to-be-identified units that do not belong to a certain pattern are randomly selected as negative samples of this pattern. Negative samples composed of such two parts are not numerous but are highly representative. For selection of these open source projects, see literature [22,23].
We try to select detection methods based on different types of techniques. Based on this principle, the following six design pattern detection methods are selected:
(1)
Design pattern detection methods based on logical reasoning: we selected the method proposed by Hayashi et al. [6].
(2)
Design pattern detection methods based on XML matching: we selected the method proposed by Balanyi et al. [10].
(3)
Design pattern detection methods based on ontology technology: we selected the method proposed by Di Martino et al. [12].
(4)
Design pattern detection methods based on formal technologies: we selected the method proposed by Bernardi et al. [17].
(5)
Design pattern detection methods based on rules: we selected the method proposed by Aladib et al. [18].
(6)
Design pattern detection methods based on graph theory: we selected the method previously developed by the authors [24].
After obtaining the positive and negative samples, we represent the positive and negative samples in the form of images of the colored UML model and store them.

4.2. Data Augmentation

From the discussion in Section 4.1, it can be seen that constructing sample sets aiming to solve the design pattern detection problem can take much time and manpower, and thus these sample sets are usually not sizable. In addition, differing from conventional graph classification problems such as facial classification, cat and dog classification and medical image classification, the problem addressed in this research is mainly solved by using colors, line types, and geometric shapes to represent information of design patterns as well as of the system to be recognized. Thus, overfitting can easily occur in this research, that is, a very good recognition performance on the training set may fare poorly on the test set or new data. Then, it is imperative to perform data augmentation before model training.
In this paper, the sample set is first expanded by conventional data augmentation techniques such as horizontal flip, vertical flip, and translation. In addition, the position of the class in the image of an instance of a design pattern does not affect whether the instance belongs to this pattern. Therefore, we also use the method of moving each class by pixel for data enhancement. The algorithm is as follows:
Step 1: Let C sample = { C 1 , C 2 , , C n } as the set composed of all classes of the positive and negative pattern instance i in the sample library, where n is the number of classes in instance i.
Step 2: First, take the first Class C 1 from the set C sample , with the locations of other classes remaining unchanged; new samples will be generated by moving the location of C 1 from left to right and from top to bottom within the graph area one unit distance a time (which is set as 5 pixels here).
Step 3: Repeat the above process, and sequentially take the Classes C 2 , C 3 , , C n from the set C sample and move locations to construct new samples.
Step 4: At each time, take 2 classes from the set C sample to form different combinations of classes, and keep the relative locations of these 2 classes unchanged and the locations of other classes unchanged, then move in accordance with the above-mentioned method to construct new samples.
Step 5: Repeat the above process, take 2, 3, …, n 1 classes from the set C sample respectively to form different combinations of classes, and move locations to construct new samples.

4.3. Dataset Splitting

At present, we have separately constructed positive and negative sample sets for 12 patterns, including Adapter, Command, Composite, Decorator, Factory Method, Observer, Prototype, Singleton, State, Strategy, Template Method, and Visitor, with each pattern having about 80,000 positive samples and 80,000 negative samples constructed after data augmentation. Eighty percent of these samples constitute the training set and twenty percent the test set.

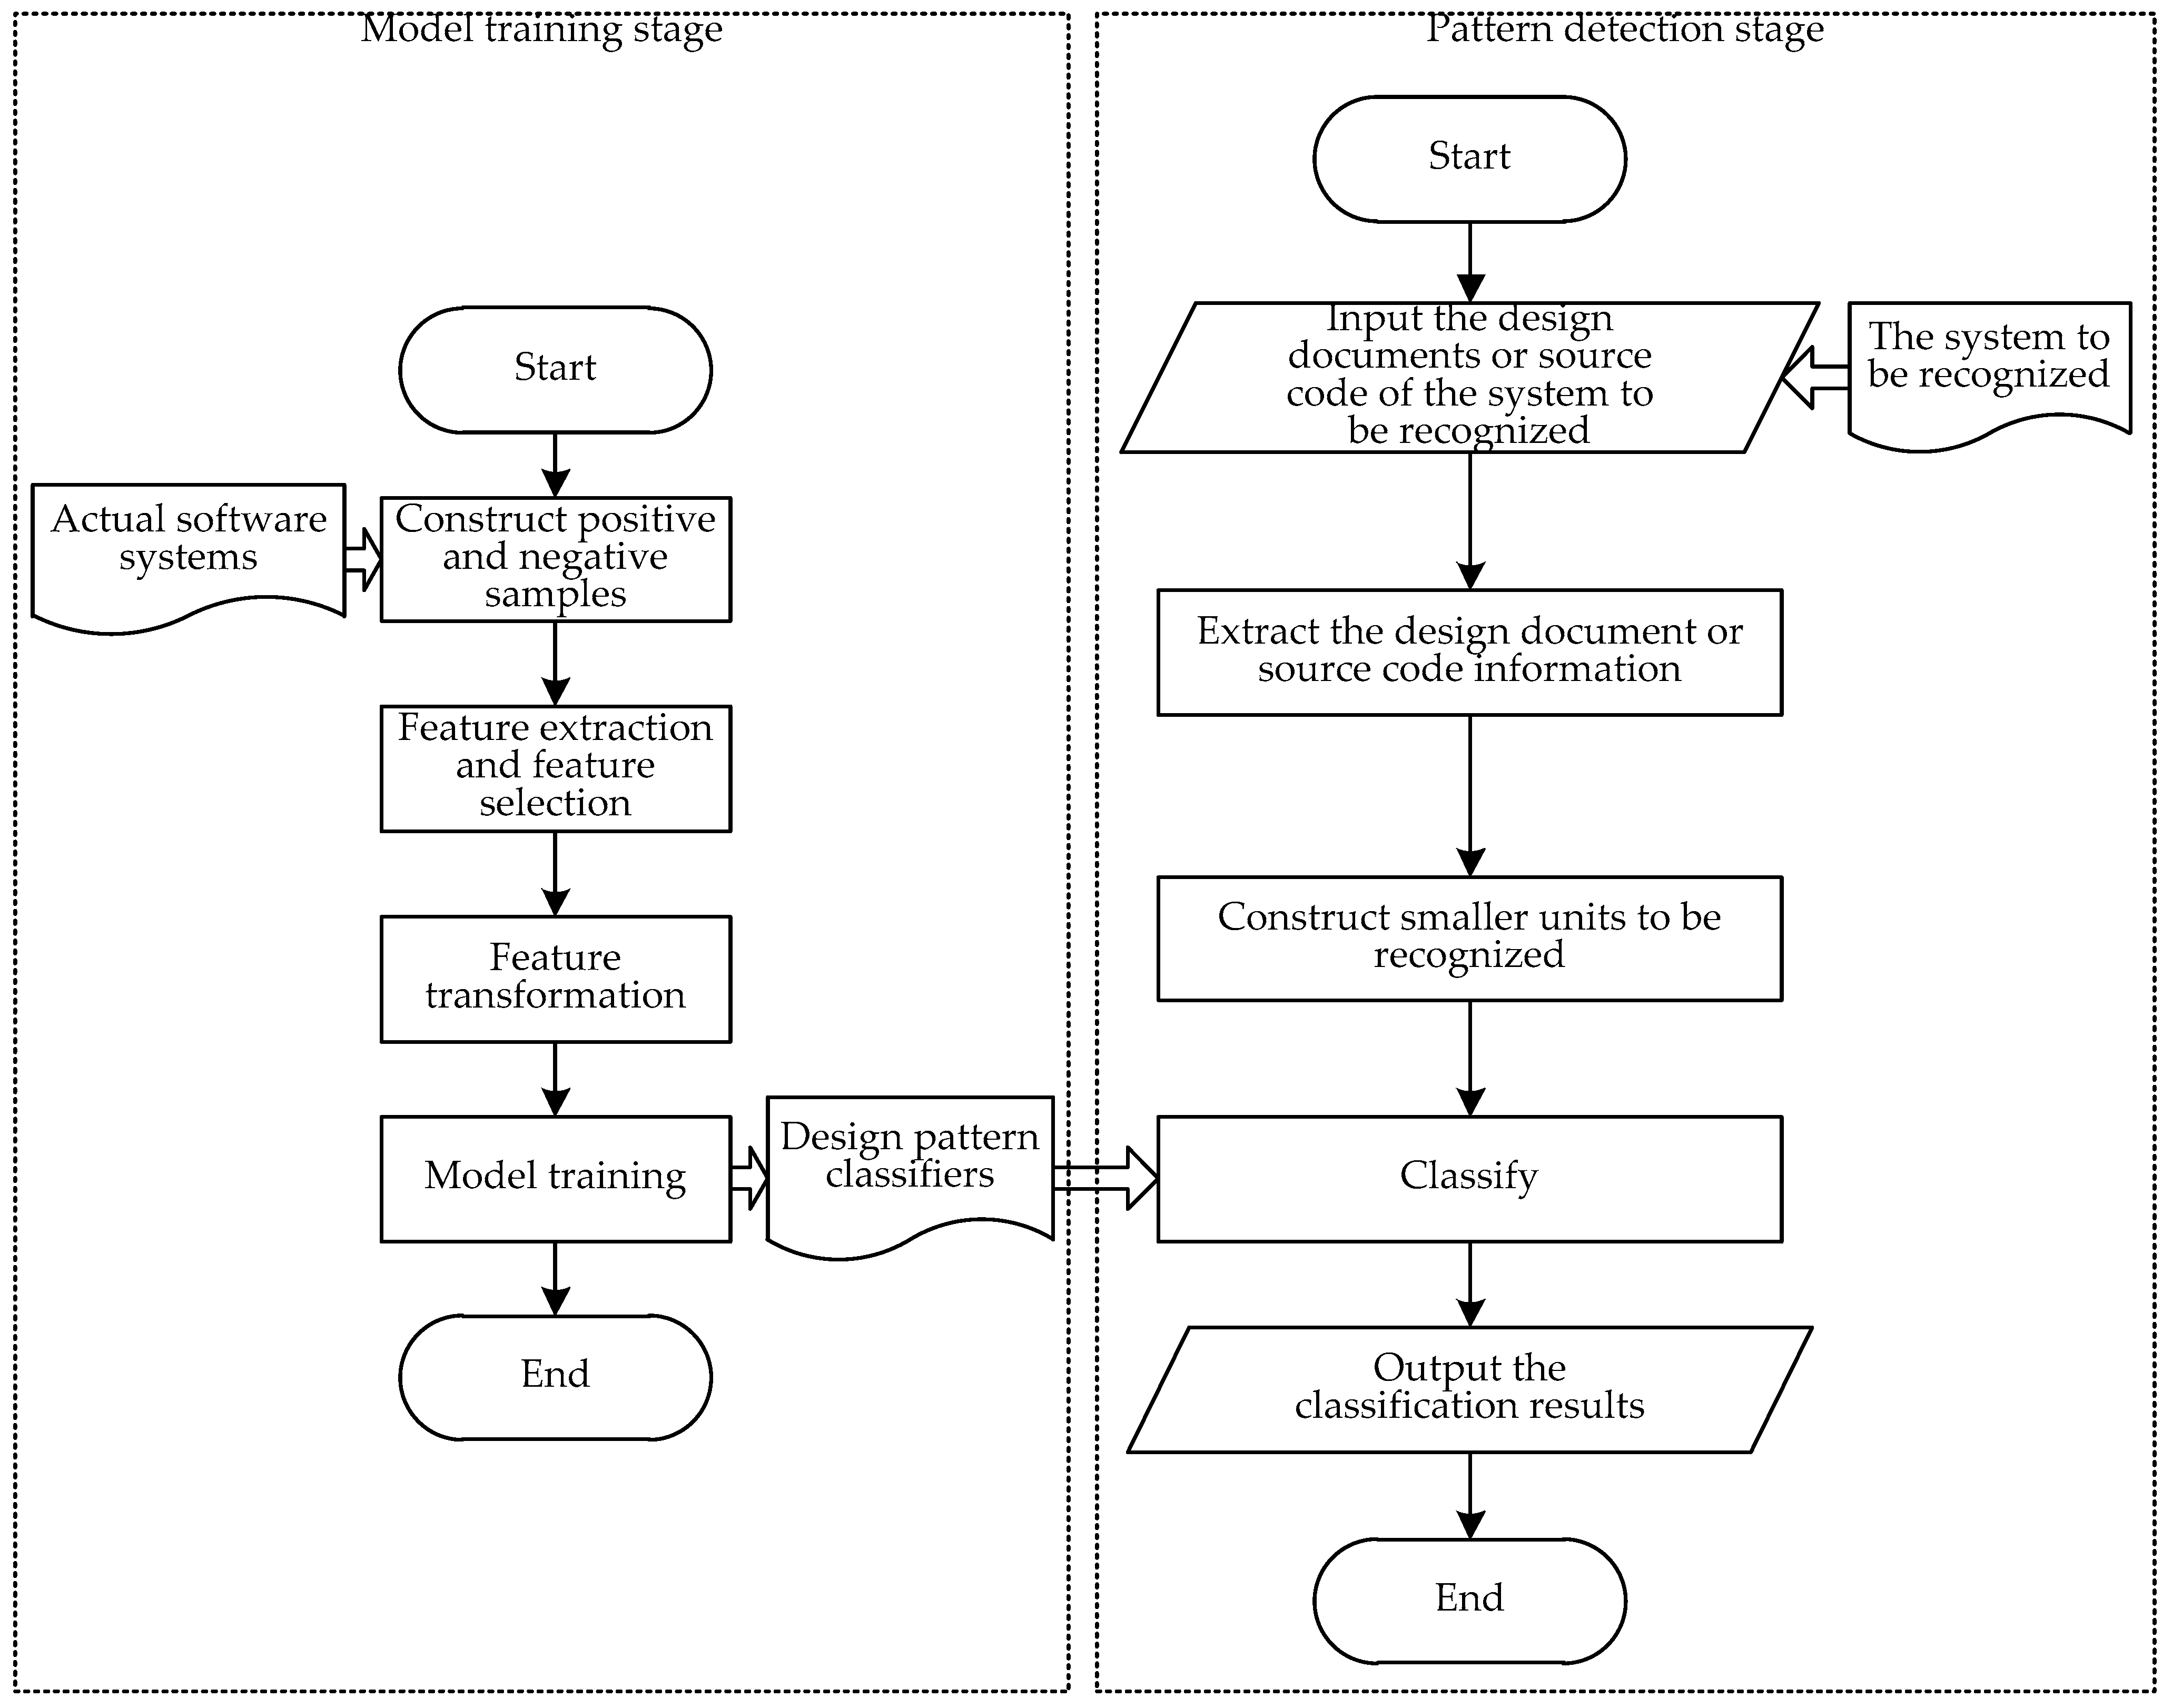
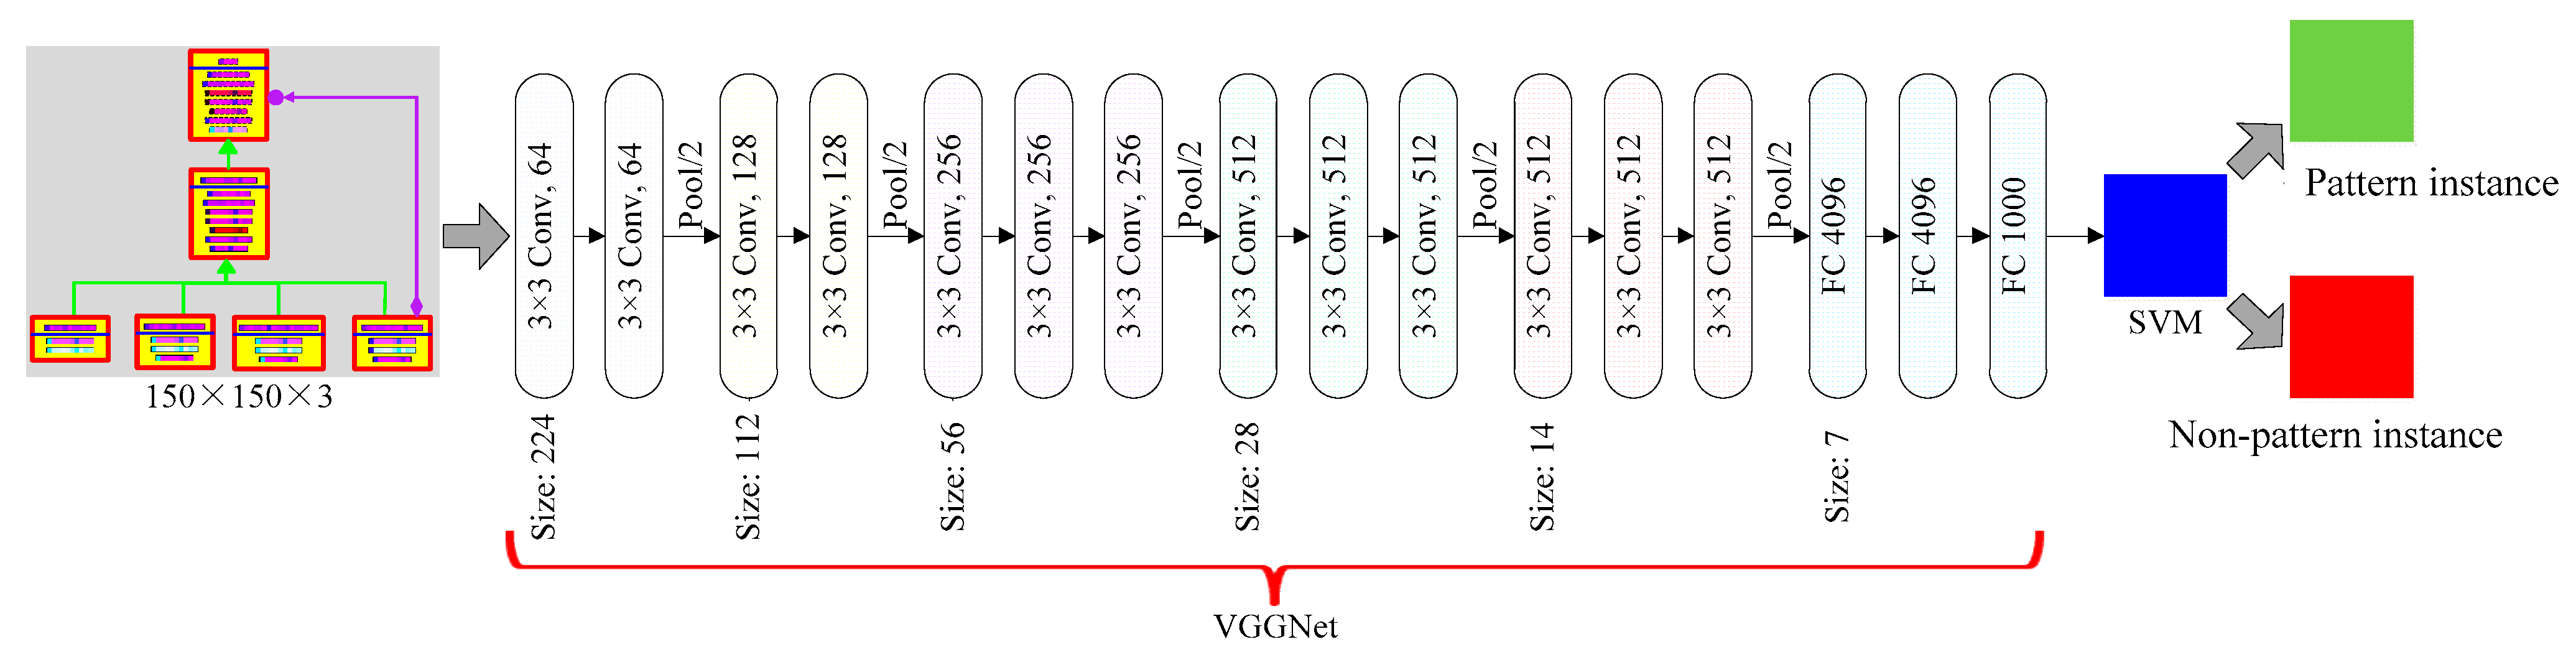
5. Deep Learning Model Combining VGGNet and SVM for Design Pattern Identification

According to the characteristics of the design pattern recognition problem, combined with the powerful automatic feature extraction ability of deep learning and the advantages of SVM in the binary classification problem, this paper designs and trains end-to-end design pattern classification models from system design (here mainly refers to the system UML model) or source code to design pattern, which has better detection effect.

5.1. Model Design

VGGNet, as one of the most popular CNN models currently, was proposed by Simonyan and Zisserman in 2014 [53]. VGGNet performs better by constructing a deep convolutional neural network through a series of small-sized convolutional kernels of size 3 × 3 and pooling layers, enabling a larger perceptive field to extract more complex features and combinations of these features [54,55]. In this paper, a 16-layer VGGNet is combined with an SVM to train model, and the designed model structure is shown in Figure 7.
The model structure is specified as follows:
(1) The first 16 layers in the model are the VGGNet network, where layers 1~13 involve 5 groups of convolutional operations, and between every two groups, Max-Pooling is used to reduce spatial dimensionality. Multiple successive 3 × 3 convolutions are adopted within the same group. The number of convolution kernels increase from 64 in the shallower group to 512 in the deepest group, and the number of convolution kernels is the same within the same group.
(2) Layers 14~16 are fully connected, and the output of the 16th layer get a feature quantity sized at 1000.
(3) The 17th layer is the support vector machine, which trains the features extracted by the VGG convolutional neural network for binary classification, and outputs the judgment result, that is, a pattern instance or a non-pattern instance.

5.2. Model Configuration
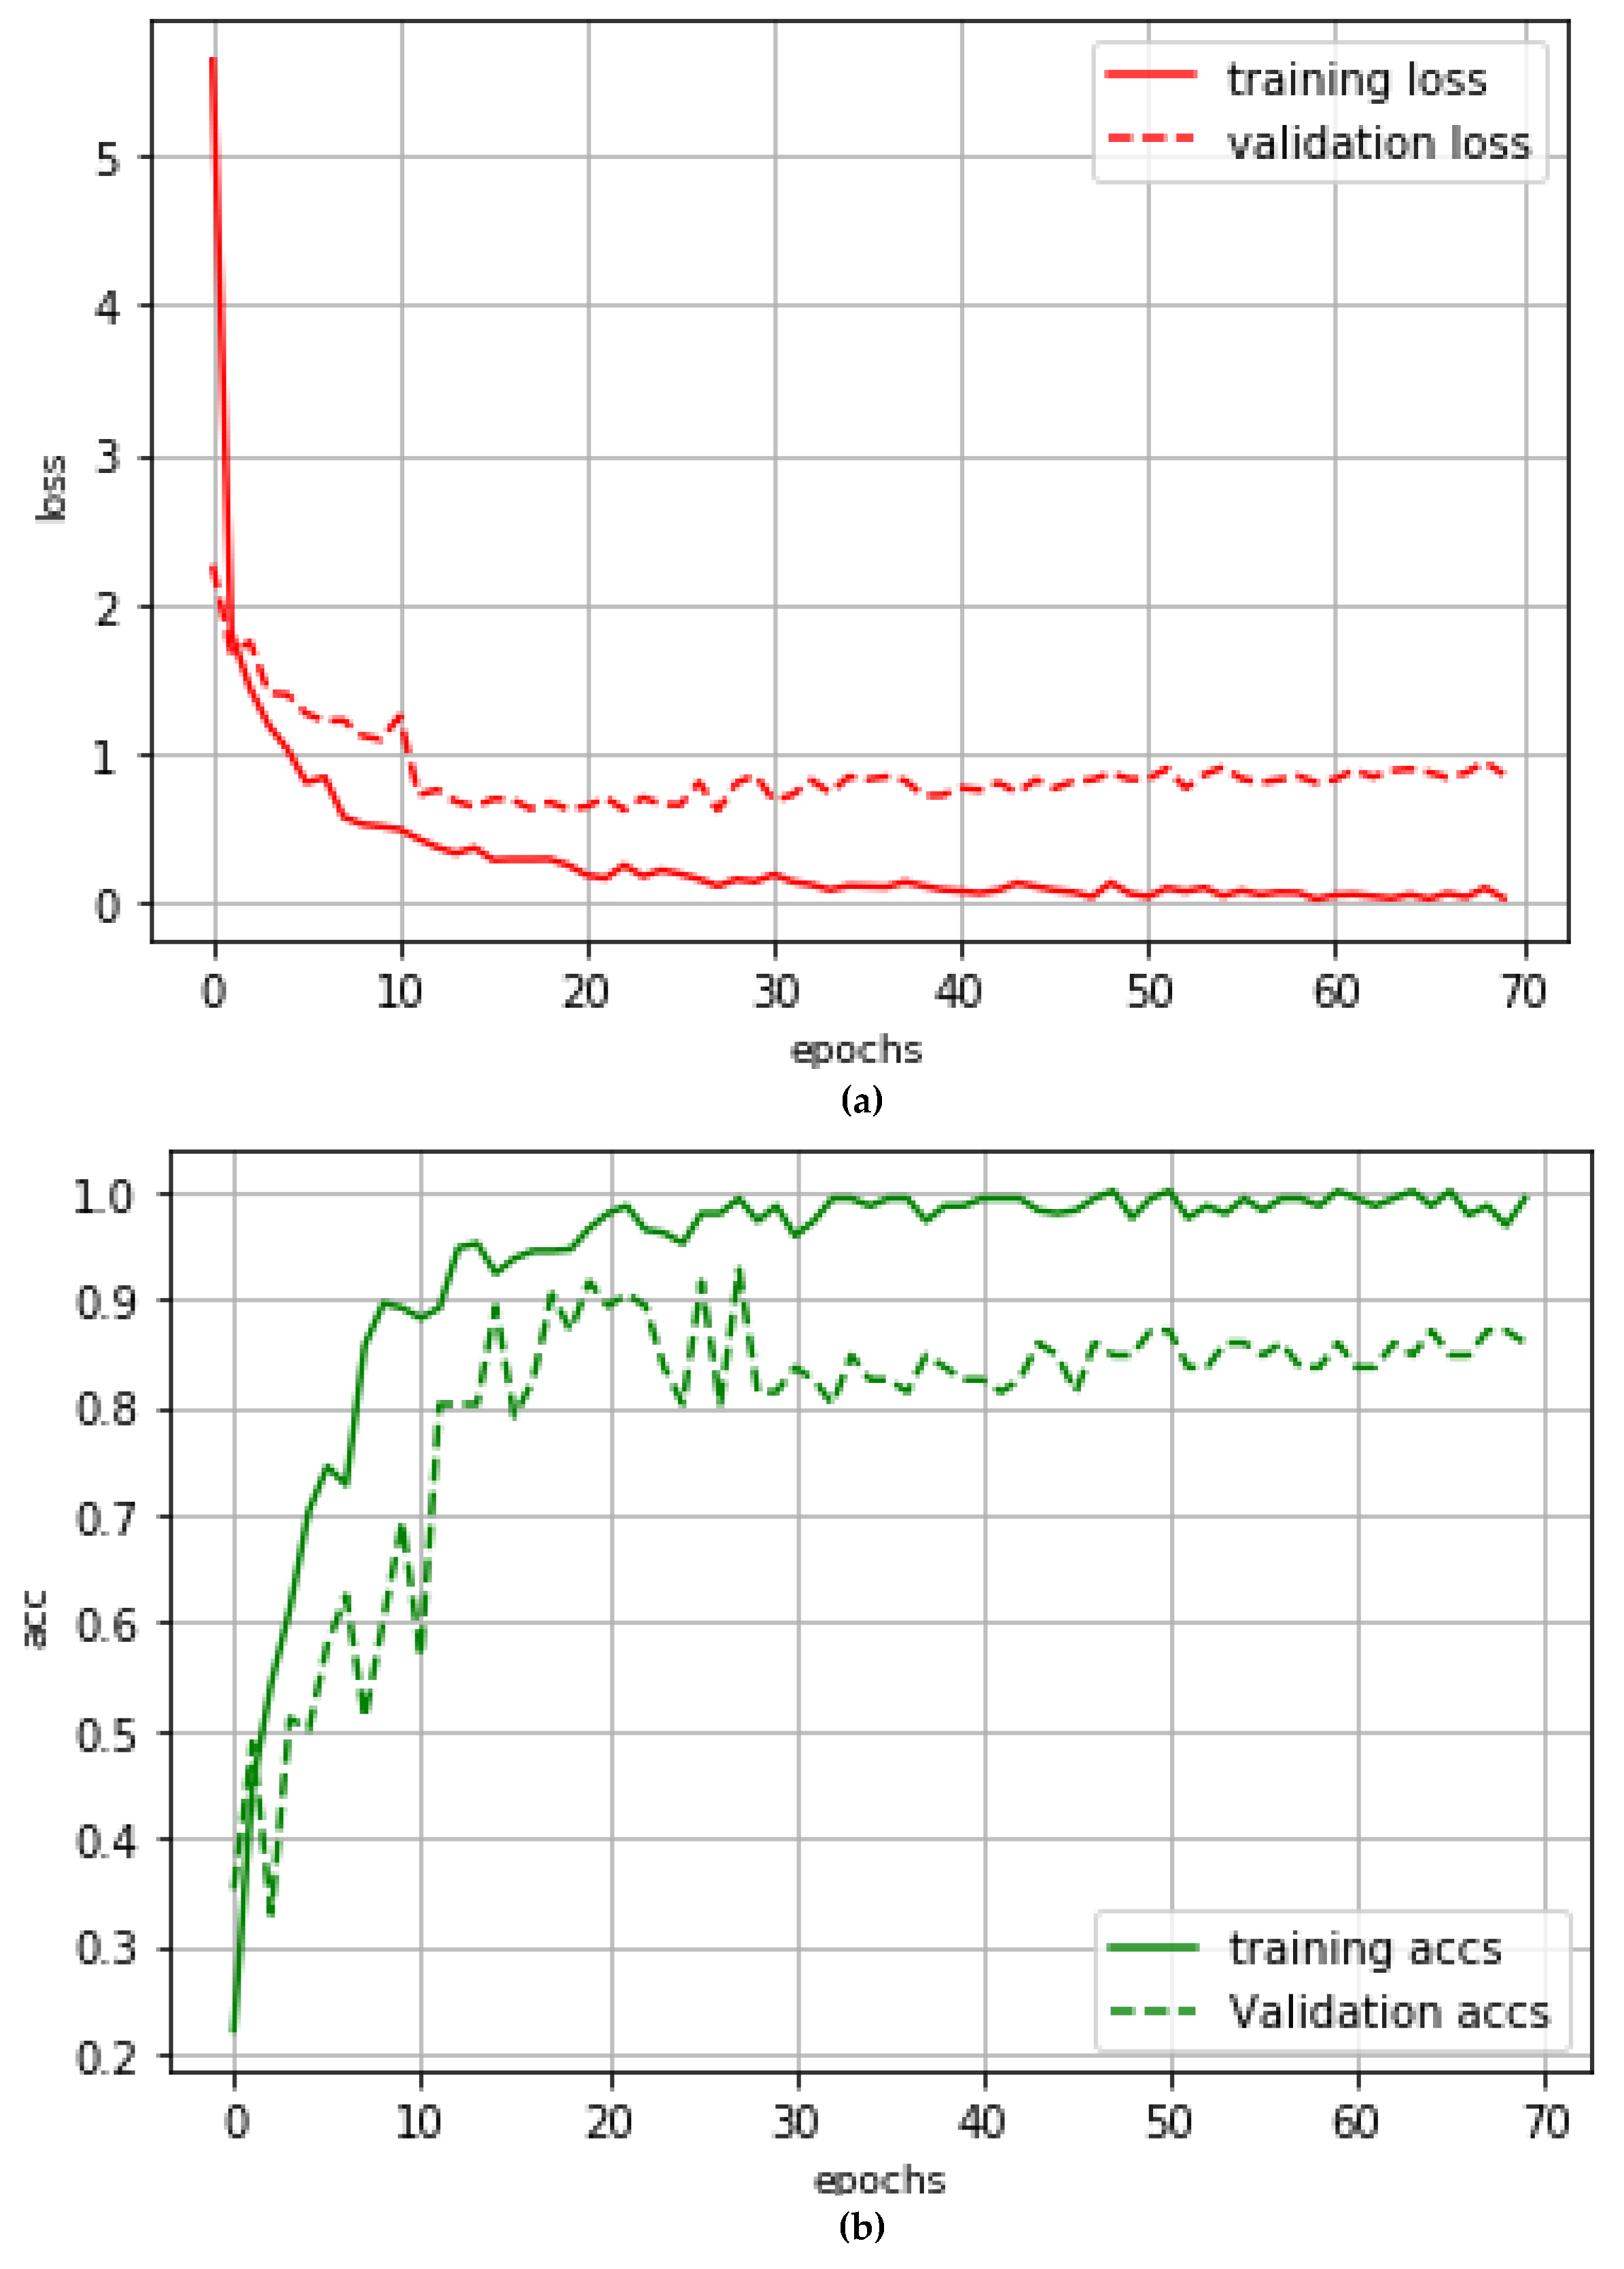
In VGG, the back propagation (BP) network and Adam optimizer are used to optimize the parameters of neural network bias and weights, etc., with a degenerate learning rate being added, and the initial value of the learning rate is set to 0.0005. The loss function is set as cross-entropy loss. The activation function relu and L2 regularization are added to the convolutional layer to enhance the model’s nonlinear expression ability and prevent the model from overfitting. Batch Normalization (BN) is added to alleviate the network gradient dispersion and accelerate the convergence of the model. The VGG for each pattern is trained for 70 cycles. Figure 7 shows the loss rate and accuracy rate of the training and validation sets for the State pattern.
The loss curve in Figure 8a shows that the loss rate reached the maximum convergence after 27 cycles of training. Meanwhile, the loss rate of the training set was 0.1180 and that of the validation set was 1.0236. When the training was continued, the loss rate of the validation set increased slightly and overfitting occurred in the training. Figure 8b shows that, after 27 cycles of training, the accuracy rate of the training set was basically unchanged, while the accuracy of the validation set decreased with fluctuation. At the 27th cycle, the accuracy rate of the training set was 99.31% and that of the validation set was 92.73%.
After the training of extracted features in the convolutional neural network, the trained one-dimensional features are further trained for binary classification by SVM with a regularization model learned by stochastic gradient descent (SGD). While using hinge_loss as the loss function and adding the L2 penalty parameter, the training enters the phase of batch learning with batch_size = 100, 200, 300, 400, and 500. With the highest accuracy rate of 92.79% for the validation set at batch_size = 400, the final SVM results for the State pattern classifier are shown in Table 1.

5.3. Model Training

Baidu’s PaddlePaddle deep learning framework and Scikit-learn machine learning library are adopted to build the model structure designed above, with the input of constructed positive and negative sample sets to train the classifiers. This paper has trained VGGNet + SVM classifiers for 12 patterns: Adapter, Command, Composite, Decorator, Factory method, Observer, Prototype, Singleton, State, Strategy, Template Method, and Visitor.

6. Extraction of System Information and Division of Subsystems and Second-Level Subsystems

After the model training is completed, the system to be recognized can be input into the models to find pattern instances. The next work to do is to extract the information from the system. In addition, the subsystem and the second-level subsystem division method are introduced to divide a complete large-scale system into second-level subsystems that can be independently judged so that the system to be recognized can be expressed in the form of single images like a traditional image classification problem, and then the trained classification models can be used to judge whether the second-level subsystems belongs to a certain pattern.

6.1. Extraction of System Information

To detect the design patterns included in the system, the information of the system needs to be extracted first. In this study, the XML files of the UML class diagrams and the XML files of the UML sequence diagrams of the system are parsed to obtain information, and the information was stored. The information of the UML class diagrams includes classes, operations, abstract classes, abstract operations, generalization, composition, aggregation, and dependency between classes, creation relationship between classes, naming, and so on, while the information of the UML sequence diagrams mainly includes the calling relationship between the operations of the classes.
For systems that lack UML design documents and only have source codes, this study converts the source codes into a UML model (this article mainly focuses on class diagrams and sequence diagrams) using the reverse engineering function of UML modeling tools such as Visio and programming language development environments such as IntelliJ IDEA, and then parses the converted UML model to obtain relevant information.

6.2. Division of Subsystems

Firstly, the system to be examined is divided into several subsystems in this study. For the division method of subsystems, please refer to the author’s previous studies [22,23,24], which will not be repeated here.
Here is a subsystem of JHotDraw 5.1 (Version number: 5.1; Creator: Erich Gamma; Location: Unknown) for design patterns containing no layer of inheritance or containing only one layer of inheritance, which was marked as s 1 . The UML class diagram of the subsystem s 1 is shown in Figure A1 in Appendix A. This subsystem consists of 38 classes (interfaces) and one layer of inheritance.

6.3. Division of Second-Level Subsystems

There may be multiple classes associated with the same pattern role in a subsystem or a subsystem containing multiple instances of the same pattern. Therefore, after the subsystems are divided, the colored UML images of the subsystems cannot be directly input into the classification model for prediction. In addition, there may be some classes in subsystems belonging to pattern instances that are not associated with any pattern role. When a subsystem is fed directly into a classification model for prediction, most of the time, the subsystem is identified as a non-pattern instance. Therefore, on the basis of the divided subsystems, this paper further divides each subsystem into several second-level subsystems with clearer targets and more precise scope. In this paper, by combining the classes in the subsystem, the subsystem is further divided into several second-level subsystems with the number of classes ranging from the minimum number of classes required by the pattern to be recognized to the number of classes contained in the subsystem minus 1. The algorithm for constructing the second-level subsystems of the pattern p for a subsystem s is as follows:
Step 1: Let C subsystem = { C 1 , C 2 , , C n } as the set composed of all classes of the subsystem s, where n is the number of classes in the subsystem s.
Step 2: Every time, take t classes from the set C subsystem to form a new set, where t is the minimum number of roles in the pattern p, and a total of C n t = n ! t ! · ( n t ) ! different subsets could be formed.
Step 3: Each subset corresponds to a second-level subsystem. The classes in the second-level subsystem are the classes in this subset, and the relationship of classes in the second-level subsystem is the relationship of classes in the original subsystem. Operations in a class only retain operations that have a call/callee relationship with other classes in the second-level subsystem (or indirectly have a call/callee relationship with other classes in the second-level subsystem through other operations in the class), and properties hold only created objects of other classes in the second-level subsystem.
Step 4: The second-level subsystems containing no generalization and second-level subsystems with two classes that have no relationship (and are not related through other classes, such as the second-level composed of the classes ActionTool, BorderTool and PolygonTool in the subsystem s 1 , of which BorderTool and PolygonTool are not related) are removed, and the other second-level subsystems are the final second-level subsystems.
Step 5: The above process is repeated, and t , t + 1 , , n 1 classes are sequentially taken from the set C subsystem to build second-level subsystems.
The Singleton pattern contains only one role, so a second-level subsystem contains only one class.
Here, 4 second-level subsystems for the State pattern of the subsystem s 1 of JHotDraw 5.1 shown in Figure A1 were considered, which were marked as s 11 , s 12 , s 13 and s 14 , respectively. Among them, the second-level subsystem s 11 is composed of the classes Tool, AbstractTool, CreationTool and DragTracker in the subsystem s 1 , s 12 is composed of the classes Tool, AbstractTool, DragTracker, HandleTracker and SelectionTool, s 13 is composed of the classes Tool, AbstractTool, HandleTracker, SelectAreaTracker and SelectionTool, and s 14 is composed of the classes Tool, AbstractTool, DragTracker, HandleTracker, SelectAreaTracker and SelectionTool. The UML class diagrams of the four second-level subsystems are shown in Figure 3.

7. Pattern Instance Acquisition Based on Deep Learning Model

After dividing the system into second-level subsystems, it is necessary to input the colored UML models of each second-level subsystem into the corresponding design pattern classifier to judge whether the second-level subsystem is a pattern instance, and combine the judgment results.

7.1. Image Resizing

We represent the constructed second-level subsystems in the form of images in colored UML and convert the images to the same size as the training set, i.e., 150 × 150 pixels. If the size of an image is smaller than 150 × 150 pixels, the size will be enlarged to 150 × 150 pixels by filling the blank area around. If the size of the image is larger than 150 × 150 pixels, the size will be reduced to 150 × 150 pixels by scaling.

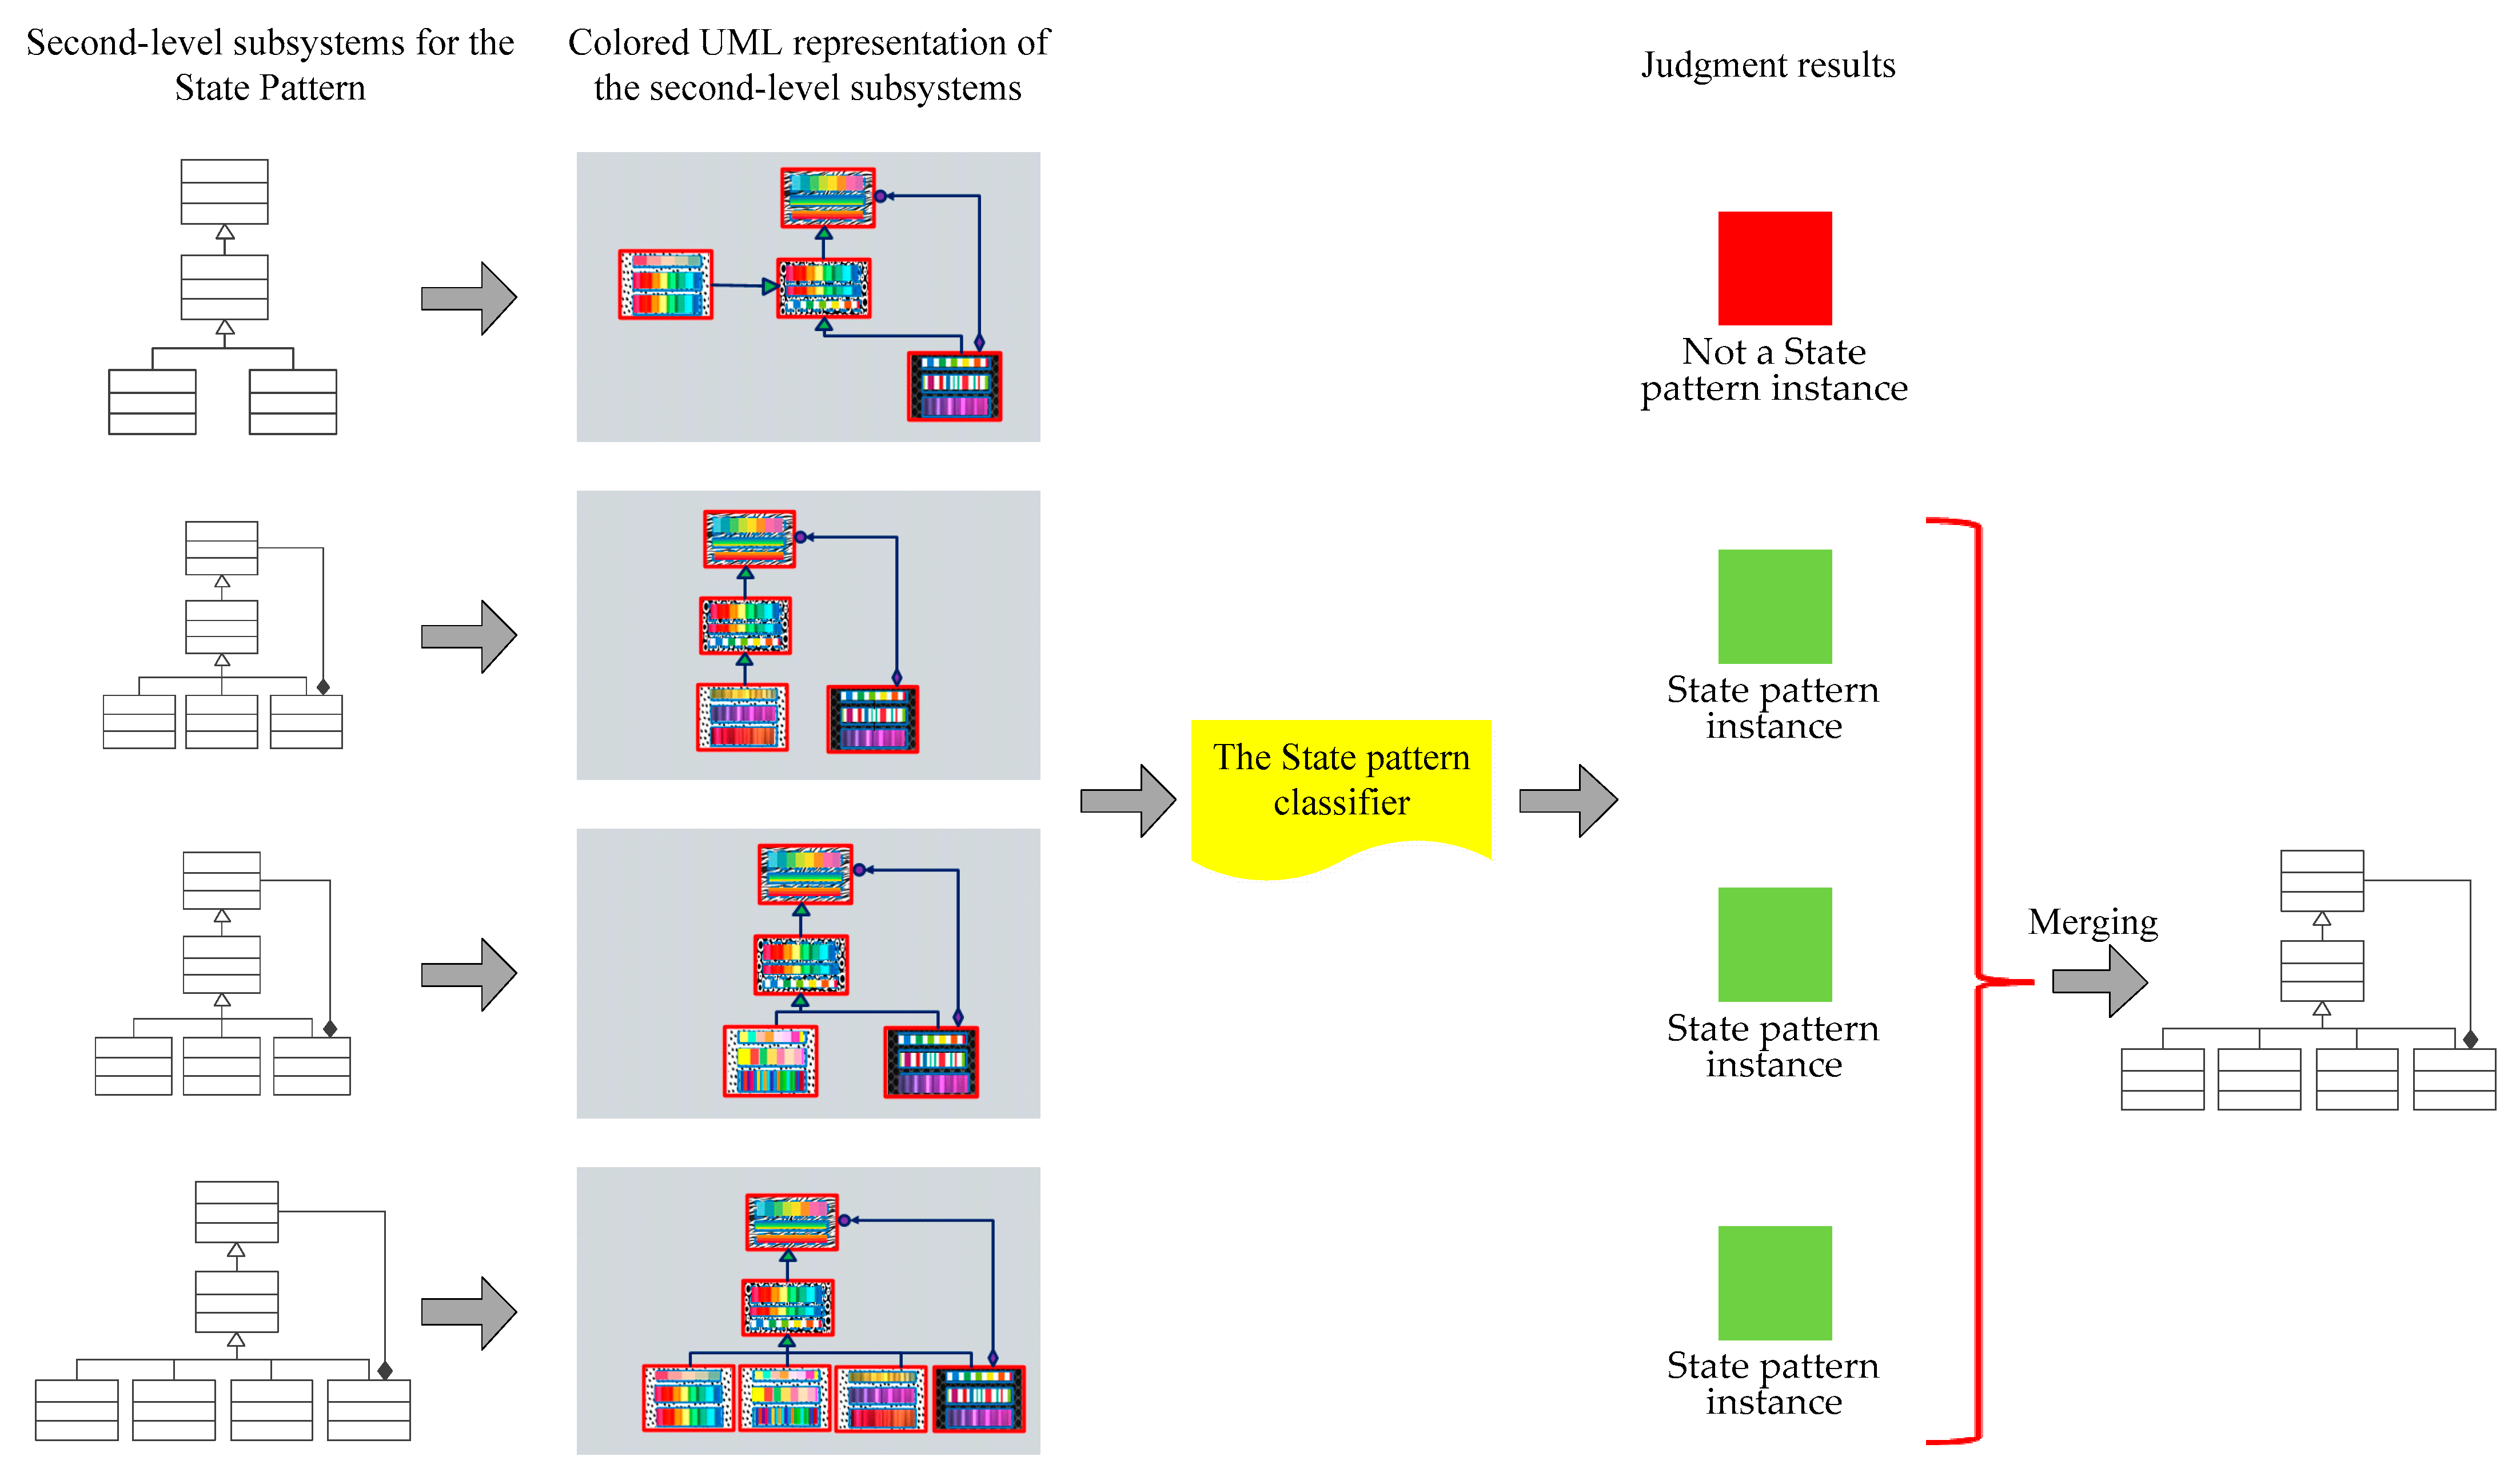
7.2. Judgment of Whether a Second-Level Subsystem Is a Pattern Instance

After adjusting the size of the image of a second-level subsystem to the same size as the training set, it can be input to the VGGNet + SVM classifier of the corresponding pattern trained in Section 5, and the classifier outputs the judgment result, that is, whether it is an instance of this pattern or not. After inputting the four second-level subsystems shown in Figure 8 into the State pattern classifier respectively, it can be obtained that s 11 is not a State pattern instance, and s 12 , s 13 , and s 14 are the State pattern instances.

7.3. Merging of Judgment Results

For a pattern instance in the system, there are often multiple classes associated with the same pattern role. For example, in the State pattern, the role ConcreteState is often associated with multiple classes representing specific states. Therefore, sometimes multiple second-level subsystems judged as pattern instances actually correspond to the same pattern instance and need to be merged. The algorithm for merging the second-level subsystems of the subsystem s for the pattern p is as follows:
Step 1: If only one of all second-level subsystems is judged as the instance of the pattern p, it means that the subsystem s contains only one instance of this design pattern, and each pattern role is associated with one class in the subsystem. Otherwise, go to step 2.
Step 2: If l (l ≥ 2) second-level subsystems judged as instances of the pattern p have no public class, it indicates that the subsystem s contains l instances of this design pattern. Otherwise, go to step 3.
Step 3: Suppose the set of the l (l ≥ 2) second-level subsystems judged as instances of the pattern p is I = { I 1 , I 2 , , I l } . For any two second-level subsystems s p and s q with public classes in the set I, they are processed as follows:
(1) If these two second-level subsystems have (a) common class(es), and there is a subclass of a certain class in the non-public classes, the two instances are merged into one instance. Then the two instances before merging in the set I are deleted, and the new instance obtained by merging is added to I.
(2) If all non-public classes are not subclasses, merging is not required.
The above process is repeated until there are no two instances in the set I that can be merged. At this time, the instances in the set I are the final instances.
A schematic diagram of the judgment and merging of the four second-level subsystems for the State pattern shown in Figure 3 is shown in Figure 9.

8. Experiments and Result Analysis

To verify the effectiveness of the method in this study, experiments were carried out on three open-source projects using three non-machine learning design pattern detection methods and five design pattern detection methods based on traditional machine learning algorithms as well as the method in this paper. In addition, the experimental results were analyzed and discussed from precision and recall.

8.1. Experimental Environment and Data

Here we used the JavaWeb technology and used the Eclipse tool as the development environment to develop the support tool for the proposed method. This tool is an updated and upgraded version of the design pattern detection tool we developed in [22,23,24], named PatternDetectorByDL 3.0 (Version number: 3.0; Creator: Lei Wang, et al.; Location: Beijing, China). The tool takes the source code or UML model (class diagram and sequence diagram) of the system to be identified as input and automatically divides the system to be identified into subsystems and second-level subsystems according to the pattern to be identified, selected by the user, and converts them into colored UML models, then input into the corresponding design pattern classification model that has been trained and saved for judgment and merge the judgment results to obtain the final pattern instances, and finally display the detection results on the interface.
The running environment of the experiments was: Windows 10 (Version number: 10; Creator: Microsoft; Location: Seattle, USA) operating system, Genuine Intel (R) CPU (number of cores: 4, number of threads: 8), 16.00 GB memory, 2.40 GHz main frequency and 500 GB hard disk.
The open-source projects JHotDraw, JRefactory and JUnit contain a large number of design pattern instances, and the documents of these projects record the use information of design patterns in detail. Therefore, they are used to verify the design pattern detection methods in many references. In this study, JHotDraw 5.1, JRefactory 2.6.24 and JUnit 3.7 were selected as experimental data.

8.2. Evaluation Indexes

The evaluation of the effectiveness of design pattern detection methods in this study is based on the following terms:
(1)
True positive (TP).
(2)
False positive (FP).
(3)
False negative (FN).
(4)
Precision.
(5)
Recall.
For the definitions of the above terms, see references [22,23,24].

8.3. Result Analysis

Table 2, Table 3 and Table 4 list the number of true positive instances, the number of false positive instances, and the number of false negative instances of design pattern detection in the three open-source projects by the three non-machine learning design pattern detection methods of Mayvan et al. [9], Tsantalis et al. [7] and Luitel et al. [6] as well as the method in this paper, respectively; Table 5, Table 6 and Table 7 list the precisions and recalls of design pattern detection in the three open-source projects by the three non-machine learning design pattern detection methods as well as the method in this paper, respectively.
As seen in Table 5, Table 6 and Table 7, the average precision/recall of JHotDraw 5.1 of Mayvan et al. [9], Tsantalis et al. [7] and Luitel et al. [6] were 90.0%/80.6%, 74.9%/96.2%, and 73.0%/83.8%, respectively; the average precision/recall of JRefactory 2.6.24 were 83.6%/71.3%, 79.4%/88.1%, and 58.6%/63.8%, respectively; the average precision/recall of JUnit 3.7 were 100.0%/95.8%, 60.0%/100.0% and 61.1%/90.3%, respectively. It can be seen that Mayvan et al. [9] achieved high precision in all three projects, but the recall of JHotDraw 5.1 and JRefactory 2.6.24 was not high. Contrary to Mayvan et al. [9], Tsantalis et al. [7] achieved high recall in the three projects, however, the precision was low, especially the precision of JUnit 3.7 was only 60.0%. The reason lies in that the detection rules of these methods are all obtained from the theoretical description of design patterns, while the detection rules of design patterns are very complex and flexible. Improving the matching standard will increase the precision to a certain extent, but it will reduce the recall. Reducing the matching standard will improve the recall, but it will lead to low precision. Luitel et al. [6] tried to use the Prolog language to facilitate the addition and modification of rules to improve the detection effect. From the detection results, Luitel et al. [6] generally maintained the balance between precision and recall, but the precision and recall are very low except that the recall of JRefactory 2.6.24 reached 90%. In addition, the calling rules between classes of design patterns are more complex and flexible. The methods of Mayvan et al. [9], Tsantalis et al. [7], and Luitel et al. [6] are generally not good in identifying behavioral patterns, and none of the three methods can distinguish between the Adapter/Command patterns and State/Strategy patterns. In this study, the powerful automatic feature extraction capability of deep learning combined with the advantages of SVM on binary classification problems was leveraged, resulting in improved precision and recall and a good distinction between the Adapter/Command patterns and State/Strategy pattern, and the average precision/recall on the three open source projects reached 94.1%/94.1%, 90.6%/89.6%, and 90.3%/100.0%, respectively.
In this paper, experiments were also conducted on the three open-source programs with the application of six design pattern detection methods based on traditional machine learning algorithms, proposed by Lu et al. [27], Chihada et al. [28], Uchiyama et al. [31,32], Dong et al. [25], and Feng et al. [36]. All these methods require manual extraction and selection of features. Among them, Lu et al. [27] selected 12 metric features, such as whether being an abstract class, whether being an interface, the number of methods, the number of generalization relation sources, and the number of generalization relation targets. For each design pattern, the model was trained by using three classification algorithms: KNN, C4.5 decision trees, and SVM. Chihada et al. [28] selected 64 metric features such as class interface width, number of attributes, number of classes, number of constructors, loop complexity, fan-out, etc., and they used SVM-PHGS [56] to train classifiers for patterns of Adapter, Builder, Composite, Factory Method, Iterator, and Observer. For each role of five patterns, including Singleton, Template Method, Adapter, State and Strategy, Uchiyama et al. [31,32] selected features such as number of static domains, number of private constructors, number of methods, number of static methods, number of abstract methods, number of overriding methods, number of interfaces, number of domains, number of object domains, and number of methods for generating instances. They made an input of pattern-applied programs into the measuring system to obtain the metrics of each pattern role, and these metrics were put into the ANN simulator for learning to train the classifiers. Dong et al. [25] considered entities (classes/interfaces/objects) and relationships between entities. They reduced the learning of composite records (classes) to some basic models by clustering training records (classes) with related attributes/relationships and then built decision trees based on the clustered training samples. Feng et al. [36] considered 69 metric features such as the weighting method of classes, line of code, loop metric, number of changes in access methods, as well as 16 structural features including overriding method, create object, return type, delegation, multiple redirections in the family, and redirect in the family. For each design pattern, a classifier was trained with metric and microstructure, respectively, and then the final classifier was trained by model stacking. Viewing the experimental results, some methods performed well on certain programs or patterns, e.g., Chihada et al. [28] achieved 100% precision and recall for two patterns on JUnit, but the performance was very poor on some other programs or patterns. This is because different programs and patterns have their own characteristics, and it is hard for researchers to take a comprehensive consideration of these different characteristics in the process of manual feature extraction and feature selection. In addition, like non-machine learning methods, these design pattern detection methods based on traditional machine learning algorithms do not perform well on behavioral patterns, and most of them cannot distinguish between the Adapter/Command patterns and the State/Strategy patterns. This is because it is more difficult to select appropriate and effective features for behavioral patterns than for creation and structural patterns. In general, the method proposed in this paper has achieved higher precision and recall than the design pattern detection methods based on traditional machine learning algorithms on the three programs. For different programs and their patterns, the precision and recall were stable at more than 85% in most cases, including the identification of behavioral patterns such as Observer and State.
According to the above analysis, the method in this paper can achieve better identification results than the non-machine learning methods and the design pattern detection methods based on traditional machine learning algorithms, and can maintain stability for different projects and different patterns. In addition, this paper can also distinguish instances of behavioral patterns that have similar structural features to other patterns (e.g., there are similar structural features between the State pattern and the Strategy pattern, as well as the Command pattern and the Adapter pattern).

9. Conclusions and Prospect

9.1. Conclusions

The existing literature on machine learning design pattern detection largely adopts traditional machine learning algorithms like the KNN, decision trees, ANN, SVM, and logistic regression. No scholarly attempt has been made to use deep learning to recognize design patterns. It is a daunting task to find the most suitable and effective features to address the design pattern detection problem. Deep learning is mainly suitable for locally correlated, dense continuous data such as images, texts, and voices, and cannot be directly applied to address the design pattern detection problem. In this research project, a colored UML model is proposed by adding colors, line types, and extending shapes for the purpose of extending graph information with elements like the traditional UML classes, operations, the relationship between classes, and call relationship between methods, thereby converting the design pattern detection problem into a graph recognition problem. On the basis of converting positive and negative samples of collected instances and the system to be recognized into graph-style colored UML model, this paper leverages deep learning technology with advantages like powerful automatic feature extraction in combination with the SVM excelling at binary classification problems to realize the end-to-end design pattern detection, producing more favorable detection effect than other methods.
Compared with other methods, the biggest contribution of this paper is to transform the design pattern detection problem into an image classification problem and realize end-to-end design pattern detection based on deep learning technology. This provides a completely new and effective way of thinking and direction for the design pattern detection problem.

9.2. The Pros and Cons of Using Our Method

9.2.1. Pros

This paper combines the advantages of deep learning and SVM, and has achieved good detection results in both structural and creational patterns as well as behavioral patterns.
The method in this paper realizes end-to-end design pattern detection without additional work, such as manual feature extraction and feature selection. Therefore, it is not required to have a very deep knowledge and understanding of the patterns to be recognized, and the detection models can be trained only by constructing the sample set of the patterns. It also makes it very easy to add new patterns.

9.2.2. Cons and Limitations

For the design pattern detection of source code, the method in this paper needs to convert the source code into a UML model with the help of third-party tools such as Visio and IntelliJ IDEA. The completeness and consistency of the UML models converted by these tools will have a significant impact on the final detection results.
This method relies on decomposing the system into subsystems and second-level subsystems. Dividing subsystems and second-level subsystems take a lot of time and memory space. The required time and memory space increase quadratically with the number of system classes.

9.3. Prospect

There are still some deficiencies in the current research, and future work is expected, mainly as follows:
(1) The current semantics of the colored UML model is still relatively simple, without considering information such as attributes of classes, and it only targets UML class diagrams and sequence diagrams. In the future, class properties and other information will be further added to the colored UML model with an expansion of other UML diagrams, including state diagrams.
(2) The deep learning model currently used in this paper is a convolutional neural network. However, the traditional convolutional neural network is generally regarded as undesirable for modeling when it comes to time sequence problems, so the sequences of function invocations were not considered in the identification of design patterns in this paper. However, such sequences are sometimes crucial for the recognition of behavioral patterns. In future work, a recurrent neural network that can model the sequences of function invocations will be introduced on the basis of the convolutional neural network to train better models.

Author Contributions

Conceptualization, L.W.; methodology, L.W. and T.S.; software, L.W., T.S. and S.Z.; validation, L.W., T.S. and S.Z.; investigation, L.W., T.S. and S.Z.; resources, S.Z.; data curation, T.S.; writing—original draft preparation, L.W., H.-N.S. and S.Z.; writing—review and editing, L.W. and H.-N.S.; visualization, H.-N.S. and S.Z.; supervision, L.W.; project administration, L.W.; funding acquisition, L.W. All authors have read and agreed to the published version of the manuscript.

Funding

This research was funded by the National Natural Science Foundation of China (NSFC), grant number 62041212; Scientific Research Plan Projects of Shaanxi Education Department, grant number 21JK0988; PhD Scientific Research Startup Foundation of Yan’an University, grant number YDBK2019-51; Open Fund Project of Shaanxi Key Laboratory of Intelligent Processing for Big Energy Data, grant number IPBED22.

Institutional Review Board Statement

Not applicable.

Informed Consent Statement

Not applicable.

Data Availability Statement

The open source projects presented in this study are openly available: JHotDraw 5.1 (http://www.inf.fu-berlin.de/lehre/WS99/java/ (accessed on 27 March 2018)) JRefactory 2.6.24 (https://sourceforge.net/projects/jrefactory/files/JRefactory/2.6.24/ (accessed on 18 June 2018)) and JUnit 3.7 (https://sourceforge.net/projects/junit/files/junit/3.7/ (accessed on 8 January 2019)).

Conflicts of Interest

The authors declare no conflict of interest.

Appendix A

Figure A1. UML class diagram of Subsystem s 1 of the open source project JHotDraw 5.1.
Applsci 12 08718 g0a1

References

  1. Naghdipour, A.; Hasheminejad, S.; Keyvanpour, M.R. DPSA: A Brief Review for Design Pattern Selection Approaches. In Proceedings of the 2021 26th International Computer Conference: Computer Society of Iran (CSICC), Tehran, Iran, 3–4 March 2021; pp. 1–14. [Google Scholar]
  2. Ohstuki, M.; Kakeshita, T. Generating Relationship between Design Pattern and Source Code. In Proceedings of the 13th International Conference on Computer Supported Education, Prague, Czech Republic, 23–25 April 2021; pp. 288–293. [Google Scholar]
  3. Gamma, E.; Helm, R.; Johnson, R.; Vlissides, J. Design Patterns: Elements of Reusable Object-Oriented Software; Addison-Wesley: Boston, MA, USA, 1995. [Google Scholar]
  4. Yarahmadi, H.; Hasheminejad, S. Design pattern detection approaches: A systematic review of the literature. Artif. Intell. Rev. 2020, 53, 5789–5846. [Google Scholar] [CrossRef]
  5. Krämer, C.; Prechelt, L. Design recovery by automated search for structural design patterns in object-oriented software. In Proceedings of the Working Conference on Reverse Engineering, Monterey, CA, USA, 11–10 November 1996; pp. 1–9. [Google Scholar]
  6. Luitel, G.; Stephan, M.; Inclezan, D. Model level design pattern instance detection using answer set programming. In Proceedings of the International Workshop on Modeling in Software Engineering, Austin, TX, USA, 16–17 May 2016; pp. 13–19. [Google Scholar]
  7. Tsantalis, N.; Chatzigeorgiou, A.; Stephanides, G.; Halkidis, S.T. Design pattern detection using similarity scoring. IEEE Trans. Softw. Eng. 2006, 32, 896–909. [Google Scholar] [CrossRef]
  8. Yu, D.; Zhang, P.; Yang, J.; Chen, Z.; Liu, C.; Chen, J. Efficiently detecting structural design pattern instances based on ordered sequences. J. Syst. Softw. 2018, 142, 35–56. [Google Scholar] [CrossRef]
  9. Mayvan, B.B.; Rasoolzadegan, A. Design pattern detection based on the graph theory. Knowl.-Based Syst. 2017, 120, 211–225. [Google Scholar] [CrossRef]
  10. Fawareh, H.J.; Alshira’H, M. MDetection a design pattern through merge static and dynamic analysis using altova and lambdes tools. Int. J. Appl. Eng. Res. 2017, 12, 8518–8522. [Google Scholar]
  11. Zhang, P.; Yu, D.; Wang, J. A Degree-Driven Approach to Design Pattern Mining Based on Graph Matching. In Proceedings of the 2017 24th Asia-Pacific Software Engineering Conference (APSEC), Nanjing, China, 4–8 December 2017; pp. 179–188. [Google Scholar]
  12. Di Martino, B.; Esposito, A. A rule-based procedure for automatic recognition of design patterns in UML diagrams. Softw. Pract. Exp. 2016, 46, 983–1007. [Google Scholar] [CrossRef]
  13. Al-Obeidallah, M.; Petridis, M.; Kapetanakis, S. MLDA: A Multiple Levels Detection Approach for Design Patterns Recovery. In Proceedings of the International Conference on Compute and Data Analysis, Lakeland, Florida, 19–23 May 2017; pp. 33–40. [Google Scholar]
  14. Shi, N.; Olsson, R.A. Reverse Engineering of Design Patterns from Java Source Code. In Proceedings of the 21st IEEE/ACM International Conference on Automated Software Engineering (ASE 2006), Tokyo, Japan, 18–22 September 2006; pp. 123–134. [Google Scholar]
  15. Panich, A.; Vatanawood, W. Detection of design patterns from class diagram and sequence diagrams using ontology. In Proceedings of the IEEE/ACIS International Conference on Computer & Information Science, Okayama, Japan, 26–29 June 2016; pp. 1–6. [Google Scholar]
  16. Chaturvedi, A.; Gupta, M.; Kumar, S. Design Pattern Detection using Genetic Algorithm for Sub-graph Isomorphism to Enhance Software Reusability. Int. J. Comput. Appl. 2016, 135, 33–36. [Google Scholar] [CrossRef]
  17. Bernardi, M.L.; Cimitile, M.; de Ruvo, G.D.; di Lucca, G.A.; Santone, A. Model checking to improve precision of design pattern instances identification in OO systems. In Proceedings of the International Joint Conference on Software Technologies, Lisbon, France, 20–22 July 2015; pp. 53–63. [Google Scholar]
  18. Aladib, L.; Lee, S.P. Pattern detection and design rationale traceability: An integrated approach to software design quality. IET Softw. 2019, 13, 249–259. [Google Scholar] [CrossRef]
  19. Al-Obeidallah, M.G.; Petridis, M.; Kapetanakis, S. A Structural Rule-Based Approach for Design Patterns Recovery. In Proceedings of the International Conference on Software Engineering Research, Management and Applications, London, UK, 7–9 June 2017; pp. 107–124. [Google Scholar]
  20. Xiao, Z.Y.; He, P. Multistage relaxing detection method for variants of design pattern. J. Huazhong Univ. Sci. Technol. (Nat. Sci. Ed.) 2018, 46, 26–31. [Google Scholar]
  21. Chan, E.P. Artificial Intelligence Techniques; John Wiley & Sons, Ltd.: Hoboken, NJ, USA, 2017. [Google Scholar]
  22. Wang, L. Design Pattern Detection Based on Similarity Scoring, FSM and Machine Learning. Ph.D. Thesis, China University of Mining and Technology (Beijing), Beijing, China, 20 June 2019. [Google Scholar]
  23. Wang, L. Automatic Design Pattern Detection—Principles, Methods and Tools; Hans Publishing House: Wuhan, China, 2020. [Google Scholar]
  24. Wang, L.; Wang, W.-F.; Song, H.-N.; Zhang, S. Design Pattern Detection Based on Similarity Scoring and Secondary Subsystems. Comput. Eng. 2022. online. [Google Scholar]
  25. Dong, J.; Sun, Y.; Zhao, Y. Compound record clustering algorithm for design pattern detection by decision tree learning. In Proceedings of the 2008 IEEE International Conference on Information Reuse and Integration, Las Vegas, NV, USA, 13–15 July 2018; pp. 1–6. [Google Scholar]
  26. Zanoni, M.; Fontana, F.A.; Stella, F. On applying machine learning techniques for design pattern detection. J. Syst. Softw. 2015, 88, 102–117. [Google Scholar] [CrossRef]
  27. Lu, R.-Z.; Zhang, H.-P. Research on Design Pattern Mining Based on Machine Learning. Comput. Eng. Appl. 2019, 55, 119–125. [Google Scholar]
  28. Chihada, A.; Jalili, S.; Hasheminejad, S.M.H.; Zangooei, M.H. Source code and design conformance, design pattern detection from source code by classification approach. Appl. Soft Comput. J. 2015, 26, 357–367. [Google Scholar] [CrossRef]
  29. Chaturvedi, S.; Chaturvedi, A.; Tiwari, A.; Agarwal, S. Design Pattern Detection using Machine Learning Techniques. In Proceedings of the 2018 7th International Conference on Reliability, Infocom Technologies and Optimization (Trends and Future Directions) (ICRITO), Noida, India, 29–31 August 2018; pp. 1–6. [Google Scholar]
  30. Alhusain, S.; Coupland, S.; John, R.; Kavanagh, M. Towards machine learning based design pattern recognition. In Proceedings of the The 13th Annual UK Workshop on Computational Intelligence, Guildford, UK, 9–11 September 2013; pp. 244–251. [Google Scholar]
  31. Uchiyama, S.; Kubo, A.; Washizaki, H.; Fukazawa, Y. Design Pattern Detection using Software Metrics and Machine Learning. In Proceedings of the First International Workshop on Model-Driven Software Migration, Oldenburg, Germany, 1–4 March 2011; pp. 38–47. [Google Scholar]
  32. Uchiyama, S.; Kubo, A.; Washizaki, H.; Fukazawa, Y. Detecting design patterns in object-oriented program source code by using metrics and machine learning. J. Softw. Eng. Appl. 2014, 7, 1–12. [Google Scholar] [CrossRef] [Green Version]
  33. Barbudo, R.; Ramírez, A.; Servant, F.; Romero, J.R. GEML: A grammar-based evolutionary machine learning approach for design-pattern detection. J. Syst. Softw. 2021, 175, 110919. [Google Scholar] [CrossRef]
  34. Thaller, H.; Linsbauer, L.; Egyed, A. Feature Maps: A Comprehensible Software Representation for Design Pattern Detection. In Proceedings of the 2019 IEEE 26th International Conference on Software Analysis, Evolution and Reengineering (SANER), Hangzhou, China, 24–27 February 2019; pp. 207–217. [Google Scholar]
  35. Mhawish, M.Y.; Gupta, M. Software Metrics and tree-based machine learning algorithms for distinguishing and detecting similar structure design patterns. SN Appl. Sci. 2020, 2, 2–11. [Google Scholar] [CrossRef]
  36. Feng, T.; Jin, L.; Zhang, J.-C.; Wang, H.-Y. Design Pattern Detection Approach Based on Stacked Generalization. J. Softw. 2020, 31, 1703–1722. [Google Scholar]
  37. Lecun, Y.; Bengio, Y.; Hinton, G. Deep learning. Nature 2015, 521, 436–444. [Google Scholar] [CrossRef]
  38. Pouyanfar, S.; Sadiq, S.; Yan, Y.; Tian, H.; Tao, Y.; Reyes, M.P.; Shyu, M.-L.; Chen, S.-C.; Iyengar, S.S. A Survey on Deep Learning: Algorithms, Techniques, and Applications. ACM Comput. Surv. 2019, 51, 1–36. [Google Scholar]
  39. Wang, H.-Y.; Wang, H.-Y.; Zhu, X.-J.; Song, L.-M.; Guo, Q.-H.; Dong, F. Three-Dimensional Reconstruction of Dilute Bubbly Flow Field with Light-Field Images Based on Deep Learning Method. IEEE Sens. J. 2021, 21, 13417–13429. [Google Scholar] [CrossRef]
  40. Shi, J.Y.; Wang, X.-D.; Ding, G.Y.; Dong, Z.; Han, J.; Guan, Z.-H.; Ma, L.-J.; Zheng, Y.-X.; Zhang, L.; Yu, G.-Z.; et al. Exploring prognostic indicators in the pathological images of hepatocellular carcinoma based on deep learning. Gut 2020, 70, 951–961. [Google Scholar] [CrossRef] [PubMed]
  41. Francese, R.; Frasca, M.; Risi, M.; Tortora, G. A mobile augmented reality application for supporting real-time skin lesion analysis based on deep learning. J. Real-Time Image Processing 2021, 18, 1247–1259. [Google Scholar] [CrossRef]
  42. Zhu, H. Weibo Text Sentiment Analysis Based on BERT and Deep Learning. Appl. Sci. 2021, 11, 10774–10791. [Google Scholar]
  43. Ali, M.N.Y.; Rahman, M.L.; Chaki, J.; Dey, N.; Santosh, K.C. Machine translation using deep learning for universal networking language based on their structure. Int. J. Mach. Learn. Cybern. 2021, 12, 2365–2376. [Google Scholar] [CrossRef]
  44. Yang, S.; Wang, Y.; Chu, X. A Survey of Deep Learning Techniques for Neural Machine Translation. arXiv 2002, arXiv:2002.07526. [Google Scholar]
  45. Cui, H.; Zhao, Y.; Dong, W. Research on life prediction method of rolling bearing based on deep learning and voice interaction technology. Int. J. Speech Technol. 2021. online. [Google Scholar] [CrossRef]
  46. Wahengbam, K.; Singh, M.P.; Nongmeikapam, K.; Singh, A.D. A Group Decision Optimization Analogy based Deep Learning architecture for multiclass pathology classification in a voice signal. IEEE Sens. J. 2021, 21, 8100–8116. [Google Scholar] [CrossRef]
  47. Faris, H. Toward an Automatic Quality Assessment of Voice-Based Telemedicine Consultations: A Deep Learning Approach. Sensors 2021, 21, 3279–3305. [Google Scholar]
  48. Wang, X.; Zhang, T.; Xin, W.; Hou, C.-Y. Source Code Defect Detection Based on Deep Learning. Trans. Beijing Inst. Technol. 2019, 39, 1155–1159. [Google Scholar]
  49. Guéhéneuc, Y.-G. P-MARt: Pattern-like Micro Architecture Repository. In Proceedings of the lst EuroPLoP Focus Group on Pattern Repositories, Irsee, Germany, 4–8 July 2007; pp. 1–3. [Google Scholar]
  50. Fontana, F.A.; Caracciolo, A.; Zanoni, M. DPB: A benchmark for design pattern detection tools. In Proceedings of the Proc. of the 16th European Conf. on Software Maintenance and Reengineering (CSMR), Szeged, Hungary, 27–30 March 2012; pp. 235–244. [Google Scholar]
  51. Ampatzoglou, A.; Michou, O.; Stamelos, I. Building and mining a repository of design pattern instances: Practical and research benefits. Entertain. Comput. 2013, 4, 131–142. [Google Scholar] [CrossRef]
  52. Nazar, N.; Aleti, A. Feature-Based Software Design Pattern Detection. J. Syst. Softw. 2021, 185, 111179. [Google Scholar] [CrossRef]
  53. Simonyan, K.; Zisserman, A. Very Deep Convolutional Networks for Large-Scale Image Recognition. In Proceedings of the International Conference on Learning Representations, San Diego, CA, USA, 7–9 May 2015; pp. 1–14. [Google Scholar]
  54. Bi, R.; Sun, G.-F.; Zhou, X.-Y.; Liu, W.-W. Hands-On Deep Learning from Scratch; Tsinghua University Press: Beijing, China, 2020. [Google Scholar]
  55. Liu, X.-L.; Yang, Q.-H.; Hu, X.-G.; Yu, D.-H.; Bai, H.-J. Deep Learning by PaddlePaddle; Machinery Industry Press: Beijing, China, 2020. [Google Scholar]
  56. Zangooei, M.H.; Jalili, S. PSSP with dynamic weighted kernel fusion based on SVM-PHGS. Knowl.-Based Syst. 2012, 27, 424–442. [Google Scholar] [CrossRef]
Figure 1. The basic flow of non-machine learning design pattern detection methods.
Applsci 12 08718 g001
Figure 2. The basic flow of machine learning design pattern detection methods.
Applsci 12 08718 g002
Figure 3. Four second-level subsystems for the State pattern of the subsystem s 1 . (a) Second-level subsystem s 11 . (b) Second-level subsystem s 12 . (c) Second-level subsystem s 13 . (d) Second-level subsystem s 14 .
Applsci 12 08718 g003
Figure 4. Schematic diagram of the colored UML representation for the class names of SelectionTool and Tool.
Applsci 12 08718 g004
Figure 5. Schematic diagram of the colored UML representation for the operation names of the three operations of the class Selection Tool.
Applsci 12 08718 g005
Figure 6. Second-level subsystem s 14 represented by colored UML model.
Applsci 12 08718 g006
Figure 7. Model structure.
Applsci 12 08718 g007
Figure 8. VGG training results of different batches for the State pattern classifier. (a) Loss Curve. (b) Acc Curve.
Applsci 12 08718 g008
Figure 9. Schematic diagram of the judgment and merging of the four second-level subsystems for the State pattern.
Applsci 12 08718 g009
Table 1. SVM training results of different batches for the State pattern classifier.
Batch_SizeAccuracy Rate of Validation Set
10090.56%
20091.23%
30091.78%
40092.79%
50091.93%
Table 2. The number of true positive instances, the number of false positive instances and the number of false negative instances in JHotDraw 5.1.
Design PatternMayvan et al.’s MethodTsantalis et al.’s MethodLuitel et al.’s MethodOur Method
TPFPFNTPFPFNTPFPFNTPFPFN
Adapter909183015331711
Command
Composite100110110100
Decorator3003103203 1 0
Factory method3002011022 0 1
Observer30252053041 1
Prototype10010010010 0
Singleton200210101200
State2201223121222320
Strategy
Template Method500530441500
Visitor001110120100
Average
Table 3. The number of true positive instances, the number of false positive instances and the number of false negative instances in JRefactory 2.6.24.
Design PatternMayvan et al.’s MethodTsantalis et al.’s MethodLuitel et al.’s MethodOur Method
TPFPFNTPFPFNTPFPFNTPFPFN
Adapter403720621611
Command
Decorator0011000011 0 0
Factory method301103212202
Singleton903122010121210
State1101115110421101
Strategy
Template Method17301713016611720
Visitor200210121210
Average
Table 4. The number of true positive instances, the number of false positive instances and the number of false negative instances in JUnit 3.7.
Design PatternMayvan et al.’s MethodTsantalis et al.’s MethodLuitel et al.’s MethodOur Method
TPFPFNTPFPFNTPFPFNTPFPFN
Adapter100110110100
Command
Composite100100100100
Decorator100110110100
Observer301420311420
State300320211 310
Strategy
Template Method100120130100
Average
Table 5. The precisions and recalls in JHotDraw 5.1.
Design PatternMayvan et al.’s MethodTsantalis et al.’s MethodLuitel et al.’s MethodOur Method
PrecisionRecallPrecisionRecallPrecisionRecallPrecisionRecall
Adapter100.0%50.0%85.7%100.0%83.3%83.3%94.4%94.4%
Command
Composite100.0%100.0%50.0%100.0%50.0%100.0%100.0%100.0%
Decorator100.0%100.0%75.0%100.0%60.0%100.0%75.0%100.0%
Factory method100.0%100.0%100.0%66.7%100.0%33.3%100.0%66.7%
Observer100.0%60.0%71.4%100.0%62.5%100.0%80.0%80.0%
Prototype100.0%100.0%100.0%100.0%100.0%100.0% 100.0%100.0%
Singleton100.0%100.0%66.7%100.0%100.0%50.0%100.0%100.0%
State100.0%95.7%88.0%95.7%91.3%91.3%92.0%100.0%
Strategy
Template Method100.0%100.0%62.5%100.0%50.0%80.0%100.0%100.0%
Visitor 0.0%50.0%100.0%33.3%100.0%100.0%100.0%
Average90.0%80.6%74.9%96.2%73.0%83.8%94.1%94.1%
Table 6. The precisions and recalls in JRefactory 2.6.24.
Design PatternMayvan et al.’s MethodTsantalis et al.’s MethodLuitel et al.’s MethodOur Method
PrecisionRecallPrecisionRecallPrecisionRecallPrecisionRecall
Adapter100.0%57.1%77.8%100.0%75.0%85.7%85.7%85.7%
Command
Decorator 0.0%100.0%100.0% 0.0%100.0%100.0%
Factory method100.0%75.0%100.0%25.0%66.7%50.0%100.0%50.0%
Singleton100.0%75.0%85.7%100.0%90.9%83.3%92.3%100.0%
State100.0%91.7%68.8%91.7%71.4%83.3%100.0%91.7%
Strategy
Template Method85.0%100.0%56.7%100.0%72.7%94.1%89.5%100.0%
Visitor100.0%100.0%66.7%100.0%33.3%50.0%66.7%100.0%
Average83.6%71.3%79.4%88.1%58.6%63.8%90.6%89.6%
Table 7. The precisions and recalls in JUnit 3.7.
Design PatternMayvan et al.’s MethodTsantalis et al.’s MethodLuitel et al.’s MethodOur Method
PrecisionRecallPrecisionRecallPrecisionRecallPrecisionRecall
Adapter100.0%100.0%50.0%100.0%50.0%100.0%100.0%100.0%
Command
Composite100.0%100.0%100.0%100.0%100.0%100.0%100.0%100.0%
Decorator100.0%100.0%50.0%100.0%50.0%100.0%100.0%100.0%
Observer100.0%75.0%66.7%100.0%75.0%75.0%66.7%100.0%
State100.0%100.0%60.0%100.0%66.7%66.7%75.0%100.0%
Strategy
Template Method100.0%100.0%33.3%100.0%25.0%100.0%100.0%100.0%
Average100.0%95.8%60.0%100.0%61.1%90.3%90.3%100.0%
Publisher’s Note: MDPI stays neutral with regard to jurisdictional claims in published maps and institutional affiliations.

