Article

Characterization of Piezoelectric Energy Production from Asphalt Pavements Using a Numerical-Experimental Framework

by
Bruno C. Mota
1,*,
Bruno Albuquerque Neto
2,
Suelly H. A. Barroso
3,
Francisco T. S. Aragão
1,
Adelino J. L. Ferreira
4,
Jorge B. Soares
3 and
Lélio A. T. Brito
5
1
Graduate Program in Civil Engineering-COPPE, Federal University of Rio de Janeiro, Rio de Janeiro 21941-901, Brazil
2
Ari de Sá Cavalcante School, Monsenhor Catão Street, 1655, Aldeota, Fortaleza 60175-010, Brazil
3
Graduate Program in Transportation Engineering, Department of Transportation Engineering, Federal University of Ceará, Fortaleza 60020-181, Brazil
4
Research Center for Territory, Transports and Environment, Department of Civil Engineering, University of Coimbra, 3004-531 Coimbra, Portugal
5
Pavement Laboratory, Department of Civil Engineering, Federal University of Rio Grande do Sul, Porto Alegre 90010-150, Brazil
*
Author to whom correspondence should be addressed.
Sustainability 2022, 14(15), 9584; https://doi.org/10.3390/su14159584
Submission received: 6 July 2022 / Revised: 29 July 2022 / Accepted: 31 July 2022 / Published: 4 August 2022
(This article belongs to the Special Issue Sustainable Electric Power System and Renewable Energy)

Abstract

:
The recent increase in demand for electric energy and different ways of harvesting and generating it has been a key research stream in transportation infrastructure in Brazil. Since pavement structures are subjected to the mechanical load of millions of vehicles, the application of piezoelectric sensors is adequate, transforming deformations and vibrations on its layers into electric power. The general objective of this study was to investigate the use of piezoelectricity as a source of renewable energy applied to roadways using computational simulations and laboratory tests. The results indicate that factors such as frequency, load, the number of piezo cells, and spacing all affect the amount of power harvested. Regarding power generation in the simulation and laboratory characterization, the highest values obtained were 648.8 mW and 226.9 mW, respectively. The analysis indicates there is a correlation between the laboratory tests and the computational simulations, enabling the prototype application to capture up to 76.56 MWh of energy per month. Usage of piezoelectricity has been demonstrated to be a promising alternative to complement the Brazilian energy matrix and reduce the environmental impact.

Graphical Abstract

1. Introduction

According to the principle of energy conservation, in an isolated system, energy remains constant and when used it transforms and propagates itself into space [1]. There are energy forms that may be obtained from the direct transformation of environmental energy (hydraulic, solar, wind, mechanical, etc.) to electric energy through a transduction material or mechanism. Some of the most common ways to convert energy into electricity are: (i) hydroelectric power plants generating energy from water; (ii) photovoltaic solar panels transforming solar energy; (iii) wind turbines converting wind energy; and (iv) piezoelectric transducers to conserve the vibrations from mechanical energy.
The capture of electric energy through piezoelectricity has shown advantages when compared to other methods [2]: independence from climate factors, no need for large areas of space for installation, and a high amount of generated power, among others. The materials with piezoelectric properties generate an electric voltage when they are induced by stress and deformation over time. Electric voltage (V) generated in the element with that characteristic is obtained by Equation (1), in which voltage increases linearly with the applied load and the element thickness. However, through simulations on Multiphysics analysis software, it was found that the increase depends more on the thickness of the cell than on its area [3].
V = d F h ε r ε 0 A
where, d (C/N) is the piezoelectric constant, F (N) is the applied force, h (m) is the thickness and A (m²) is the area of the cell. The constants of relative and vacuum permissiveness are represented by εr (F/m) and ε0 (F/m), respectively. The variables d and εr depend on the material used. Therefore, the piezoelectric transducer must be highly sensitive and placed as close as possible to the contact area to effectively absorb vibrations and deformations. By converting mechanical energy on the asphalt pavement, it is possible to generate sufficient electricity for traffic lights, structural health monitoring systems, and charge electric vehicles [4].
Roadways are used by many millions of vehicles, generating vibrations and deformations on the layers of the pavement. In Brazil, according to the Ministry of Infrastructure [5], the fleet is composed of 108,222,494 vehicles, of which 58,125,111 are cars. Those vibrations may not only cause damage to the pavement but also yield energy waste, considering the amount of energy provided by the vehicles [6].
Piezoelectricity is identified in materials that have complex crystal structures with a low degree of symmetry. Some of the main piezoelectric ceramic materials are barium and lead titanate (BaTiO3 e PbTiO3), lead zirconate (PbZrO3), lead zirconate titanate (PZT) [Pb(Zr,Ti)O3], and potassium niobate (KNbO3). Heating a polycrystalline sample above its Curie temperature enables the improvement of its piezoelectric behavior [7]. The properties of the PZT-type ceramics depend on their composition [8]. The PZT is fragile and produces higher levels of electric voltage [9], but, as it is a harder material, it is more prone to fatigue [10].
Several prototypes [11,12,13,14,15,16,17,18,19,20,21,22,23,24,25,26,27] have been tested to verify the influence of different loads, frequencies, and resistances of piezoelectric materials inserted into asphalt mixture specimens. Of these, some also focus on Multiphysics analysis, in which they evaluate the physicochemical properties, geometry, and composition of the material, as well as strength and electrical parameters [4,13,27]. A tested prototype was able to obtain between 1.25 × 10⁻⁶ Wh and 2.68 × 10⁻¹ Wh of energy per system with the application of an average load of 44.5 kN, an amplitude of 17.80 kN, and a frequency of 1.50 Hz [11] for a traffic load of 1797 6-axle vehicles per day [27]. Some researchers tested two different prototype combinations [28,29,30], and the developed systems were able to generate up to 1.49 W and 64.12 mW, respectively, for trucks traveling at 65 km/h. For cars, the total energy produced was 33.00 mW and 1.36 mW at the same speed. Researchers have also reported simulations of their prototypes, [31,32,33], analyzing the influence of high vehicle traffic on the pavement. There is potential for a system with 30,000 piezoelectric cells to produce up to 65.00 MWh of energy in one year [15] and up to 306.37 MW of power for the same number of cells with a traffic load of 600 vehicles per hour [33].
Moreover, an innovative system of energy harvesting with electromechanical modules, Waynergy Vehicles [34,35,36], was applied in Portugal. Using 10 modules, it was possible to generate up to 152 Wh of energy in a single day. Each vehicle can produce up to 4.03 × 10⁻² Wh when driving at a speed of 50 km/h.
The advantages of using piezoelectricity focus on the issue of not depending on climatic factors and having a high capacity to generate energy, depending on the traffic [15]. It also highlights the fact that it has already been tested in a real environment [24] and has increased laboratory tests [17,18,19,20,21,22,23], and cells can be manufactured from different types of materials effectively and efficiently to maximize the system. The disadvantages are because the installation site, which may have reduced contact with the vehicle, decreased the amount of energy generated, and the fact that it does not supply homes without storage in power generators [28,29,30]. However, it is believed that these disadvantages should be resolved in the coming years through national and international research regarding the topic.
However, most of the existing studies have not analyzed the correlation between laboratory tests and the simulations performed. Additionally, they apply only for the ideal situation, where there are no irregularities in the pavement. Thus, the novelty of this paper is to report the impact of the electrical resistance on the prototype configuration when applied to a road with irregularities using a high dynamic modulus and comparing the computational results with the laboratory ones for Brazil’s traffic situation. In addition, a compression test was performed on the piezoelectric material. So, the objective of this paper is to investigate the use of piezoelectricity as a source of renewable energy applied to asphalt pavements based on a numerical-experimental framework.

2. Materials and Methods

This paper is divided into three parts: (i) Multiphysics simulation; (ii) testing procedure; and (iii) the estimation of power with the application of the prototype considering traffic simulation.

2.1. First Stage: Computer Simulations

Computer simulations were performed with the piezoelectric cells arranged in a prototype and using a Multiphysics analysis software, COMSOL Multiphysics. Four arrangements were evaluated with the piezoelectric cells placed between copper boards and a specimen of asphalt mixture. The simulation then subjected the prototype to the application of different loads, frequencies, and resistances, allowing the voltage and the power to be determined. The results are discussed in Section 3.1.

2.1.1. Prototype Components

Three materials were used for the actual prototype: (i) the specimen of standard asphalt mixture, (ii) copper boards, and (iii) piezoelectric cells (Figure 1). The dimensions were 100 mm × 100 mm for the squared copper boards, 100 mm in diameter and 50 mm in height for the cylindrical specimen, and 8.56 mm in diameter and 6.20 mm in height for the cylindrical piezoelectric cells. The bottom specimen was not included in the analysis, as it does not interfere with the power generated.
The asphalt mixture evaluated contained 5% hydrated lime and had a resilient modulus € of 8082 MPa, density (δ) of 2240 kg/m³, and Poisson’s ratio (υ) of 0.35. The copper boards had an elastic modulus of 110 GPa, δ of 9310.83 kg/m3, υ of 0.35, and thermal conductivity of 400 W/m·K. These data refer to the default values provided by the software, except for the densities and elastic modulus of the mixture [37]. These variables directly influence the mechanical strength of the material, impacting the electrical output of the prototype. For less resistant asphalt mixtures, the electrical response also decreases. In addition, there is a greater interference of the piezoelectric effect between the cells, impacting the issue of spacing between the elements. For this analysis, a paving material with a modulus of resilience of 300 MPa was simulated. For example, for less resistant asphalt mixtures, more widely spaced piezoelectric cells produce higher electrical power than closer cell configurations. Whereas, for a more resistant asphalt mix, this difference is no longer as noticeable. The piezoelectric cells were composed of the PZT-5H material, a piezoelectric constant (d33) of 450 × 10−12 C/N, δ of 7816.63 kg/m³, and Curie temperature (CT) of 250 °C, according to the manufacturer. The PZT-5H was adopted based on a literature review that identified it as the most commonly used material which had the best dielectric responses.

2.1.2. Analyzed Variables

As reported in the literature [21,30], the position and the number of piezoelectric cells influence the amount of generated energy, although specific values have not been reported for these parameters. In this stage, simulations in Multiphysicsics analysis software were performed with the arrangements of four, eight, and sixteen piezoelectric cells, as well as an alternative arrangement with larger spacing for the prototype with four cells. Table 1 and Figure 2 show the coordinates of each piezoelectric cell, with the most widely spaced cells identified by +e.
The choice of the number of cells was based on the observation of problems of early fractures in the piezoelectric elements when they were subjected to extremely heavy loads. The totals of four, eight, and sixteen cells were chosen to verify the optimal result by combining generated power and the number of elements. This allowed verification of the system’s capability to withstand the dynamic loads to which the asphalt pavement is subjected. Numbers less than four were not tested due to the proportion of 6:1000 between the piezoelectric cell area and the copper board area. The stresses are not effectively distributed to the elements when using smaller cell quantities.
To verify the power (in mW), loads of 3.4 kN, 5.1 kN, 6.8 kN, 8.5 kN, and 10.2 kN were applied on the top of the asphalt surface layer, distributed over the whole area. When they were applied to the specimen inserted in the prototype and later distributed to the piezoelectric cells, those forces presented different stresses. Then, Table 2 was developed to identify the real stresses that are being applied. These stresses were calculated as a function of the applied load (3.4 kN to 10.2 kN) and the contact areas with the AC specimen (10 cm diameter) and the piezoelectric cells (8.56 mm diameter, the individual cell). The tire pressure on the pavement varies between 0.15 and 0.70 MPa [38,39]. Therefore, the selected forces encompass a wide range of stresses, allowing us to obtain the specific power from any value to which the pavement is subjected.
To simulate the speed of the vehicles traveling on the road, frequencies of 5 Hz, 10 Hz, and 20 Hz were adopted. These frequencies correspond to traffic speeds of 33 km/h, 60 km/h, and 115 km/h, according to Equation (2) [16], in which f is the frequency in Hz and v is the speed in km/h.
v = f + 1.2127 0.1867
Another important consideration concerns the resistance of the prototype. To obtain the maximum electric power, the internal resistance (RI) of the system must be equal to the external resistance (RE) [3,30]. The RI was obtained with Equation (3) and used as an input parameter in the simulations. In Equation (3), c is the internal capacitance (in F) and f is the frequency applied in the prototype (in Hz). The RI value is obtained in MΩ.
R I = 1 2 π c f
The internal capacitance of the prototype depends on the number of piezoelectric cells. Table 3 shows all the piezoelectric parameters adopted for the different combinations of cells. These are the optimal values of resistance for each situation of applied frequency and the number of cells that generated the maximum electric power obtained in the prototype, calculated from Equation (3).

2.1.3. Boundary Conditions

The analysis of the adopted frequencies and loads was performed to estimate the amount of electric power (milliwatts, mW) and the generated voltage (Volts). The mechanical stress in the cells was analyzed and the internal resistance of the prototype was checked. The procedure performed for the software simulations followed step-by-step instructions [40] and is shown in Table 4. The Multiphysics models consider a range of possible conditions of operation and physical effects. It is possible to use the models to understand, design, and optimize prototypes and devices for real operation conditions.
The geometries of the elements were defined by the sequences of operations, in which each one of them is able to receive input parameters, facilitating parametric editions and studies. The connection in the model is associative (physical and geometric properties), where any change in the geometry automatically causes changes in the others. The adopted algorithms create a mesh with the type of elements appropriate for the correspondence with the associated numerical methods, as seen in the discretization with finite elements.
The analysis procedure used a model assistance tool (Model Wizard) for the 3D space dimension. The physical interfaces were assembled with piezoelectric devices and with electrical circuits. The type of studies was stationary and performed within the frequency domain. The copper boards and the AC specimen used linear elastic behavior materials, while the cells used were with mechanical and piezoelectric properties.
The underside of the copper plate was fixed. The upper face of the specimen was chosen for the application of forces through the Boundary Load function. The whole face was selected, and the force was equally applied to every node of the corresponding mesh, like a distributed load.
In the electrostatic module definitions, the bottom side of the cells was defined as the ground wire and the top side as the limiting side for the floating potential. This consideration enables us to perform the simulation of two electrodes estimating the difference in the existing potential. A punctual probe was also defined to analyze the electric potential. A resistor was added to insert the resistances previously presented in Table 3.
The simulations followed the step-by-step presented in [40]. Of the initial conditions, mesh and geometry, it is worth noting that: The simulations present limitations due to the boundary conditions presented above, such as the fixation of the underside of the copper plate, adoption of a ground wire at the bottom of the cell, and the floating potential at the top. The non-union of the elements can also differentiate some values from the real ones. The software adopted the piezoelectric properties provided by the manufacturer of the cells used in the laboratory stage.
The system was subjected to the integration of order four, performed by the software. To obtain the voltage and the electric power, according to the frequency, Equations (4) and (5) were attributed to the prototype’s modeling. They were defined according to the circuits adopted as the resistor [40]. Equations (4) and (5) are the expressions of the initial conditions entered into the software to simulate the electrical elements (resistor and circuit) and the acceleration of the vehicles (a).
0.5 × r d ( c . R 1 _ i , c . R _ v )
a ( c . R 1 _ v )
where rd (realdot) returns to a single result, c (cir) is the generated circuit, R1 is the resistor, i is current, v is the voltage, and a (abs) is the absolute value.

2.2. Second Stage: Laboratory Tests

The second stage consisted of a laboratory test with the prototype designed in the first stage, aiming to compare the results obtained for voltage and electric power. Dynamic Modulus (DM) was carried out in a Universal Test Machine (UTM-25) with a standard asphalt concrete (AC) type, two copper boards, and PZT-5H piezoelectric cells type, due to the excellent electric response described in former studies. A compression test was performed with the piezoelectric cell to better understand the maximum stress that a cell can withstand. The results are discussed in Section 3.2.

2.2.1. Materials

The prototype was composed of a specimen of asphalt concrete (AC) divided into two parts. Two square copper boards measuring 100 × 100 mm and 6 mm thick were placed between the specimens. The piezoelectric cells, measuring 6.20 mm high and 8.56 mm in diameter, were placed between the boards (Figure 3).
To hold the piezoelectric cells in the positions simulated in the software, a polystyrene board with the same configurations was inserted between the copper boards. To reduce the irregularities of the copper board surface, a copper paste was used on the upper and bottom surfaces of the piezoelectric cells. The copper boards had a 559.80 g mass for the upper face and 557.50 g for the bottom face, resulting in a density of 9330.00 kg/m³ and 9291.67 kg/m³, respectively. The copper boards were connected to a digital multimeter to read the tension and the electric current in each of the situations of load application, frequency, and the number of cells. Two multimeters were used: (i) LWJ-108; and (ii) ET-1000.
Since the study did not evaluate the mixture, a standard AC was used for all tests, aiming only to verify the load effect, frequency, position, and the number of cells. A specimen was used for each test round of the same configuration (four in total). Table 5 shows the dimensions for each upper and bottom specimen.
The asphalt mixture was composed of 3/4” and 3/8” gravel (28%), stone dust (50%), and lime (2%) as aggregates, within the C gradation curve established by the National Department of Transport Infrastructure in Brazil (DNIT). Due to the presence of lime, the elastic modulus of the mixture (E) was estimated at 8082 MPa. The compaction temperature was 136 °C, in which the Asphalt Cement was heated to 148 °C and the aggregates to 158 °C. Table 6 presents the values of the air void volume of the specimens [37]. The Flow Number (FN) of the mixture was 754 cycles. The differences in air void volumes did not influence the electric power obtained.
The piezoelectric cells were acquired commercially. The choice of the cell model was based on the observation that the thickness was the geometric property that most influenced the electric power of the element [33]. Therefore, several configurations of cells were researched and the thickest one available was adopted in this study, measuring 6.20 mm high and 8.56 mm in diameter. The material used was the PZT-5H, which has the highest dielectric capacity. The piezoelectric cells are presented in Table 7.

2.2.2. Test Procedure

The test was performed in a universal testing machine (UTM) with a load capacity of 25 kN. A haversine compressive cyclic load was applied to the prototype. The stresses shown in Table 2 were adopted in the simulation stage. A force of 1.7 ± 0.1 kN was applied to generate a contact force, allowing the achievement of the power and electric tension from any value ranging from 3.40 to 10.20 kN. Such irregularity causes a non-homogeneous stress distribution in the cells, leading them to fracture. Considering the premature fracture of the elements, frequencies of 5 Hz, 10 Hz, and 20 Hz were adopted, corresponding to specific traffic speeds, as previously mentioned. Thus, the prototype was subjected to 300, 600, and 1200 cycles.
Based on the considerations above, the test was performed in 120 stages, in which the number of cycles for each pair of stresses with frequency in the four scenarios analyzed were repeated, one to monitor the voltage (in millivolts) and another to monitor the electric current (in milliamperes mA). The electric power was calculated based on Equation (6), in which P is the electric power (mW), V is the electric voltage (mV) and I is the current (mA).
P = VI
To monitor the voltage and the current, videos of each stage were recorded and analyzed, provided the instruments used were not fitted with data output capabilities. The values presented in the recorded videos were crossed with those of the loads applied in the DM tests. Although in the UTM a wide range of forces and voltages were applied, only the largest values were considered.
In the compression test, which was also performed, the piezoelectric cell was inserted between the machine plates and compressed at a displacement rate of 0.1 mm/min until reaching the fracture load. The test was stopped when either the load cell limit of 5 kN was reached or until a fracture was observed. As a result, a load-displacement curve of the material was generated and the maximum stress to which the piezoelectric cell was subjected was recorded.

2.2.3. Limitations of Laboratory Tests

The main limitations of the testing protocols were the lack of an oscilloscope and a standard resistance box. In the literature, the need to equalize the internal resistance of the prototype to the external resistance is highlighted, and this is possible through the use of a standard resistance box. In the case where the external resistance is higher or lower than the internal one, the electric power decreases considerably. Thus, the primary limitation of the laboratory test was the impossibility to check or equalize those resistances to guarantee that the laboratory test results were equal to or as close as possible to the Multiphysics simulations. Due to this limitation, the resistances were calculated for each pair of force and frequency applied by using Equation (7), in which R is the resistance (Ω), V is the electric voltage (V) and P is the electric power (W).
R = V 2 P
Another limitation was the voltage and current measurement. This was developed in different stages, which could have led to changes in the applied forces and, therefore, in the collected voltage and current values. To normalize the values, force interpolations were employed in the two tests and the current values, where necessary. In addition to the likely non-uniform distribution, the copper plates have irregularities which can cause changes in the results.
In the compression test, the limitation was related to the load cell, whose limit was 5 kN. Thus, it was impossible to determine the fracture stress of the element, since the machine reached the limit load before the piezoelectric cell cracked.

2.3. Third Stage: Simulation of Energy Generation with Traffic Data

The third part of the research consisted of the simulation of the prototype on a road section with real traffic data. The pavement of the Brazilian BR-222 federal highway, in the state of Ceará, Brazil, is subjected to a high traffic volume and served as a data source for the simulation. The surface layer is a 5 cm thick Asphalt Concrete (AC) and a 6 cm thick binder course [41]. Thus, the prototype would be installed between the wearing and the binder course. The Average Daily Traffic (ADT) was collected from km 33, located in the city of Caucaia (Latitude: −3.703694444, Longitude: −38.85297222). In this section, the highway is a single roadway. The data presented in Table 8 were obtained in 2018 and show the daily traffic distribution.
For the simulation, only passenger cars and two-axle commercial vehicles were considered, adopting loads of 1.98 kN and 24.50 kN a wheel for each, respectively [38,39]. The maximum speed limit enforced on the road is 60 km/h. For this analysis, it was considered that all vehicles were traveling at the speed limit.
The average value of vehicles equated to a total of 296 passenger vehicles per hour and 47 vehicles in the group of two-axle buses and trucks per hour. Thus, the load values were applied in the equations obtained in the previous stage for the frequency of 10 Hz, corresponding to 60 km/h approximately, to obtain the electric power and voltage. The traffic impact calculations were performed considering constant power during the time. Finally, the simulations in the COMSOL software were performed with the adopted loads to verify the level of correlation of the extrapolation of data with the values obtained directly from the software.
In this stage, an important premise is that the application would occur without interference, assuming the copper boards are completely flat, and the pavement has no considerable longitudinal unevenness, although the average IRI for point km 22 of the BR-222 highway (the place closest to the traffic analyzed with results that showed irregularities) nears 1.95 m/km [42], which is within a lower to moderate roughness threshold [43]. The results are discussed in Section 3.3.

3. Results and Discussions

3.1. Analysis of Multiphysics Simulations

The first stage was performed by applying forces of 3.4 kN, 5.1 kN, 6.8 kN, 8.5 kN, and 10.2 kN according to the number of cells and the frequency values of 5 Hz, 10 Hz, and 20 Hz. The results obtained were plotted in Figure 4. The power values were obtained for the internal resistance corresponding to each frequency and cell combination, as in Table 3, and previously presented in 
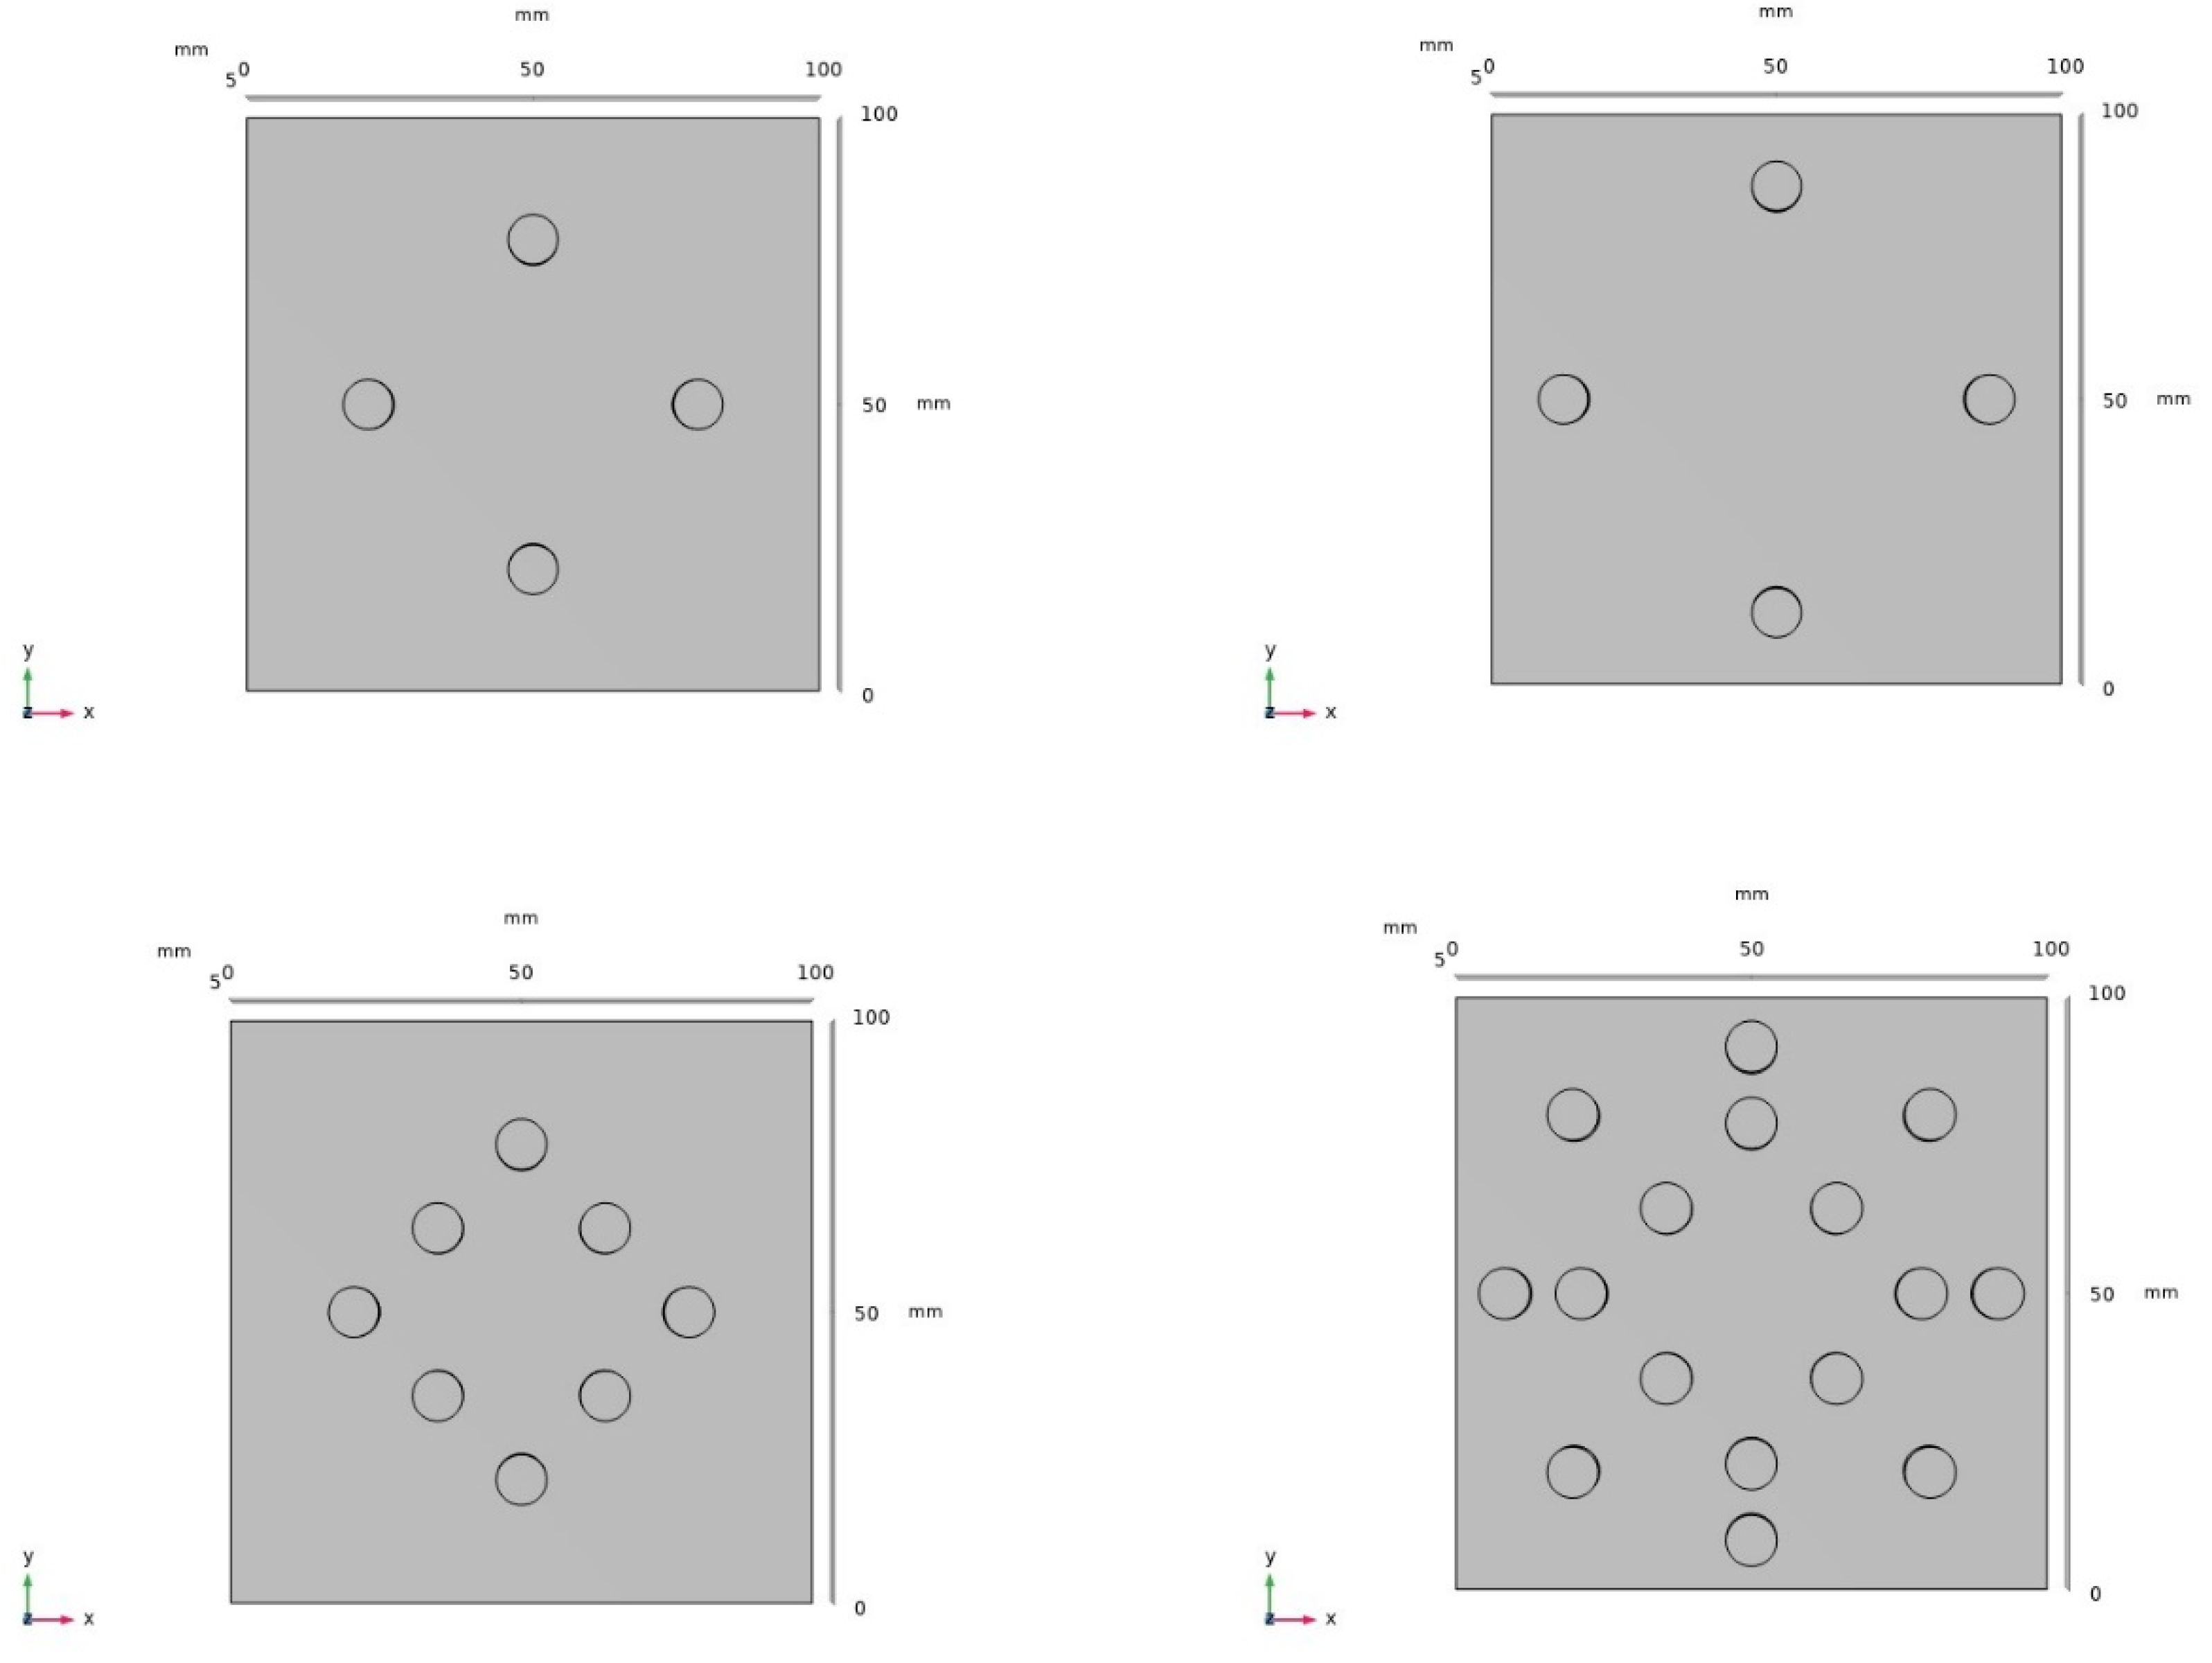
Section 2.1.2. The resistances adopted were calculated in such a way that it would be possible to return to the maximum power values for each frequency combination and number of cells. The group of the four most widely spaced cells was represented by “+e”.
In view of the values presented in Figure 4, it was observed that the power generated decreases with the increase in the number of cells applied. This occurs as the applied force distributes itself equally over a wider area of piezoelectric cells. However, this decrease in electric power does not occur proportionally. When compared to the four-cell arrangement, the combinations of eight and sixteen cells produced a reduction of the electric potential by an average of 49% and 74%, respectively.
Another important observation is related to the spacing of the piezoelectric cells. Two positioning configurations were tested for the group of four piezoelectrics and the cell arrangement with wider spaces between cells generated slightly higher power outputs. This is an average increase of 0.39% over the configuration with cells closer together. This increase in power happens because the piezoelectric effect of a cell interferes less with the behavior of the others around it.
The interference between the piezoelectric effect of the cells occurs due to the magnetic field between them. When they move closer together, the effect of one interferes with the effect of the other. However, it was observed that the stiffness of the asphalt mixture contributes to decreasing the difference in electrical output when the spacing is varied.
About the power values obtained with the optimized results of the resistance, the highest value obtained was 10.2 kN and 20 Hz with four more widely spaced cells, resulting in 648.8 mW. Following the same trend, the lowest value obtained was 3.4 kN and 5 Hz with sixteen cells producing 4.7 mW. Thus, it was found that the power increases directly with the increase of load and frequency. However, it falls with the increase in the number of cells.
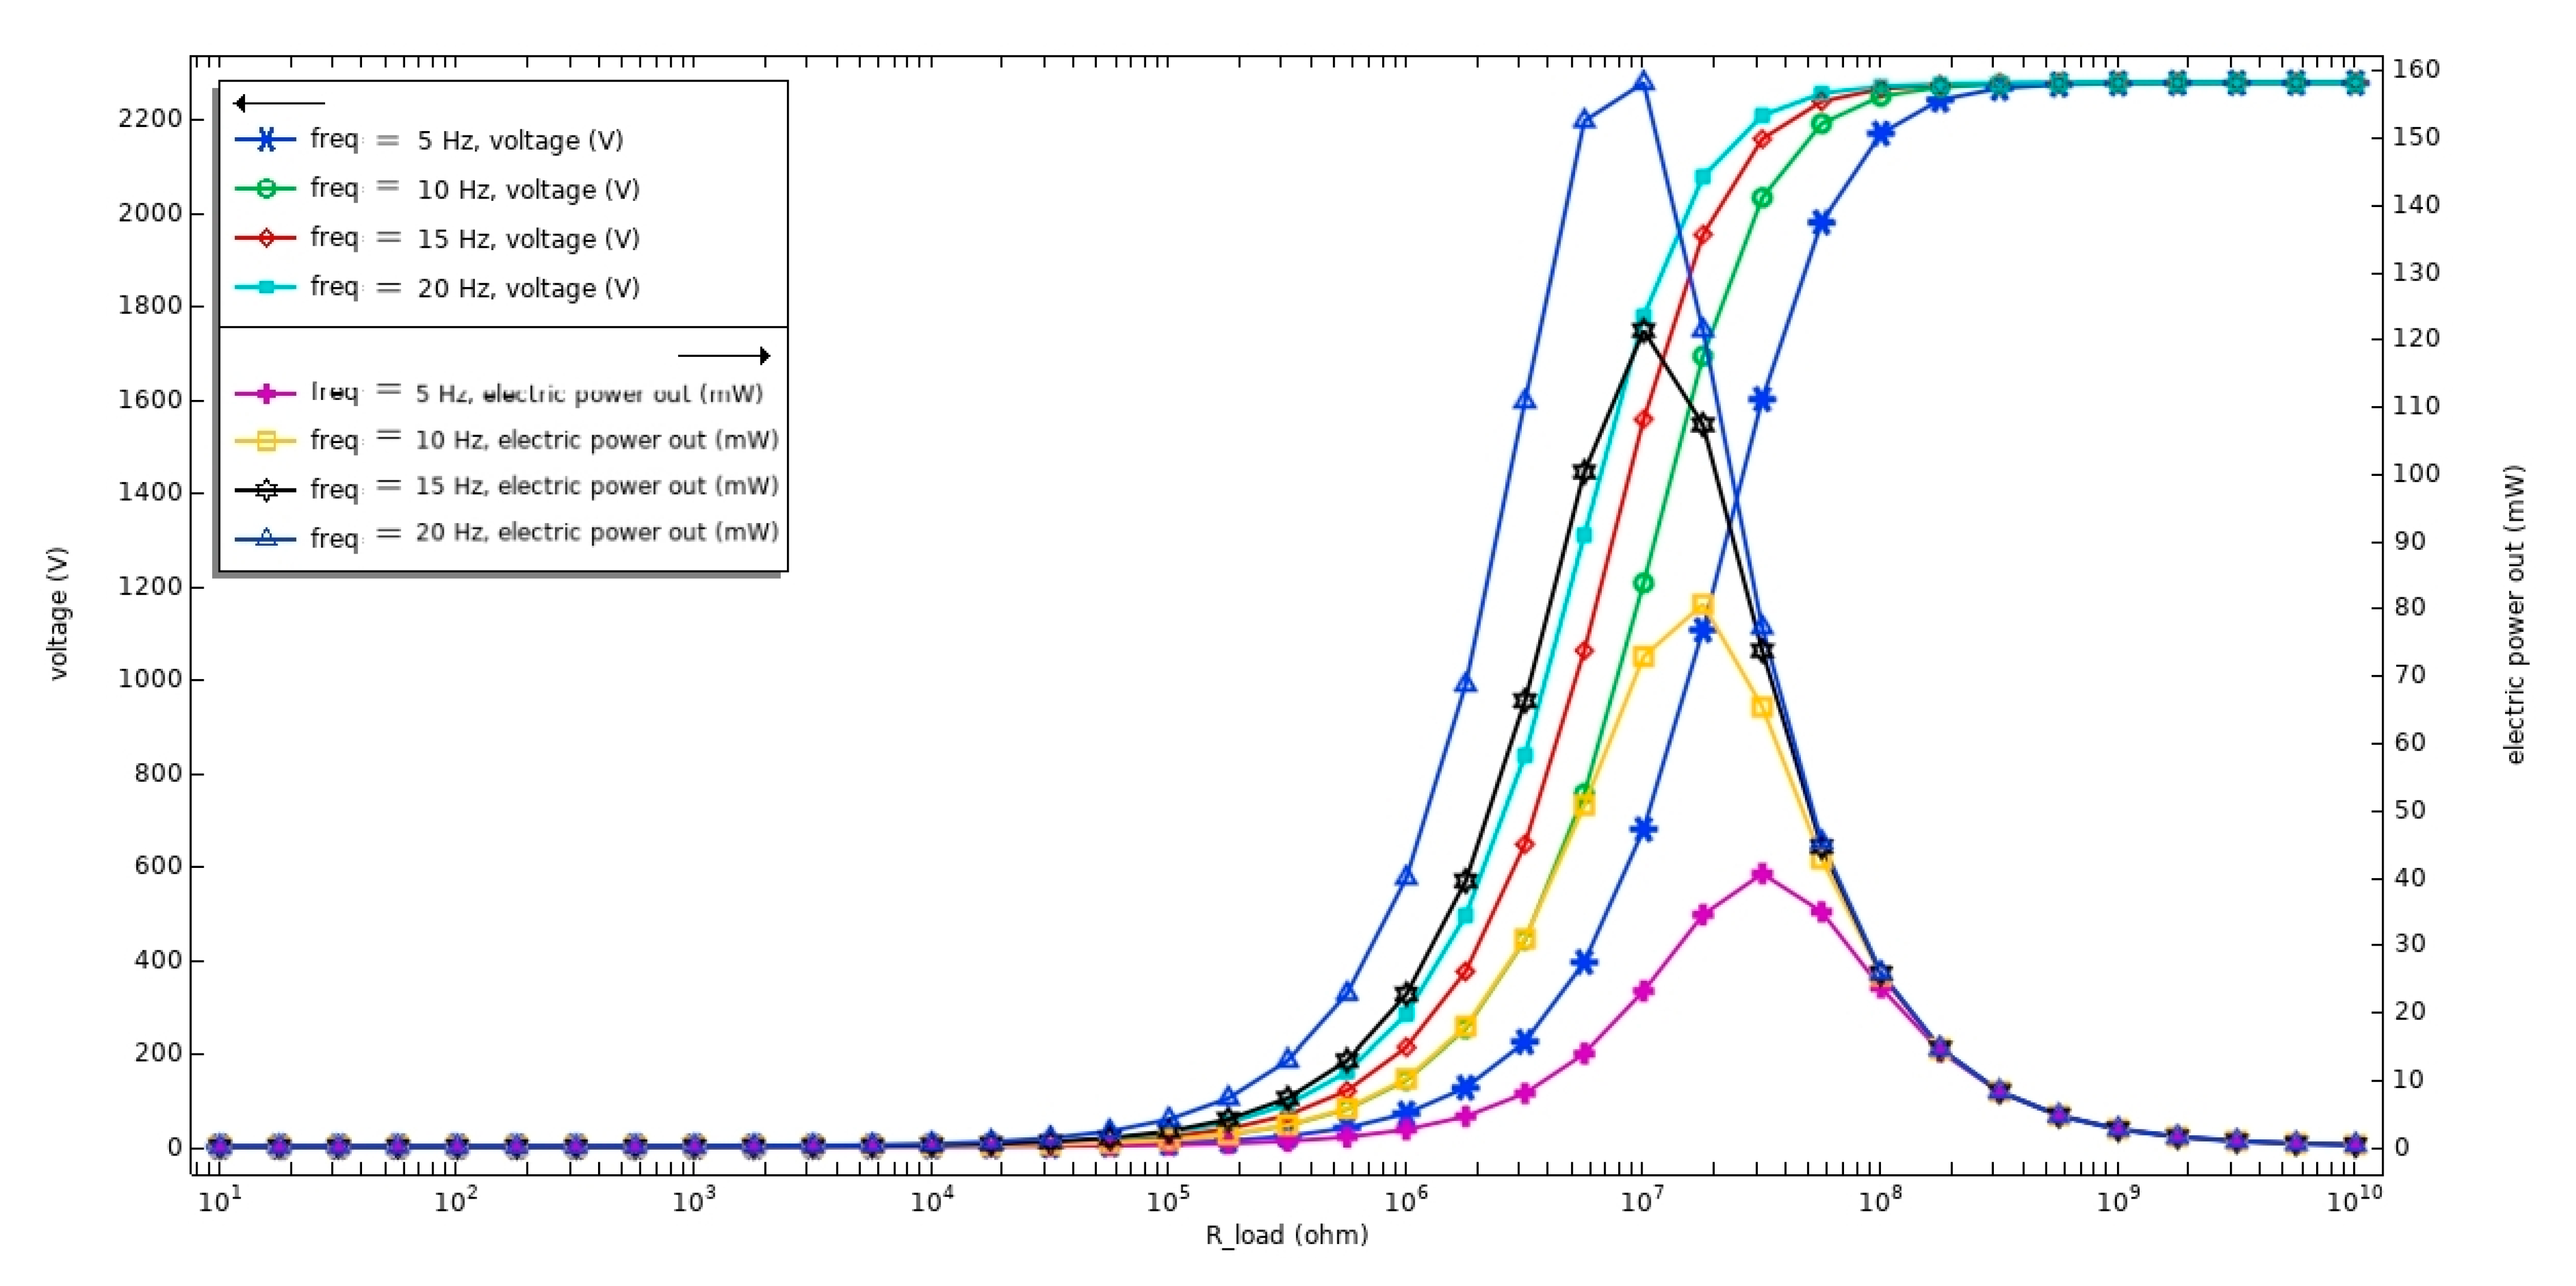
Furthermore, the power and the maximum electric voltage obtained from the variation of resistance in the x-axis were simulated, fixing the frequency and the load. Figure 5 shows this variation for the force of 10.2 kN with four more widely spaced cells. The same behavior pattern is observed for the rest of the force and cell combinations.
The electric power demonstrated is dependent on variables such as the frequency (or speed of the vehicle) of application, applied load, electric resistance, and the number of cells that relate to each other. The relationship of dependence on more than one variable precludes a simpler analysis. However, it is possible to assert, based on the Multiphysics analysis provided by the software, that the higher the load and frequency variables, the better the results for the electric power obtained.
On the other hand, when the number of cells is increased, the electric generation of the prototype is reduced, since the stress applied on the top of the specimen is equally distributed over a larger area, meaning each piezoelectric cell receives a smaller load. The results are consistent with what has been observed by some studies in the area [4,13,17,18,28,29,30]. The difference was noted concerning cell spacing responses. In the reported studies, different stiffnesses of the asphalt mixtures were not studied. In this analysis, the replacement of the initially used asphalt mix with another paving material with a 300 MPa resilient modulus was simulated. Thus, it was realized that a greater spacing between the piezoelectric cells would not cause a percentage difference in the electrical response for stiffer materials.
Another factor that contributes to the decrease of electric power is the electric resistance of the prototype. When the number of cells is increased, the electric resistance of the prototype is decreased, caused by the inverse relationship with the capacitance, demonstrated by Equation (3).
Based on the power value behavior with the variations aforementioned, 12 equations were derived to obtain the electric power from the application of different loads, fixing the other variables. Table 9 shows the equations created (14 to 25), in which L is the load applied (in kN) and y is the electric power generated. The results of R² were equal to 1.0 due to this being the optimal situation for obtaining the electrical output, represented by the values of external resistance equal to the internal resistance. These resistances were calculated as presented previously in Table 3.
y = 1.5575 × L1.9944
y = 3.0984 × L1.9972
y = 6.1976 × L1.9971
y = 1.552 × L1.9979
y = 3.1061 × L1.9977
y = 6.1721 × L2.0023
y = 0.7787 × L2.0007
y = 1.5717 × L1.9964
y = 3.1462 × L1.996
y = 0.4118 × L1.9885
y = 0.8066 × L1.998
y = 1.6114 × L1.9986
The equations presented in Table 8 have a limitation. They are valid only for the specified quantities of cells and internal resistances. However, the authors recognize the need to formulate equations that cover all the variables involved (loads, frequencies, resistances, number of cells, and spacing). This may be possible by deriving constitutive models and introducing artificial intelligence methods to verify the influence of each variable on the output.
It is possible to analyze the power results based on the stresses applied. Once again, the forces were limited to 10.2 kN. However, when applied to the area of the AC specimen, stresses that vary from 0.43 MPa to 1.30 MPa were obtained. The tire pressure varies between 0.15 MPa to 0.70 MPa on the pavement [38,39]. When these same forces are distributed across the area of the piezoelectric cells, stresses varied from 3.96 MPa to 44.31 MPa-Table 2. Figure 6 displays the electric responses according to the stresses exerted over the entire area of the cells and of the specimen, respectively.
The results allow us to record the electric power produced by the system from the application of all stresses on the pavement. These values ranged from 4.7 mW for 5 Hz and 0.43 MPa to 648.8 mW for 20 Hz and 1.30 MPa, with sixteen and four+e cells, respectively. Thus, the mechanical stresses to which the prototype was subjected comprise a percentage of the reference range and superior values, mainly when the whole area of the cells is considered. That analysis allows us to measure the effect of overloaded vehicles traveling on the road and to verify the mechanical resistance of the piezoelectric element. Higher stress values, such as 1.30 MPa in the specimen, would still be supported by the elements, which did not fracture.

3.2. Laboratory Tests

The laboratory tests were performed according to the material and methods section and with the limitations discussed. The results were presented according to the changes in variables, such as load, frequency, number of cells, and spacing. Figure 7 shows the power numbers according to the load applied for each cell situation with frequencies of 5 Hz, 10 Hz, and 20 Hz, respectively.
According to Figure 7, it is possible to observe the variation in power, given the different combinations of piezoelectric elements. Considering the limitations coming from not controlling the electric resistance and the irregularities of the copper board, the prototype with eight cells yielded the highest electric power generation. The combination of four widely spaced cells (four cells+e) was the second-ranking combination in terms of electric response, except for the last three force levels at 20 Hz, at which point this combination was slightly outperformed by the standard four-cell and sixteen-cell combination.
As in the simulation stage, the equations were created to obtain the electric power according to the load variation. The electrical resistance and frequency values were fixed for the prototype configuration situations. Table 10 shows the equations obtained from the laboratory tests, in which L is the load applied (in kN) and y is the electric power generated. The resistance was obtained through the values of electric current and voltage captured by the multimeter. The constant of Equation (28) is high due to the high numbers of power obtained for this situation, which is the closest to the results observed in the Multiphysics simulations stage.
y = 0.0031 × L2.6276
y = 0.0098 × L2.2039
y = 0.0414 × L3.0881
y = 0.0318 × L1.75
y = 0.0147 × L2.4089
y = 0.2481 × L2.0983
y = 0.1498 × L1.6887
y = 0.231 × L1.6465
y = 23.551 × L0.9727
y = 0.007 × L2.3957
y = 0.0042 × L2.9077
y = 0.1311 × L2.6821
As for the setup with four cells, the highest value for electric power is obtained for the situation of applying 10.2 kN and 20 Hz, returning to 47.53 mW, in which each piezoelectric cell is responsible for generating up to 11.88 mW. The electric resistances vary from 0.39 kΩ to 0.77 kΩ, resulting in an average of 0.49 kΩ.
Along with 4 more widely spaced cells the highest electric power obtained was 33.47 mW for the situation of 20 Hz and 10.2 kN, in which each piezoelectric cell generates 8.37 mW. The results for these electric resistances are almost double those found in the four-cell layout. The values vary from 0.65 kΩ to 1.07 kΩ, resulting in an average of 0.91 kΩ, an increase of 46% when compared to the four cells.
For each situation of eight cells, it is interesting to highlight the fact that the electric power was six times higher on average than the four-cell arrangement and four times more than the widely spaced cells (for 20 Hz and 10.20 kN: four cells returned 47.53 mW, four+e cells, 33.47 mW, and eight cells, 226.95 mW). This behavior was not expected, considering that there is an overlap of the piezoelectric effect and the dissipation of mechanical power to a larger area due to the sum of the eight elements. However, what justifies these higher values is the irregularity of the copper board. For the four piezoelectric cell layout, there is a lower probability that all the cells will be directly in contact with the copper board. When eight cells are used, the stability may be greater, meaning more elements are affected piezoelectrically. Nonetheless, the existence of more cells decreases the optimal electric resistance of the prototype. The external resistance equaled 0.75 kΩ, due to the impossibility of controlling it.
Another element that contributes to the obtaining of higher values in the laboratory stage for the combination of eight cells is the low rate of fracturing of the piezoelectric elements. During the 30 tests performed (15 for voltage and 15 for current), only 2 elements broke. For the arrangement with four wider spaced elements, the number of broken cells increased to eight, requiring substitution between the change of load levels and frequency applied. Thus, the best electric power was obtained with this layout, which generated 226.95 mW, each element producing 28.37 mW. When this is compared to the power values of the eight- and four-cell layouts, there was an increase of 377.5% when applying 20 Hz and 10.2 kN.
As expected, with sixteen cells, the electric response was lower than the combination of eight cells, representing a reduction of 69.5% in the power, applying 20 Hz, and 10.2 kN. This result is directly connected to the external resistance of the prototype; because it is not directly equal to the internal one, the layout generates different voltages, current, and power about the expected proportion since more elements are included. Moreover, since eight more piezoelectric cells were inserted, a reduction of approximately 50% was expected. Thus, the electric resistance varied between 0.81 kΩ and 1.79 kΩ, resulting in an average of 1.32 kΩ, the highest of all the combinations of tested cells.
To test the piezoelectric cell resistance, a load cell of 5.0 kN was applied with 0.1 mm of displacement steps, until reaching the stop limit of the software (approximately 4.9 kN) or until the element breakage. Thus, the equipment controller reached the stop limit, and the piezoelectric cell did not fail, reaching a stress of 46.23 MPa, superior to all of those simulated in the laboratory in the stage of electric response. This result is important to demonstrate that the piezoelectric cell is resistant and that the problem that occurred in the laboratory in the UTM-25 was due to the irregularities of the boards, distributing uneven stresses to the elements and causing them to break.
With the second step (laboratory tests), it was possible to relate the irregularity of the copper plates to the longitudinal irregularity of the pavement. At sites where there will be no direct contact of the vehicle wheel with the structure, a higher strain is exerted, causing the cells to fracture. It can also cause some cells to not operate in the system, decreasing the amount of energy generated. Thus, it is suggested that the prototype be applied to roads with low longitudinal irregularity (IRI).
From the laboratory tests, it was found that the uneven distribution of mechanical stress can result in early fracture of the piezoelectric elements, even though they have high compressive strength (greater than 46 MPa for the tested cell). This distribution also caused higher power values than those simulated in the software in the situation of eight cells and 20 Hz, even with low resistance and without control. This occurs due to the non-direct contact of the cells with the plate, reducing the number of them transforming the mechanical voltage into electrical voltage. This analysis was demonstrated by the Multiphysics simulations that fewer piezoelectric cells increase the electrical power values.
Despite the limitations caused by unavailable equipment, such as the oscilloscope and a resistance box and flat copper boards, the laboratory results followed the same behavior pattern when compared to the load and frequency applied. The greatest difference is related to the electric power obtained from the number of cells. It was expected that the increase in the number of piezoelectric elements would reduce the electric power and voltage.
However, in the laboratory stage, the best results were observed in the application of eight piezoelectric cells, resulting in a power of 226.95 mW for 20 Hz and with 10.2 kN of load applied. When it was possible to observe the maximum electric power obtained for the same combination in the stage of the computer simulation, we expected to obtain 324.40 mW. The reduction, in this case, was 30%, which is considered low when the difference between the resistances is analyzed, which is 0.81 kΩ in the test phase in UTM-25, and 3.5615 MΩ, calculated by using Equation (3) with optimal resistance. This resistance reduction is equivalent to 99.98%.
Another important observation is related to the increase of power with the variation of the space between the piezoelectric cells. For the computer simulation stage, a larger space between the piezoelectric elements represented an average increase of 0.39% in electric power. However, in the laboratory stage, this average increase was 30%, even after considering that the last three applications of force for the frequency of 20 Hz resulted in greater power for the layout with four cells.
In the Multiphysics simulations, the combination of more widely spaced cells resulted in the highest levels of harvested energy, reaching a response of 648.80 mW for 20 Hz and 10.2 kN. When the same application is compared to the laboratory test, the value obtained was 33.47 mW, which is a reduction of 94.84%. Again, it is worth noting that this difference is directly related to the electric resistance, which, for the computer simulation, had an optimum of 7.1230 MΩ, and in the laboratory, only 0.99 kΩ was obtained, which is a reduction of 99.99%.
While varying the frequency of 5 Hz to 10 Hz in the computer simulation stage, there was an average increase of 72%, 167%, and 249% in the electric power for the three ranges of resistance simulated in each frequency and combination of cells from largest to smallest, respectively. When the same interval was analyzed in the laboratory stage, the increase was 44% on average. This percentage rose above 72% only with the application of four cells and eight cells, representing 89.20% and 75.80%, respectively.
By performing the same analysis of the variation from 5 Hz to 20 Hz in the simulation stage, an average increase of 110%, 359%, and 832% occurred for the same ranges of resistance. In the laboratory, this increase was an average of 3450.00%, mainly due to the differentiation of the curve of 20 Hz about the other.
As far as the frequency variation is concerned, ranging from 10 Hz to 20 Hz resulted in an increase of 22%, 72%, and 167% in the harvested energy for the same resistances in descending order. The results obtained in the UTM-25 demonstrated an average increase of 2256.00% in the power value for the duplication of the frequency adopted.
It is therefore possible to observe that for the four-cell and four widely spaced cell arrangements, the reduction was around 97%. It was noticeable that the decrease was less for the frequency of 20 Hz. In the layout with sixteen cells, the percentage difference also decreases with the increase in force applied. At the other frequencies, this behavior can also be observed. However, it does not occur proportionally, as there is some inference. It was also possible to observe that the curves presented a similar behavior, mainly in the 20 Hz curve, which had an exponential trend. As for the combination of eight cells, the results showed an inverse behavior. The percentage difference increased with the growth of the force applied. However, results were lower when compared to the other three situations.
As for the 20 Hz frequency, the lowest difference was obtained with the application of 8.5 kN, resulting in a reduction of 15.86%. Thus, positive results were obtained for loads of 3.4 kN, 5.1 kN, and 6.8 kN, which shows that power values were being obtained above the optimal ones found by the software. This can occur because even if the same load is applied to the specimen, this force might be unevenly distributed to the piezoelectric cells, resulting in higher stresses and, thus, increasing the voltage and the electric power as a consequence.
It is worth noting that, despite the high percentage differences, the power and electric voltage values follow the same behavior as those obtained from the computer simulation, which allows us to compare them, even though they present different electric resistances. This problem would be solved with the use of a resistance box to equalize the internal and external resistances, the assistance of an oscilloscope to measure the voltage, and flat copper boards for even contact with the piezoelectric cell.
The results demonstrate that the electric piezoelectric prototype will respond effectively and efficiently to situations where the road speed is as high as possible, while considering issues related to road safety and for higher load applications such as trucks. Additionally, by controlling the electrical resistance, it becomes possible to obtain the optimum power values for any load application situation. In the supplementary material all the data obtained in the laboratory tests and the comparisons with the computer simulations were made available, from Tables S1–S6 and Figure S1.

3.3. Simulation of Energy Production

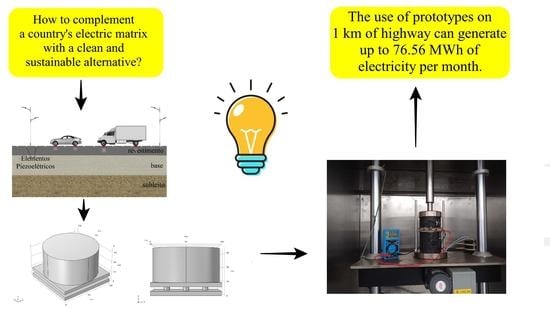
It was possible to determine the ideal combination to apply in the prototype in the field through a comparative analysis. At this stage, the real-life application scenario was decided according to the Multiphysics simulation. The pavement of the BR-222 highway had small or insignificant longitudinal irregularity and the electric resistance was controlled by resistance boxes inserted close to the edge of the road. The resistance adopted was the one that yielded the highest energy values in the 10 Hz simulation, given the enforced speed limit of 60 km/h.
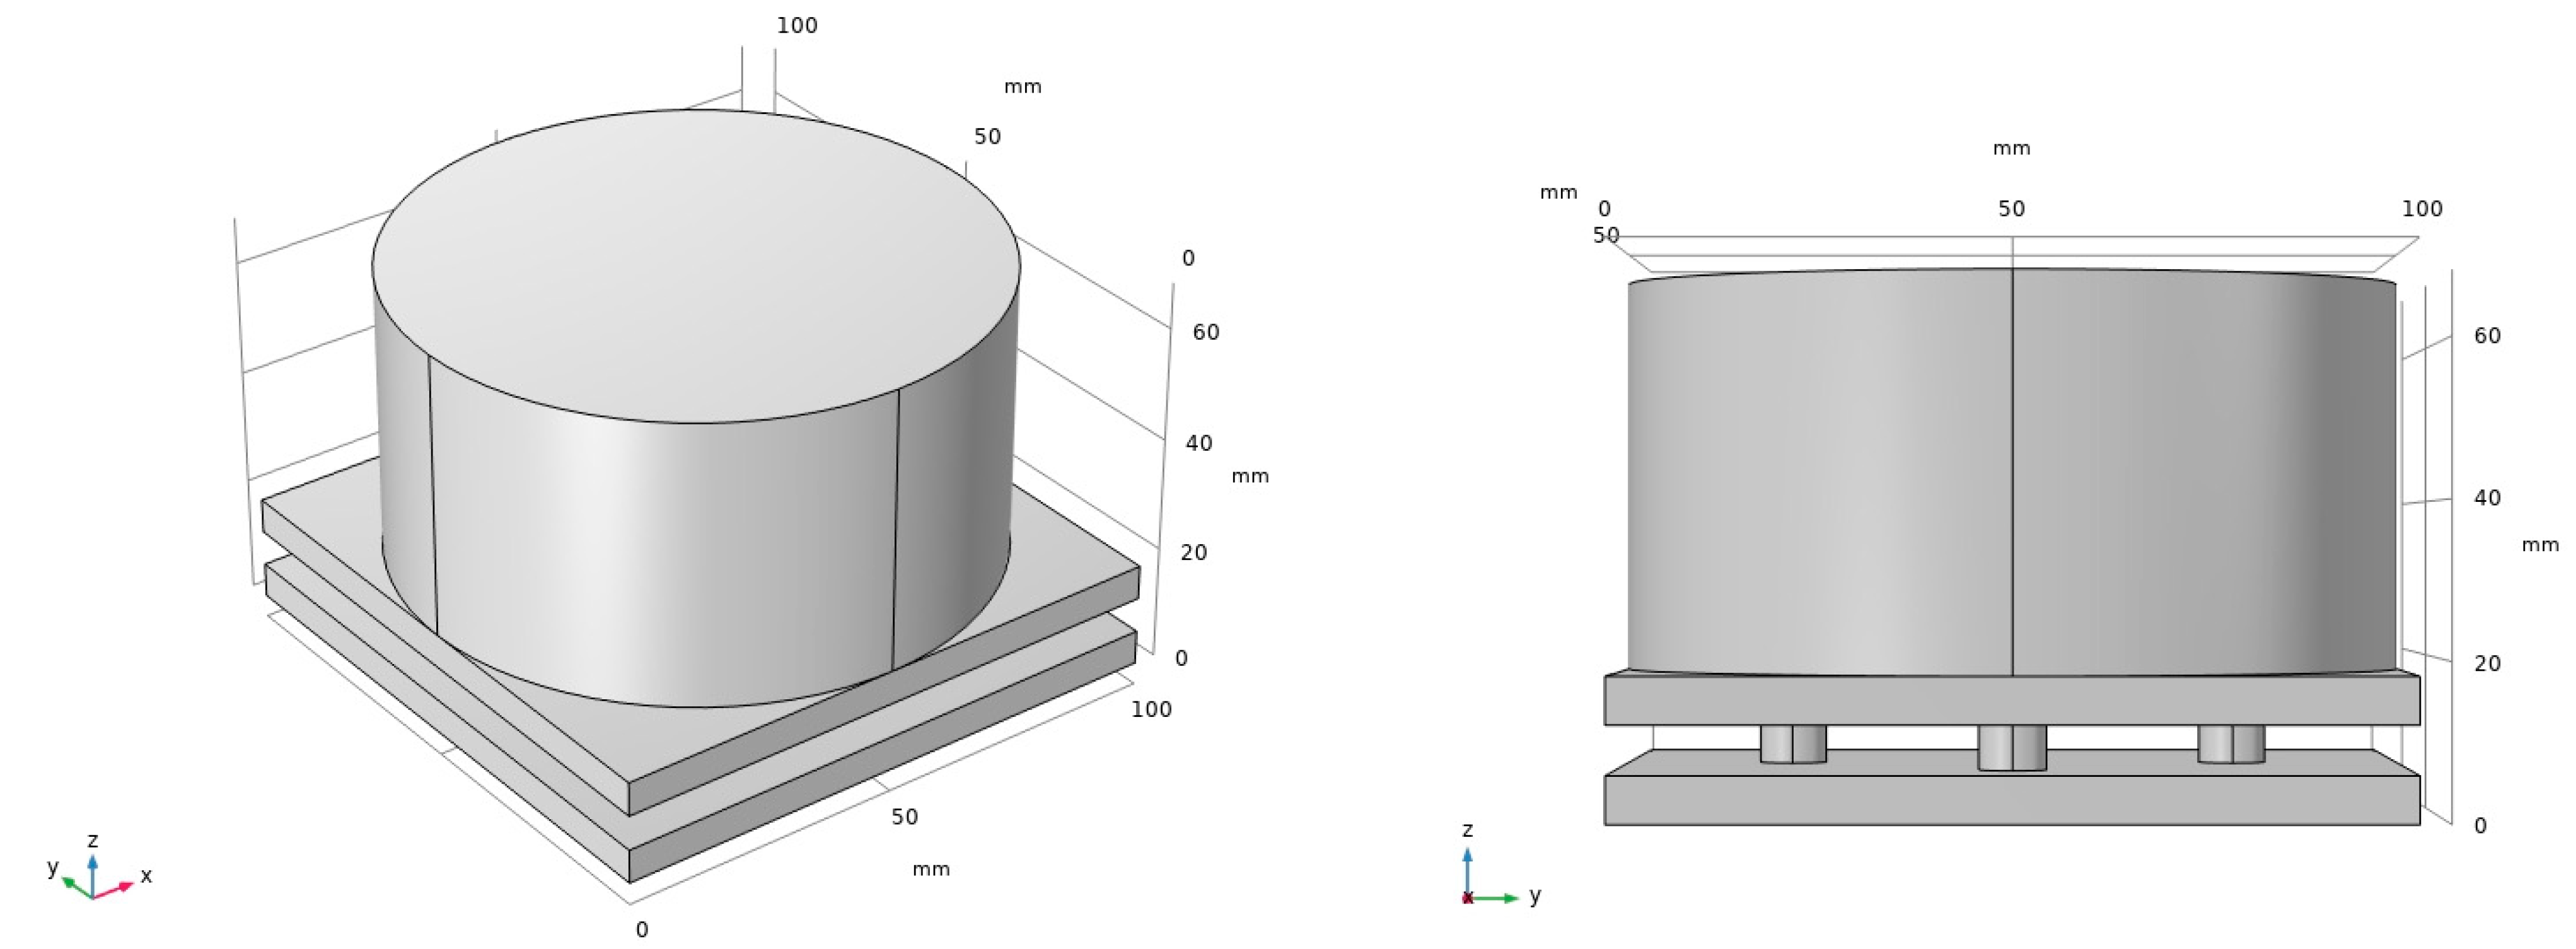
The prototypes were inserted 5 cm beneath the top coating layer, i.e., between it and the binder course. The copper boards did not have any irregularities, providing even contact with the piezoelectric cells.
Considering the dimensions (10 × 10 cm) of the prototype, it was installed in the average contact location of the tire/pavement, spaced evenly, 10 cm apart. In order to perform a maximum simulation, it was established that at least one wheel of all the vehicles would pass over each of the prototypes installed on the road. Thus, for a 1 km length of the road, 10,000 prototypes would be installed, 5000 on each side of the road.
As per Section 2.3, the traffic considered was 296 vehicles per hour of passenger cars with wheel load equal to 1.98 kN, and 47 vehicles per hour of two-axle bus and truck types with wheel loads equal to 24.50 kN. The total traffic was allocated 50% for each direction with all vehicles traveling at the enforced speed of 60 km/h.
Therefore, for this case, the four more widely spaced cell layout was used with the frequency of 10 Hz and resistance of 14.2460 MΩ. Thus, the electric power would be obtained by Equation (12) (y = 3.1061 × L1.9977), in which L is the load applied. The entire load of the car wheels was transmitted to the piezoelectric elements. For trucks and buses, which have a tire contact area of approximately 355 cm2, we performed a ratio of absorption of the energy generated by the prototype equal to 28.17% of the load applied, given the copper boards had an area of 100 cm2. Table 11 presents the power obtained for the simulated situation at this stage.
If 10,000 prototypes were applied on the road, in one year it would be possible to generate up to 918.76 MWh, which is 76.56 MWh per month. In 2021, the average monthly electric energy consumption in the Brazilian northeast region was 125.20 kWh per household [44], which means that the energy harvested from 1 km of the road would be able to supply up to 611 residences. The number of residences (NR) was calculated from the average consumption of electricity in the state of Ceará, Brazil. It was obtained from the application of the accumulated monthly energy values, derived from the vehicle traffic in Table 8 and the results of Table 11 in relation to the mentioned monthly electric consumption Equation (32).
NR     76.56 × 10 6 125.20 × 10 3 = 611   residences

4. Final Considerations

The main contribution of this research was the comparative analysis of laboratory tests and computer simulations related to the capture and generation of energy from traffic on road pavement. Laboratory tests were performed with piezoelectric elements inserted into a specimen of asphalt mixture with a high elastic modulus, from which electric energy was obtained from the application of loads, frequencies, and different combinations of cells. The results allowed us to conclude the electric resistance, load level, stresses, frequencies, number, and layout of piezoelectric cells affecting the electrical response of the prototype. From the simulation of the application of the prototype based on a real road section, it was possible to estimate the generation of 76.56 MWh of electric energy on a monthly basis for an ideal scenario. The laboratory tests also contributed to highlighting the exponential behavior of the electric power and the linear voltage, with the curve of 20 Hz always graphically more distant from the others. The combination of eight cells gave the best results for the electric power. However, its application would be impracticable under the same conditions used in the laboratory. In addition, the results demonstrated that the electric piezoelectric prototype would respond efficiently and effectively in situations where the speed on the road is as high as possible, taking into account road safety issues, and in applications of greater loads, such as from trucks. Considering the electric resistance control, it is possible to obtain the optimized values of power for any situation of load application. Finally, it was possible to observe that the piezoelectric energy alternative is energy efficient and could be a viable alternative to complement the electric grid of a particular region of a country.

Supplementary Materials

The following supporting information can be downloaded at: https://www.mdpi.com/article/10.3390/su14159584/s1, Figure S1: Electrical power comparisons between laboratory tests and simulations; Table S1: Electric power of laboratoy tests; Table S2: Percentage differences between laboratory and simulations; Table S3: 4 cells; Table S4: 4+e cells; Table S5: 8 cells; Table S6: 16 cells.

Author Contributions

B.C.M.: Conceptualization, Methodology, Software, Investigation, Formal analysis, Writing—Original Draft. B.A.N.: Investigation, Validation. S.H.A.B.: Conceptualization, Writing—Review & Editing, Supervision, Resources, Validation. F.T.S.A.: Writing—Review & Editing, Supervision. A.J.L.F.: Writing—Review & Editing, Supervision. J.B.S.: Writing—Review & Editing, Supervision, Validation. L.A.T.B.: Writing—Review & Editing, Supervision, Validation. All authors have read and agreed to the published version of the manuscript.

Funding

This research was funded by Conselho Nacional de Desenvolvimento Científico e Tecnológico (CNPq) e Coordenação de Aperfeiçoamento de Pessoal de Nível Superior-Brasil (CAPES), grant number Finance Code 001.

Institutional Review Board Statement

Not applicable.

Informed Consent Statement

Not applicable.

Data Availability Statement

All the data used to develop this paper are available in the body of the text.

Acknowledgments

Authors are thankful to Conselho Nacional de Desenvolvimento Científico e Tecnológico (CNPq) e Coordenação de Aperfeiçoamento de Pessoal de Nível Superior-Brasil (CAPES)-Finance Code 001, for the first author’s scholarship at Masters and Doctorate levels, respectively, and to the Telecommunications and Science and Materials Engineering Laboratory for providing the COMSOL software license.

Conflicts of Interest

The authors declare no conflict of interest.

References

  1. Rosa, A.V. Fundamentals of Renewable Energy Processes; Elsevier: Oxford, UK, 2005. [Google Scholar]
  2. Kokkinopoulos, A.; Vokas, G.; Papageorgas, P. Energy harvesting implementing embedded piezoelectric generators—The potential for the AttikiOdos traffic grid. Energy Procedia 2014, 50, 1070–1085. [Google Scholar] [CrossRef] [Green Version]
  3. Mota, B.C. Pavement as an Energy Generation Tool for the Sustainable Development of Smart Cities. Bachelor’s Thesis, Federal University of Ceará, Fortaleza, Brazil, 2019. [Google Scholar]
  4. Niasar, E.H.A.; Dahmardeh, M.; Googarchin, H.S. Roadway piezoelectric energy harvester design considering electrical and mechanical performances. J. Mech. Eng. Sci. 2019, 234, 32–48. [Google Scholar] [CrossRef]
  5. Ministério da Infraestrutura. Vehicle Fleet—2021; Ministério da Infraestrutura: Brasília, Brazil, 2021. Available online: https://www.gov.br/infraestrutura/pt-br/assuntos/transito/conteudo-denatran/frota-de-veiculos-2021 (accessed on 8 February 2022).
  6. Zhu, L.; Chen, R.; Liu, X. Theoretical analyses of the electronic breaker switching method for nonlinear energy harvesting interfaces. J. Intell. Mater. Syst. Struct. 2012, 23, 441–451. [Google Scholar] [CrossRef]
  7. Callister, W.D. Materials Science and Engineering: An Introduction, 9th ed.; Soares, S.M.S., Ed.; LTC: Rio de Janeiro, Brazil, 2016. [Google Scholar]
  8. Heywang, W.; Thomann, H. Tailoring of Piezoelectric Ceramics. Ann. Rev. Mater. Sci. 1984, 14, 27–47. [Google Scholar] [CrossRef]
  9. Bhalla, S.; Moharana, S.; Talakokula, V.; Kaur, N. Piezoelectric Materials: Applications in SHM, Energy Harvesting & Biomechanics; Athena Academic: London, UK, 2017. [Google Scholar]
  10. Sodano, H.A.; Inman, D.J.; Park, G. Comparison of Piezoelectric Energy Harvesting Devices for Recharging Batteries. J. Intell. Mater. Syst. Struct. 2005, 16, 799–807. [Google Scholar] [CrossRef]
  11. Baldwin, J.D.; Roswurm, S.; Nolan, J.; Holliday, S. Energy harvesting on highway bridges. Plan. Res. Div. 2011, 2224, 1–26. [Google Scholar]
  12. Cafiso, S.; Cuomo, M.; Graziano, A.; Vecchio, C. Experimental Analysis for Piezoelectric Transducers Applications into Roads Pavements. Adv. Mater. Res. 2013, 684, 253–257. [Google Scholar] [CrossRef]
  13. Sun, C.; Wang, H.; Liu, J.; Shang, G. Finite Element Analysis of Vehicle Load Effect on Harvesting Energy Properties of a Piezoelectric Unit. Energy Power Eng. 2015, 7, 500–508. [Google Scholar] [CrossRef] [Green Version]
  14. Zabihi, N.; Saafi, M. Recent Developments in the Energy Harvesting Systems from Road Infrastructures. Sustainability 2020, 12, 6738. [Google Scholar] [CrossRef]
  15. Moure, A.; Rodríguez, M.; Rueda, S.; Gonzalo, A.; Rubio-Marcos, F.; Cuadros, D.; Fernandez, J. Feasible integration in asphalt of piezoelectric cymbals for vibration energy harvesting. Energy Convers. Manag. 2016, 112, 246–253. [Google Scholar] [CrossRef]
  16. Song, Y.; Yang, C.H.; Hong, S.K.; Hwang, S.J.; Kim, J.H.; Choi, J.Y.; Ryu, S.K.; Sung, T.H. Road energy harvester designed as a macro-power source using the piezoelectric effect. Int. J. Hydrogen Energy 2016, 41, 12563–12568. [Google Scholar] [CrossRef]
  17. Papagiannakis, A.T.; Dessouky, S.; Montoya, A.; Roshani, H. Energy Harvesting from Roadways. Procedia Comput. Sci. 2016, 83, 758–765. [Google Scholar] [CrossRef] [Green Version]
  18. Papagiannakis, A.T.; Montoya, A.; Dessouky, S.; Helffrich, J. Development and Evaluation of Piezoelectric Prototypes for Roadway Energy Harvesting. J. Energy Eng. 2017, 143, 04017034. [Google Scholar] [CrossRef]
  19. Jasim, A.; Wang, H.; Yesner, G.; Safari, A.; Maher, A. Optimized design of layered bridge transducer for piezoelectric energy harvesting from roadway. Energy 2017, 141, 1133–1145. [Google Scholar] [CrossRef]
  20. Jasim, A.; Yesner, G.; Wang, H.; Safari, A.; Maher, A.; Basily, B. Laboratory testing and numerical simulation of piezoelectric energy harvester for roadway applications. Appl. Energy 2018, 224, 438–447. [Google Scholar] [CrossRef]
  21. Ding, G.; Zhao, X.; Sun, F.; Wang, J. Effect of subgrade on piezoelectric energy harvesting under traffic loads. Int. J. Pavement Eng. 2018, 19, 661–674. [Google Scholar] [CrossRef]
  22. Wang, C.; Wang, S.; Li, Q.J.; Wang, X.; Gao, Z.; Zhang, L. Fabrication and performance of a power generation device based on stacked piezoelectric energy-harvesting units for pavements. Energy Convers. Manag. 2018, 163, 196–207. [Google Scholar] [CrossRef]
  23. Wang, C.; Zhao, J.; Li, Q.; Li, Y. Optimization design and experimental investigation of piezoelectric energy harvesting devices for pavement. Appl. Energy 2018, 229, 18–30. [Google Scholar] [CrossRef]
  24. Heller, L.; Brito, L.; Johnston, M.; Nunez, W. Microgeneration of energy on pavements: A case study on a highway in service. Estradas 2019, 24, 20–25. [Google Scholar]
  25. Zhang, Y.; Zhang, H.; Lü, C.; Chen, Y.; Wang, J. Piezoelectric energy harvesting from roadway deformation under various traffic flow conditions. J. Intell. Mater. Syst. Struct. 2020, 31, 1751–1762. [Google Scholar] [CrossRef]
  26. Wang, S.; Wang, C.; Yu, G.; Gao, Z. Development and performance of a piezoelectric energy conversion structure applied in pavement. Energy Convers. Manag. 2020, 207, 112571. [Google Scholar] [CrossRef]
  27. Cao, Y.; Sha, A.; Liu, Z.; Li, J.; Jiang, W. Energy output of piezoelectric transducers and pavements under simulated traffic load. J. Clean. Prod. 2021, 279, 123508. [Google Scholar] [CrossRef]
  28. Roshani, H.; Dessouky, S.; Montoya, A.; Papagiannakis, A.T. Energy harvesting from asphalt pavement roadways vehicle-induced stresses: A feasibility study. Appl. Energy 2016, 182, 210–218. [Google Scholar] [CrossRef]
  29. Roshani, H.; Dessouky, S.; Papagiannakis, A.T.; Montoya, A. Experimental and finite element assessment of three energy harvesting prototypes for roadways. Innov. Infrastruct. Solut. 2017, 2, 7. [Google Scholar] [CrossRef]
  30. Roshani, H.; Jagtap, P.; Dessouky, S.; Montoya, A.; Papagiannakis, A.T. Theoretical and Experimental Evaluation of Two Roadway Piezoelectric-Based Energy Harvesting Prototypes. J. Mater. Civ. Eng. 2018, 30, 04017264. [Google Scholar] [CrossRef]
  31. Najini, H.; Muthukumaraswamy, S.A. Piezoelectric Energy Generation from Vehicle Traffic with Technoeconomic Analysis. J. Renew. Energy 2017, 2017, 9643858. [Google Scholar] [CrossRef] [Green Version]
  32. Vázquez-Rodríguez, M.; Jiménez, F.; Pardo, L.; Ochoa, P.; González, A.; Frutos, J. A New Prospect in Road Traffic Energy Harvesting Using Lead-Free Piezoceramics. Materials 2019, 12, 3725. [Google Scholar] [CrossRef] [Green Version]
  33. Mota, B.C.; Barroso, S.H.A. The use of pavement for energy generation and sustainable development of smart cities. Transportes 2021, 29, 1–15. [Google Scholar] [CrossRef]
  34. Duarte, F.; Champalimaud, J.P.; Ferreira, A. Waynergy Vehicles: An innovative pavement energy harvest system. Proc. Inst. Civ. Eng.—Munic. Eng. 2016, 169, 13–18. [Google Scholar] [CrossRef]
  35. Duarte, F.; Ferreira, A.; Champalimaud, J.P. Waynergy vehicles: System prototype demonstration in an operational environment. Proc. Inst. Civ. Eng.—Munic. Eng. 2019, 172, 106–113. [Google Scholar] [CrossRef]
  36. Duarte, F.; Ferreira, A.; Fael, P. Road pavement energy harvesting: Experimental validation of an electromechanical system. In Proceedings of the 8th Transport Research Arena TRA 2020, Helsinki, Finland, 27–30 April 2020. [Google Scholar]
  37. Vale, A.C.F. Analisys of the Evolution of Permanent Deformation of Asphalt Mixtures Using the Stress Sweep Rutting (SSR) Test Methodology. Master’s Thesis, Federal University of Ceará, Fortaleza, Brazil, 2020. [Google Scholar]
  38. Medina, J.; Motta, L.M.G. Pavements Mechanics, 3rd ed.; Interciência: Rio de Janeiro, Brazil, 2015; 638p. [Google Scholar]
  39. Yoder, E.J.; Witczak, M.W. Principles of Pavement Design, 2nd ed.; John Wiley and Sons: New York, NY, USA, 1975; 711p. [Google Scholar]
  40. COMSOL. Optimizing the Power of a Piezoelectric Energy Harvester. 2015. Available online: https://br.comsol.com/blogs/optimizing-the-power-of-a-piezoelectric-energy-harvester/ (accessed on 8 February 2022).
  41. Torquato e Silva, S.A.; Bastos, J.B.S.; Soares, J.B. Influence of adhesion on asphalt pavements analysis. In Proceedings of the Annual Pavement Meeting, Foz do Iguaçu, Brazil, 18–21 August 2015. [Google Scholar]
  42. Guedes, K.G.; Oliveira, F.H.L. Comparative analysis between rolling comfort measurement indexes on the Fortaleza ring road. Rev. Tecnol. 2018, 39, 1–10. [Google Scholar] [CrossRef]
  43. DNIT. Pavements Management Manual; Instituto de Pesquisas Rodoviárias (IPR): Rio de Janeiro, Brazil, 2011.
  44. EPE. National Energy Balance 2020: Base Year 2019; Ministério de Minas e Energia, Empresa de Pesquisa Energética: São Paulo, Brazil, 2020. Available online: https://www.epe.gov.br/sites-pt/publicacoes-dados-abertos/publicacoes/PublicacoesArquivos/publicacao-479/topico-528/BEN2020_sp.pdf (accessed on 8 February 2022).
Figure 1. Prototype components.
Sustainability 14 09584 g001
Figure 2. Distribution of piezoelectric cells.
Sustainability 14 09584 g002
Figure 3. Laboratory prototype.
Sustainability 14 09584 g003
Figure 4. Power generated by computer simulations.
Sustainability 14 09584 g004
Figure 5. Electric power and voltage from resistance variation for four cells spaced further apart (F = 10.2 kN).
Sustainability 14 09584 g005
Figure 6. Power as a function of the voltage applied to specimen and cell set.
Sustainability 14 09584 g006
Figure 7. Power generated in laboratory tests.
Sustainability 14 09584 g007
Table 1. Coordinates of the piezoelectric cells (in mm, from the edge).
CellsPositions (mm)CellsCells (mm)
XYZXYZ
150.021.46.01180.020.06.0
221.450.06.01220.080.06.0
350.078.66.0138.650.06.0
478.650.06.01450.08.66.0
535.735.76.01591.450.06.0
635.764.36.01650.091.46.0
764.335.76.01+e8.650.06.0
864.364.36.02+e50.08.66.0
920.020.06.03+e91.450.06.0
1080.080.06.04+e50.091.46.0
Table 2. Real stresses were applied to the asphalt mixture specimen and the cells.
Loads (kN)Stress in the AC Specimen (MPa)Stress in the Cells (MPa)
4 Cells8 Cells16 Cells
TotalUnitaryTotalUnitaryTotalUnitary
3.400.4314.773.697.390.923.690.23
5.100.6522.165.5411.081.385.540.35
6.800.8729.547.3914.771.857.390.46
8.501.0836.939.2318.462.319.230.58
10.201.3044.3111.0822.162.7711.080.69
Table 3. Physical and electrical parameters for the prototype.
Number of Cells4816
Thickness (m)0.00620.00620.0062
Area (m²)2.3020 × 10−44.6039 × 10−49.2078 × 10⁻⁴
d33 (C/N)450 × 10−12450 × 10−12450 × 10−12
ε0 (F/m)340034003400
εr (F/m)8.85 × 10−128.85 × 10−128.85 × 10⁻¹²
Capacitance (F)1.1172 × 10−92.2344 × 10−94.4688 × 10⁻⁹
Frequency (Hz)510205102051020
Resistance (MΩ)28.491914.24607.123014.24607.12303.56157.12303.56151.7807
Table 4. Physical and electrical parameters for the prototype.
TermsFunction in the Software
ModelModel Wizard
Spatial dimension of the model3D
Resources (in order)Structural Mechanics: Piezoelectric Devices e Electrical Circuit;
Study TypeFrequency Domain
Addition of Parametersacc = 1; R_load = defined by Table 3
GeometryAccording to Table 1 and Figure 1 and Figure 2
Adding MaterialPZT-5H for the cells, asphalt for the asphalt mix, and copper for the slabs (change material parameters such as mass, modulus, constants, and the like from the materials to be adopted in Section 2.2.1)
Damping for the materials (in order)Linear Elastic Material → Damping 1 → Solid Model → Isotropic → Electric Potential → Boundary Probe (expression: 1[V]/(es.n)*0.005[m]*es.omega)
Isotropic factor0.001
Load applicationFix the load application face (for the specific case of this paper it was the top face of the asphalt mixture) using the Boundary Load feature in the Solid Mechanics menu, in the z-axis.
Electrical Resources (in order)
(i)
Physics → Boundaries → Ground → Terminal → type: circuit on the bottom face of the piezoelectric cell. Under Electrostatics, also add the Floating Potential on the top face of the piezoelectric cell;
(ii)
Add the floating potential probing point: Definitions → Probes → Domain Point Probe, selecting the upper face of the cells;
(iii)
Add the floating potential probing point expression: Definitions → Domain Point Probe 1 → Point Probe Expression 1; Then select the Electrostatics menu → Floating Potential and choose the expression es.fp1.v0_FloatingPotential;
(iv)
Add the Boundary Probe’s probe point expression: Electrostatics → Currents and charge → Double-click on es.nD_SurfaceChargeDensity; Also, select in Probe type the option Integral
(v)
Add the resistor: Electrical Circuit → Resistor. In the settings: Node connections → n → 0; Go to Devices Parameters → R_type: R_load
(vi)
Add the External Terminal: External Terminal → Node name → 1:V:Terminal Voltage (es/termI).
MeshDefines the triangular mesh
Table 5. Dimensions of the asphalt mixture specimens.
Specimen IdentificationDiameter (mm)Top Side (mm)Bottom Side (mm)
5100.049.8100.2
7100.049.6100.0
12100.049.999.8
14100.050.085.0
Table 6. Specimen volumetrics.
Specimen Number571214
Dry mass (g)2617.92612.82616.02425.7
Submerged mass (g)1458.11455.81455.31347.5
Saturated-surface-dry (g)2268.42619.52624.92430.4
Apparent density (Gmb)2.2372.2452.2372.240
Air Voids Volume (%)4.494.134.504.35
No. of compactor turns10010010085
Table 7. Properties of piezoelectric cells.
PropertiesSymbolsValues
Dielectric constantE2200 ± 10
Capacitance (pF)C180 ± 10
Curie’s temperature (°C)Tc250
Dissipation Factor (%)tgδ≤2.0
Frequency (kHz)Fa195 ± 5
Resonant impedance (Ω)R≤180
Electromechanical coupling coefficient (%)K33≥60
Mechanical quality factorQm≥60
Piezoelectric charge constant (×10−12 C/N)d33450
Table 8. Traffic on BR-222 in Brazil.
DaysMondayTuesdayWednesdayThursdayFridaySaturdaySunday
DirectionTotalTotalTotalTotalTotalTotalTotal
Trucks and buses (2 axles)12001246130213461359904521
Cars7294665766606861819874996496
Table 9. Equations for obtaining the electric power with the application of force.
Number of CellsResistances (MΩ)Frequencies (Hz)Equations
428.49195Equation (8)1.00
14.246010Equation (9)1.00
7.123020Equation (10)1.00
4+e28.49195Equation (11)1.00
14.246010Equation (12)1.00
7.123020Equation (13)1.00
814.24605Equation (14)1.00
7.123010Equation (15)1.00
3.561520Equation (16)1.00
167.12305Equation (17)1.00
3.561510Equation (18)1.00
1.780720Equation (19)1.00
Table 10. Equations for obtaining the electric power (laboratory).
Number of CellsResistances (MΩ)Frequencies (Hz)Equations
40.895Equation (20)0.97
0.8310Equation (21)0.99
1.0120Equation (22)0.98
4+e0.485Equation (23)0.99
0.4110Equation (24)0.96
0.5920Equation (25)0.99
80.575Equation (26)0.96
0.6110Equation (27)0.94
1.0820Equation (28)0.99
161.115Equation (29)0.97
1.3710Equation (30)0.99
1.4920Equation (31)0.99
Table 11. Simulated power for a section of BR-222 in the ideal situation.
TypePowerUnit
Car tire/module0.01212W
Bus and truck tires/module0.14679W
Car tire/day/module86.12717Wh
Bus and truck tires/day/module165.57828Wh
Car tire/year/module31.43642kWh
Bus and truck tires/year/module60.43607kWh
Publisher’s Note: MDPI stays neutral with regard to jurisdictional claims in published maps and institutional affiliations.

