Abstract
Nutraceuticals are food-based products that provide health benefits beyond basic nutrition and play an increasingly important role in preventive healthcare. Ensuring their quality, safety, and efficacy is critical as the global market expands. A systematic literature search was conducted in Scopus, Web of Science, and PubMed using keywords such as ‘nutraceuticals,’ functional foods,’ and ‘quality control,’ with studies selected based on their focus on methods for standardization, characterization, and quality assessment. This review summarizes current analytical approaches, including spectroscopic, chromatographic, and techniques for elemental analysis, highlighting their applications in compound identification, quantification, detection of adulterants, and overall quality control. Emerging challenges and future trends, such as the integration of chemometrics and real-time analytical strategies, are also discussed, providing a comprehensive perspective on the evolving field of nutraceutical analysis.
1. Introduction
Nutraceuticals are food-based products that provide health benefits beyond basic nutrition, including the prevention or management of disease. They encompass a wide range of products, from concentrated nutrients and dietary supplements to herbal preparations, and functional foods [1,2].
Nutraceuticals are often used in the prevention and treatment of chronic diseases [1]. They typically contain bioactive components, usually natural compounds known to support health or aid in disease prevention [1,2,3,4]. The term itself merges the words “nutrient” and “pharmaceutical” and was first introduced by Dr. Stephen De Felice in 1989 to describe food-derived agents with potential therapeutic effects [2].
Functional foods like vegetables, fruits, fermented foods with live probiotic cultures and vitamin-enriched products are also categorized as nutraceuticals [3,4,5]. These fortified food products (foods to which one or more essential nutrients have been added [6]) serve as a bridge between the fields of food science and medicine because they are typically sold in pharmaceutical dosage forms such as pills, injectables, powders, or capsules [7,8,9].
Herbal extracts, vitamin and mineral supplements, therapeutic beverages, and specially formulated medical foods are also classified as nutraceuticals [6,7]. Their role in supporting health has attracted growing interest across nutrition, pharmaceutical, and clinical research fields [4,7,8].
Nutraceuticals include a wide range of products and that makes their classification complicated and diverse. Even so, they can be categorized depending on food source, chemical nature, regulatory definition and efficacy [1,2,3,4,5,6,7,8,9] (see Table 1).

Table 1.
Classification of nutraceuticals by food source, chemical nature, regulatory definition, and efficacy [1,2,3,4,5,6,7,8,9].
With the growing popularity of nutraceuticals among aging and wellness-focused consumers, it has become essential to ensure product quality, safety, and efficacy through reliable analytical methods [8].
2. Analytical Techniques in Nutraceutical and Functional Food Analysis
Globally, regulatory agencies such as the U.S. Food and Drug Administration (FDA), European Food Safety Authority (EFSA), and World Health Organization (WHO) enforce standards for nutraceutical quality [7,8,9]. Analytical methods must fulfill pharmacopeial standards (United States Pharmacopeia (USP), European Pharmacopoeia (EP), Japanese Pharmacopoeia (JP) and follow validated protocols for accuracy, specificity, and reproducibility [8,9].
Robust analytical methodologies are essential at every stage, from the discovery of novel bioactive compounds to maintaining batch-to-batch consistency of the finished products. They must guarantee no adulteration or contamination in the final products [10,11,12,13].
The complexity of natural products and the diversity of nutraceutical formulations—ranging from capsules and powders to functional foods—demand a comprehensive and multidisciplinary analytical approach. This is critical for ensuring safety, efficacy, and reproducibility [11,12].
Although the target analytes are very different by nature, the key components of analytical evaluation include identification and quantification of active ingredients, detection of impurities, confirmation of botanical identity, stability testing, and batch consistency of the final product [11,12,13,14].
Figure 1 illustrates the process of Analytical Characterization (AC), a critical step in evaluating nutraceutical products. AC is a comprehensive process for evaluating nutraceutical products. Its three main objectives are as follows: identification of active compounds, quantification of bioactive ingredients, and quality control to ensure product safety and efficacy. These objectives are achieved through several key steps, including detecting contaminants, confirming botanical identity, assessing stability, and verifying batch-to-batch consistency. Together, these steps ensure that nutraceutical products are safe, effective, and reliable [10].
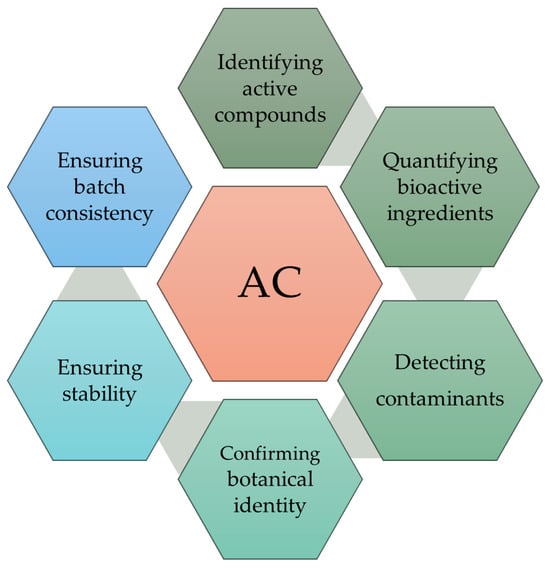
Figure 1.
Analytical assessment of nutraceuticals. AC (analytical characterization) refers to the systematic evaluation of nutraceutical products.
The initial step in nutraceutical analysis is the accurate identification of active constituents, which serves as a marker of both authenticity and potency. For example, standardization of Ginkgo biloba extracts typically involves quantification of ginkgolides and bilobalide [15]. Routinely used for this purpose is high-performance liquid chromatography (HPLC), often coupled with photodiode array (PDA) or mass spectrometry (MS) [15].
Once identified, precise quantification of active ingredients such as vitamins, polyphenols, and omega-3 fatty acids is critical for dosage standardization and ensuring product efficacy. Liquid chromatography–tandem mass spectrometry (LC-MS/MS) is frequently employed for this task due to its sensitivity and specificity [15,16,17].
Ensuring product safety also requires detection and quantification of harmful contaminants like heavy metals (arsenic, cadmium, lead, mercury), pesticide residues, mycotoxins (in plant-based ingredients), and residual solvents (from extraction) [16].
Inductively coupled plasma mass spectrometry (ICP-MS) is usually the method of choice for trace elemental analysis, while gas chromatography–mass spectrometry (GC-MS) is used for volatile organic contaminants [15,16,17].
Authentication of botanical ingredients is equally important to prevent adulteration and ensure that the correct plant species and parts are used in the nutraceuticals. This analytical task is carried out by molecular techniques such as DNA barcoding [18].
Shelf life of the products and optimal storage conditions are established by stability studies; this testing is usually carried out by following the International Council for Harmonisation of Technical Requirements for Pharmaceuticals for Human Use (ICH) guidelines [10].
3. Broader Analytical Landscape
The complexity and diversity of nutraceutical products, which include plant-based bioactive substances [4,15], minerals [7], vitamins [19], and functional ingredients [18], require a wide range of analytical tools [20,21,22,23,24,25,26,27,28,29] to ensure quality, safety, and efficacy. The versatility of analytical techniques and methodologies in nutraceutical research and analysis stems from the need to detect, quantify, and characterize a variety of bioactive compounds in often complex and variable matrices. Although there are many advanced analytical techniques like proton nuclear magnetic resonance spectroscopy (1H-NMR [20]), HPLC [22], GC-MS [23], thin-layer chromatography (TLC) [24], spectroscopic techniques such as ultraviolet–visible spectroscopy (UV-Vis) [21] and Fourier-transform infrared (FTIR) [25] remain irreplaceable for rapid and cost-effective assessment of antioxidant compounds and functional groups, particularly in initial screenings or total content evaluations (e.g., phenolic compounds, flavonoids).
High-resolution molecular and elemental analyses are made possible by sophisticated instrumental techniques like nuclear magnetic resonance (NMR) [26], atomic absorption spectroscopy (AAS) [27], and MS—including both ICP-MS and optical emission spectrometry (ICP-OES) [28].
Reviews of biosensor technologies have examined the extent to which biosensors have advanced in analytical capabilities, enabling quick, on-site identification of pollutants and nutrients with high specificity and little sample preparation [30,31,32,33,34,35].
To authenticate botanical substances and identify adulteration in herbal supplements genomic tools like DNA barcoding and PCR-based assay can be useful but only in combination with appropriate hyphenated chemical methods for quality control [36,37].
The application of chemometric techniques like principal component analysis (PCA) and partial least squares–discriminant analysis (PLS-DA) have improved quality control and product classification by making the interpretation of complex datasets much easier [38].
Recent advances in spectrophotometric and fingerprinting techniques have significantly contributed to the quantification and quality control of nutraceuticals, particularly in the assessment of antioxidants [39], flavonoids [40], and vitro and in vivo assays for antioxidant evaluation [41,42,43,44,45]
In their critical review, Ignat et al. [46] made a comprehensive evaluation of analytical methods used for characterization of polyphenolic compounds in fruits and vegetables. The authors emphasize that no single method is universally optimal, but they recommend the use of HPLC—particularly coupled with PDA or MS—as the most reliable and widely applicable technique for qualitative and quantitative analysis of individual polyphenols.
HPLC and Ultra HPLC (UPLC) offer significant advantages over other techniques in nutraceutical analysis, including high resolution, sensitivity, and versatility for profiling phenolic compounds [47], enabling validated quantification of phenolic acids in plant-based supplements [48], analysis of antioxidant-rich extracts [49], targeted separation of flavonoid aglycones post-hydrolysis [50], structural elucidation of complex polyphenols [51], and comprehensive identification of anthocyanins and ellagitannins in fruit-based products [52]. HPLC is also effective in tracking carotenoid retention in processed foods [53], assessing fat-soluble vitamins [54], detection of glucosinolates [55] and vitamin C in plant materials [56,57].
HPLC-based profiling remains a cornerstone for comprehensive nutraceutical characterization and quality control in herbal and functional food products; it also has established validation guidelines, ensuring analytical robustness [57,58].
Complementary metabolomics [59] and gas chromatography methods [60] further enhance the detection and quantification of diverse bioactive compounds, including methylsulfonylmethane [61] and other small molecules, while spectroscopic and chromatographic hyphenated techniques provide detailed structural insights of plant phenolics [62,63].
Gas chromatography (GC) with different detection methods (MS, FID) is used for fatty acids [64], essential oils [65], sterols [66], and analysis of tocopherols [67]. Together with advanced chemometric fingerprinting, GC is used for authentication purposes [68,69,70,71] and it is the technique of choice for solvent residue analysis [72], ensuring product safety.
Methods like FTIR [73] and Raman spectroscopy [74], combined with chemometric techniques such as PCA and Hierarchical Cluster Analysis (HCA) [75], have greatly enhanced the rapid [76], non-destructive authentication [77] and quantification of bioactive compounds, adulterants [78,79], and phenols in foods [79], herbal medicines, and nutraceuticals [80], while quantitative 1H NMR provides precise profiling and absolute quantification of complex phytochemicals, supporting robust quality control [81,82,83,84,85].
In the food, pharmaceutical, and agricultural industries, metabolomic techniques, usually in tandem with another analytical tool, are starting to have broad applications—from sample preparation to geographic authentication of herbal medicines [86,87,88].
Other highly effective analytical tools for quality evaluation and authentication are chemometric methods. They are usually combined with near-infrared (NIR) and infrared (IR) spectroscopy. Their applications expand from non-destructive fruit and vegetable quality assessment [89] to dried herb classification [90], adulterant detection [91], process monitoring, PAT implementation [92], and chemometrics-assisted classification [92,93,94,95,96].
Flame atomic absorption spectrometry (FAAS) remains a widely applied technique for the determination of micro- and macro-elements [97,98], and it has been successfully employed in the elemental analysis of traditional Ayurvedic formulations [99].
Table 2 summarizes most common analytical methods used for evaluation of nutraceuticals, detailing their common analytes and key advantages.
Table 2.
Overview of analytical techniques applied in nutraceutical analysis.
This extensive toolkit of analytical techniques supports the changing regulatory and customer needs in nutraceutical field. The choice of an appropriate analytical technique in nutraceutical and functional food analysis may look complicated but it largely depends on the chemical nature of the target compounds (see Figure 2).
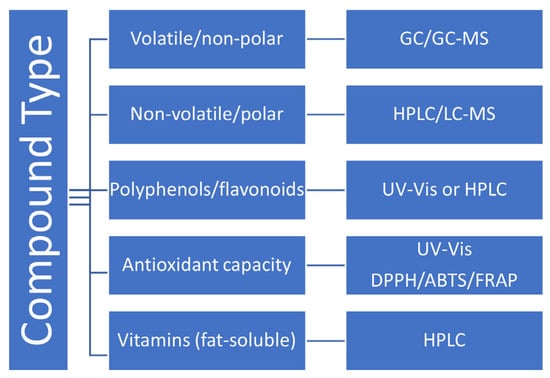
Figure 2.
Decision pathway for selecting analytical method in nutraceutical analysis.
As can be seen (Figure 2), GC-MS is ideal for analysis of essential oils and aromatic compounds [23].
Non-volatile/polar compounds such as amino acids, sugars, and certain phenolic acids are usually analyzed with HPLC or LC-MS because these techniques provide accurate separation and quantification, particularly for thermally unstable or polar molecules [22].
Colorimetric assays like 1,1-diphenyl-2-picrylhydrazyl (DPPH), 2,2′-azino-bis(3-ethylbenzothiazoline-6-sulfonic acid (ABTS), and Ferric Reducing Antioxidant Power (FRAP) are among the most wildly used to estimate the antioxidant capacity [39].
Due to their lipophilicity, fat-soluble vitamins like A, D, E, and K are best quantified with HPLC, which guarantees accuracy and resolution in complex herbal or supplement matrices [54].
After selecting the method for analysis of the key nutraceutical ingredient, determination of shelf life and storage conditions of the nutraceutical is carried out by stability studies or stability testing. These testings adhere to ICH guidelines [10].
The ICH [10] guidelines are important to follow as they ensure that analytical methods used are reliable, reproducible, and scientifically sound. By specifying crucial factors like accuracy, precision, specificity, linearity, range, detection limit, quantitation limit, robustness, and system appropriateness, the ICH guideline offers a standardized framework for certifying analytical processes. These validation concepts, which were initially created for pharmaceutical industries, are also applicable to nutraceuticals.
According to the ICH guidelines, HPLC methods used in analysis of nutraceutical must be validated [10]. Specificity, linearity, accuracy, precision, LOD (limit of detection), and LOQ (limit of quantification) should be determined, as precision is typically reported as %RSD (relative standard deviation), and recovery studies are performed by spiking known standards into the sample matrix.
A method validation workflow based on ICH guidelines [10] is shown in Figure 3.
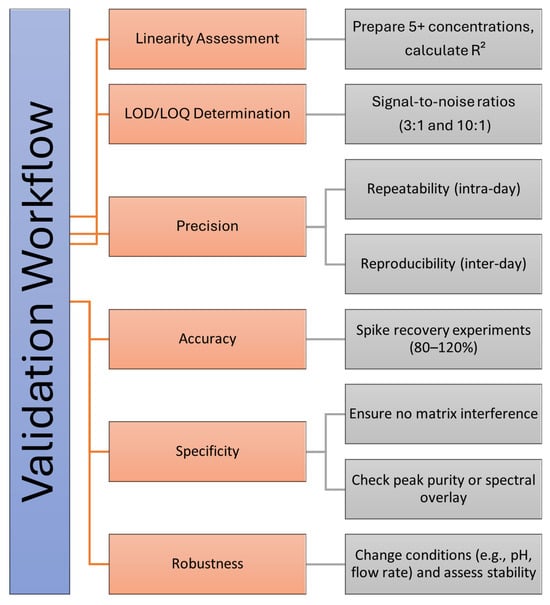
Figure 3.
Validation workflow for analytical method assessment. The figure outlines key steps in the validation process, including linearity assessment, LOD/LOQ determination, precision (repeatability and reproducibility), accuracy (spike recovery experiments), specificity (matrix interference checks), and robustness (stability under varying conditions). Each step ensures the reliability and robustness of the analytical method.
Existing reviews in the literature are predominantly focused either on individual analytical techniques [12,17,18,22,23,24,25,26,27,28,29,30,31,32,33,34,35,36,37,38,39,42,58,59,60] or on specific classes of bioactive compounds, such as phenols and polyphenols [11,21,47,49,62,63], carotenoids [10,11,12,13], antioxidants [41], total flavonoids [44,50] and sterols [66], etc. To date, a comprehensive review systematically integrating spectroscopic, chromatographic, and elemental analysis techniques for the characterization of multi-class bioactive compounds is still lacking. Such an integrated synthesis is essential to support robust quality control, safety assessment, authentication, and regulatory oversight, particularly for complex nutraceutical matrices and multi-ingredient formulations.
Accordingly, the scope of the present review is to provide a systematic overview of established, widely applied, and emerging analytical methodologies for nutraceutical analysis, beginning with spectroscopic techniques (UV–Vis), followed by chromatographic approaches (LC and GC), advanced vibrational and magnetic resonance spectroscopies (Raman, FTIR, NIR, NMR), and elemental profiling methods. The applicability, strengths, and limitations of each technique are critically discussed with respect to nutraceutical authentication and quality control, while emerging analytical trends and integrative strategies in nutraceutical analysis are also highlighted.
4. Sample Preparation and Pre-Treatment for Quality Control and Authentication of Nutraceuticals
Appropriate sample preparation and pre-treatment are critical for the reliable quality control and authentication of nutraceuticals, as these steps directly influence analytical accuracy, repeatability, and method robustness. Given the chemical complexity of nutraceutical matrices, preparation strategies are selected based on the target analytes, analytical technique, and regulatory requirements [10,19,49].
Solid nutraceutical samples, including tablets, capsules, powders, and botanical materials, are commonly subjected to homogenization, grinding, or milling to ensure sample uniformity. Cryogenic milling is frequently employed to prevent thermal degradation and oxidation of thermolabile constituents, including polyphenols, vitamins, and volatile compounds [62,63]. For spectroscopic fingerprinting approaches such as FTIR and NIR, minimal physical preparation (grinding and homogenization) is preferred to preserve holistic chemical signatures [73,80].
Solvent extraction remains the most widely applied preparation step for chromatographic analysis of nutraceuticals. Hydroalcoholic solvent systems are commonly used for extracting phenolic compounds and flavonoids, whereas non-polar solvents are applied for lipophilic constituents such as fatty acids, carotenoids, and sterols [46,49,63]. Cleanup procedures, including solid-phase extraction, are frequently employed to reduce matrix interferences and enhance method selectivity prior to LC-MS or GC-MS analysis [22,58].
For gas chromatographic analysis, derivatization techniques such as methylation or silylation are often required to improve volatility and thermal stability of analytes, particularly fatty acids and sterols [60,64,70].
The determination of trace elements and heavy metals in nutraceuticals requires rigorous digestion procedures to ensure complete matrix decomposition. Acid digestion, commonly assisted by microwave energy, is widely applied prior to analysis by atomic absorption spectroscopy or inductively coupled plasma-based techniques [27,29]. These pre-treatment steps are essential for accurate quantification and compliance with regulatory contaminant limits [5,19].
Spectroscopic techniques such as FTIR, NIR, Raman, and UV–VIS fingerprinting often rely on minimal sample preparation to maintain the integrity of global chemical profiles used for authentication and adulteration detection [42,73,80]. Typical pre-treatment steps include drying, grinding, and homogenization, followed by direct spectral acquisition. When combined with chemometric analysis, these approaches enable rapid, non-destructive quality assessment [38,73]
DNA-based authentication methods require specific pre-treatment steps to extract amplifiable genetic material from highly processed nutraceutical matrices. Sample preparation typically involves mechanical disruption, chemical lysis, and purification steps designed to remove PCR inhibitors commonly present in herbal extracts and dietary supplements [18,36,37]. Optimized DNA extraction protocols are critical for successful DNA barcoding, metabarcoding, and qPCR-based authentication [37].
Sample preparation procedures used for quality control and authentication must be compatible with validated analytical methods. Validation parameters, including precision, accuracy, specificity, and robustness, are assessed in accordance with ICH Q2(R1) guidelines [10]. Pharmacopeial standards and regulatory guidance from the FDA, EFSA, WHO, and USP further define acceptable preparation practices, contaminant thresholds, and quality specifications for nutraceutical products [1,5,7,8,9,19].
5. UV–Vis Spectroscopy
Although we have advanced analytical techniques like HPLC and GC-MS, UV–Vis spectroscopy continues to serve as an accessible, cost-effective, and robust analytical technique. UV-Vis methods are especially valuable for quantifying phenolic compounds [39], flavonoids [40], vitamins [43], and other bioactive compounds in complex matrices [39,40,41,42,43].
Recent developments in UV-Vis analysis have introduced more refined protocols, improved sensitivity, and kinetic-based detection strategies suitable for quality control and standardization of nutraceutical formulations [41].
The assessment of antioxidant and flavonoid content in nutraceuticals is a key component in evaluating their health-promoting properties. Numerous in vitro methods have been developed to quantify antioxidant capacity, each based on distinct physicochemical principles and reaction mechanisms. These include electron transfer-based assays such as the Folin–Ciocalteu (FC) assay [21], DPPH, ABTS, FRAP, and cupric reducing antioxidant capacity (CUPRAC), as well as hydrogen atom transfer techniques [39,41].
The review of Apak et al. [39] provide a comprehensive classification of antioxidant capacity assays such as CUPRAC, FRAP, ABTS, and DPPH. These assays exploit electron transfer mechanisms and can be adapted to various matrices, including foods, supplements, and beverages. They typically operate within a wavelength range of 450–750 nm, with distinct absorbance peaks for each assay type. Antioxidant activity assays may be performed using both in vitro and in vivo models to assess radical scavenging capacity, reducing power, or inhibition of lipid peroxidation. Each assay has its own strengths and limitations, and combining multiple methods can provide a more comprehensive antioxidant profile [39].
Flavonoids, as major contributors to antioxidant activity, are commonly determined via spectrophotometric methods. An optimized and validated method [40] based on the complexation of flavonoids with iron(III) ions allows sensitive quantification with a 200-fold reduction in quercetin concentration during UV–Vis calibration. Such approaches are particularly valuable for routine analysis of herbal extracts and nutraceutical formulations.
The application of UV-visible spectroscopy as a fingerprinting tool in nutraceutical quality control has gained significant attention. Full-spectrum absorbance profiling combined with chemometric tools like PCA, PLS-DA, and cluster analysis enables differentiation among botanical sources, authentication of ingredients, and monitoring of compounds’ stability [42]. UV fingerprinting (between 200 and 400 nm) allows the characterization of phenolic profiles without requiring compound-specific standards. When coupled with chemometric analysis, the UV-Vis method enhances authenticity verification and quality control of functional food products.
Farag and colleagues [42] demonstrate that UV fingerprinting paired with multivariate methods (PCA, PLS, HCA) provides a rapid, low-cost, non-targeted approach to authenticate botanical sources, detect adulteration, track phenolic variability across cultivars and regions, and assess sample stability. These strategies offer acceptable accuracy for screening compared to more expensive spectral tools, especially when quantitative results are not required.
Newly emerging kinetic spectrophotometric methods also allow the precise determination of water-soluble vitamins like vitamin C in complex cosmetic or nutraceutical matrices. Lavilla et al. [43] developed such an assay for determination of vitamin C even in complex emulsions like cosmetics and liquid nutraceuticals. The quantification of ascorbic acid is based on the methylene blue photoreduction method. The assay, operating at 664 nm, demonstrated high sensitivity (LOD: 0.04 μg/mL) and was successfully applied to commercial formulations, including emulsions and beverages [43].
Together, these spectrophotometric and kinetic assays serve as indispensable tools in the phytochemical analysis of nutraceuticals, enabling both targeted and untargeted quality control strategies [100].
Despite the widespread use of total flavonoid content (TFC) assays, there are limitations associated with older methods. Recent reviews advocate for revising protocols and minimizing interference from non-target compounds, thus ensuring more accurate phytochemical profiling [44].
In the review by Nicolescu et al. [44] critically revisit the determination of TFC, highlighting the evolution, standardization issues, and limitations of colorimetric assays—especially the aluminum chloride (AlCl3) method, which remains the most widely used. The authors emphasized on the lack of methodological consistency and challenges in expressing the results due to differing standards (quercetin, catechin) and suggested future directions like hyphenated techniques (LC-MS) and improved validation protocols for more accurate TFC assessment in complex plant matrices.
Another critical mini-review [101] of spectrophotometric methods used for phenolic compounds’ determination in nutraceuticals and food products points out some limitations in these approaches—such as a lack of specificity, interference from co-extracts, and calibration challenges. The authors emphasize on the need for complementary analytical techniques to verify the results.
Knez et al. [102] also made a critical evaluation of widely used spectrophotometric assays for measuring antioxidant capacity in plant-based food samples. The authors categorize assays into two categories—single-electron transfer and hydrogen atom transfer methods [102]. As a conclusion, they recommend the combined use of multiple assays. CUPRAC and oxygen radical absorbance capacity (ORAC) demonstrate greater repeatability and chemical stability and according to the authors, they better reflect physiological conditions over traditional methods like ABTS+, DPPH, FRAP, and FC that may produce inaccurate results due to interference from amino acids or other food constituents [102].
Despite the shortcomings and the disadvantages that spectrophotometry has, it remains among the most widely used analytical tools in the evaluation of nutraceuticals due to their simplicity, cost effectiveness, and suitability for routine analysis.
Table 3 summarizes seven representative antioxidant capacity assessment methods.
Table 3.
Antioxidant capacity assignment methods [21,39,102].
6. Chromatographic Techniques
Liquid chromatography (LC) is a separation technique where components of a mixture are partitioned between a stationary phase and a mobile liquid phase. Its high-performance variant HPLC is a powerful separation technique enabling high-resolution and analysis of complex mixtures. Its flexibility and scalability (from analytical assays to preparative bioprocessing) make HPLC indispensable for nutraceutical quality control and compound isolation [47].
6.1. High-Performance Liquid Chromatography (HPLC)
HPLC is an advanced form of LC that employs high-pressure pumps to push solvents through tightly packed columns, enabling faster, more efficient separations with higher resolution. It is considered the gold standard for determination of nutraceutical constituents due to its sensitivity, reproducibility, and ability to handle complex matrices. HPLC can be equipped with various detectors [46].
Detection of separated analytes is commonly achieved using UV–Vis, PDA or MS detectors, allowing precise qualitative and quantitative analysis. HPLC is especially valuable for thermolabile and non-volatile compounds like polyphenols, vitamins, and alkaloids [22,46,47,48,49,50].
In nutraceutical and functional food analysis, HPLC is frequently used for the quantification of flavonoids via diode-array detection DAD, for vitamin profiling via UV or MS detection [45], and for fingerprinting and quality control when coupled with chemometrics [48].
HPLC is a cornerstone analytical technique in the field of nutraceutical analysis due to its high sensitivity, precision and when it is coupled with detectors such as UV-Vis, DAD, or MS, HPLC offers high sensitivity and specificity [22]. It has become one of the most robust and widely used analytical techniques for the separation, identification, and quantification of phenolic compounds in nutraceuticals and functional foods. Owing to its versatility, sensitivity, and reproducibility, HPLC is the preferred choice in analysis of complex matrices such as plant extracts, dietary supplements, and fortified products [47,48,49,50,51,52]
Nutraceuticals often contain bioactive compounds derived from plants, animals, or microbial sources [3,7]. These matrices are typically complex, and the target compounds may be present in trace amounts, making accurate detection challenging. HPLC offers robust separation and detection of these analytes without the need for extensive sample preparation, making it a preferred method for routine quality control and research applications [58].
The sample preparation for HPLC analysis typically begins with drying and homogenizing the material to ensure uniformity, followed by extraction. The extract is then clarified by centrifugation or filtration. If needed, the extract is concentrated by evaporating the solvent under reduced pressure and further purified using SPE or LLE to reduce matrix interferences. Finally, the solution is filtered through a membrane to prevent column clogging and is injected into the HPLC system under validated chromatographic conditions [47,48].
Most HPLC methods for analysis of nutraceuticals usually utilize RP columns due to their broad applicability in polar and non-polar compound separation. Gradient elution with mixtures of aqueous buffers (usually acidified water with acetic or formic acid) and organic solvents (such as methanol or acetonitrile) enables the resolution of diverse compound classes. Detection methods include UV–Vis, PDA, fluorescence, and, increasingly, LC-MS for structural elucidation and increased selectivity [45,48,52].
Phenolic compounds are identified by comparing retention times and UV spectra to those of analytical standards. Quantification is performed using external calibration with standard solutions of known concentrations. When reference standards are unavailable, semi-quantitative estimations can be made using structurally similar compounds [47].
Several studies [46,47,48] demonstrated that RP C18 columns combined with water–acetonitrile or methanol mobile phases acidified with formic or acetic acid provide effective separation of diverse polyphenolic compounds. Detection methods ranged from DAD to MS, enabling both qualitative and quantitative analyses. These methods show high sensitivity and specificity, crucial for characterizing complex plant matrices. HPLC methods for phenolic acids commonly employ acidified water and methanol gradients with C18 stationary phases, achieving efficient resolution and reliable quantification [47,48,49,58].
Filipiak-Szok et al. [48] used RP-HPLC with PDA a for simultaneous quantification of seven biologically active phenolic acids from Vitis vinifera dietary supplements; the method proved precise (RSD < 5%; inter- and intra-day variations < 8%), rapid, simple, selective, and specific—successfully analyzing five commercially available Polish grapevine supplements without interference from other components.
Suciu et al. [103] analyzed the polyphenolic compounds in Lysimachia nummularia L. At the beginning of the analysis, they used three methods of extraction: Soxhlet, maceration, and ultrasonic-assisted extraction with 70% ethanol. TPC was measured via the FC method; antioxidant activity was assessed using DPPH, ABTS, FRAP, and CUPRAC assays [103]. The HPLC analysis of polyphenolic compounds (gallic acid, 3-O-methylgallic acid, caffeic acid, ferulic acid, chlorogenic acid, p-coumaric acid, and trans-resveratrol) was performed using a reverse-phase HPLC with diode-array detection (RP-HPLC-DAD).
Mizzi et al. [104] used HPLC with a UV-Vis DAD detector, equipped with RP C18 column for analysis of phenolic compounds and flavonoids with overlapping peaks. Despite the overlapping peaks (vanillic and caffeic acid at 21.0 min and ferulic and p-coumaric acid at 24.5 min), the unique absorption spectra of each phenolic compound allow quantification in the mixture by applying compound-specific standardization constants and total absorbance measurements at different wavelengths. UV detection remains standard, but for structural confirmation or overlapping spectra, MS is increasingly used.
Two novel chromatographic methods employing sub-2 µm particle columns—RP HPLC system with a C18 silica-based column and a U-HPLC system using an ethylene-bridged hybrid C18 column—were developed for sequential analysis of 34 phenolic compounds and validated through system suitability metrics before application to real samples like wines and tea [45].
HPLC coupled with Quadrupole Time-of-Flight Mass Spectrometry (qTOF-MS) with a core C18 column was used for two determinations of anthocyanins and other phenolic compounds (phenolic acids, ellagitannins, and flavonoids) in pomegranate juices without a previous hydrolysis of the samples [46].
Carotenoid analysis typically utilizes C30 or C18 columns with non-polar mobile phases such as methanol, methyl tert-butyl ether (MTBE), or acetonitrile [53]. These methods rely on UV-Vis or DAD detection within the 450–480 nm range, matching carotenoids’ characteristic absorbance, and occasionally employ MS for detailed profiling.
Both fat-soluble (A, D, E, K) and water-soluble (B-complex, C) vitamins were effectively analyzed using HPLC. Methodologies typically involved buffered aqueous–organic solvent systems with UV or DAD detection (DAD detector, set to 329 nm for vitamin A and 294 nm for vitamin E [54,56,57]). Ion–pair chromatography and derivatization were applied for water-soluble vitamins to enhance detection sensitivity.
Figure 4 illustrates representative chromatographic profiles obtained during the analysis of fat-soluble vitamins in rice cereal baby foods, comparing conventional HPLC-DAD and UHPLC-APCI-MS/MS [57]. The signal intensity (mAU) is plotted as a function of retention time (min), highlighting differences in separation efficiency, sensitivity, and selectivity between the applied analytical approaches.
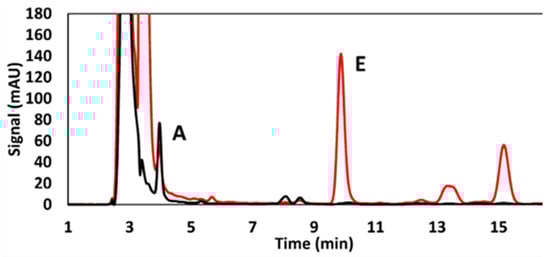
Figure 4.
Representative chromatographic profiles obtained during the analysis of fat-soluble vitamins, reproduced from Ref. [57]. Licensed under CC BY 4.0.
For glucosinolates, RP HPLC with acidified mobile phases enabled robust separation. UV detection post-derivatization was commonly employed [55].
The analysis of alkaloids and amino acids often required pre-column derivatization to improve chromatographic behavior and detection, particularly when using UV or fluorescence detection [20,57]. These approaches ensured sensitive quantification in complex matrices such as medicinal plants and protein supplements.
Advanced techniques such as HPLC coupled with tandem MS (HPLC-MS/MS) have emerged as powerful tools in targeted metabolomic profiling, particularly in complex herbal supplements and polyherbal formulations, enabling the simultaneous detection of structurally similar and trace-level compounds with high selectivity [57].
The study by Turova et al. [58] presents a unified strategy for quality control of herbal products, integrating fast ultrasound-assisted extraction, chromatographic separation, and mass spectrometric quantification of bioactive compounds. This approach enables comprehensive evaluation of chemical composition in botanicals, offering enhanced sensitivity (1–50 ng/mL) compared to traditional HPLC–UV methods [58].
Overall, these HPLC methods demonstrate excellent applicability for quality control, compositional analysis, and bioactive profiling in nutraceutical research. The adaptability of mobile phases, stationary phases, and detection systems allows tailored approaches for the diverse chemical nature of nutraceutical compounds (Table 4).
Table 4.
Representative compound classes, food matrices, and chromatographic analytical platforms commonly employed in nutraceutical and food bioactive compound analysis.
HPLC offers excellent resolution for the separation of structurally similar phenolics, including flavonoids (quercetin, kaempferol) and phenolic acids (gallic acid, ferulic acid). However, co-elution and matrix effects may interfere with accurate quantification. For enhanced selectivity, coupling HPLC with mass spectrometry (LC-MS) has become increasingly popular, especially for targeted metabolomics in nutraceutical research. HPLC is also the method of choice in analysis of carotenoids, vitamins, alkaloids and glucosinolates in plant-based nutraceuticals [53,54,55,56,57,58].
As a conclusion, we can say that HPLC is a widely employed chromatographic technique for the quantification and identification of phenolic compounds, vitamins, and flavonoids in nutraceuticals. RP-HPLC with C18 columns is the most prevalent configuration, often coupled with UV, PDA, or MS detectors. Gradient elution techniques and careful solvent optimization are essential for achieving adequate separation in complex matrices. HPLC offers high resolution, reproducibility, and sensitivity. Recent advances include UHPLC and green solvent approaches for faster and more eco-friendly separations.
HPLC methods can be time-consuming and costly due to the need for high-purity solvents, standard reference compounds, and regular maintenance of instrumentation; in addition, method development and optimization may be complex, especially for multi-component herbal matrices with potential interference and variability in phytochemical composition. The reviewed literature consistently highlights the versatility and robustness of HPLC as a preferred analytical tool for a broad spectrum of nutraceutical compounds [45,46,47,48,49,50,51,52,53,54,55,56,57,58].
6.2. Gas Chromatography (GC)
Gas chromatography is an analytical technique used to separate and analyze volatile and semi-volatile compounds within complex mixtures, particularly effective for analyzing essential oils, fatty acids, aroma compounds, and other volatile nutraceutical components. Detection is often performed using flame ionization detectors (FIDs) or MS, providing high sensitivity and resolution [23]. A representative chromatogram of GC-FID is shown in Figure 5.
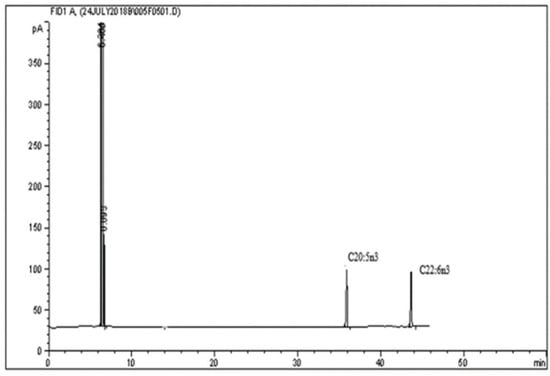
Figure 5.
Representative chromatographic profile of fatty acid methyl esters (FAMEs) obtained from the analyzed sample [64]. The chromatogram shows a dominant early-eluting peak at approximately 5 min and two resolved peaks corresponding to long-chain polyunsaturated fatty acids at approximately 38.5 min (C20:5n3) and 44.0 min (C22:6n3). Peak intensities are expressed in picoamperes (pA). Reproduced from Ref. [64]. Licensed under CC BY 4.0.
While GC is less frequently employed than HPLC for polar, thermolabile compounds, it plays a critical role in the analysis of essential oils, fatty acids, terpenes, sterols, and organic acids—many of which contribute to the bioactivity of nutraceutical products [59,60,61,62,63,64,65]. Table 5 compares sample preparation steps for HPLC and GC analysis of nutraceuticals, highlighting differences related to solvent polarity, derivatization, and preconcentration requirements.
Table 5.
Comparison between HPLC and GC in sample preparation.
GC operates on the principle of separating volatile components based on their partitioning between a stationary phase (usually a capillary column coated with polysiloxane or polyethylene glycol derivatives) and a mobile gas phase (typically helium or nitrogen). Samples often require derivatization—commonly silylation, methylation, or acylation—to enhance volatility and thermal stability, especially for fatty acids [62,63,64,65]. These volatile and lipophilic compounds are often critical markers for quality, stability, or efficacy in nutraceutical formulations derived from plants, marine oils, or probiotic-fermented matrices [64].
GC is frequently coupled with flame ionization detection (GC-FID) or MS (Table 6).
Table 6.
GC analytes, sample preparation step and detection method.
GC methods require rigorous validation, especially when applied to regulatory and commercial nutraceutical products. One major challenge is the thermal instability of some bioactive compounds, which can decompose during GC analysis unless properly derivatized or extracted under mild conditions [65,68,69,70].
Advanced GC technologies such as GC–MS/MS and two-dimensional GC (GC × GC) are emerging in the characterization of complex plant matrices and metabolic profiling. GC–MS is also essential in authenticity testing and contaminant analysis, such as detection of residual solvents, pesticides, or oxidation products [71,72].
GC coupled with flame ionization detection (FID) or MS is widely used for profiling essential oils and aroma-active compounds in herbal extracts and functional foods [105,106]. The method employs non-polar or slightly polar capillary columns with temperature programming to achieve efficient separation of complex volatile mixtures. GC-MS provides structural elucidation and high sensitivity for trace-level compounds [67]. This review of Cagliero et al. [106] highlights the emergence of new GC stationary phases—especially ionic liquids—and advancements like fast and miniaturized (micro-GC) systems as transformative tools for faster, more selective, and energy-efficient essential oil analysis.
Fatty acid profiling, including saturated, monounsaturated, and polyunsaturated fatty acids, is commonly performed by GC following derivatization to fatty acid methyl esters (FAMEs) [107]. This derivatization step improves volatility and thermal stability.
GC-FID is the detection method of choice for quantitative analysis due to its robustness and linear response over a wide concentration range. Seppänen-Laakso et al. [107] found that capillary GC with high-quality stationary phases enables sensitive, reproducible profiling of fatty acids, including complex geometric isomers—in human tissues, offering critical insights into dietary fat metabolism and the balance of essential polyunsaturated fatty acids in health.
Schlag et al. [108] proposed a novel gas chromatography with MS selected ion monitoring (GC/MS-SIM) method for the comprehensive analysis of sterols after saponification and silylation. In the proposed method, the vegetable oils were saponified, the unsaponifiable fraction were silylated and analyzed using GC–EI-MS with selected-ion monitoring, using pyrrolidide as an internal standard. This method enabled the precise profiling of 30 sterols and triterpenes [108].
The study of Park et al. [109] developed and validated a sensitive GC-MS/MS analytical method for quantifying 8 priority polycyclic aromatic hydrocarbons (PAHs) across 51 different herbal medicine matrices—employing tailored extraction and purification procedures to ensure accurate detection in diverse sample types.
For the analysis of vitamins D and K, derivatization of the sample is also required, as GC can be used to separate cis/trans isomers of vitamin K [110,111].
The complexity of nutraceutical matrices needs sample pre-treatment steps such as extraction, concentration, and chemical derivatization to enhance volatility and detectability of target compounds. Method validation data reported in the literature indicates excellent repeatability, sensitivity, and specificity, supporting GC as a reliable technique for routine quality control and research purposes [106,107,108,109,110,111].
In summary, GC methods provide essential capabilities for the characterization and quantification of volatile and semi-volatile nutraceutical compounds, complementing liquid-chromatography-based approaches. The combination of GC with MS detection broadens the analytical scope, enabling extensive profiling of bioactive components responsible for flavor, aroma, and nutritional value.
Among the new techniques being developed, it is believed that fast-GC/MS will have the most impact in the next decade for food analysis applications [60,61].
Among GC-based approaches, GC–MS is particularly valuable for nutraceutical analysis, as it enables both qualitative identification through spectral libraries and sensitive quantification of volatile bioactive compounds.
6.3. Mass-Spectrometry-Based Detection in Chromatographic Analysis
Mass spectrometry (MS) coupled with chromatographic separation (LC–MS, LC–MS/MS or GC–MS) is another highly employed technique of nutraceutical analysis. Schematic overview of the analytical workflow for analysis of nutraceutical by GC or LC is shown in Figure 6.
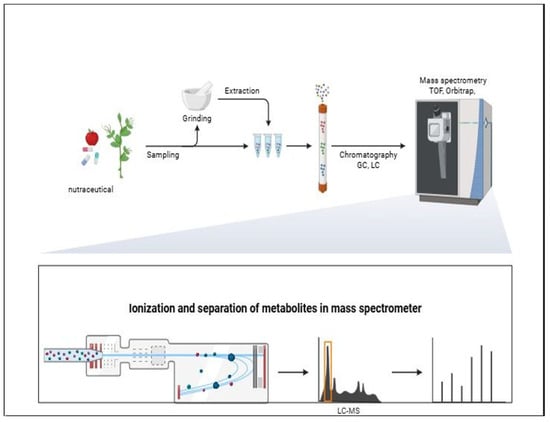
Figure 6.
Schematic overview of the analytical workflow for analysis of nutraceutical samples, including sampling, grinding, extraction, chromatographic separation, ionization, and mass spectrometric detection (TOF, Orbitrap). The lower panel illustrates ionization and separation of analytes within the mass spectrometer and subsequent signal detection. Created with BioRender.com.
MS provides superior selectivity and sensitivity compared to optical detectors, enabling confident identification, structural confirmation, and trace-level quantification in complex matrices. LC–MS is ideal for non-volatile and thermolabile compounds [15,17,52,57,58,87], whereas GC–MS is suited for volatile and semi-volatile constituents [67,68,105,108,109], including essential oils, fatty acids, sterols, and aroma compounds.
High-performance liquid chromatography coupled with quadrupole time-of-flight mass spectrometry has become a powerful analytical platform for the comprehensive characterization of bioactive compounds in complex food and nutraceutical matrices [87]. In this hyphenated technique, chromatographic separation minimizes matrix interferences, while the quadrupole enables precursor ion selection prior to high-resolution mass analysis by the time-of-flight detector. The QTOF analyzer provides accurate mass measurements with high resolving power, allowing reliable elemental composition assignment and structural elucidation of unknown or closely related compounds [87].
High-resolution chromatographic–mass spectrometric platforms such as UPLC–QTOF-MS have been successfully applied in untargeted metabolomics and chemometrics studies of complex herbal matrices, enabling comprehensive profiling and differentiation of phytochemical composition across environmental factors and geographical origins. For example, UPLC-QTOF-MS was employed to profile flavonoids and other metabolites in Acer truncatum leaves used as traditional herbal tea, demonstrating its utility for detailed metabolite characterization in a complex plant matrix [87].
7. Raman Fourier-Transform Infrared Spectroscopy (FTIRNear-Infrared Spectroscopy (NIR)
Raman spectroscopy is an analytical technique that uses scattered light to provide information about the molecular vibrations, structure and chemical composition of a sample. This technique is non-destructive, and the sample can often be analyzed without additional sample preparation steps [112,113,114,115].
A rapid, non-destructive, and cost-effective method using Raman microspectroscopy combined with chemometrics (PCA and HCA) to detect l-Cysteine and l-Cystine adulteration in wheat flour was developed by Chebi et al. [74]. They achieved a detection limit of 0.125% (w/w) and successfully differentiated authentic from adulterated samples with 100% accuracy within the 500–2000 cm−1 fingerprint spectral range.
The quality of essential oils is usually controlled via GC, although with limitations when adulterants are non-volatile substances. Jentzsch et al. [116] demonstrated that Raman spectroscopy, combined with chemometric analysis, PCA can reliably detect non-volatile adulterants in essential oils, offering a rapid, non-destructive method for quality control. They [116] examined the essential oils of Lavandula angustifolia Mill., Mentha piperita L. and Pogostemon cablin Benth, and their adulterated versions were measured by GC coupled with flame ionization detectors (GC-FID) and Raman spectroscopy.
Raman spectroscopy has several advantages over FTIR and NIR, as shown in Table 7.
Table 7.
Comparison table between Raman, FTIR and NIR.
Each molecule has a unique Raman spectrum; unlike infrared (IR) spectroscopy, Raman can work well in aqueous environments, there is minimal water interference, and the method works for solid, liquid and gaseous samples.
Infrared (IR) techniques such as FTIR and NIR have a pivotal role in rapid, non-destructive screening for food authentication and detection of adulteration [73]. Portable infrared devices combined with multivariate statistical tools (PCA, PLS,) enable real-time, field-based authenticity assessments in food matrices ranging from oils to syrups and dairy [75]. Spectral fingerprinting, focusing on specific absorption bands, allows for the classification of authentic samples vs. adulterated ones with high accuracy—ensuring product integrity and addressing fraud. There is growing integration of machine learning and chemometric approaches with IR data to enhance sensitivity and selectivity in detecting subtle compositional differences among food samples.
FTIR spectroscopy is increasingly used as a rapid, non-destructive, and reagent-free technique for the identification and authentication of nutraceutical products. By measuring characteristic molecular vibrations, FTIR enables qualitative and semi-quantitative analysis of functional groups present in plant-based and formulated products, offering a powerful tool for quality control (QC), adulteration detection, and product standardization [25,73]. Its minimal sample preparation requirements, often just drying or forming a thin film, make it especially useful for routine quality control and authenticity verification of plant-based materials [73,74,75,76,77].
FTIR provides rapid fingerprinting of nutraceuticals and is effective in detecting functional groups such as –OH, –NH, and C=O, identifying key functional groups characteristic of polyphenols, flavonoids, lipids, proteins, and polysaccharides in complex botanical matrices [76]. ATR-FTIR is particularly favored due to its ease of use and capability to analyze solid and semi-solid samples without sample preparation [75,77].
The “fingerprint region” (600–1500 cm−1) in FTIR spectra is particularly useful for differentiating complex matrices without the need for separation or derivatization steps. For example, bioactive components in herbal supplements can be rapidly profiled by comparing their infrared spectra to authenticated references [75,76].
Typical applications include fingerprinting for species authentication, monitoring lipid oxidation states in oils, assessing protein secondary structures, and characterizing carbohydrate compositions [73,76,77,78].
Recent applications have demonstrated FTIR capability in detecting adulteration in nutraceuticals, such as dilution with starch, synthetic fillers, or substitution with less expensive plant materials [75].
Coupling FTIR with chemometric methods such as PCA and PLS enhances sensitivity and allows for robust classification and quantification [77]. The study of Cahya et al. [77] showed that FTIR-ATR spectroscopy combined with multivariate calibration (PLSR and PCR) as well as discriminant analysis (DA) enables accurate detection and quantification of synthetic drug adulterants prednisone and metamizole in complex ternary herbal medicine mixtures, providing a rapid, non-destructive, and cost-effective authentication approach.
Another study demonstrated that FTIR spectroscopy combined with chemometric analysis and micro-FTIR imaging can effectively detect and spatially map adulterants in turmeric, confirming that FTIR is a powerful tool for food authentication and quality control [78].
Ensemane et al. [79] established that PLS-FTIR spectroscopy enables rapid, accurate, and solvent-efficient quantification of phenolic acids in medicinal plant extracts, offering a reliable alternative to conventional chromatographic methods.
The study by Choi et al. [95] demonstrates that FT-IR spectroscopy, combined with multivariate analysis, can rapidly and effectively distinguish Panax ginseng powder from various root plant adulterants. PCA revealed distinct clusters between pure and adulterated ginseng samples, while PLS models achieved high prediction accuracy for key ginsenosides and aromatic compounds, indicating the feasibility of FT-IR as a tool for quality control in ginseng products [95].
Çebi et al. [112] developed a rapid ATR-FTIR spectroscopic method combined with chemometric techniques (HCA and PCA) to detect illicit adulteration of sibutramine in green tea, green coffee, and mixed herbal tea samples. Using the spectral window from 2746 to 2656 cm−1, the method achieved 100% accuracy in distinguishing between adulterated and unadulterated samples—with no false positives or negatives [112].
In their review, Bunaciu and Aboul-Enein [113] analyze the application of FTIR spectroscopy in detecting adulteration in both chemical and herbal pharmaceutical products. It highlights FTIR’s effectiveness in identifying counterfeit drugs, assessing quality control, and monitoring modifications in drug formulations. Coupling FTIR with chemometric methods such as PCA and Cluster Analysis (CA) enhances the accuracy and reliability of adulteration detection.
The FTIR spectra of Figure 7 shows distinct differences between the non-fermented and fermented olive leaf extracts [117]. Key changes in the absorbance peaks indicate alterations in functional groups, which may be attributed to the fermentation process. For example, shifts in the 3283 cm−1 and 2924 cm−1 peaks in the EtOH extract suggest modifications in hydroxyl and methylene groups, while similar trends can be observed in the EtOAc extracts at 2925 cm−1. These spectral variations highlight the impact of fermentation on the chemical composition of olive leaf extracts [117].
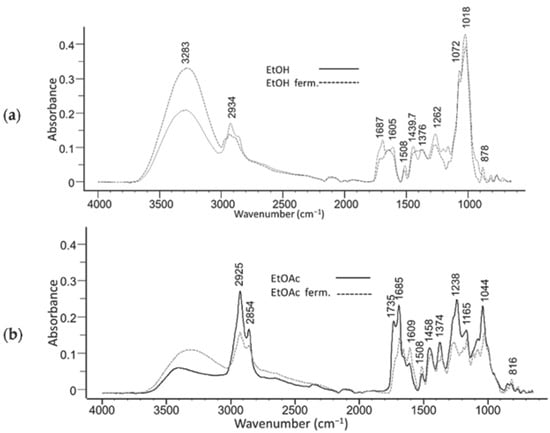
Figure 7.
FTIR spectra of non-fermented and fermented olive leaf extracts prepared using ethanol (EtOH) (a) and ethyl acetate (EtOAc) (b). Spectral changes indicate modifications in key functional groups due to fermentation. Reproduced from [117] under CC BY 4.0.
In summary, FTIR spectroscopy is a rapid, non-destructive, and cost-effective method for identifying and quantifying active pharmaceutical ingredients and contaminants/adulterants in both synthetic and herbal drugs. It also proves to be a powerful complementary technique in the multi-analytical toolkit for ensuring the quality, safety, and efficacy of nutraceutical products (Table 8).
Table 8.
Target analytes and key information obtained from FTIR analysis.
NIR is another rapid, non-destructive, and eco-friendly method favored in nutraceutical quality control that requires minimal to no sample preparation [90]. It analyzes overtone and combination vibrations of C–H, N–H, and O–H bonds, making it effective for handling powders, tablets, and capsules [89,90].
When paired with chemometric modeling, NIR enables authentication and classification of bioactive compounds such as polyphenols, vitamins, and amino acids [91]. It supports the process of analytical technology in manufacturing by delivering real-time, reagent-free analysis [91,92,93].
A study from 2010 achieved near-perfect correlation (R2 > 0.98) between NIR-PLSR quantification of total phenolics in grape seed supplements and FC assays [94].
NIR can also detects adulteration in herbs. The study of Galvin-King et al. [114] demonstrates that both NIR and FTIR spectroscopy, coupled with chemometric analysis, can effectively detect various adulterants in garlic samples. The models developed for NIR and FTIR data achieved high R2 and Q2 values, indicating robust predictive capabilities for identifying adulteration in garlic.
A comprehensive review by Fodor et al. [25] highlights the advancements in NIR spectroscopy over the past two decades, emphasizing its fundamental role in food quality assurance. The authors draw attention to NIR spectroscopy’s capability for rapid, non-destructive analysis of various food products, including meats, dairy, baked goods, fruits, vegetables, and luxury items like coffee, tea, and chocolate. The review underscores the integration of chemometric techniques, such as PCA and HCA, which enhance the precision and reliability of NIR-based analyses. Furthermore, the study discusses the evolution of NIR instrumentation and its growing application in detecting food adulteration, determining authenticity, assessing origin, and evaluating maturity. The authors also address the challenges associated with NIR spectroscopy, such as the need for calibration with reference methods and the variability introduced by sample heterogeneity. Despite these challenges, NIR spectroscopy continues to be a valuable tool in the food industry, offering a balance between efficiency, accuracy, and environmental sustainability.
Table 9 summarizes the major NIR applications in combination with chemometric approaches in nutraceutical analysis, highlighting target analytes, sample sources, and data-processing techniques.
Table 9.
Applications of NIR in nutraceutical analysis.
8. Nuclear Magnetic Resonance (NMR)
NMR is another powerful and non-destructive analytical technique widely used for structural elucidation, quantification, and metabolomic profiling of nutraceuticals [80].
Quantitative 1H NMR provides a precise, versatile, and non-destructive method for the accurate quantification of natural products without the need for reference standards [81,82,83].
Advantages such as minimal sample preparation, absolute quantification without reference standards, and insightful data on molecular environments are making NMR ideal for identifying active compounds and monitoring formulation integrity [25,81,82,83]. It excels in elucidating structures of polyphenols, alkaloids, carotenoids, and terpenoids. Using 1H and 13C NMR enables the characterization of curcuminoids in turmeric supplements with high specificity [83,85,89].
Quantitative NMR is increasingly trusted in regulatory and industrial applications. NMR-based metabolomics also allows fingerprinting of extracts, their geographic origin discrimination, and adulteration detection through profiles analyzed via PCA and OPLS-DA [86,87]. One study even used 1H NMR spectra to distinguish authentic ginseng from spiked samples [88].
Figure 8 presents quantitative qHNMR spectra of Pueraria lobata extracts obtained by methanolic sonication (PLs) and methanolic reflux (PLr), compared with seven major reference isoflavones (1–7) [85]. Panel (a) shows expanded spectral regions corresponding to structurally diagnostic proton environments, while panel (b) displays the full spectral range, illustrating overall matrix complexity and signal distribution [85].
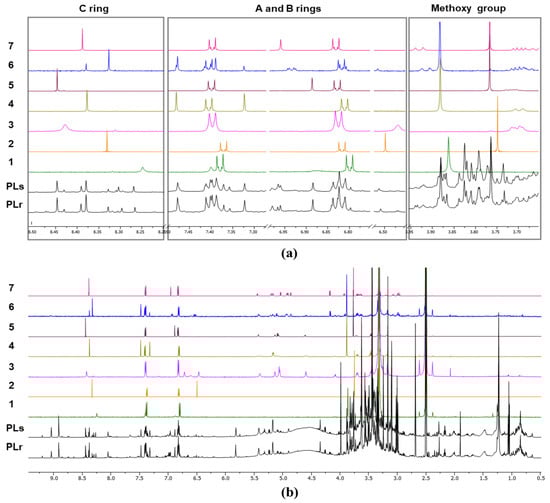
Figure 8.
Quantitative qHNMR spectra of Pueraria lobata methanolic extracts obtained by sonication (PLs) and reflux (PLr), compared with seven major reference isoflavones (1–7). (a) Expanded spectral regions highlighting diagnostic aromatic protons of the A, B, and C rings and methoxy group signals; (b) full qHNMR spectra showing overall matrix complexity and signal distribution. Reproduced from [85] under CC BY 4.0 license.
In the expanded spectra (Figure 8a), the downfield aromatic region (δ ~6.5–8.5 ppm) contains well-resolved signals arising from protons on the A, B, and C rings of the isoflavone skeleton. These resonances are highly characteristic and structurally specific, making them particularly suitable for both identification and quantification by qHNMR.
The reference isoflavones (1–7) exhibit sharp, well-defined singlets and doublets in these regions, reflecting their high purity and simple chemical environments. Corresponding signals are clearly observable in both PLs and PLr extracts, confirming the presence of these isoflavones in the complex botanical matrix. Notably, the PLr extract shows higher signal intensities and improved resolution in the aromatic region compared to PLs, indicating enhanced extraction efficiency under reflux conditions and reduced signal suppression by matrix components.
The methoxy proton signals appear in the δ ~3.7–3.9 ppm region (Figure 8a, right panel). These resonances are diagnostic for O-methoxylated isoflavones and provide an additional level of structural confirmation. In the PLr extract, methoxy signals closely match those of the reference compounds in both chemical shift and relative intensity, supporting compound-specific authentication. In contrast, the PLs extract exhibits weaker methoxy signals and increased baseline distortion, consistent with partial extraction and greater matrix interference.
The full qHNMR spectra (Figure 8b) highlight the complexity of crude nutraceutical extracts. The aliphatic region (δ ~0.5–4.5 ppm) is dominated by overlapping signals from sugars, amino acids, organic acids, and other primary metabolites co-extracted with the target isoflavones. These signals contribute to spectral congestion and emphasize the importance of selecting non-overlapping, structurally specific resonances—typically in the aromatic region—for reliable qHNMR integration.
Despite this complexity, qHNMR enables simultaneous qualitative and quantitative assessment by integrating selected, well-resolved proton signals that are insensitive to matrix variation. The comparison between PLs and PLr demonstrates that extraction pre-treatment strongly influences spectral quality, signal-to-noise ratio, and quantitative reliability [85].
Overall, the spectra illustrate the suitability of qHNMR as a robust tool for nutraceutical quality control and authentication. The direct comparison of crude extracts with authentic reference compounds allows theconfirmation of identity, assessment of extraction efficiency, and detection of compositional differences arising from processing conditions. The superior spectral clarity observed for the reflux extract highlights the importance of standardized sample pre-treatment to ensure reproducible and regulatorily acceptable qHNMR-based analysis.
9. Elemental Profiling
9.1. Atomic Absorption Spectroscopy (AAS)
AAS is an established method for quantifying trace metals such as lead, cadmium, arsenic and essential minerals like iron, zinc, magnesium, calcium, copper in nutraceuticals [23,94]. AAS usually requires sample digestion and is compatible with tablets, capsules, and herbal matrices.
Both flame AAS (FAAS) and graphite furnace AAS (GFAAS) provide high selectivity and sensitivity at ppm to ppb levels, and are routinely used under pharmacopeial standards for elemental profiling. AAS affordability and simplicity make a practical alternative to ICP-MS and ICP-OES for routine quality control and safety assessment.
Applications include verifying fortification, quantifying essential elements, and detecting toxic metal contamination [96,97,98].
A study by Hina et al. [120] demonstrated that FAAS effectively quantifies both essential minerals Cu, Co, Ni, Zn, Fe, and Cr and toxic heavy metals like Pb, and Cd, which were determined in medicinal plant J. adhatoda, highlighting variations in elemental distribution that are critical for safety and therapeutic efficacy.
In their recent review [120], the authors highlighted that GFAAS is a highly sensitive and precise method for quantifying trace metals in medicinal plants, supporting quality control and safety assessment. The authors also noted that GFAAS allows direct analysis of dried plant samples as a slurry or pulverized solid, requiring only small, well-homogenized amounts to ensure representative and accurate measurements as an advantage over ICP-MS technique. The plant material, mostly dried, must be introduced into the graphite tube as slurry or directly in pulverized form [120].
Table 10 shows nutraceuticals analyzed by FAAS, and it highlights that in this type of analysis, GFAAS is the preferred technique.
Table 10.
Determination of trace and toxic elements in plant-based nutraceuticals by AAS.
9.2. Inductively Coupled Plasma-Based Techniques
Inductively coupled plasma (ICP) techniques represent advanced elemental analysis approaches capable of detecting and quantifying both trace and major elements in complex nutraceutical and dietary supplement matrices. ICP-OES employs a high-temperature argon plasma to excite atoms and ions, which emit element-specific radiation measured by optical detectors. This technique offers rapid simultaneous multi-element analysis, a wide dynamic range, and good tolerance to matrix interferences, making it particularly suitable for mineral profiling in herbal products and fortified foods [28].
ICP-MS also relies on plasma for ionization but analyzes ions based on their mass-to-charge (m/z) ratios. This technique offers exceptionally low detection limits (ng/L to pg/L), high selectivity, and isotopic resolution, making it ideal for detecting heavy metals like lead, arsenic, cadmium, and mercury in nutraceuticals.
Inductively Coupled Plasma–Mass Spectrometry (ICP-MS)
Inductively coupled plasma–mass spectrometry (ICP-MS) is one of the most powerful analytical techniques for the determination of trace and ultra-trace elements in nutraceuticals, offering high sensitivity, wide linear dynamic range, and multi-element detection capability. Its application is particularly relevant for the assessment of essential minerals, trace elements, and potentially toxic metal(loid)s, which are critical parameters for safety, quality control, and regulatory compliance of dietary supplements and herbal products [27,29,97,129].
Mineral composition and heavy metal contamination are tightly regulated due to their direct implications for consumer safety. International regulatory bodies such as EFSA, FDA, WHO, and pharmacopeial organizations emphasize the monitoring of elements such as Pb, Cd, Hg, As, Ni, and Cr in nutraceuticals, alongside nutritionally relevant elements including Fe, Zn, Cu, Mn, Ca, Mg, and Se [1,5,7,8,9,19]. ICP-MS is widely recognized as a reference technique capable of meeting these stringent regulatory requirements due to its low detection limits and robustness [29].
Accurate ICP-MS analysis relies heavily on appropriate sample preparation to ensure complete matrix decomposition and quantitative element recovery. Microwave-assisted acid digestion is the most applied pre-treatment approach for nutraceutical matrices, including plant materials, extracts, tablets, and capsules. This procedure typically employs nitric acid, often combined with hydrogen peroxide, to achieve efficient digestion while minimizing contamination and analyte loss [27,129].
Such digestion protocols are essential for complex botanical matrices rich in organic compounds, which may otherwise cause signal suppression or spectral interferences during plasma ionization [29].
ICP-MS has been extensively applied to evaluate toxicological risks associated with heavy metal contamination in herbal medicines and dietary supplements. Studies have demonstrated its effectiveness in detecting potentially hazardous levels of Pb, Cd, Hg, As, Ni, and Cr in commercial nutraceutical products, supporting risk assessment and regulatory enforcement [97].
In addition to safety monitoring, ICP-MS is used to quantify essential and trace elements contributing to the nutritional value of supplements. Elemental profiling provides insight into geographical origin, cultivation conditions, soil-to-plant transfer, and processing effects, which are increasingly relevant for authenticity assessment and quality assurance [130].
Beyond quantification, ICP-MS elemental fingerprints can be combined with chemometric tools to discriminate nutraceuticals based on botanical origin, geographical provenance, or manufacturing process. Variations in elemental composition have been successfully used as authenticity markers, particularly when integrated with multivariate statistical analysis [38]. This approach enhances the role of ICP-MS from a purely quantitative technique to a complementary tool for nutraceutical authentication.
Despite its advantages, ICP-MS requires careful control of spectral and non-spectral interferences, often addressed through collision/reaction cell technology or internal standardization. Additionally, the technique provides elemental but not chemical speciation information, necessitating complementary methods when oxidation state or bioavailability is of interest [27,29].
Some of the nutraceuticals analyzed by AAS were also analyzed by ICP-MS or ICP OES (see Table 11).
Table 11.
Trace element analysis of nutraceuticals by ICP.
These techniques for elemental methods of analysis have their advantages and limitations in quality control, regulatory compliance, and safety assurance of nutraceutical and functional food products.
As we can tell for elemental analyses of nutraceuticals, acid digestion or microwave-assisted mineralization is required to ensure complete breakdown of complex plant and formulation matrices prior to instrumental measurement. Among the studies summarized, only the analysis of Valeriana officinalis did not involve a dedicated sample preparation step, as the authors applied direct analysis of the herbal material [128]. In contrast, all other studies [122,123,126,129,130,131,132,133] employed various wet digestion protocols using concentrated nitric acid, hydrogen peroxide, sulfuric acid, or perchloric acid, either alone or in combination.
The choice of digestion strategy was closely related to the analytical technique employed, with GFAAS typically using conventional wet digestion, while ICP-based techniques frequently relied on microwave-assisted digestion to achieve complete mineralization and minimize matrix effects. These sample preparation approaches are summarized in Table 12.
Table 12.
Overview of sample digestion and preparation methods applied prior to elemental analysis of nutraceutical matrices by AAS or ICP.
Overall, GFAAS is frequently favored for targeted elemental determination using conventional wet digestion, whereas ICP-based techniques, particularly ICP-MS, benefit from microwave-assisted digestion to support multi-elemental analysis with enhanced sensitivity and reduced matrix effects.
Although elemental analysis is still not routinely performed for nutraceuticals, determining the elemental composition of plants is essential—not only for monitoring toxic elements but also for accurately quantifying essential elements, whose concentrations can fluctuate over time and vary with geographical origin, environmental conditions, and cultivation practices [133]. Ginkgo seeds were analyzed for Fe, Zn, Cu content by ICP-MS [134]. The sample was mineralized with 2 mL of conc. HNO3 and 1 mL of deionized water at 190 °C in a microwave oven (ramp for 20 min, hold for 20 min, and cool for 10 min).
While ICP-MS is primarily applied for elemental determination, mass spectrometry as a broader analytical platform extends beyond elemental profiling and plays a central role in the molecular identification, quantification, and structural characterization of nutraceutical constituents. Owing to its high sensitivity and selectivity, mass spectrometry—often coupled with chromatographic separation—has become indispensable for the comprehensive analysis of complex nutraceutical matrices.
10. DNA Barcoding and PCR-Based Assays
In addition to chemical and spectroscopic methods, molecular approaches such as DNA barcoding and next-generation sequencing provide powerful tools for verifying species identity and detecting adulteration in complex food and nutraceutical matrices, supporting comprehensive authenticity assessment [135].
DNA barcoding and PCR-based assays provide accurate botanical identification, which is critical for preventing adulteration and substitution in herbal products [18].
DNA barcoding typically targets short, standardized regions of DNA, such as the chloroplast rbcL and matK genes, which are conserved within species, yet sufficiently variable to enable discrimination [18,36,37].
The process involves few sample steps: first, the DNA is extracted from the sample, second is the PCR amplification of the barcode region using specific primers, the third step is sequencing of the amplified DNA, and finally a comparison of the obtained results with a reference database (BOLD, GenBank) is carried out to confirm species identity.
PCR-based assays—including conventional PCR, real-time PCR, and multiplex PCR—enable rapid, sensitive, and specific detection of target DNA even from degraded or processed samples. These techniques are essential for species-level identification, contamination detection, and label claim verification [136]
Among DNA-based techniques, quantitative real-time PCR (qPCR) remains the gold standard for accurate and sensitive detection of extraneous/foreign matter of biological origin [136].
The study of Behr et al. [136] developed green-based real-time qPCR assays to specifically detect the five most common adulterants in six widely used spices and herbs—paprika (chili), turmeric, saffron, cumin, oregano, and black pepper.
Another study developed and validated a qPCR-based method capable of detecting and quantifying hazelnut and almond DNA in olive oil with high sensitivity, enabling reliable identification of nut-derived adulteration for food authentication and allergen risk assessment [137].
Highly sensitive qPCR-based assays are developed for detecting and quantifying species-specific DNA in milk and dairy products, enabling accurate identification of adulteration and ensuring authenticity in the dairy supply chain [138].
Eight yam landraces from two species (D. alata and D. polystachya) were analyzed with nano-liquid chromatography–tandem mass spectrometry (nanoLC-MS), protein identification, RNA isolation and qRT-PCR analysis [138]. The study revealed significant inter- and intraspecific differences in allantoin, phenol, and flavonoid contents between D. polystachya and D. alata.
The double-tube multiplex TaqMan qPCR assay, capable of simultaneously detecting eight dairy-derived components with high specificity and sensitivity, is another powerful tool for dairy authentication and adulteration control [139].
Another high-throughput method that can analyze entire genomes or specific genetic regions is NGS. NGS enhances DNA barcoding by enabling parallel sequencing of many samples at once. and offers parallel sequencing of millions of DNA fragments, providing an advanced approach for authenticating multi-ingredient or processed nutraceutical products [140].
It is a powerful tool for detecting adulterants in various matrices including food, pharmaceuticals, and other products. By analyzing the genetic material of suspected adulterants, NGS can identify the presence, origin, and even the quantity of these substances, providing a more precise and comprehensive approach compared to traditional methods [140].
The evolution of DNA barcoding in herbal medicine analysis and application is summarized in the review of Chen et al. [141], emphasizing its expansion from standard barcodes to super- and mini-barcodes, integration with advanced molecular techniques, and the development of comprehensive reference libraries to improve species authentication and quality control.
The study of Sánchez et al. [142] combined DNA barcoding for species authentication with UHPLC–MS metabolomics to simultaneously verify the identity and characterize the chemical profiles of medicinal plant samples (Matricaria recutita L., Valeriana officinalis L., Tilia spp., and Camellia sinensis (L.)). The DNA barcoding, using matk as a barcode marker, revealed that CH1, sold as Camellia sinensis was Blepharocalyx tweediei, and sample TS2, sold as linden, belong to Malvales.
11. Emerging Analytical Trends in Nutraceutical Analysis
Recent advances in analytical methodologies have transformed the quality control and characterization of nutraceuticals. Among these, several emerging trends are shaping the field, as detailed below.
11.1. Biosensors
Electrochemical and optical biosensors provide rapid, sensitive, and on-site alternatives to conventional techniques such as chromatography and mass spectrometry [27,28,29,30,143]. These devices employ biorecognition elements and electrode-based transduction (amperometric, potentiometric, impedance) to detect contaminants, toxins, allergens, pesticides, and bioactive compounds directly within complex matrices. For example, Kundu et al. [144] developed a flower-like α-Fe2O3 nanostructured electrochemical biosensor capable of detecting formaldehyde in fruit juices at nanomolar levels. Biosensors offer real-time screening, although challenges remain in terms of cost and labor-intensive fabrication [145]. Recent applications include detection of vitamins [145] and polyphenols [146].
11.2. Chemometrics
Chemometrics applies statistical and mathematical modeling techniques to extract meaningful information from complex analytical datasets. In recent years, it has become increasingly integrated with chromatographic [69], spectroscopic [74,75,77,114], and elemental analytical techniques [141,142], significantly improving data interpretation, classification, authentication, and quality assessment in food and nutraceutical analysis. Widely used chemometric approaches—including PCA, PLS, HCA, discriminant analysis, and orthogonal PLS–discriminant analysis (OPLS-DA)—enable efficient pattern recognition, detection of adulteration, authentication of raw materials, and optimization of quality control protocols [38,42,69,74,86,87,91,147].
Numerous practical applications demonstrate the effectiveness of chemometrics in food and nutraceutical quality control. For example, Raman spectroscopy combined with chemometric modeling enabled the detection of L-cysteine and L-cystine adulteration in wheat flour with 100% accuracy [74]. Similarly, femtosecond laser ablation inductively coupled plasma mass spectrometry (fsLA-ICP-MS), when coupled with chemometrics, has been successfully applied for multi-elemental profiling of garlic and onion, facilitating reliable authenticity assessment based on elemental fingerprints [148].
Chemometrics also plays a critical role in the quality control of dietary supplements, particularly those with complex formulations. A notable example includes the simultaneous analysis of structurally related bioactive amines and caffeine in weight-loss and pre-workout supplements [149]. Conventional chromatographic techniques, although effective, often require extensive sample preparation due to matrix interferences from co-extracted phytochemicals such as flavonoids, polyphenols, and essential oils. To overcome these limitations, multivariate calibration models—including PLS-1, genetic algorithm–PLS and genetic algorithm–artificial neural networks—have been successfully employed for the simultaneous quantification of 2-phenethylamine, caffeine, p-synephrine, and p-hordenine in complex nutraceutical matrices [150]. These chemometric strategies enable rapid, non-destructive, and cost-effective analyses while enhancing classification accuracy, adulteration detection, and regulatory compliance [151]. By exploiting full spectral information from UV–Vis and other spectroscopic techniques, chemometrics provides robust and selective quantification even in highly complex matrices, underscoring its growing importance in modern nutraceutical standardization and quality assurance [152].
The integration of portable spectroscopic devices with chemometric tools further expands the applicability of these approaches. Portable infrared instruments combined with PCA and PLS models allow real-time, field-based authenticity assessments across a wide range of food matrices, including edible oils, syrups, and dairy products [74]. NIR and FTIR coupled with chemometric analysis have also demonstrated strong capabilities for detecting adulteration in herbal products. Galvin-King et al. [114] reported robust predictive performance for both NIR- and FTIR-based models in identifying adulterants in garlic samples, as reflected by high R2 and Q2 values.
NMR-based metabolomics represents another powerful chemometric-driven approach for nutraceutical authentication. qNMR fingerprinting combined with PCA and OPLS-DA has been successfully applied to discriminate extracts based on geographic origin and to detect adulteration [86,87]. In one study, NMR spectra enabled clear differentiation between authentic ginseng samples and those intentionally spiked with adulterants [88]. Complementary spectroscopic techniques have yielded similar outcomes: Choi et al. demonstrated that FT-IR spectroscopy combined with multivariate analysis could effectively distinguish Panax ginseng powder from various root plant adulterants. PCA revealed distinct clustering between pure and adulterated samples, while PLS models achieved high predictive accuracy for key ginsenosides and aromatic compounds, confirming the suitability of FTIR for ginseng quality control [95].
More recently, Çebi et al. [112] developed an ATR-FTIR method coupled with HCA and PCA for detecting illicit sibutramine adulteration in green tea, green coffee, and mixed herbal tea products. Using a targeted spectral window (2746–2656 cm−1), the method achieved 100% classification accuracy, with no false positives or false negatives reported. Collectively, these studies highlight the versatility and robustness of chemometric-assisted analytical techniques in addressing the growing challenges of authenticity, adulteration detection, and quality control in food and nutraceutical products.
11.3. Lab-on-a-Chip and Miniaturized Platforms
Microfluidic lab-on-a-chip systems integrate sample preparation, separation, and detection in a single miniaturized device. These platforms enable rapid, low-volume, and cost-effective analysis, particularly suitable for high-throughput screening in nutraceutical development [153].
11.4. Portable and Hand-Held Spectrometers
Advances in portable NIR, Raman, and UV-Vis spectroscopy enable in-field analysis of raw materials, facilitating rapid quality control and authentication without the need for centralized laboratories [154].
11.5. Multi-Technique Integration and AI-Driven Analysis
The future of nutraceutical analysis lies in the combination of chromatographic, spectroscopic, and elemental techniques with chemometric modeling and AI/ML [155]. This multi-technique approach enhances reliability, selectivity, and sensitivity, enabling comprehensive detection, authentication, and standardization of nutraceuticals, functional foods, and dietary supplements. Such integration ensures product safety, efficacy, and consumer confidence in an increasingly complex global market.
12. Disadvantages of the Manuscript
While this review comprehensively covers commonly applied analytical techniques for the characterization, authentication, and quality control of nutraceuticals, several limitations should be acknowledged.
First, advanced protein structural characterization techniques—such as ion-exchange chromatography, size-exclusion chromatography, electrophoretic methods, circular dichroism, and fluorescence spectroscopy—are primarily applied for detailed molecular and conformational studies. These methods fall outside the scope of routine analytical approaches focused on multi-class bioactive compounds and were therefore not included. A dedicated review would be required to cover these specialized protein-based analyses adequately.
Second, physicochemical characterization of fats and oil-based nutraceutical products—including acid value, saponification value, iodine value, ester value, peroxide value, specific gravity, refractive index, and total ash content—is also not included [156]. These parameters are important for assessing quality, stability, and oxidative status of oil-based nutraceuticals, but they represent well-established and standardized testing procedures. Incorporating them would extend the scope beyond analytical methodologies for compositional and instrumental characterization.
By clarifying these limitations, this review maintains its focus on analytical techniques capable of addressing complex matrices, trace-level contaminants and adulteration challenges specific to modern nutraceutical products while acknowledging areas that require separate, specialized discussion.
13. Conclusions and Future Perspectives
This review presents a comprehensive overview of analytical methodologies applied to nutraceuticals, covering chromatographic, spectroscopic, and elemental analysis techniques (Figure 9). Classical methods such as HPLC, GC, AAS, and ICP-MS remain indispensable for accurate quantification, identification, and safety assessment of bioactive compounds, vitamins, polyphenols, fatty acids, and trace elements in complex matrices.

Figure 9.
Overview of analytical techniques used in nutraceutical analysis, including spectroscopic, chromatographic, elemental, molecular, and chemometric methods.
Emerging analytical trends are rapidly transforming the field. The integration of chemometrics with chromatographic, spectroscopic, and elemental data enables pattern recognition, classification, adulteration detection, and optimization of quality control protocols. Advanced biosensors, lab-on-a-chip platforms, and portable spectrometers offer rapid, non-destructive, and cost-effective alternatives, facilitating in-field screening, authentication, and real-time monitoring. These innovations not only enhance data interpretation but also strengthen reproducibility, reliability, and standardization in nutraceutical quality control.
Looking forward, the future of nutraceutical analysis lies in multi-technique integration, combining classical separation methods with advanced detection, chemometrics, and predictive modeling. Such approaches will allow comprehensive profiling of complex formulations, improve regulatory compliance, and support the development of safe, effective, and high-quality functional foods and dietary supplements. Continuous methodological advancements and adoption of emerging technologies will be pivotal in ensuring consumer safety, confidence, and trust in the global nutraceutical market.
Funding
This research received no external funding.
Institutional Review Board Statement
Not applicable.
Informed Consent Statement
Not applicable.
Data Availability Statement
This article is a review and does not report original data. Therefore, no new data were generated or analyzed, and data sharing is not applicable.
Conflicts of Interest
The author declares no conflicts of interest.
Abbreviations
The following abbreviations are used in this manuscript:
| DSHEA | Dietary Supplement Health and Education Act |
| FDA | Food and Drug Administration |
| EFSA | European Food Safety Authority |
| ICH | International Council for Harmonisation of Technical Requirements for Pharmaceuticals for Human Use |
| WHO | World Health Organization |
| USP | United States Pharmacopeia |
| UV-Vis | Ultraviolet–Visible Spectroscopy |
| EP | European Pharmacopoeia |
| JP | Japanese Pharmacopoeia |
| LOD | Limit of Detection |
| LOQ | Limit of Quantification |
| PCR | Polymerase Chain Reaction |
| DNA | Deoxyribonucleic Acid |
| PDA | Photodiode Array |
| MS | Mass Spectrometry |
| AAS | Atomic Absorption Spectroscopy |
| LC-MS/MS | Liquid Chromatography–Tandem Mass Spectrometry |
| ICP | Inductively Coupled Plasma |
| ICP-MS | Inductively Coupled Plasma Mass Spectrometry |
| ICP-OES | Inductively Coupled Plasma Optical Emission Spectrometry |
| HPLC | High-Performance Liquid Chromatography |
| GC | Gas Chromatography |
| GC-MS | Gas Chromatography–Mass Spectrometry |
| FID | Flame Ionization Detector |
| 1H-NMR | Proton Nuclear Magnetic Resonance Spectroscopy |
| TLC | Thin-Layer Chromatography |
| FTIR | Fourier-Transform Infrared Spectroscopy |
| QC | Quality Control |
| DAD | Diode-Array Detection |
| ESI-MS | Electrospray Ionization–Mass Spectrometry |
| RP | Reverse-Phase |
| RP-HPLC-DAD | Reverse-Phase High-Performance Liquid Chromatography with Diode-Array Detection |
| qTOF-MS | Quadrupole Time-of-Flight Mass Spectrometry |
| CA | Cluster Analysis |
| PCA | Principal Component Analysis |
| PLS | Partial Least Squares Regression |
| PLS-DA | Partial Least Squares-–Discriminant Analysis |
| UPLC | Ultra Performance Liquid Chromatography |
| U-HPLC | Ultra-High-Performance Liquid Chromatography |
| HCA | Hierarchical Cluster Analysis |
| NIR | Near-Infrared |
| IR | Infrared |
| PAT | Process Analytical Technology |
| DPPH | 1,1-diphenyl-2-picrylhydrazyl |
| ABTS | 2,2′-azino-bis(3-ethylbenzothiazoline-6-sulfonic acid |
| TPTZ | Iron[III]-2,4,6-Tripyridyl-S-Triazine |
| ATR-FTIR | Attenuated Total Reflectance Fourier-Transform Infrared Spectroscopy |
| FRAP | Ferric Reducing Antioxidant Power |
| LLE | Liquid-Liquid Extraction |
| SPE | Solid-Phase Extraction |
| FC | Folin–Ciocalteu |
| FAME | Fatty Acid Methyl Esters |
| ORAC | Oxygen Radical Absorbance Capacity |
| CUPRAC | Cupric Reducing Antioxidant Capacity |
| TFC | Total Flavonoid Content |
| TEAC | Trolox Equivalent Antioxidant Capacity |
| FAAS | Flame Atomic Absorption Spectrometry |
| GFAAS | Graphite Furnace Atomic Absorption Spectrometry |
| LC | Liquid Chromatography |
| qPCR | Quantitative Real-Time PCR |
| nanoLC-MS | Nano-Liquid Chromatography–Tandem Mass Spectrometry |
| MTBE | Methyl Tert-Butyl Ether |
| NGS | Next-Generation Sequencing |
| OPLS-DA | Orthogonal PLS–Discriminant Analysis |
| fsLA-ICP-MS | Femtosecond Laser Ablation Inductively Coupled Plasma Mass Spectrometry |
References
- Bagchi, D.; Preuss, H.G.; Swaroop, A. Nutraceutical and Functional Food Regulations in the United States and Around the World, 2nd ed.; Academic Press: Cambridge, MA, USA, 2014; ISBN 978-0-12-405870-5. [Google Scholar]
- DeFelice, S.L. The nutraceutical revolution: Its impact on food industry R&D. Trends Food Sci. Technol. 1995, 6, 59–61. [Google Scholar] [CrossRef]
- Bagchi, D.; Preuss, H.G.; Swaroop, A. Nutraceuticals and Functional Foods in Human Health and Disease Prevention, 1st ed.; Routledge: London, UK, 2024; ISBN 978-1-032098-265. [Google Scholar]
- Martínez, R.M. Pharmaceutical applications of nutraceuticals. In Nutraceuticals in Health Promotion; Springer: New York, NY, USA, 2013. [Google Scholar]
- EFSA Panel on Dietetic Products, Nutrition and Allergies (EFSA NDA Panel); Turck, D.; Bresson, J.L.; Burlingame, B.; Dean, T.; Fairweather-Tait, S.; Heinonen, M.; Hirsch-Ernst, K.I.; Mangelsdorf, I.; Siani, A.; et al. Guidance for the Scientific Requirements for Health Claims Related to Antioxidants, Oxidative Damage and Cardiovascular Health: (Revision 1). EFSA J. 2018, 16, e05136. [Google Scholar] [CrossRef] [PubMed]
- Olson, R.; Gavin-Smith, B.; Ferraboschi, C.; Kraemer, K. Food Fortification: The Advantages, Disadvantages and Lessons from Sight and Life Programs. Nutrients 2021, 13, 1118. [Google Scholar] [CrossRef] [PubMed]
- FDA. Dietary Supplements. Available online: https://www.fda.gov/food/dietary-supplements (accessed on 29 December 2025).
- United States Pharmacopeia (USP). General Chapters and Guidelines; USP 43–NF 38; United States Pharmacopeial Convention: Rockville, MD, USA, 2020; Available online: https://www.usp.org (accessed on 7 November 2025).
- World Health Organization (WHO). WHO Monographs on Selected Medicinal Plants, Vol. 1; World Health Organization: Geneva, Switzerland, 1999; ISBN 92-4-154517-8. Available online: https://iris.who.int/server/api/core/bitstreams/6e21eaaa-d157-421d-a136-eb61964de18c/content (accessed on 7 November 2025).
- International Council for Harmonisation (ICH). ICH Harmonised Tripartite Guideline: Validation of Analytical Procedures: Text and Methodology Q2(R1); ICH: Geneva, Switzerland, 2005; Available online: https://www.ich.org/page/quality-guidelines (accessed on 7 November 2025).
- Vidal-Casanella, O.; Núñez, O.; Granados, M.; Saurina, J. Analytical Methods for Exploring Nutraceuticals Based on Phenolic Acids and Polyphenols. Appl. Sci. 2021, 11, 1066. [Google Scholar] [CrossRef]
- Cozzolino, D. An Overview of the Successful Application of Vibrational Spectroscopy Techniques to Quantify Nutraceuticals in Fruits and Plants. Foods 2022, 11, 1234. [Google Scholar] [CrossRef]
- Tsiaka, T.; Kritsi, E.; Tsiantas, K.; Christodoulou, P.; Zoumpoulakis, P. Design and Development of Novel Nutraceuticals: Current Trends and Methodologies. Nutraceuticals 2022, 2, 71–90. [Google Scholar] [CrossRef]
- Parveen, B.; Rajinikanth, V.; Narayanan, M. Natural Plant Antioxidants for Food Preservation and Emerging Trends in Nutraceutical Applications. Discov. Appl. Sci. 2025, 7, 45. [Google Scholar] [CrossRef]
- Ding, S.; Dudley, E.; Plummer, S.; Tang, J.; Newton, R.P.; Brenton, A.G. Quantitative determination of major active components in Ginkgo biloba dietary supplements by liquid chromatography/mass spectrometry. Rapid Commun. Mass Spectrom. 2006, 20, 2753–2760. [Google Scholar] [CrossRef]
- Zhou, S.; Chan, E.; Zhou, Z.; Xie, T.; Lau, Y.M.; Chen, X. Pharmacokinetic interactions of drugs with St. John’s wort. J. Psychopharmacol. 2004, 18, 262–276. [Google Scholar] [CrossRef]
- Korfmacher, W.A. Principles and applications of LC-MS in new drug discovery. Drug Discov. Today 2005, 10, 1357–1367. [Google Scholar] [CrossRef]
- Ichim, M.C. The DNA-Based authentication of commercial herbal products reveals their globally widespread adulteration. Front. Pharmacol. 2019, 10, 1227. [Google Scholar] [CrossRef] [PubMed]
- Dwyer, J.T.; Coates, P.M.; Smith, M.J. Dietary supplements: Regulatory challenges and research resources. Nutrients 2018, 10, 41. [Google Scholar] [CrossRef] [PubMed]
- Gao, X.; Niu, J.; Xiao, Z.; Rong, D.; Yu, M.; Sy, S.K.B.; Wang, C.; Lv, Z. The application of quantitative 1H-NMR for the determination of melatonin and Vitamin B6 in commercial melatonin products. Molecules 2025, 30, 2942. [Google Scholar] [CrossRef] [PubMed]
- Singleton, V.L.; Orthofer, R.; Lamuela-Raventós, R.M. Analysis of total phenols and antioxidants by Folin–Ciocalteu reagent. Methods Enzymol. 1999, 299, 152–178. [Google Scholar]
- Sarker, S.D.; Nahar, L. Applications of high performance liquid chromatography in the analysis of herbal products. In Evidence-Based Validation of Herbal Medicine; Elsevier: Amsterdam, The Netherlands, 2015; pp. 405–425. [Google Scholar]
- Dalluge, J.J.; Beens, J.; Brinkman, U.A.T. Comprehensive two-dimensional gas chromatography–mass spectrometry: A powerful tool in herbal preparations. J. Chromatogr. A 2000, 880, 3–33. [Google Scholar]
- Upton, R.T. Use of high-performance thin layer chromatography by the American herbal pharmacopoeia. J. AOAC Int. 2010, 93, 1349–1354. [Google Scholar] [CrossRef]
- Fodor, M.; Matkovits, A.; Benes, E.L.; Jókai, Z. The role of near-infrared spectroscopy in food quality assurance: A review of the past two decades. Foods 2024, 13, 3501. [Google Scholar] [CrossRef]
- Kim, H.K.; Choi, Y.H.; Verpoorte, R. NMR-based plant metabolomics: Where do we stand, where do we go? Trends Biotechnol. 2011, 29, 267–275. [Google Scholar] [CrossRef]
- Sneddon, J. Determination of heavy metals in food by atomic spectroscopy. In Handbook of Food Analysis, 3rd ed.; Nollet, L.M.L., Ed.; Wiley: Hoboken, NJ, USA, 2010; Chapter 12. [Google Scholar]
- Grazina, L.; Mafra, I.; Monaci, L.; Amaral, J.S. Mass spectrometry-based approaches to assess the botanical authenticity of dietary supplements. Compr. Rev. Food Sci. Food Saf. 2023, 22, 3870–3909. [Google Scholar] [CrossRef]
- Hou, X.; Amais, R.S.; Jones, B.T.; Donati, G.L. Inductively coupled plasma optical emission spectrometry. In Encyclopedia of Analytical Chemistry; Wiley: Hoboken, NJ, USA, 2016; Chapter a5110. [Google Scholar]
- Lavecchia, T.; Tibuzzi, A.; Giardi, M.T. Biosensors for functional food safety and analysis. In Bio-Farms for Nutraceuticals; Giardi, M.T., Rea, G., Berra, B., Eds.; Advances in Experimental Medicine and Biology; Springer: Boston, MA, USA, 2010; Volume 698, pp. 339–355. [Google Scholar]
- Nastasijevic, I.; Kundacina, I.; Jaric, S.; Pavlovic, Z.; Radovic, M.; Radonic, V. Recent advances in biosensor technologies for meat production Chain. Foods 2025, 14, 744. [Google Scholar] [CrossRef]
- Torres Diaz, J.O.; Velásquez, A.F. QCM Biosensors for pathogen detection in water and food: Review of published literature. Rev. Ing. Solidar. 2024, 20, 1–30. [Google Scholar] [CrossRef]
- Wang, Y.; Xu, H.; Zhang, J.; Li, G. Electrochemical sensors for clinic analysis. Sensors 2008, 8, 2043–2081. [Google Scholar] [CrossRef] [PubMed]
- Biswas, S.K.; Islam, M.S.; Jia, F.; Cao, Y.; Li, Y.; Cao, C. Flexible biosensors for food pathogen detection. Adv. Electron. Mater. 2024, 10, 2300898. [Google Scholar] [CrossRef]
- Mello, U.D.; Kubota, L.T. Review of the use of biosensors as analytical tools in the food and drink industries. Food Chem. 2002, 77, 237–256. [Google Scholar] [CrossRef]
- Raclariu, A.C.; Ţebrencu, C.E.; Ichim, M.C.; Ciupercǎ, O.T.; Brysting, A.K.; de Boer, H. What’s in the box? Authentication of Echinacea herbal products using DNA metabarcoding and HPTLC. Phytomedicine 2018, 44, 32–38. [Google Scholar] [CrossRef] [PubMed]
- Raclariu, A.C.; Heinrich, M.; Ichim, M.C.; de Boer, H. Benefits and limitations of DNA barcoding and metabarcoding in herbal product authentication. Phytochem. Anal. 2018, 29, 123–128. [Google Scholar] [CrossRef]
- Varmuza, K.; Filzmoser, P. Introduction to Multivariate Statistical Analysis in Chemometrics; CRC Press: Boca Raton, FL, USA, 2009. [Google Scholar]
- Apak, R.; Özyürek, M.; Güçlü, K.; Çapanoğlu, E. Antioxidant Activity/Capacity Measurement. 1. Classification, Physicochemical Principles, Mechanisms, and Electron Transfer (ET)-Based Assays. J. Agric. Food Chem. 2016, 64, 997–1027. [Google Scholar] [CrossRef]
- Shanko, A.S.; Badessa, T.S.; Tura, A.M. Method development and validation for the quantitative determination of total flavonoids through the complexation of Iron (III) and its application in real sample. Anal. Chim. Acta 2024, 1301, 342443. [Google Scholar] [CrossRef]
- Alam, M.N.; Bristi, N.J.; Rafiquzzaman, M. Review on in vivo and in vitro methods evaluation of antioxidant activity. Saudi Pharm. J. 2013, 21, 143–152. [Google Scholar] [CrossRef]
- Farag, M.A.; Sheashea, M.; Zhao, C.; Maamoun, A.A. UV fingerprinting approaches for quality control analyses of food and functional food coupled to chemometrics: A comprehensive analysis of novel trends and applications. Foods 2022, 11, 2867. [Google Scholar] [CrossRef]
- Lavilla, I.; Romero, V.; Costas, P.; Bendicho, C. Kinetic spectrophotometric assay for the determination of vitamin C in cosmetics following ultrasound-assisted emulsification. Anal. Methods 2023, 15, 951–958. [Google Scholar] [CrossRef] [PubMed]
- Nicolescu, A.; Bunea, C.I.; Mocan, A. Total flavonoid content revised: An overview of past, present, and future determinations in phytochemical analysis. Anal. Biochem. 2025, 700, 115794. [Google Scholar] [CrossRef] [PubMed]
- Hegazi, N.M.; Khattab, A.R.; Frolov, A.; Wessjohann, L.A.; Farag, M.A. Authentication of saffron spice accessions from its common substitutes via a multiplex approach of UV/VIS fingerprints and UPLC/MS using molecular networking and chemometrics. Food Chem. 2022, 367, 130739. [Google Scholar] [CrossRef] [PubMed]
- Ignat, I.; Volf, I.; Popa, V.I. A critical review of methods for characterization of polyphenolic compounds in fruits and vegetables. Food Chem. 2011, 126, 1821–1835. [Google Scholar] [CrossRef]
- Spáčil, Z.; Nováková, L.; Solich, P. Analysis of phenolic compounds by high performance liquid chromatography and ultra performance liquid chromatography. Talanta 2008, 76, 189–199. [Google Scholar] [CrossRef]
- Filipiak-Szok, A.; Kurzawa, M.; Szłyk, E. determination of phenolic acids in dietary supplements containing Vitis vinifera (Grape Vine) by HPLC-PDA method. Acta Aliment. 2013, 42, 400–409. [Google Scholar] [CrossRef]
- Dai, J.; Mumper, R.J. Plant phenolics: Extraction, analysis and their antioxidant and anticancer properties. Molecules 2010, 15, 7313–7352. [Google Scholar] [CrossRef]
- Merken, H.M.; Beecher, G.R. Liquid chromatographic method for the separation and quantification of prominent flavonoid aglycones. J. Chromatogr. A 2000, 897, 177–184. [Google Scholar] [CrossRef]
- Quideau, S.; Deffieux, D.; Douat-Casassus, C.; Pouységu, L. Plant polyphenols: Chemical properties, biological activities, and synthesis. Angew. Chem. Int. Ed. 2011, 50, 586–621. [Google Scholar] [CrossRef]
- Gómez-Caravaca, A.M.; Verardo, V.; Toselli, M.; Segura-Carretero, A.; Fernández-Gutiérrez, A.; Caboni, M.F. Determination of the major phenolic compounds in pomegranate juices by HPLC-DAD-ESI-MS. J. Agric. Food Chem. 2013, 61, 5328–5337. [Google Scholar] [CrossRef]
- Gupta, P.; Sreelakshmi, Y.; Sharma, R. A Rapid and sensitive method for determination of carotenoids in plant tissues by high performance liquid chromatography. Plant Methods 2015, 11, 5. [Google Scholar] [CrossRef] [PubMed]
- Jeelani, S.; Kassymbek, Z. Simultaneous determination of 10 fat-soluble vitamins by ultra-performance liquid chromatography in multivitamins with mineral capsules. J. Sep. Sci. 2025, 48, e70167. [Google Scholar] [CrossRef] [PubMed]
- Li, X.; Wen, D.; He, Y.; Liu, Y.; Han, F.; Su, J.; Lai, S.; Zhuang, M.; Gao, F.; Li, Z. Progresses and Prospects on Glucosinolate Detection in Cruciferous Plants. Foods 2024, 13, 4141. [Google Scholar] [CrossRef] [PubMed]
- Gazdik, Z.; Zitka, O.; Petrlova, J.; Adam, V.; Zehnalek, J.; Horna, A.; Reznicek, V.; Beklova, M.; Kizek, R. Determination of Vitamin C (ascorbic acid) using high performance liquid chromatography coupled with electrochemical detection. Sensors 2008, 8, 7097–7112. [Google Scholar] [CrossRef]
- Katsa, M.; Papalouka, N.; Mavrogianni, T.; Papagiannopoulou, I.; Kostakis, M.; Proestos, C.; Thomaidis, N.S. Comparative Study for the Determination of Fat-Soluble Vitamins in Rice Cereal Baby Foods Using HPLC-DAD and UHPLC-APCI-MS/MS. Foods 2021, 10, 648. [Google Scholar] [CrossRef]
- Turova, P.; Stekolshchikova, E.; Baygildiev, T.; Shpigun, O.; Rodin, I.; Stavrianidi, A. Unified strategy for HPLC-MS evaluation of bioactive compounds for quality control of herbal products. Biomed. Chromatogr. 2018, 32, e4363. [Google Scholar] [CrossRef]
- Zhang, A.; Sun, H.; Wang, X.; Wang, P.; Han, Y.; Wang, X.J. Modern analytical techniques in metabolomics analysis. Analyst 2012, 137, 293–300. [Google Scholar] [CrossRef]
- Lehotay, S.J.; Hajšlová, J. Application of gas chromatography in food analysis. TrAC Trends Anal. Chem. 2002, 21, 686–697. [Google Scholar] [CrossRef]
- Šatínský, D.; Pospíšilová, M.; Sladkovský, R. A new gas chromatography method for quality control of methylsulfonylmethane content in multicomponent dietary supplements. Food Anal. Methods 2014, 7, 1118–1122. [Google Scholar] [CrossRef]
- Khoddami, A.; Wilkes, M.A.; Roberts, T.H. Techniques for analysis of plant phenolic compounds. Molecules 2013, 18, 2328–2375. [Google Scholar] [CrossRef]
- Shahidi, F.; Ambigaipalan, P. Phenolics and polyphenolics in foods, beverages and nutraceuticals. J. Funct. Foods 2015, 18, 820–897. [Google Scholar] [CrossRef]
- Muhammad Alinafiah, S.; Azlan, A.; Ismail, A.; Mahmud Ab Rashid, N.-K. Method development and validation for omega-3 fatty acids (DHA and EPA) in fish using gas chromatography with flame ionization detection (GC-FID). Molecules 2021, 26, 6592. [Google Scholar] [CrossRef] [PubMed]
- Adams, R.P. Identification of Essential Oil Components by Gas Chromatography/Mass Spectrometry, 4th ed.; Allured Publishing: Carol Stream, IL, USA, 2007. [Google Scholar]
- Piironen, V.; Toivo, J.; Lampi, A.M. Plant sterols in cereals and cereal products. Cereal Chem. 2002, 79, 148–154. [Google Scholar] [CrossRef]
- Zhang, R.; Shen, W.; Wei, X.; Zhang, F.; Shen, C.; Wu, B.; Zhao, Z.; Liu, H.; Deng, X. Simultaneous determination of tocopherols and tocotrienols in vegetable oils by GC-MS. Anal. Methods 2016, 8, 7341–7346. [Google Scholar] [CrossRef]
- Chaudhary, A.; Verma, K.; Saharan, B.S. A GC-MS based metabolic profiling of probiotic lactic acid bacteria isolated from traditional food products. J. Pure Appl. Microbiol. 2020, 14, 657–672. [Google Scholar] [CrossRef]
- Rivera-Pérez, A.; Romero-González, R.; Garrido Frenich, A. Fingerprinting based on gas chromatography-orbitrap high-resolution mass spectrometry and chemometrics to reveal geographical origin, processing, and volatile markers for thyme authentication. Food Chem. 2022, 393, 133377. [Google Scholar] [CrossRef]
- Poole, C.F. Gas Chromatography, 2nd ed.; Elsevier: Amsterdam, The Netherlands, 2012. [Google Scholar]
- Cordero, C.; Rubiolo, P.; Sgorbini, B.; Moritz, F.; Schievano, E.; Bicchi, C. Comprehensive two-dimensional gas chromatography in the analysis of volatile samples of natural origin: A multidisciplinary approach to evaluate the influence of second dimension column coated with mixed stationary phases on system orthogonality. J. Chromatogr. A 2006, 1132, 268–279. [Google Scholar] [CrossRef]
- FDA. Guidance for Industry: Residual Solvents in Drug Products Marketed in the United States; U.S. Food and Drug Administration: Silver Spring, MD, USA, 2016. [Google Scholar]
- Rodriguez-Saona, L.E.; Giusti, M.M.; Shotts, M. Advances in infrared spectroscopy for food authenticity testing. In Advances in Food Authenticity Testing; Elsevier: Amsterdam, The Netherlands, 2016; Chapter 4; pp. 65–90. [Google Scholar]
- Cebi, N.; Dogan, C.E.; Develioglu, A.; Altuntop Yayla, M.E.; Sagdic, O. Detection of l-cysteine in wheat flour by raman microspectroscopy combined chemometrics of HCA and PCA. Food Chem. 2017, 228, 116–124. [Google Scholar] [CrossRef]
- Rohman, A.; Ghazali, M.A.; Windarsih, A.; Mustafa, S.; Riyanto, S.; Yusof, F.M. Comprehensive review on application of FTIR spectroscopy coupled with chemometrics for authentication analysis of fats and oils in the food products. Molecules 2020, 25, 5485. [Google Scholar] [CrossRef]
- Unaedi, E.C.; Lestari, K.; Muchtaridi, M. Infrared spectroscopy technique for quantification of compounds in plant-based medicine and supplement. J. Adv. Pharm. Technol. Res. 2021, 12, 1–7. [Google Scholar] [CrossRef]
- Cahya, D.; Susidarti, R.; Swasono, R.T.; Rohman, A. Application of FTIR-ATR spectroscopy in combination with multivariate analysis to analyse synthetic drugs adulterant in ternary mixtures of herbal medicine products. Indones. J. Pharm. 2022, 33, 63–71. [Google Scholar]
- Shannon, M.; Lafeuille, J.-L.; Frégière-Salomon, A.; Elliott, C.; Lefevre, S.; Galvin-King, P.; Haughey, S.A.; Burns, D.T.; Shen, X.; Kapil, A.; et al. The detection and determination of adulterants in turmeric using Fourier-transform infrared (FTIR) spectroscopy coupled to chemometric analysis and micro-FTIR imaging. Food Control 2022, 139, 109093. [Google Scholar] [CrossRef]
- Ensemane, N.; Bouzidi, N.; Daghbouche, Y.; Garrigues, S.; de la Guardia, M.; El Hattab, M. Quantification of phenolic acids by partial least squares Fourier-transform infrared (PLS-FTIR) in extracts of medicinal plants. Phytochem. Anal. 2021, 32, 206–221. [Google Scholar] [CrossRef] [PubMed]
- Cebi, N.; Bekiroglu, H.; Erarslan, A.; Rodriguez-Saona, L. Rapid sensing: Hand-held and portable FTIR applications for on-site food quality control from farm to fork. Molecules 2023, 28, 3727. [Google Scholar] [CrossRef] [PubMed]
- Bharti, S.K.; Roy, R. Quantitative 1H NMR spectroscopy. TrAC Trends Anal. Chem. 2012, 35, 5–26. [Google Scholar] [CrossRef]
- Pauli, G.F.; Gödecke, T.; Jaki, B.U.; Lankin, D.C. Quantitative 1H NMR: Development and potential of an analytical method. J. Nat. Prod. 2012, 75, 834–851. [Google Scholar] [CrossRef]
- Valentino, G.; Graziani, V.; D’Abrosca, B.; Pacifico, S.; Fiorentino, A.; Scognamiglio, M. NMR-Based plant metabolomics in nutraceutical research: An overview. Molecules 2020, 25, 1444. [Google Scholar] [CrossRef]
- Praveen, A.; Prasad, D.; Mishra, S.; Chaudhari, S.R.; Nagarajan, S. Facile NMR approach for profiling curcuminoids present in turmeric. Food Chem. 2020, 341, 128646. [Google Scholar] [CrossRef]
- Thapa, P.; Kim, H.M.; Hong, J.-P.; Kim, R.; Paudel, S.B.; Choi, H.; Jang, D.S.; Nam, J.-W. Absolute quantification of isoflavones in the flowers of Pueraria lobata by qHNMR. Plants 2022, 11, 548. [Google Scholar] [CrossRef]
- Salem, M.A.; Perez de Souza, L.; Serag, A.; Fernie, A.R.; Alseekh, S. metabolomics in the context of plant natural products research: From sample preparation to metabolite analysis. Metabolites 2020, 10, 37. [Google Scholar] [CrossRef]
- Long, T.; Gu, R.; Linghu, C.; Long, J.; Kennelly, E.J.; Long, C. UPLC-QTOF-MS-based metabolomics and chemometrics studies of geographically diverse Acer truncatum leaves: A traditional herbal tea in northern China. Food Chem. 2023, 417, 135873. [Google Scholar] [CrossRef]
- Nguyen, H.T.; Lee, D.-K.; Choi, Y.-G.; Min, J.-E.; Yoon, S.J.; Yu, Y.-H.; Lim, J.; Lee, J.; Kwon, S.W.; Park, J.H. A 1H NMR-Based metabolomics approach to evaluate the geographical authenticity of herbal medicine and its application in building a model effectively assessing the mixing proportion of intentional admixtures: A case study of Panax ginseng. J. Pharm. Biomed. Anal. 2016, 124, 120–128. [Google Scholar] [CrossRef]
- Ciurczak, E.W.; Igne, B. Pharmaceutical and Medical Applications of Near-Infrared Spectroscopy, 2nd ed.; CRC Press: Boca Raton, FL, USA, 2014; 172p. [Google Scholar]
- Nicolaï, B.M.; Defraeye, T.; De Ketelaere, B.; Herremans, E.; Hertog, M.L.A.T.M.; Saeys, W.; Torricelli, A.; Vandendriessche, T.; Verboven, P. Nondestructive measurement of fruit and vegetable quality by NIR spectroscopy: A review. Postharvest Biol. Technol. 2022, 180, 111640. [Google Scholar] [CrossRef]
- Dankowska, A.; Majsnerowicz, A.; Kowalewski, W.; Włodarska, K. The application of visible and near-infrared spectroscopy combined with chemometrics in classification of dried herbs. Sustainability 2022, 14, 6416. [Google Scholar] [CrossRef]
- Huang, Z.; Zhou, G.; Wang, X.; Wang, T.; Zhang, H.; Wang, Z.; Zhu, B.; Li, W. Rapid and nondestructive identification of adulterate capsules by NIR spectroscopy combined with chemometrics. J. Pharm. Biomed. Anal. 2023, 235, 115597. [Google Scholar] [CrossRef] [PubMed]
- Roy-Choudhury, P. Implementing Near Infrared Spectroscopy as a PAT Tool in the Biopharmaceutical Industries. Eur. Pharm. Rev. 2007, 12, 78. [Google Scholar]
- Ferrer-Gallego, R.; Hernández-Hierro, J.M.; Rivas-Gonzalo, J.C.; Escribano-Bailón, M.T. Feasibility Study on the Use of Near Infrared Spectroscopy to Determine Flavanols in Grape Seeds. Talanta 2010, 82, 1778–1783. [Google Scholar] [CrossRef]
- Choi, J.-Y.; Kim, M.; Park, S.; Cho, J.-S.; Lim, J.H.; Moon, K.-D. Rapid Discrimination of Panax ginseng Powder Adulterated with Various Root Plants by FT-IR Spectroscopy Coupled with Multivariate Analysis. Food Sci. Biotechnol. 2024, 33, 805–815. [Google Scholar] [CrossRef]
- Beć, K.B.; Grabska, J.; Huck, C.W. NIR Spectroscopy of Natural Medicines Supported by Novel Instrumentation and Methods for Data Analysis and Interpretation. J. Pharm. Biomed. Anal. 2021, 193, 113686. [Google Scholar] [CrossRef]
- Anal, J.M.H.; Chase, P. Trace elements analysis in some medicinal plants using graphite furnace–atomic absorption spectroscopy. Environ. Eng. Res. 2016, 21, 247–255. [Google Scholar] [CrossRef]
- Walker, S.; Stevenson, B.; Peterson, J.; Donati, G.; Jones, B.; Tourne, M.; Pollard, D.; Kanu, A.B. Determining Micro- and Macro-Elements by Flame Atomic Absorption Spectrometry. Chem. Educator 2016, 21, 264–272. [Google Scholar]
- Ashwini, A.; Kerur, B.R. Elemental Analysis of Ayurvedic Drugs (Bhasmas) by Atomic Absorption Spectrometer. Asian J. Pharm. Clin. Res. 2019, 12, 545–549. [Google Scholar] [CrossRef]
- Lozada-Ramírez, J.D.; Ortega, A.; Hernandez, L.R.; Anaya de Parrodi, C. Spectroscopic and Spectrometric Applications for the Identification of Bioactive Compounds from Vegetal Extracts. Appl. Sci. 2021, 11, 3039. [Google Scholar] [CrossRef]
- Benmeziane, F. Assessment of Phenolic Compounds by Spectrophotometry: Exploring the Technique’s Limitations—A Mini-Review. Int. J. Sci. Eng. Technol. 2025, 14, RAMP 1, ISSN (Online): 2348 4098; ISSN (Print): 2395 4752. [Google Scholar]
- Knez, E.; Kadac-Czapska, K.; Grembecka, M. Evaluation of Spectrophotometric Methods for Assessing Antioxidant Potential in Plant Food Samples—A Critical Approach. Appl. Sci. 2025, 15, 5925. [Google Scholar] [CrossRef]
- Suciu, F.; Stoicescu, I.; Lupu, E.C.; Musuc, A.M.; Popescu, A.; Mititelu, M.; Roșca, A.C.; Dumitrescu, D.-E.; Badea, F.C.; Caraiane, A.; et al. HPLC Analysis of Polyphenolic Compounds in Lysimachia nummularia L. and Comparative Determination of Antioxidant Capacity. Appl. Sci. 2023, 13, 2159. [Google Scholar] [CrossRef]
- Mizzi, L.; Chatzitzika, C.; Gatt, R.; Valdramidis, V.P. HPLC Analysis of Phenolic Compounds and Flavonoids with Overlapping Peaks. Food Technol. Biotechnol. 2020, 58, 12–19. [Google Scholar] [CrossRef]
- Gamal El-Din, M.I.; Youssef, F.S.; Altyar, A.E.; Ashour, M.L. GC/MS Analyses of the Essential Oils Obtained from Different Jatropha Species, Their Discrimination Using Chemometric Analysis and Assessment of Their Antibacterial and Anti-Biofilm Activities. Plants 2022, 11, 1268. [Google Scholar] [CrossRef]
- Cagliero, C.; Bicchi, C.; Marengo, A.; Rubiolo, P.; Sgorbini, B. Gas chromatography of essential oil: State of the art, recent advances and perspectives. J. Sep. Sci. 2022, 45, 94–112. [Google Scholar] [CrossRef]
- Seppänen-Laakso, T.; Laakso, I.; Hiltunen, R. Analysis of Fatty Acids by Gas Chromatography, and Its Relevance to Research on Health and Nutrition. Anal. Chim. Acta 2002, 465, 39–62. [Google Scholar] [CrossRef]
- Schlag, S.; Huang, Y.; Vetter, W. GC/EI-MS method for the determination of phytosterols in vegetable oils. Anal. Bioanal. Chem. 2022, 414, 239–254. [Google Scholar] [CrossRef] [PubMed]
- Park, J.; Kim, K.; Ryu, D.; Whang, J.-H.; Mah, J.-H. GC-MS/MS Method for Determination of Polycyclic Aromatic Hydrocarbons in Herbal Medicines. Molecules 2023, 28, 3853. [Google Scholar] [CrossRef] [PubMed]
- Fauler, G.; Muntean, W.; Leis, H.J.; Vitamin, K. Modern Chromatographic Analysis of Vitamins; De Leenheer, A.P., Lambert, W.E., Van Bocxlaer, J.F., Dekker, M., Eds.; CRC Press: Boca Raton, FL, USA, 2000; pp. 240–281. [Google Scholar]
- Starek, M.; Gumułka, P.; Dąbrowska, M. Quality Control of the Dietary Supplements Containing Selected Fat-Soluble Vitamins D and K. Nutrients 2023, 15, 1650. [Google Scholar] [CrossRef] [PubMed]
- Çebi, N.; Yılmaz, M.T.; Sağdıç, O. A Rapid ATR-FTIR Spectroscopic Method for Detection of Sibutramine Adulteration in Tea and Coffee Based on Hierarchical Cluster and Principal Component Analyses. Food Chem. 2017, 229, 517–526. [Google Scholar] [CrossRef]
- Bunaciu, A.A.; Aboul-Enein, H.Y. Adulterated Drug Analysis Using FTIR Spectroscopy. Appl. Spectrosc. Rev. 2021, 56, 423–437. [Google Scholar] [CrossRef]
- Galvin-King, P.; Haughey, S.A.; Elliott, C.T. Garlic Adulteration Detection Using NIR and FTIR Spectroscopy and Chemometrics. J. Food Compos. Anal. 2021, 96, 103757. [Google Scholar] [CrossRef]
- Smith, E.; Dent, G. Modern Raman Spectroscopy—A Practical Approach, 2nd ed.; Wiley: Chichester, UK, 2019. [Google Scholar]
- Jentzsch, P.V.; Sandoval Pauker, C.; Zárate Pozo, P.; Sinche Serra, M.; Jácome Camacho, G.; Rueda-Ayala, V.; Garrido, P.; Ramos Guerrero, L.; Ciobotă, V. Raman Spectroscopy in the Detection of Adulterated Essential Oils: The Case of Nonvolatile Adulterants. J. Raman Spectrosc. 2021, 52, 2051–2060. [Google Scholar] [CrossRef]
- Agatonovic-Kustrin, S.; Gegechkori, V.; Petrovich, D.S.; Ilinichna, K.T.; Morton, D.W. HPTLC and FTIR Fingerprinting of Olive Leaves Extracts and ATR-FTIR Characterisation of Major Flavonoids and Polyphenolics. Molecules 2021, 26, 6892. [Google Scholar] [CrossRef]
- Kumar, R.; Bhattacharya, B.; Agarwal, T.; Saravanan, C. Trans Fatty Acid Analysis of Frying Oil Using ATR-FTIR Spectroscopy: A Study on Indian Traditional Snack Foods. J. Food Qual. Hazards Control 2020, 7, 74–81. [Google Scholar] [CrossRef]
- Kristoffersen, K.A.; Måge, I.; Wubshet, S.G.; Böcker, U.; Dankel, K.R.; Lislelid, A.; Rønningen, M.A.; Afseth, N.K. FTIR-Based Prediction of Collagen Content in Hydrolyzed Protein Samples. Spectrochim. Acta A Mol. Biomol. Spectrosc. 2023, 289, 122919. [Google Scholar] [CrossRef]
- Hina, B.; Rizwani, G.-H.; Naseeb, U.; Huma, A.; Hyder, Z. Application of Atomic Absorption Spectroscopy to Determine Mineral and Heavy Metal Distribution Levels of Medicinal Plants. J. Anal. Tech. Res. 2023, 5, 26–32. [Google Scholar] [CrossRef]
- Krüger, D.; Butcher, D.J.; Baecker, D. Recent Applications of Graphite Furnace Atomic Absorption Spectrometry for the Analysis of Medicinal Plants and Plant-Based Remedies. J. Anal. At. Spectrom. 2025, 40, 1234–1250. [Google Scholar] [CrossRef]
- Altarawneh, R.M.; Al-Jaafreh, A.M.; Qaralleh, H.; Al-Qaralleh, O.S. Chemical Profiling of Punica Granatum Peels from Jordan Using LC–MS/MS and Study on Their Biological Activities. Int. J. Food Sci. Technol. 2022, 57, 5256–5267. [Google Scholar] [CrossRef]
- Ahmad, I.; Ansari, T.M. An Assessment of Toxic Heavy Metals in Soil and Plants (Allium cepa and Daucus carota) by GFAAS. Int. J. Environ. Anal. Chem. 2022, 102, 1029–1048. [Google Scholar] [CrossRef]
- Sussa, F.V.; Furlan, M.R.; Victorino, M.; da Silva, P.S.C. Soil-to-Plant Transfer Factor for Stable Elements in Lemon Balm (Melissa Officinalis L.) and Estimates of the Daily Intakes. J. Radioanal. Nucl. Chem. 2022, 331, 3107–3115. [Google Scholar] [CrossRef]
- Mahood, H.E. Estimation of Essential Elements and Minerals in Catharanthus Roseus and Its Biological Importance as a Medicinal Plant. Plant Cell Biotechnol. Mol. Biol. 2021, 22, 1–7. [Google Scholar]
- Krüger, D.; Weng, A.; Baecker, D. Investigating the Discoloration of Leaves of Dioscorea Polystachya Using Developed Atomic Absorption Spectrometry Methods for Manganese and Molybdenum. Molecules 2024, 29, 3975. [Google Scholar] [CrossRef]
- Jurowski, K.; Fołta, M.; Tatar, B.; Berkoz, M.; Krośniak, M. The Toxicological Risk Assessment of Dermal Exposure of Patients Exposed to Nickel and Chromium Due to Application of Ointments with Marjoram Herb Extract (Majoranae Herbae Extractum) Available in Polish Pharmacies. Biol. Trace Elem. Res. 2022, 200, 1965–1971. [Google Scholar] [CrossRef]
- Jurowski, K.; Fołta, M.; Tatar, B.; Berkoz, M.; Krośniak, M. The Toxicological Risk Assessment of Lead and Cadmium in Valeriana Officinalis L., Radix (Valerian Root) as Herbal Medicinal Product for the Relief of Mild Nervous Tension and Sleep Disorders Available in Polish Pharmacies. Biol. Trace Elem. Res. 2022, 200, 904–909. [Google Scholar] [CrossRef]
- Sun, L.P.; Yin, Y.L.; Wang, C.; Wang, L. Simultaneous Analysis of Six Trace Elements in Pomegranate (Punica granatum L.) Juice by ICP-MS after Microwave-Assisted Digestion. Adv. Mater. Res. 2014, 998, 307–311. [Google Scholar] [CrossRef]
- Chukkol, S.; Koki, I.B.; Ikram, R.; Low, K.H. Elemental Variations and Safety Assessment of Commercial Onions (Allium cepa) by ICP-MS and Chemometrics. Int. Food Res. J. 2019, 26, 1717–1724. [Google Scholar]
- Mitov, D.; Milenković, K.; Petrović, S.; Mrmošanin, J. The Content of Heavy Metal(oid)s, Total Phenols, Total Flavonoids, Rosmarinic Acid, and Antioxidant Activity of Lemon Balm Leaves (Melissa officinalis L.). Chem. Naissensis 2025, 7, 63–71. [Google Scholar] [CrossRef]
- Özcan, M.M.; Chalchat, J.-C. Chemical Composition of Carrot Seeds (Daucus carota L.) Cultivated in Turkey: Characterization of the Seed Oil and Essential Oil. Grasas Aceites 2007, 58, 359–365. [Google Scholar] [CrossRef]
- Wang, P.; Shan, N.; Ali, A.; Sun, J.; Luo, S.; Xiao, Y.; Wang, S.; Hu, R.; Huang, Y.; Zhou, Q. Comprehensive Evaluation of Functional Components, Biological Activities, and Minerals of Yam Species (Dioscorea polystachya and D. alata) from China. LWT—Food Sci. Technol. 2022, 168, 113964. [Google Scholar] [CrossRef]
- Tomova, T.; Slavova, I.; Tomov, D.; Kirova, G.; Argirova, M.D. Ginkgo biloba Seeds—An Environmental Pollutant or a Functional Food. Horticulturae 2021, 7, 218. [Google Scholar] [CrossRef]
- Das, A.K.; Ansary, A.; Das, S.S.; Dutta, K.N.; Lamichhane, S.; Pandey, J.; Hazarika, D. DNA Barcoding and Next-Generation Sequencing for Food Authentication. In Novel Food Analysis: Techniques and Applications; Springer US: New York, NY, USA, 2025; pp. 159–179. [Google Scholar]
- Behr, M.; Garlant, L.; Pietretti, D.; Pellegrin, C.; Lievens, A.; Boix-Sanfeliu, A.; Maquet, A.; Alvarellos, L. A Robust Set of qPCR Methods to Evaluate Adulteration in Major Spices and Herbs. Food Control 2024, 165, 110623. [Google Scholar] [CrossRef]
- Ramos-Gómez, S.; Busto, M.D.; Ortega, N. Detection of Hazelnut and Almond Adulteration in Olive Oil: An Approach by qPCR. Molecules 2023, 28, 4248. [Google Scholar] [CrossRef]
- Giglioti, R.; Polli, H.; Azevedo, B.T.; Vercesi Filho, A.E.; Katiki, L.M. Detection and Quantification of Adulteration in Milk and Dairy Products: A Novel and Sensitive qPCR-Based Method. Food Chem. Mol. Sci. 2022, 4, 100074. [Google Scholar] [CrossRef]
- Su, Y.; Meng, L.; Wang, J.; Zhao, Y.; Zheng, N. Simultaneous Detection of Eight Dairy-Derived Components Using Double-Tube Multiplex qPCR Based on TaqMan Probe. Foods 2024, 13, 3213. [Google Scholar] [CrossRef]
- Singh, R.R. Next-Generation Sequencing in High-Sensitive Detection of Mutations in Tumors: Challenges, Advances, and Applications. J. Mol. Diagn. 2020, 22, 994–1007. [Google Scholar] [CrossRef]
- Chen, S.; Yin, X.; Han, J.; Sun, W.; Yao, H.; Song, J.; Li, X. DNA Barcoding in Herbal Medicine: Retrospective and Prospective. J. Pharm. Anal. 2023, 13, 431–441. [Google Scholar] [CrossRef] [PubMed]
- Sánchez, M.; González-Burgos, E.; Divakar, P.K.; Gómez-Serranillos, M.P. DNA-Based Authentication and Metabolomics Analysis of Medicinal Plant Samples by DNA Barcoding and Ultra-High-Performance Liquid Chromatography/Triple Quadrupole Mass Spectrometry (UHPLC-MS). Plants 2020, 9, 1601. [Google Scholar] [CrossRef] [PubMed]
- Mishra, G.K.; Barfidokht, A.; Tehrani, F.; Mishra, R.K. Food Safety Analysis Using Electrochemical Biosensors. Biosensors 2018, 8, 57. [Google Scholar] [CrossRef] [PubMed]
- Kundu, M.; Prasad, S.; Krishnan, P.; Gajjala, S. A Novel Electrochemical Biosensor Based on Hematite (α-Fe2O3) Flowerlike Nanostructures for Sensitive Determination of Formaldehyde Adulteration in Fruit Juices. Food Bioprocess Technol. 2019, 12, 1659–1671. [Google Scholar] [CrossRef]
- Çimen, D.; Denizli, A. Development of Rapid, Sensitive, and Effective Plasmonic Nanosensor for the Detection of Vitamins in Infact Formula and Milk Samples. Photonic Sens. 2020, 10, 316–332. [Google Scholar] [CrossRef]
- Raymundo-Pereira, P.A.; Silva, T.A.; Caetano, F.R.; Ribovski, L.; Zapp, E.; Brondani, D.; Bergamini, M.F.; Marcolino, L.H.; Banks, C.E.; Oliveira, O.N.; et al. Polyphenol Oxidase-Based Electrochemical Biosensors: A Review. Anal. Chim. Acta 2020, 1139, 198–221. [Google Scholar] [CrossRef]
- Jiménez-Carvelo, A.M.; Martín-Torres, S.; Ortega-Gavilán, F.; Camacho, J. PLS-DA vs. Sparse PLS-DA in Food Traceability: A Case Study on Authentication of Avocado Samples. Talanta 2021, 224, 121904. [Google Scholar] [CrossRef]
- Sim, K.S.; Kim, H.; Kim, Y.-K.; Kim, H.J. Discrimination of Garlic and Onion and Their Geographical Origin Using fsLA-ICP-MS with Chemometrics Analysis. Microchem. J. 2025, 215, 114426. [Google Scholar] [CrossRef]
- Durazzo, A.; Sorkin, B.C.; Lucarini, M.; Gusev, P.A.; Crawford, C.; Boyd, C.; Saldanha, L.G.; Pehrsson, P.R.; Harnly, J.M.; Andrews, K.W.; et al. Analytical challenges and metrological approaches to ensuring dietary supplement quality: International perspectives. Front. Pharmacol. 2022, 12, 714434. [Google Scholar] [CrossRef]
- Habibi-Yangjeh, A.; Danandeh-Jenagharad, M. Application of a genetic algorithm and an artificial neural network for global prediction of the toxicity of phenols to Tetrahymena pyriformis. Monatsh. Chem. 2009, 140, 1279–1288. [Google Scholar] [CrossRef]
- Kharbach, M.; Alaoui Mansouri, M.; Taabouz, M.; Yu, H. Current Application of Advancing Spectroscopy Techniques in Food Analysis: Data Handling with Chemometric Approaches. Foods 2023, 12, 2753. [Google Scholar] [CrossRef]
- Hassan, M.M.; Xu, Y.; Sayada, J.; Zareef, M.; Shoaib, M.; Chen, X.; Li, H.; Chen, Q. Chemometrics-Powered Spectroscopic Techniques for the Measurement of Food-Derived Phenolics and Vitamins in Foods: A Review. Food Chem. 2025, 473, 142722. [Google Scholar] [CrossRef]
- Rafiq, S.M.; Majumder, R.; Joshi, D.; Dar, A.H.; Dash, K.K.; Pandey, V.K.; Sidiqi, U.S. Lab-on-a-chip device for food quality control and safety. Food Control 2024, 164, 110596. [Google Scholar] [CrossRef]
- Zhu, C.; Sun, D.-W.; He, Y.; Zhang, Y. Handheld Near-Infrared Spectroscopy: State-of-the-Art Instrumentation and Applications in Material Identification, Food Authentication, and Environmental Investigations. Chemosensors 2023, 11, 272. [Google Scholar]
- Ziani, I.; Bouakline, H.; El Guerraf, A.; El Bachiri, A.; Fauconnier, M.-L.; Sher, F. Integrating AI and Advanced Spectroscopic Techniques for Precision Food Safety and Quality Control. Trends Food Sci. Technol. 2025, 156, 104850. [Google Scholar] [CrossRef]
- Pandey, J.; Gaire, S.; Sharma, K.; Pun, D.; Gyawali, A.; Lamichhane, G.; Budean, D.; Devkota, H.P. Exploring the potentials of Ziziphus mauritiana Lam. seed kernel oil as a pharmaceutical oil base: Physicochemical characterization and ketoconazole soap formulation. Heliyon 2023, 9, e21142. [Google Scholar] [CrossRef]
Disclaimer/Publisher’s Note: The statements, opinions and data contained in all publications are solely those of the individual author(s) and contributor(s) and not of MDPI and/or the editor(s). MDPI and/or the editor(s) disclaim responsibility for any injury to people or property resulting from any ideas, methods, instructions or products referred to in the content. |
© 2026 by the author. Licensee MDPI, Basel, Switzerland. This article is an open access article distributed under the terms and conditions of the Creative Commons Attribution (CC BY) license.