Highlights
Public health relevance
- This study examines how integrating cycling into daily routines can improve physical and mental health in an academic setting, addressing public health challenges such as physical inactivity and sedentary lifestyles.
Public health significance
- The pilot study demonstrated that even modest daily cycling led to significant health benefits, including reduced body fat, improved cardiovascular recovery, and enhanced aerobic capacity, particularly in university students and staff.
Public health implications
- These findings suggest that implementing cycling programs, such as the UCicletas initiative, in academic settings could be a sustainable and cost-effective strategy to promote physical activity and improve public health outcomes.
Abstract
Integrating physical activity into daily routines through walking and cycling supports health while promoting sustainable mobility. This assumption aligns with SDGs 3, 5 and 11. This study assessed the feasibility and health impacts of cycling within a university setting. As part of the UCicletas program at Coimbra University, sixteen participants (8 males, 8 females) used conventional or pedal-assist bicycles for eight weeks. Descriptive analyses, t-tests, and Spearman correlations were applied to anthropometric and cardiorespiratory measurements collected before and after the intervention. Weekly cycling distance was obtained through self-reported odometer values. After eight weeks, notable health improvements were observed. Body fat decreased by 1.8% overall, with a significant reduction in females (p < 0.05). VO2max increased by 13.79% in males (p = 0.02) and 12.21% in females (p = 0.03). The Ruffier Index decreased by 18.87% in males (p < 0.05) and 14.73% in females (p = 0.03). Gender differences were evident in correlations: male BMI showed a strong negative association with respiratory recovery (ρ = −0.867, p = 0.005), whereas the female association was weak (ρ = 0.371). Correlations between cycling distance and health outcomes were weak and non-significant. Overall, the findings confirm that modest daily cycling improves health outcomes.
1. Introduction
Physical inactivity impacts public health at the global level, representing a leading risk factor for noncommunicable diseases (NCDs), including cardiovascular disease, type 2 diabetes, obesity, and certain types of cancer. To mitigate these effects, the World Health Organization (WHO) recommends that adults engage in at least 75 to 150 min of vigorous aerobic exercise, 150 to 300 min of moderate aerobic exercise, or a combination of both per week [1,2,3,4].
Active travel, including walking and cycling, is one effective strategy to increase physical activity. Incorporating these activities into daily commuting allows individuals to meet recommended physical activity guidelines without needing extra time for structured exercise. Cycling is a powerful preventive strategy for many diseases [3,5,6,7]. Moderate-intensity cycling (12–16 km/h, around 36 km per week) aligns with WHO guidelines [8]. Cycling also improves mental health, reducing risks for depression, bipolar disorder, and schizophrenia [9,10,11,12].
Bicycle use for daily commuting depends on several factors. The built environment plays a critical role, including urban design, well-maintained infrastructure, secure parking, safe traffic conditions, suitable terrain, access to changing facilities or showers, proximity to diverse amenities, personal safety, green spaces and globally aesthetically pleasing environments [13,14,15,16,17,18,19,20,21,22,23,24]. The impacts of this use on health are also promoted through awareness campaigns. Recent data from the European Commission’s Eurobarometer report indicates that nearly 36% of Europeans now incorporate cycling or other physical activities into their daily commuting at least once a week, reflecting the growing recognition of cycling as an essential means of promoting health [18]. Moreover, the modal shift toward cycling rather than car trips helps reduce congestion and emissions in urban areas.
However, demographic and socioeconomic factors, such as age, education level, family structure, and income status, significantly influence active travel behaviours [20,21,22,23]. One of the few studies incorporating both built environment and individual characteristics is by Kroesen and van Wee [24], whose empirical model highlights the complex interactions between infrastructure, personal awareness, and demographic factors in shaping active travel behaviours and associated health outcomes.
In response to these challenges, many universities worldwide have launched health promotion programs to improve the well-being of students and staff through physical activity. For example, programs such as Stanford University’s BeWell program (https://bewell.stanford.edu/bewell-program, accessed on 18 December 2025), the Active Workplaces initiative at the University of Queensland, and the (kind)mind program at the National University of Singapore focus on integrating wellness into daily routines [25]. These initiatives have been shown to improve physical fitness and mental health among university populations by promoting physical activity and providing support for mental health challenges [26,27]. In Europe, Health Promoting University (HPU) initiatives are also integrating physical activity, mental health services, and health education into campus environments, often supported by national policies and school-based programs [28,29].
While numerous studies have explored the health benefits of walking and cycling through structured, short-term interventions in controlled or semi-supervised settings, the long-term effects of these activities as part of daily routines, particularly in academic settings, remain underexplored.
This study aims to address this gap through a pilot study in the University of Coimbra (UCicletas program), which offers bicycles at very low cost to students and staff. Participants periodically assess their physical health as they integrate cycling into their daily routines. By providing affordable access to bicycles and encouraging daily cycling, the program aims to foster long-term behaviour change and promote sustainable transport practices. Additionally, this study emphasises the importance of raising awareness of the health benefits of active travel to encourage healthier, more sustainable mobility choices.
The specific contribution of this study is a focus on gradual behaviour change, measuring health outcomes at multiple intervals (every 8 weeks) to track participants’ progress and encourage continued cycling.
2. Materials and Methods
2.1. Study Design
This study is a collaboration between the Faculty of Sport Sciences and Physical Education (FCDEF) University of Coimbra Stadium (UC Sports), and the Faculty of Sciences and Technology at the University of Coimbra, Portugal. Is part of ongoing research at the University of Coimbra (UC) that began in 2022, as part of European project “Cycling Campus & City (3Cs-Project: 101090685, ERASMUS-SPORT-2022-SCP”, https://www.uc.pt/en/3cs/, accessed on 18 December 2025), exploring how mobility habits influence health through surveys, laboratory experiments, workshops, and various projects. One initiative within this research is the UCicletas project (https://www.uc.pt/desporto/ucicletas/, accessed on 18 December 2025), which promotes active mobility by offering bicycles for temporary use to students, faculty, researchers, and staff.
2.1.1. UCicletas Program Description
The UCicletas program offers both conventional bicycles (n = 10) and pedal-assist electric bicycles (pedelecs, n = 30), each with different usage fees. Participants could select the bicycle type that best suited their mobility needs, fitness levels, and economic considerations. Pedelecs provide motor assistance only while the user is actively pedalling, ensuring that physical effort is always involved. The inclusion of pedelecs was essential given Coimbra’s steep topography, which can limit cycling uptake, particularly among beginners or individuals with lower fitness levels. Despite motor assistance, significant physical effort is still required, as confirmed by previous research [30,31]. Pedelecs are classified as low-emission mobility modes, with life-cycle assessments showing substantially lower environmental impacts than those of private motorised vehicles [32,33]. Including pedelecs alongside conventional bicycles aligns with studies examining active and low-impact transport systems. Their integration in the program enables the assessment of cycling behaviours within mobility modes recognised as environmentally efficient in urban contexts. Pedelecs also allow participation for individuals who might otherwise be discouraged by the city’s terrain or physical limitations, while still promoting active mobility. This real-world design captures a broad spectrum of cycling behaviours and health outcomes, from those seeking to reduce exertion to those engaging in more physically demanding cycling.
2.1.2. Cycling Exposure Measurement
Cycling activity was monitored using the onboard cycle computers of each e-bike, which recorded both total distance and speed as part of the study’s assessment. These devices used a speed sensor attached to the wheel, detecting each rotation as a wheel-mounted magnet passed the sensor. The signal was then transmitted to the cycle computer, which calculated both velocity and distance based on the calibrated wheel diameter. Participants self-reported their weekly total distance travelled. However, due to data access restrictions and the mobility service’s privacy protocols, automated digital extraction of cycling data was not possible. As a result, participants manually reported their odometer readings. At the final assessment, the research team manually verified all odometer readings and cross-checked them with the participants’ reports, confirming that the recorded distances matched.
2.1.3. Environmental Context and Real-World Conditions
Cycling activity occurred under participants’ usual daily-life conditions, and no standardised route, duration, or intensity was prescribed. Consequently, environmental characteristics such as terrain, weather, traffic, and surface conditions were not controlled. This real-world design aligns with the natural use of the UCicletas program but introduces inherent variability in cycling exposure. Cycling volume was therefore quantified solely through the distance recorded by the onboard cycle computer, verified by weekly self-reports.
2.1.4. Health Outcome Assessments
To track the effects of daily cycling on health, participants undergo laboratory assessments every eight weeks, including standardised anthropometric measurements (e.g., BMI and body composition) and cardiovascular fitness tests (e.g., Ruffier–Dickson Index), following ACSM and WHO protocols. Professor Amândio Santos conducted these measurements at the FCDEF laboratory, through a recognised professional assessment of top cycling athletes’ performances and conducted to the highest standards (https://cyclinguptodate.com/joo-almeida, accessed on 18 December 2025). These laboratory assessments provided reliable indicators of cardiovascular fitness and changes in body composition throughout the study.
The study methodology is presented in Figure 1, which illustrates the entire process. The following section describes the methods and instruments used to measure the health factors.
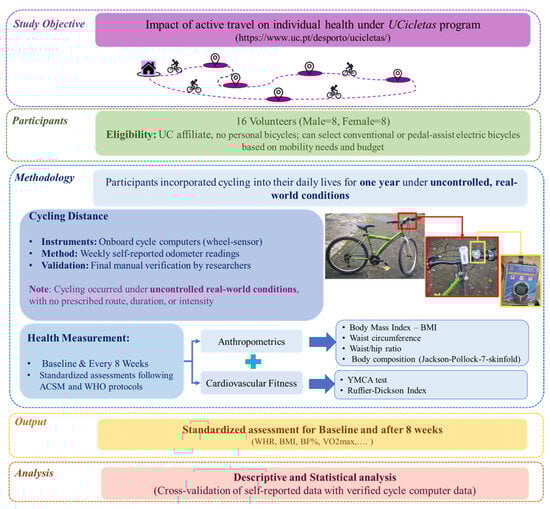
Figure 1.
Methodological framework (photographs by Rafael Rodrigues).
2.2. Study Participants
Participants for this study were selected based on specific eligibility criteria. These criteria required individuals to be affiliated with the University of Coimbra (as a student, researcher, staff member, or professor) and to neither own a personal bicycle nor use one daily. A total of sixteen (16) eligible participants (eight males, eight females) were enrolled at the start of the intervention, with no withdrawals reported. The study began in 2024 and is scheduled to last for one year. Data collection and assessments were conducted between April and June. Most participants were aged 28–48 years, with females averaging 39.75 years and males averaging 36.13 years. Both groups had a comparable age distribution, with nearly identical medians for men and women, although a few outliers slightly extended the overall range. All participants provided informed consent before participating in the study and agreed to the confidential use of relevant personal information, with ethical approval obtained from the FCDEFUC Ethics Committee (Ref: CE/FCDEF-UC/00072025).
2.3. Anthropometrics and Cardiorespiratory Fitness Measurements and Instruments
In this study, two main categories of assessments were conducted: anthropometrics and cardiorespiratory Fitness. Both were evaluated using standardised instruments and procedures to ensure accuracy and reproducibility.
Anthropometric measurements are non-invasive assessments that provide critical information about body composition, nutritional status, disease risk, and overall health [34]. These measurements are particularly useful for identifying cardiovascular risks and enabling early intervention [35,36]. The primary indices assessed included Body Mass Index (BMI, kg/m2) [37], Waist Circumference (WC) [38], and Waist–Hip Ratio (WHR) [39], which together provided insight into adiposity and fat distribution.
Body height was measured to the nearest 1 mm using a calibrated stadiometer, while body weight was measured to the nearest 100 g with a beam scale (SV-Seca 710, Hamburg, Germany). Measurements were conducted under standardised conditions with participants barefoot and wearing light clothing. Waist and hip circumferences were measured using a flexible, non-elastic anthropometric tape, following World Health Organisation (WHO) guidelines. Waist circumference was measured at the midpoint between the lowest rib and the iliac crest, and hip circumference at the widest portion of the buttocks. Each measurement was taken twice, and the mean value was recorded.
Additionally, body composition was evaluated using the Jackson–Pollock 7-site skinfold (SKF) method, which involved measuring subcutaneous fat at seven standardised anatomical sites: chest, midaxillary, triceps, subscapular, abdomen, suprailium, and thigh. The assessments were performed using Harpenden skinfold callipers (Baty International, West Sussex, UK), following the ACSM (American College of Sports Medicine) Standardised Description of Skinfold Sites and Procedures to ensure accuracy and consistency [40,41]. All measurements were taken on the right side of the body, and the average of three consecutive readings was recorded for each site. The total sum of these skinfold measurements (SS) was used to determine body fat percentage (BF%), where SS represents the combined thickness (in millimetres) of the seven measured sites. BF% was calculated using specific equations distinguished by sex [42], presented in the following Equations (1) and (2):
Cardiorespiratory fitness reflects the ability of the heart, lungs, and muscles to supply and utilise oxygen during sustained physical activity. VO2max, the most reliable indicator of aerobic capacity, is estimated through standardised methods that analyse heart rate (HR) responses to exercise intensity [43,44]. Two commonly used assessments, the Ruffier–Dickson Index (RDI) and the Indirect-Submaximal Cycle Ergometer Test (YMCA Test), provide indirect but practical measures of cardiovascular endurance [45,46].
RDI evaluates cardiovascular response by measuring heart rate at rest (HR1), immediately after performing 30 squats (HR2), and one-minute post-exercise (HR3) [47,48]. It is designed to minimise the influence of resting heart rate, with lower scores indicating better fitness levels. The Ruffier Index (RI) and Ruffier–Dickson Index (RDI) are calculated using Equations (3) and (4) [49]:
Cardiorespiratory fitness was also evaluated using the YMCA Submaximal Cycle Ergometer Test. The test was conducted on a calibrated cycle ergometer and followed a multi-stage, submaximal protocol with workload increments based on the participant’s heart rate response. Heart rate was monitored continuously, and VO2max was estimated using standardised prediction equations. The test aims for heart rate values between 110 bpm and 85% of the age-predicted maximum heart rate (220 − age) [46,50,51] and follows the ACSM guidelines for exercise testing and prescription [41] to ensure consistency in protocol and assessment.
2.4. Study Limitations
This study has several limitations. The lack of a control group prevents definitive conclusions about the intervention’s effects, as there was no direct comparison to a baseline or non-intervention group. Although the observed improvements are attributed to cycling, they could also stem from unrelated factors, such as seasonal variations, dietary changes, or reduced stress. The small sample size (n = 16), primarily consisting of students and staff, limits the generalizability of the findings. While this sample size provided sufficient power to detect moderate to large effect sizes, it resulted in a lower power (46.5%) for detecting more minor effects. The power analysis (see more details in the Appendix A, Table A1 and Figure A1 and Figure A2) indicated that for smaller effect sizes (below |δ| = 0.524), the likelihood of detecting significant effects drops substantially. Future studies with larger sample sizes would help increase the power and improve the ability to detect smaller effects with greater confidence. Other limitations include the one-year duration and the requirement for participants to attend lab sessions every 8 weeks may have led to decreased engagement, potentially affecting data reliability. Additionally, self-reported cycling data could introduce inaccuracies, with participants possibly overestimating trip durations or underreporting distances. Although manual verification of odometer readings was conducted by the research team at the final assessment to ensure consistency, self-reporting remains a limitation due to the potential for error. While GPS data is more objective, it may still be influenced by signal dropouts and algorithm limitations, impacting accuracy. Furthermore, because cycling occurred in uncontrolled real-world environments, variability in environmental conditions (e.g., slope, weather, surface quality, and traffic) could not be quantified, which may have influenced the physical demands experienced by participants.
The study did not capture detailed physical activity data, including cycling intensity, activity levels, exercise duration, cycling time, and calories burned. These measures would be necessary for a complete assessment of physiological workload and to better understand the relationship between cycling and health outcomes. The primary focus was on the feasibility of integrating cycling into daily routines and describing mobility behaviour in a real-world university setting, rather than on detailed physiological assessment. In addition, sociodemographic and health-related data (e.g., physical activity history, smoking, alcohol consumption, and diet) were not collected, limiting the ability to examine individual determinants of cycling behaviour and their effects on health outcomes.
To address these gaps, future research will incorporate a more comprehensive sociodemographic and health questionnaire alongside detailed physical activity measures, including cycling intensity, duration, and calories burned, to provide a more complete assessment of the physiological and health impacts of cycling.
3. Results
3.1. Cycling Distance by Age and Gender
As mentioned in the previous section (see Section 2.1), cycling distance was measured by self-reporting. The total distance cycled by age and gender is presented in Table 1, with detailed weekly cycling data in the Appendix A, Table A2. For younger adults (<35 years), the total distance cycled was 1933.80 km, with females covering 1165.39 km and males 768.41 km. For older adults (>35 years), the total distance cycled was 1661.88 km, with females cycling 737.67 km and males cycling 924.21 km.

Table 1.
Distance Cycled and Percentage of Total Distance by Age Group and Gender.
3.2. Descriptive Statistical Results
According to the lab protocols outlined in the previous section, health parameters were measured for all 16 participants. Table 2 summarises the primary health parameters at baseline, their values after 8 weeks of cycling, and the observed changes during this period. The detailed measured parameters are provided in the Appendix A (Table A3 and Table A4). Data analyses were performed using JASP (Version 0.19.3) (https://jasp-stats.org/, accessed on 20 December 2025) (open-source software) and Microsoft Excel.
Table 2.
Descriptive Analysis of Health Parameters Before and After 8 Weeks of Cycling.
After eight weeks of cycling intervention, modest changes were observed in several health parameters, particularly in BMI and %BF. More pronounced improvements were noted in cardiorespiratory fitness, as evidenced by favourable changes in VO2max and cardiovascular recovery indices. RI decreased by 18.87% in males (from 10.65 to 8.64) and by 14.73% in females (from 9.71 to 8.28), indicating improved cardiovascular efficiency. Similarly, RID decreased by 22.96% in males (from 9.54 to 7.35), while females exhibited a slight increase of 3.69% (from 7.85 to 8.14). The estimated VO2max increased by approximately 14% in males and 12% in females. In terms of absolute VO2max values, males demonstrated an increase from 2.14 to 2.38 L·min−1 (11.21%), whereas females improved from 1.53 to 1.72 L·min−1 (12.42%).
3.3. Statistical Tests and Regressions
3.3.1. t-Test
The paired t-test, presented in Table 3 (see more details in the Appendix A, Table A5), compare key health and fitness parameters before and after the 8-week cycling. The null hypothesis, which stated that the intervention would not lead to significant improvements, was rejected. The paired t-test was applied based on the assumption of normality, confirmed by the Shapiro–Wilk test. Normality was upheld for almost all parameters (except WHR for both gender) in both the male and female groups (p > 0.05). Therefore, there was no need to add a non-parametric test. The Shapiro–Wilk test value including w and p-values obtained were included in Table 3. The findings indicate notable improvements in body composition and cardiorespiratory fitness, with some gender differences. Table 3. Paired t-test and Shapiro–Wilk test results comparing baseline and after 8 weeks cycling.
Table 3.
Paired t-test results comparing baseline and after 8 weeks cycling.
After 8 weeks of cycling, significant changes were observed in the total sample. Weight (MD = −0.71 kg, t = −2.90, p = 0.011) and BMI (MD = −0.25 kg/m2, t = −2.68, p = 0.017) significantly decreased. Males showed significant reductions in weight (MD = −0.79 kg, t = −3.07, p = 0.02) and BMI (MD = −0.26 kg/m2, t = −2.89, p = 0.02), while females showed no significant changes in either variable. The total sample exhibited a significant decrease in the RI (MD = −1.73, t = −4.62, p < 0.001). Males showed a significant reduction in the RDI (MD = −2.19, t = −4.55, p < 0.001). Estimated VO2max increased significantly in both males (MD = 3.65 mL·kg−1·min−1, t = 3.19, p = 0.02) and females (MD = 2.94 mL·kg−1·min−1, t = 2.65, p = 0.03). Absolute VO2max also showed significant improvement in the total sample (MD = 0.22 L/min, t = 3.86, p < 0.001) and in males (MD = 0.25 L/min, t = 3.15, p = 0.02).
3.3.2. Spearman Correlation: Health Changes and Cycling Distance
This study examines the Spearman correlations between changes in health parameters (DF: 8-week results minus baseline) and total cycling distance across all participants (Table 4). The Pearson correlation coefficients, organised by gender (females and males) and age groups (younger adults: <35 years; older adults: >35 years), are provided in the Appendix A (Table A6, Table A7, Table A8 and Table A9). These analyses provide a comprehensive understanding of how body composition, aerobic fitness, and endurance performance are interrelated.
Table 4.
Spearman’s correlation—changes in health parameters and cycled distance of male and female participants.
Overall, the correlations among the factors for all participants ranged from weak to moderate, both positive and negative. Weak negative correlations were found between DF-Weight, DF-BMI, and DF-WHR with DF-RI (Spearman’s rho (ρ) = −0.153, −0.144, and −0.148, respectively), and between DF-Weight and DF-BMI with DF-ESVO2max (ρ = −0.295 and −0.278, respectively). DF-BF% showed a weak negative correlation with DF-ESVO2max (ρ = −0.052) and a moderate positive correlation with DF-RI (ρ = 0.394), although neither of these correlations was statistically significant. Significant correlations were observed between DF-Weight and DF-BMI (ρ = 0.998, p < 0.001), as well as between DF-ESVO2max and DF-ABVO2max (ρ = 0.973, p < 0.001).
A gender- and age-based analysis revealed significant differences. DF-Weight and DF-BMI were strongly correlated in both females (ρ = 0.994, p < 0.001) and males (ρ = 0.994, p < 0.001), confirming their close association. This strong correlation suggests a consistent relationship between body weight and BMI across both sexes. However, the relationship between DF-BMI and respiratory function differed between sexes. In females, DF-BMI showed a weak positive correlation with DF-RI (ρ = 0.371), while in males, the correlation was strong and negative (ρ = −0.867, p = 0.005). This difference suggests that increased BMI may have a more pronounced negative impact on respiratory recovery in males. For DF-BF%, females exhibited a moderate positive correlation with DF-RDI (ρ = 0.539), whereas the correlation was weaker in males (ρ = 0.404). This indicates that body fat percentage may play a stronger role in cardiovascular recovery in females compared to males. Both sexes showed a negative correlation between DF-BF% and DF-ESVO, suggesting that higher body fat negatively affects oxygen utilisation efficiency, although these correlations were not statistically significant (females: ρ = −0.095, males: ρ = −0.156). This consistent but non-significant relationship across both genders implies a potential, though weak, effect of body fat on oxygen efficiency.
The correlations between cycling distance and various health parameters were weak and non-significant in both males and females. For DF-Weight, males exhibited a weak positive correlation (ρ = 0.349, p = 0.396), while females showed a weak negative correlation (ρ = −0.491, p = 0.217). In the case of DF-BMI, males had a weak positive correlation (ρ = 0.287, p = 0.49), whereas females displayed a weak negative correlation (ρ = −0.476, p = 0.243). For DF-BF%, both males and females exhibited negative correlations, with males showing ρ= −0.240 (p = 0.568) and females ρ = −0.548 (p = 0.171). The DF-RI correlation with cycling distance was very weak for both sexes, with males at ρ = −0.036 (p = 0.933) and females at ρ = −0.551 (p = 0.157). Similarly, DF-RDI showed weak negative correlations, with males at ρ = −0.262 (p = 0.536) and females at ρ = −0.551 (p = 0.157). DF-ESVO2 and DF-ABVO2 showed very weak correlations, with males at ρ = −0.071 (p = 0.882) and females at ρ = 0.071 (p = 0.882) for DF-ESVO2, and males at ρ = −0.238 (p = 0.582) and females at ρ = −0.214 (p = 0.619) for DF-ABVO2.
Age-related trends were also observed. In younger adults (<35 years), both DF-Weight and DF-BMI were strongly negatively correlated with DF-RI (ρ = −0.844 and −0.847, respectively). In older adults (>35 years), these correlations weakened and became non-significant (ρ = 0.253 and 0.264).
Lastly, DF-WHR showed a moderate positive correlation with total distance in older adults (ρ = 0.575, p = 0.105). DF-RI exhibited a stronger negative correlation with total distance in females (ρ = −0.551), while the relationship was weaker in males (ρ = −0.036).
4. Discussion
This study aimed to evaluate the effects of an 8-week cycling intervention on body composition, aerobic capacity, and cardiovascular recovery in a cohort of 16 university students and staff. The first important aspect of this study’s results is that the discussion of the results must be cautious and validated by further studies. The intervention led to modest improvements in body composition, with reductions in weight and BMI observed, particularly in males. These changes were statistically significant for males but not for females. However, gender, age, and baseline fitness levels influenced the extent of these changes. Weight loss was observed in half of the participants, while a few experienced minimal weight gains. These outcomes are consistent with studies such as Naruse et al. (2023) [52], who demonstrated that cycling induces muscle development (hypertrophy), which may partly explain the minimal weight gain observed in some participants. Furthermore, Rhee (2017) [53] notes that weight cycling, the process of repeatedly losing and regaining weight, can cause fluctuations in body composition, including muscle gain, even with overall weight loss. Additionally, Betz et al. (2025) [54], found that aerobic exercise, like cycling, enhances muscle capillarization, improving muscle efficiency and potentially contributing to muscle growth.
Moreover, the cycling intervention resulted in reductions in body fat percentage (BF%) for both males and females, although the magnitude of these changes varied by gender. Males showed more significant decreases in BF%, consistent with previous studies suggesting that males generally experience greater fat loss due to higher muscle mass and more efficient fat oxidation [55]. The observed gender differences in body composition and cardiovascular recovery outcomes may be due to both physiological and behavioural factors, including baseline fitness levels, muscle mass, and adherence to the intervention. While females generally showed less pronounced improvements, they still experienced health benefits, particularly in cardiovascular recovery [56]. Testosterone levels in males further support this by enhancing fat metabolism and preserving lean muscle mass [49]. For females, although fat loss was less pronounced, there were notable improvements in waist-to-hip ratio (WHR), suggesting favourable fat redistribution, particularly around the abdominal region, which is vital for reducing metabolic risk. This pattern is consistent with evidence showing that central fat redistribution plays a key role in mitigating metabolic syndrome risk [57]. The cycling intervention led to improvements in cardiovascular recovery, as reflected by reductions in both the Ruffier Index (RI) and Ruffier–Dickson Index (RDI). While males exhibited more substantial improvements, females also showed positive, albeit more minor, changes in these indices, reflecting apparent sex-specific differences in autonomic function and cardiovascular adaptation to aerobic training [58,59]. These differences may stem from greater stroke volume, higher baseline aerobic capacity, and more efficient parasympathetic reactivation in males, which results in better heart-rate recovery after submaximal exercise.
Overall, Tobia et al. (2025) [25] provide further evidence that employees engaging in workplace exercise sessions experienced comparable reductions in blood pressure and cardiovascular risk, reinforcing the view that regular aerobic activity improves autonomic and cardiovascular regulation.
Both males and females showed moderate improvements in aerobic capacity, with significant increases in estimated and absolute VO2max values, particularly for males. However, males showed greater increases in VO2max, consistent with previous findings. Comparable sex-specific differences in aerobic adaptations have been reported in university-based training programs, with males typically demonstrating larger VO2max gains than females [56]. These differences may reflect males’ greater muscle mass, cardiovascular efficiency, and endurance performance capacity [60,61]. Females, demonstrated slower recovery times, which may be attributed to hormonal differences or lower baseline fitness levels [62]. Notably, increased body fat (as measured by BMI) was associated with poorer recovery, particularly in males. The negative correlation between BMI and the recovery index (RI) in males underscores the role of excess weight in impairing recovery [63,64]. University-based aerobic interventions have similarly shown that improvements in metabolic and cardiovascular function can occur even when BMI changes are modest, reinforcing the modest BMI reductions observed in our cohort [56]. These findings highlight that fat loss, rather than BMI reduction alone, contributes more meaningfully to improved cardiovascular recovery [65]. In females, although improvements in VO2max were less pronounced than in males, the cycling intervention still resulted in significant cardiovascular benefits, including reductions in systolic blood pressure and improved cholesterol levels [66,67]. This aligns with our study’s findings, which showed that females showed improved cardiovascular recovery even in the absence of substantial VO2max gains. Tobia et al. (2025) [25] similarly report reductions in systolic and diastolic blood pressure after workplace exercise, supporting the idea that even moderate-intensity programs enhance cardiovascular health regardless of changes in VO2max.
Age also influenced the outcomes of the cycling intervention. Younger adults (under 35 years) showed more significant improvements in both body composition and aerobic capacity. Similar patterns have been documented among competitive cyclists, where senior athletes exhibit higher VO2max values, greater long-duration power, and better fatigue resistance than younger riders, suggesting that age influences endurance capacity even in trained populations [68]. These differences may be partly explained by greater metabolic efficiency and better muscle mass preservation among younger adults [64]. In contrast, older adults (over 35 years) demonstrated less pronounced changes in body composition and aerobic capacity, likely due to age-related declines in fat metabolism and muscle mass [63,69]. Despite these limitations, older adults still showed improvements in cardiovascular recovery, indicating that cycling provides cardiovascular benefits across age groups. This is further supported by findings from Tegegne et al. (2025) [70], who found that cycling interventions significantly improve cardiovascular health parameters in older adults. These benefits may be due to enhanced vascular endothelial function, improved heart rate variability (HRV), and better regulation of blood pressure [67].
The effects of age and gender on cycling performance were also significant. Younger adults cycled longer distances than older adults, as expected, since younger individuals typically have higher endurance capacity [71,72]. This trend is further supported by evidence from national-level cyclists, where senior athletes demonstrate superior long-duration power outputs and enhanced performance during prolonged efforts compared with juniors, indicating that endurance-related capacities continue to mature with age even among trained individuals [68]. Within the older subgroup, females cycled longer distances than age-matched males. Although motivational or adherence-related factors may contribute to this pattern [73], university-based interventions also report gender-specific responses, with females consistently adhering to exercise protocols and achieving meaningful, although sometimes more minor, improvements in body composition and performance [56]. These findings suggest that gender-related behavioural and physiological factors influence training outcomes and support the alignment between our results and prior work in university and athletic populations.
5. Conclusions and Future Research
This study investigated the impact of integrating cycling into daily routines on anthropometric measures and cardiorespiratory fitness over 8 weeks with 16 participants aged 19–56. Unlike many interventions conducted in controlled or academic settings, this study focused on cycling in daily life, making it highly relevant to real-world applications. The results indicate modest improvements in several health parameters, including weight loss and reduced body fat percentage. While these changes were generally consistent across both males and females, no significant improvements in cardiovascular fitness were observed, which may be attributed to the short duration of the intervention
The findings suggest potential benefits of incorporating cycling into daily life, but the interpretation of these results should be cautious due to the study’s limitations. The lack of a control group and the relatively small sample size (n = 16) limit the ability to draw definitive conclusions about the causal effects of cycling on health outcomes. Additionally, environmental factors, such as weather and terrain, were not controlled for and could have influenced both the participants’ physical activity levels and the observed results. Furthermore, while the self-reported cycling distance was verified, it remains a potential source of error, and more accurate tracking methods could provide more reliable data in future studies.
Given the limitations of this pilot study, future research should aim to extend the intervention period and include larger, more diverse populations to better assess the long-term effects of cycling on health outcomes. Incorporating objective measures of cycling intensity and accounting for environmental factors (e.g., weather, terrain) would provide a more comprehensive understanding of cycling’s physiological impact. Additionally, exploring complementary interventions, such as behavioural coaching or nutritional guidance, could enhance the effectiveness of cycling-based health interventions.
Overall, this study demonstrates promising results, showing that even modest lifestyle changes, such as incorporating a few kilometres of cycling into daily commuting can lead to substantial health benefits. These findings underscore cycling as a practical, accessible, and sustainable approach to improving public health. By building on these results, future research can solidify cycling’s role as a key component of long-term health improvement strategies.
Author Contributions
Conceptualization, M.Z., A.S.N.R. and A.M.C.S.; Data curation, M.Z. and R.N.R.; Formal analysis, M.Z. and R.N.R.; Funding acquisition, A.S.N.R. and A.M.C.S.; Investigation, M.Z.; Methodology, M.Z., A.S.N.R. and A.M.C.S.; Project administration, A.S.N.R. and A.M.C.S.; Software, M.Z. and R.N.R.; Supervision, A.S.N.R. and A.M.C.S.; Validation, M.Z., A.S.N.R., A.M.C.S. and R.N.R.; Visualization, M.Z.; Writing—original draft, M.Z.; Writing—review and editing, M.Z., A.S.N.R., A.M.C.S. and R.N.R. All authors have read and agreed to the published version of the manuscript.
Funding
This research was funded by the CITTA (Research Centre for Territory, Transport and Environment) and under the Portuguese Foundation for Science and Technology (FCT), grant number UI/BD/151031/2021. The 3Cs project was co-funded by European Union (Project: 101090685, ERASMUS-SPORT-2022-SCP).
Institutional Review Board Statement
The study was conducted in accordance with the Declaration of Helsinki, and approved by the Ethics Committee of the Faculty of Sport Sciences and Physical Education at the University of Coimbra (FCDEFUC) (protocol code: Ref CE/FCDEF-UC/00072025; date of approval: 5 June 2025). The study is part of the European 3Cs project (Project: 101090685, ERASMUS-SPORT-2022-SCP, https://www.uc.pt/en/3cs/, accessed on 20 December 2025), which began last year. The authors started with participant surveys and consent, followed by the distribution of bicycles for a one-year period. While the ethics approval process was initiated, there were delays in obtaining approval due to procedural timelines at the university, which resulted in the approval date being 5 June 2025.
Informed Consent Statement
Informed consent was obtained from all subjects involved in the study.
Data Availability Statement
The authors confirm that the data supporting the findings of this study are available within the article as an Appendix A.
Acknowledgments
During the preparation of this manuscript/study, the authors used JASP, 0.19.3.0 for the purposes of conducting statistical analysis. The authors have reviewed and edited the output and take full responsibility for the content of this publication. The authors wish to express their sincere gratitude to the University of Coimbra Stadium (UC Sports) team for their invaluable support and collaboration. Their commitment and assistance were essential to the successful development of this work.
Conflicts of Interest
The authors declare no conflicts of interest.
Abbreviations
The following abbreviations are used in this manuscript:
| SDGs | Sustainable Development Goals |
| FCDEF | Faculty of Sport Sciences and Physical Education |
| NCDs | Noncommunicable Diseases |
| WHO | World Health Organization |
| CRF | Cardiorespiratory Fitness |
| VO2max | Maximal oxygen consumption |
| VO2R | Oxygen Consumption Reserve |
| HRR | Heart Rate Reserve |
| HRmax | Maximal Heart Rate |
| METs | Metabolic Equivalents |
| BMI | Body Mass Index |
| WC | Waist Circumference |
| WHR | Waist–Hip Ratio |
| SKF | Jackson–Pollock 7-site skinfold |
| ACSM | American College of Sports Medicine |
| BF% | Body Fat percentage |
| SS | Sum of these skinfold measurements |
| HR | Heart Rate |
| RDI | Ruffier–Dickson Index |
| RI | Ruffier Index |
| YMCA | Indirect-Submaximal Cycle Ergometer |
| SD | Standard Deviation |
| MD | Mean Difference |
| DF | Difference between Baseline and after 8 weeks |
Appendix A
Table A1.
Power analysis result.
Table A1.
Power analysis result.
| Power | User Defined | ||
|---|---|---|---|
| N | Cohen’s |δ| | α | |
| 0.465 | 16 | 0.500 | 0.050 |
Table A2.
Cycling distances travelled 8 weeks.
Table A2.
Cycling distances travelled 8 weeks.
| Nr. of Volunteer | Gender | Age | Week 1 | Week 2 | Week 3 | Week 4 | Week 5 | Week 6 | Week 7 | Week 8 | Total Distance (m) |
|---|---|---|---|---|---|---|---|---|---|---|---|
| 1 | male | 56 | 23,412 | 22,568 | 28,659 | 29,304 | 22,521 | 23,876 | 25,677 | 24,900 | 200,917 |
| 2 | male | 33 | 3689 | 9231 | 4433 | 5651 | 38,874 | 4070 | 9203 | 3550 | 78,701 |
| 3 | male | 37 | 34,689 | 39,231 | 40,433 | 35,651 | 38,874 | 44,070 | 32,920 | 35,560 | 301,428 |
| 4 | female | 31 | 48,907 | 41,320 | 43,753 | 45,152 | 43,800 | 41,198 | 42,100 | 44,930 | 351,160 |
| 5 | female | 56 | 14,691 | 9312 | 8344 | 9691 | 13,874 | 14,212 | 9203 | 3550 | 82,877 |
| 6 | female | 42 | 14,917 | 15,165 | 13,962 | 16,007 | 14,784 | 13,977 | 15,993 | 17,352 | 122,157 |
| 7 | male | 32 | 22,875 | 23,204 | 24,124 | 22,135 | 22,785 | 22,661 | 22,940 | 23,007 | 183,731 |
| 8 | male | 37 | 38,740 | 40,433 | 41,030 | 39,031 | 32,209 | 35,065 | 35,156 | 34,166 | 295,830 |
| 9 | male | 28 | 34,189 | 38,313 | 38,433 | 34,651 | 37,774 | 47,033 | 34,920 | 39,560 | 304,873 |
| 10 | male | 19 | 29,403 | 28,956 | 23,678 | 23,450 | 22,570 | 24,840 | 25,670 | 22,534 | 201,101 |
| 11 | Female | 46 | 13,574 | 15,574 | 13,987 | 13,022 | 14,376 | 15,200 | 13,955 | 14,480 | 114,168 |
| 12 | female | 30 | 63,240 | 66,720 | 65,217 | 68,172 | 61,298 | 65,773 | 64,890 | 66,270 | 521,580 |
| 13 | female | 31 | 32,190 | 33,138 | 35,355 | 36,514 | 34,970 | 37,320 | 39,209 | 43,960 | 292,656 |
| 14 | male | 47 | 16,007 | 17,872 | 14,917 | 16,807 | 14,784 | 12,980 | 14,793 | 17,872 | 126,032 |
| 15 | female | 43 | 15,574 | 16,099 | 13,574 | 17,872 | 16,107 | 14,793 | 17,600 | 16,700 | 128,319 |
| 16 | female | 39 | 35,651 | 34,699 | 38,800 | 39,231 | 32,200 | 35,160 | 33,921 | 40,488 | 290,150 |
Table A3.
Descriptive analysis of anthropometric measures—Baseline.
Table A3.
Descriptive analysis of anthropometric measures—Baseline.
| Parameters | Total (n = 16) | Female (n = 8) | Male (n = 8) | ||||||
|---|---|---|---|---|---|---|---|---|---|
| Mean ± SD | 95% CI Mean (Lower–Upper) | Min–Max | Mean ± SD | 95% CI Mean (Lower–Upper) | Min–Max | Mean ± SD | 95% CI Mean (Lower–Upper) | Min–Max | |
| Age | 37.94 ± 10.07 | 32.57–43.30 | 19–56 | 39.75 ± 9.00 | 32.22–47.28 | 30–56 | 36.13 ± 11.34 | 26.64–45.61 | 19.00–56.00 |
| Height (m) | 1.69 ± 0.08 | 1.65–1.73 | 1.57–1.88 | 1.63 ± 0.04 | 1.60–1.66 | 1.57–1.67 | 1.75 ± 0.07 | 1.69–1.81 | 1.66–1.88 |
| Weight (kg) | 73.16 ± 14.93 | 65.21–81.12 | 55–110.1 | 64.64 ± 10.28 | 56.05–73.23 | 55–79.9 | 81.69 ± 14.35 | 69.69–93.68 | 62.50–110.10 |
| BMI | 25.54 ± 4.02 | 23.40–27.68 | 19.85–34.59 | 24.44 ± 4.14 | 20.98–27.90 | 19.85–31.17 | 26.64 ± 3.84 | 23.43–29.85 | 21.27–34.59 |
| Waist (cm) | 84.86 ± 14.17 | 77.31–92.41 | 68–111.5 | 81.04 ± 18.01 | 65.98–96.10 | 68–111.5 | 88.69 ± 8.51 | 81.58–95.80 | 71.00–99.50 |
| Hip (cm) | 95.69 ± 8.10 | 91.38–100.01 | 82.6–112 | 93.26 ± 8.19 | 86.41–100.11 | 82.6–108 | 98.13 ± 7.74 | 91.66–104.59 | 85.00–112.00 |
| Waist/Hip ratio | 0.89 ± 0.17 | 0.80–0.98 | 0.72–1.31 | 0.88 ± 0.24 | 0.68–1.08 | 0.72–1.31 | 0.90 ± 0.04 | 0.88–0.93 | 0.84–0.95 |
| Triceps (mm) | 26.78 ± 11.04 | 20.90–32.66 | 16,224.00 | 32.38 ± 8.60 | 25.18–39.57 | 22–44 | 21.19 ± 10.74 | 12.21–30.17 | 6.00–38.50 |
| Chest (mm) | 14.25 ± 6.77 | 10.64–17.86 | 45,837.00 | 9.75 ± 3.01 | 7.23–12.27 | 45,824.00 | 18.75 ± 6.54 | 13.28–24.22 | 10.00–29.00 |
| MidAxilla (mm) | 22.06 ± 7.71 | 17.96–26.17 | 13,424.00 | 21.63 ± 8.75 | 14.31–28.94 | 13,485.00 | 22.50 ± 7.09 | 16.57–28.43 | 10.00–32.00 |
| Subscapula (mm) | 26.31 ± 8.56 | 21.75–30.87 | 14–39 | 26.25 ± 9.07 | 18.67–33.83 | 18–39 | 26.38 ± 8.65 | 19.14–33.61 | 14.00–36.00 |
| Suprailiac (mm) | 26.44 ± 9.16 | 21.56–31.32 | 15,189.00 | 26.00 ± 8.44 | 18.95–33.05 | 18–36 | 26.88 ± 10.40 | 18.18–35.57 | 8.00–41.00 |
| Abdomen (mm) | 33.50 ± 9.77 | 28.29–38.71 | 20–48 | 33.44 ± 11.34 | 23.95–42.92 | 20–48 | 33.56 ± 8.72 | 26.28–40.85 | 22.00–46.00 |
| Thigh (mm) | 30.00 ± 11.35 | 23.95–36.05 | 8.5–45 | 35.69 ± 8.29 | 28.76–42.61 | 25–45 | 24.31 ± 11.56 | 14.65–33.98 | 8.50–44.00 |
| % Body Fat | 28.42 ± 7.72 | 24.31–32.53 | 14.67–40.40 | 32.75 ± 6.82 | 27.05–38.45 | 25.69–40.40 | 24.09 ± 6.19 | 18.92–29.27 | 14.67–31.70 |
| Fat Mass (kg) | 21.00 ± 7.73 | 16.88–25.12 | 9.17–34.51 | 21.72 ± 7.75 | 15.24–28.19 | 14.21–32.22 | 20.28 ± 8.18 | 13.44–27.13 | 9.17–34.51 |
| Fat-Free Mass (kg) | 52.16 ± 11.01 | 46.30–58.03 | 38.41–75.59 | 42.92 ± 3.39 | 40.09–45.76 | 38.41–47.68 | 61.41 ± 7.29 | 55.31–67.50 | 53.33–75.59 |
| HRrest (bpm) | 79.75 ± 10.96 | 73.91–85.59 | 65–99 | 80.25 ± 9.93 | 71.95–88.55 | 65–95 | 79.25 ± 12.58 | 68.73–89.77 | 66.00–99.00 |
| HRpost (bpm) | 127.69 ± 13.17 | 120.67–134.71 | 105–160 | 124.75 ± 9.57 | 116.75–132.75 | 105–134 | 130.63 ± 16.14 | 117.13–144.12 | 112.00–160.00 |
| HR1min (bpm) | 94.38 ± 14.36 | 86.72–102.03 | 71–131 | 92.13 ± 12.47 | 81.70–102.55 | 71–111 | 96.63 ± 16.58 | 82.77–110.49 | 80.00–131.00 |
| Ruffier Index | 10.18 ± 3.45 | 8.35–12.02 | 6.2–19 | 9.71 ± 2.77 | 7.40–12.02 | 6.2–13.6 | 10.65 ± 4.16 | 7.17–14.13 | 6.30–19.00 |
| Ruffier–Dickson Index | 8.69 ± 2.33 | 7.45–9.94 | 6.3–15.4 | 7.85 ± 1.54 | 6.57–9.13 | 6.3–10.6 | 9.54 ± 2.77 | 7.22–11.85 | 6.80–15.40 |
| Estimated VO2max (mL·kg·min−1) | 25.28 ± 5.00 | 22.62–27.94 | 17.52–32.43 | 24.08 ± 5.28 | 19.67–28.50 | 17.52–31.22 | 26.47 ± 4.73 | 22.52–30.43 | 18.13–32.43 |
| Absolute VO2max (L/min) | 1.83 ± 0.45 | 1.59–2.07 | 1.13–2.66 | 1.53 ± 0.27 | 1.30–1.75 | 1.13–2.05 | 2.14 ± 0.40 | 1.80–2.47 | 1.62–2.66 |
Table A4.
Descriptive analysis of anthropometric measures—After 8 Weeks Cycling.
Table A4.
Descriptive analysis of anthropometric measures—After 8 Weeks Cycling.
| Parameters | Total (n = 16) | Female (n = 8) | Male (n = 8) | ||||||
|---|---|---|---|---|---|---|---|---|---|
| Mean ± SD | 95% CI Mean (Lower–Upper) | Min–Max | Mean ± SD | 95% CI Mean (Lower–Upper) | Min–Max | Mean ± SD | 95% CI Mean (Lower–Upper) | Min–Max | |
| Age | 37.94 ± 10.07 | 32.57–43.30 | 19–56 | 39.75 ± 9.004 | 32.222–47.278 | 30–56 | 36.13 ± 11.34 | 26.64–45.61 | 19–56 |
| Height (m) | 1.69 ± 0.08 | 1.65–1.73 | 1.57–1.88 | 1.628 ± 0.037 | 1.597–1.659 | 1.567–1.67 | 1.75 ± 0.07 | 1.69–1.81 | 1.66–1.88 |
| Weight (kg) | 72.45 ± 14.96 | 64.48–80.42 | 53.7–109.8 | 64 ± 10.391 | 55.313–72.687 | 53.7–80.8 | 80.90 ± 14.45 | 68.82–92.98 | 62–109.8 |
| BMI | 25.29 ± 4.06 | 23.13–27.46 | 19.82–34.5 | 24.2 ± 4.167 | 20.717–27.683 | 19.82–31.52 | 26.39 ± 3.90 | 23.13–29.65 | 21.1–34.5 |
| Waist (cm) | 83.88 ± 14.15 | 76.33–91.42 | 67–113 | 80.5 ± 18.323 | 65.182–95.818 | 67–113 | 87.25 ± 8.21 | 80.39–94.11 | 70–98 |
| Hip (cm) | 95.63 ± 8.22 | 91.24–100.01 | 82–109.5 | 93.813 ± 8.332 | 86.847–100.778 | 82–107 | 97.44 ± 8.24 | 90.55–104.33 | 85–109.5 |
| Waist/Hip ratio | 0.88 ± 0.17 | 0.79–0.97 | 0.66–1.29 | 0.87 ± 0.241 | 0.668–1.072 | 0.66–1.29 | 0.90 ± 0.05 | 0.86–0.93 | 0.82–0.96 |
| Triceps (mm) | 25.94 ± 10.16 | 20.52–31.35 | 15,888.00 | 31.75 ± 8.515 | 24.632–38.868 | 22–43 | 20.13 ± 8.46 | 13.05–27.20 | 12,601.00 |
| Chest (mm) | 14.19 ± 7.07 | 10.42–17.96 | 45,836.00 | 9.5 ± 2.777 | 7.178–11.822 | 45,823.00 | 18.88 ± 7.02 | 13.01–24.74 | 45,958.00 |
| MidAxilla (mm) | 21.44 ± 8.21 | 17.07–25.81 | 13,028.00 | 20.875 ± 8.593 | 13.691–28.059 | 12,754.00 | 22.00 ± 8.35 | 15.02–28.98 | 13,028.00 |
| Subscapula (mm) | 25.56 ± 7.83 | 21.39–29.74 | 14–37 | 25 ± 9.289 | 17.234–32.766 | 15–37 | 26.13 ± 6.66 | 20.55–31.70 | 14–33 |
| Suprailiac (mm) | 26.56 ± 8.69 | 21.93–31.19 | 15,311.00 | 26.25 ± 8.362 | 19.259–33.241 | 16–36 | 26.88 ± 9.57 | 18.88–34.87 | 15,311.00 |
| Abdomen (mm) | 32.28 ± 8.39 | 27.81–36.75 | 21–46 | 33 ± 10.474 | 24.243–41.757 | 21–46 | 31.56 ± 6.32 | 26.28–36.85 | 21–40 |
| Thigh (mm) | 28.56 ± 10.84 | 22.79–34.34 | 15,585.00 | 33.5 ± 7.892 | 26.902–40.098 | 22–42 | 23.63 ± 11.56 | 13.96–33.29 | 15,585.00 |
| % Body Fat | 27.92 ± 7.50 | 23.92–31.91 | 14.24–39.94 | 32.113 ± 6.882 | 26.36–37.867 | 23.752–39.935 | 23.72 ± 5.74 | 18.92–28.51 | 14.24–31.1 |
| Fat Mass (kg) | 20.43 ± 7.50 | 16.43–24.43 | 8.83–32.91 | 21.11 ± 7.768 | 14.616–27.604 | 13.11–32.26 | 19.75 ± 7.70 | 13.31–26.18 | 8.83–32.91 |
| Fat-Free Mass (kg) | 52.02 ± 11.04 | 46.14–57.91 | 38.78–76.89 | 42.89 ± 3.414 | 40.036–45.744 | 38.78–48.54 | 61.15 ± 7.69 | 54.73–67.58 | 53.17–76.89 |
| HRrest (bpm) | 75.25 ± 9.13 | 70.39–80.11 | 62–93 | 73.75 ± 5.97 | 68.759–78.741 | 68–84 | 76.75 ± 11.73 | 66.94–86.56 | 62–93 |
| HRpost (bpm) | 120.69 ± 14.66 | 112.87–128.50 | 98–151 | 119.125 ± 8.254 | 112.225–126.025 | 108–131 | 122.25 ± 19.67 | 105.80–138.70 | 98–151 |
| HR1min (bpm) | 88.63 ± 13.29 | 81.55–95.71 | 67–118 | 89.875 ± 10.302 | 81.263–98.487 | 77–104 | 87.38 ± 16.39 | 73.68–101.08 | 67–118 |
| Ruffier Index | 8.46 ± 3.21 | 6.74–10.17 | 2.7–16 | 8.275 ± 2.196 | 6.439–10.111 | 5.7–11.8 | 8.64 ± 4.15 | 5.17–12.11 | 2.7–16 |
| Ruffier–Dickson Index | 7.74 ± 2.55 | 6.38–9.11 | 3.8–13.5 | 8.137 ± 1.678 | 6.734–9.541 | 6–10.6 | 7.35 ± 3.29 | 4.60–10.10 | 3.8–13.5 |
| Estimated VO2max (mL·kg·min−1) | 28.57 ± 5.36 | 25.71–31.43 | 18.35–37.48 | 27.024 ± 4.439 | 23.312–30.735 | 18.35–32.01 | 30.12 ± 6.04 | 25.07–35.17 | 19.33–37.48 |
| Absolute VO2max (L/min) | 2.05 ± 0.48 | 1.80–2.30 | 1.06–2.91 | 1.716 ± 0.311 | 1.456–1.976 | 1.06–2.01 | 2.38 ± 0.37 | 2.08–2.69 | 1.72–2.91 |
Table A5.
Paired t-test results comparing baseline and after 8 weeks cycling.
Table A5.
Paired t-test results comparing baseline and after 8 weeks cycling.
| Parameters | Total (n = 16) | Female (n = 8) | Male (n = 8) | |||||||||
|---|---|---|---|---|---|---|---|---|---|---|---|---|
| t | p | Mean Difference | SE Difference | t | p | Mean Difference | SE Difference | t | p | Mean Difference | SE Difference | |
| Weight (kg) | 2.903 | 0.011 | 0.713 | 0.245 | −1.46 | 0.188 | −0.638 | 0.437 | −3.068 | 0.018 | −0.788 | 0.257 |
| BMI (kg/m2) | 2.678 | 0.017 | 0.248 | 0.092 | −1.414 | 0.2 | −0.24 | 0.17 | −2.891 | 0.023 | −0.255 | 0.088 |
| Waist (cm) | 2.588 | 0.021 | 0.987 | 0.382 | −1.076 | 0.318 | −0.537 | 0.5 | −2.556 | 0.038 | −1.438 | 0.563 |
| Hip (cm) | 0.093 | 0.927 | 0.069 | 0.739 | 0.933 | 0.382 | 0.55 | 0.589 | −0.501 | 0.632 | −0.688 | 1.372 |
| Waist/Hip ratio | 1.54 | 0.144 | 0.009 | 0.006 | −1.214 | 0.264 | −0.01 | 0.008 | −0.918 | 0.389 | −0.009 | 0.01 |
| Triceps (cm) | 1.225 | 0.239 | 0.844 | 0.689 | −1.488 | 0.18 | −0.625 | 0.42 | −0.783 | 0.46 | −1.063 | 1.358 |
| Chest (cm) | 0.098 | 0.923 | 0.063 | 0.636 | −0.509 | 0.626 | −0.25 | 0.491 | 0.103 | 0.921 | 0.125 | 1.217 |
| MidAxilla (cm) | 1.667 | 0.116 | 0.625 | 0.375 | −2.049 | 0.08 | −0.75 | 0.366 | −0.734 | 0.487 | −0.5 | 0.681 |
| Subscapula (cm) | 1 | 0.333 | 0.75 | 0.75 | 0 | 1 | 0 | 1.336 | −0.18 | 0.862 | −0.25 | 1.386 |
| Suprailiac (cm) | −0.255 | 0.802 | −0.125 | 0.491 | −6.352 | <0.001 | −7 | 1.102 | 0 | 1 | 0 | 0.681 |
| Abdomen (cm) | 1.308 | 0.211 | 1.219 | 0.932 | −0.033 | 0.974 | −0.063 | 1.867 | −1.198 | 0.27 | −2 | 1.669 |
| Thigh (cm) | 2.913 | 0.011 | 1.438 | 0.493 | −2.768 | 0.028 | −2.188 | 0.79 | −1.353 | 0.218 | −0.688 | 0.508 |
| Body Fat (%) | 3.023 | 0.009 | 4.813 | 1.592 | −2.034 | 0.081 | −0.636 | 0.313 | −1.472 | 0.184 | −0.374 | 0.254 |
| Fat Mass (Kg) | 2.555 | 0.022 | 0.505 | 0.197 | −2.242 | 0.06 | −0.606 | 0.27 | −2.135 | 0.07 | −0.535 | 0.251 |
| Fat-Free Mass (Kg) | −10.701 | <0.001 | −31.022 | 2.899 | −0.111 | 0.914 | −0.031 | 0.281 | −0.921 | 0.388 | −0.253 | 0.274 |
| HRrest (beats min−1) | 0.74 | 0.47 | 0.142 | 0.192 | −2.324 | 0.053 | −6.5 | 2.797 | −1.498 | 0.178 | −2.5 | 1.669 |
| HRpost (beats min−1) | 0.743 | 0.469 | 3.076 | 4.137 | −2.642 | 0.033 | −5.625 | 2.129 | −2.238 | 0.06 | −8.375 | 3.741 |
| HR1min (beats min−1) | −2.485 | 0.025 | −183.849 | 73.994 | −1.088 | 0.313 | −2.25 | 2.068 | −7.159 | <0.001 | −9.25 | 1.292 |
| Ruffier Index | 2.718 | 0.016 | 4.5 | 1.656 | −2.582 | 0.036 | −1.437 | 0.557 | −3.919 | 0.006 | −2.013 | 0.514 |
| Ruffier–Dickson Index | 3.318 | 0.005 | 7 | 2.11 | 0.929 | 0.384 | 0.288 | 0.31 | −4.546 | 0.003 | −2.188 | 0.481 |
| EstimatedVO2max (mL/kg/min) | 3.873 | 0.002 | 5.75 | 1.485 | 2.648 | 0.033 | 2.94 | 1.11 | 3.189 | 0.015 | 3.649 | 1.144 |
| AbsoluteVO2max (L/min) | 4.621 | <0.001 | 1.725 | 0.373 | 2.22 | 0.062 | 0.188 | 0.084 | 3.147 | 0.016 | 0.247 | 0.079 |
Table A6.
Spearman’s correlation for females.
Table A6.
Spearman’s correlation for females.
| Variable | DF-Weight | DF-BMI | DF-WHR | DF-BF% | DF-RI | DF-RDI | DF-ESVO2 | DF-ABVO2 | Total Distance (m) | |
|---|---|---|---|---|---|---|---|---|---|---|
| DF-Weight | Spearman’s rho | — | ||||||||
| p-value | — | |||||||||
| DF-BMI | Spearman’s rho | 0.994 *** | — | |||||||
| p-value | <0.001 | — | ||||||||
| DF-WHR | Spearman’s rho | 0.58 | 0.577 | — | ||||||
| p-value | 0.131 | 0.134 | — | |||||||
| DF-BF% | Spearman’s rho | 0.275 | 0.31 | 0.086 | — | |||||
| p-value | 0.509 | 0.462 | 0.84 | — | ||||||
| DF-RI | Spearman’s rho | 0.319 | 0.371 | 0.031 | 0.731 * | — | ||||
| p-value | 0.441 | 0.365 | 0.942 | 0.04 | — | |||||
| DF-RDI | Spearman’s rho | 0.036 | 0.036 | −0.111 | 0.539 | −0.078 | — | |||
| p-value | 0.932 | 0.933 | 0.793 | 0.168 | 0.854 | — | ||||
| DF-ESVO2 | Spearman’s rho | −0.12 | −0.048 | −0.049 | −0.095 | −0.12 | 0.072 | — | ||
| p-value | 0.778 | 0.935 | 0.908 | 0.84 | 0.778 | 0.866 | — | |||
| DF-ABVO2 | Spearman’s rho | 0.072 | 0.143 | 0.049 | 0.143 | 0.084 | 0.144 | 0.952 ** | — | |
| p-value | 0.866 | 0.752 | 0.908 | 0.752 | 0.844 | 0.734 | 0.001 | — | ||
| Total Distance (m) | Spearman’s rho | −0.491 | −0.476 | −0.282 | −0.548 | −0.551 | −0.036 | 0.071 | −0.214 | — |
| p-value | 0.217 | 0.243 | 0.498 | 0.171 | 0.157 | 0.933 | 0.882 | 0.619 | — |
* p < 0.05, ** p < 0.01, *** p < 0.001.
Table A7.
Spearman’s correlation for males.
Table A7.
Spearman’s correlation for males.
| Variable | DF-Weight | DF-BMI | DF-WHR | DF-BF% | DF-RI | DF-RDI | DF-ESVO2 | DF-ABVO2 | Total Distance (m) | |
|---|---|---|---|---|---|---|---|---|---|---|
| 1. DF-Weight | Spearman’s rho | — | ||||||||
| p-value | — | |||||||||
| 2. DF-BMI | Spearman’s rho | 0.994 *** | — | |||||||
| p-value | <0.001 | — | ||||||||
| 3. DF-WHR | Spearman’s rho | 0.239 | 0.218 | — | ||||||
| p-value | 0.568 | 0.603 | — | |||||||
| 4. DF-BF% | Spearman’s rho | −0.109 | −0.12 | −0.315 | — | |||||
| p-value | 0.797 | 0.776 | 0.448 | — | ||||||
| 5. DF-RI | Spearman’s rho | −0.83 * | −0.867 ** | −0.424 | 0.404 | — | ||||
| p-value | 0.011 | 0.005 | 0.295 | 0.321 | — | |||||
| 6. DF-RDI | Spearman’s rho | −0.337 | −0.371 | −0.383 | 0.168 | 0.491 | — | |||
| p-value | 0.414 | 0.365 | 0.349 | 0.691 | 0.217 | — | ||||
| 7. DF-ESVO2 | Spearman’s rho | −0.554 | −0.587 | 0.038 | −0.156 | 0.563 | 0.714 | — | ||
| p-value | 0.154 | 0.126 | 0.928 | 0.713 | 0.146 | 0.058 | — | |||
| 8. DF-ABVO2 | Spearman’s rho | −0.639 | −0.659 | 0.038 | −0.12 | 0.563 | 0.738 * | 0.976 *** | — | |
| p-value | 0.088 | 0.076 | 0.928 | 0.778 | 0.146 | 0.046 | <0.001 | — | ||
| 9. Total Distance (m) | Spearman’s rho | 0.349 | 0.287 | 0.179 | −0.24 | −0.036 | −0.262 | −0.071 | −0.238 | — |
| p-value | 0.396 | 0.49 | 0.672 | 0.568 | 0.933 | 0.536 | 0.882 | 0.582 | — |
* p < 0.05, ** p < 0.01, *** p < 0.001.
Table A8.
Spearman’s correlation for age < 35years old.
Table A8.
Spearman’s correlation for age < 35years old.
| Variable | DF-Weight | DF-BMI | DF-WHR | DF-BF% | DF-RI | DF-RDI | DF-ESVO2 | DF-ABVO2 | Total Distance (m) | |
|---|---|---|---|---|---|---|---|---|---|---|
| DF-Weight | Spearman’s rho | 0.982 *** | — | |||||||
| p-value | <0.001 | — | ||||||||
| DF-BMI | Spearman’s rho | 0.185 | 0.145 | — | ||||||
| p-value | 0.691 | 0.756 | — | |||||||
| DF-WHR | Spearman’s rho | −0.358 | −0.396 | 0.037 | — | |||||
| p-value | 0.431 | 0.379 | 0.938 | — | ||||||
| DF-BF% | Spearman’s rho | −0.844 * | −0.847 * | 0.128 | 0.336 | — | ||||
| p-value | 0.017 | 0.016 | 0.784 | 0.461 | — | |||||
| DF-RI | Spearman’s rho | 0.2 | 0.143 | 0.018 | 0.072 | −0.505 | — | |||
| p-value | 0.667 | 0.783 | 0.969 | 0.878 | 0.248 | — | ||||
| DF-RDI | Spearman’s rho | 0.473 | 0.429 | 0.655 | 0.18 | −0.054 | 0.071 | — | ||
| p-value | 0.284 | 0.354 | 0.111 | 0.699 | 0.908 | 0.906 | — | |||
| DF-ESVO2 | Spearman’s rho | 0.473 | 0.5 | 0.582 | 0.09 | −0.09 | −0.036 | 0.929 ** | — | |
| p-value | 0.284 | 0.267 | 0.17 | 0.848 | 0.848 | 0.963 | 0.007 | — | ||
| DF-ABVO2 | Spearman’s rho | 0.182 | 0.071 | 0.218 | −0.613 | −0.18 | 0.321 | −0.071 | −0.286 | — |
| p-value | 0.696 | 0.906 | 0.638 | 0.144 | 0.699 | 0.498 | 0.906 | 0.556 | — | |
| Total Distance (m) | Spearman’s rho | 0.982 *** | — | |||||||
| p-value | <0.001 | — |
* p < 0.05, ** p < 0.01, *** p < 0.001.
Table A9.
Spearman’s correlation for age > 35 years old.
Table A9.
Spearman’s correlation for age > 35 years old.
| Variable | DF-Weight | DF-BMI | DF-WHR | DF-BF% | DF-RI | DF-RDI | DF-ESVO2 | DF-ABVO2 | Total Distance (m) | |
|---|---|---|---|---|---|---|---|---|---|---|
| DF-Weight | Spearman’s rho | — | ||||||||
| p-value | — | |||||||||
| DF-BMI | Spearman’s rho | 0.998 *** | — | |||||||
| p-value | <0.001 | — | ||||||||
| DF-WHR | Spearman’s rho | 0.106 | 0.134 | — | ||||||
| p-value | 0.786 | 0.731 | — | |||||||
| DF-BF% | Spearman’s rho | 0.56 | 0.546 | −0.04 | — | |||||
| p-value | 0.117 | 0.129 | 0.919 | — | ||||||
| DF-RI | Spearman’s rho | 0.253 | 0.264 | −0.232 | 0.331 | — | ||||
| p-value | 0.511 | 0.492 | 0.548 | 0.384 | — | |||||
| DF-RDI | Spearman’s rho | −0.026 | −0.053 | −0.537 | 0.166 | 0.696 * | — | |||
| p-value | 0.948 | 0.892 | 0.136 | 0.669 | 0.037 | — | ||||
| DF-ESVO2 | Spearman’s rho | −0.69 * | −0.676 * | −0.246 | −0.309 | 0.228 | 0.215 | — | ||
| p-value | 0.039 | 0.046 | 0.524 | 0.419 | 0.555 | 0.578 | — | |||
| DF-ABVO2 | Spearman’s rho | −0.65 | −0.636 | −0.288 | −0.286 | 0.252 | 0.245 | 0.997 *** | — | |
| p-value | 0.058 | 0.065 | 0.453 | 0.455 | 0.512 | 0.526 | <0.001 | — | ||
| Total Distance (m) | Spearman’s rho | −0.201 | −0.187 | 0.575 | −0.214 | −0.283 | −0.51 | 0.184 | 0.133 | — |
| p-value | 0.604 | 0.63 | 0.105 | 0.58 | 0.46 | 0.161 | 0.635 | 0.734 | — |
* p < 0.05, *** p < 0.001.

Figure A1.
Power contour. The power contour plot shows how the sensitivity of the test changes with the hypothetical effect size and the sample sizes in the design. As we increase the sample sizes, smaller effect sizes become reliably detectable. The power contour plot shows how the sensitivity of the test changes with the hypothetical effect size and the sample sizes in the design. As we increase the sample sizes, smaller effect sizes become reliably detectable.

Figure A2.
Power Curve by Effect Size. The power curve above shows how the sensitivity of the test and design is larger for larger effect sizes. If we obtained sample sizes of 16 our test and design would have power of at least 0.465 to effect sizes of |δ| > 0.5. We would be more than likely to miss (power less than 50%) effect sizes less than |δ|=0.524.
References
- DiPietro, L.; Buchner, D.M.; Marquez, D.X.; Pate, R.R.; Pescatello, L.S.; Whitt-Glover, M.C. New Scientific Basis for the 2018 U.S. Physical Activity Guidelines. J. Sport Health Sci. 2019, 8, 197–200. [Google Scholar] [CrossRef]
- Sener, I.N.; Lee, K.; Durand, C.P.; Oluyomi, A.O.; Kohl, H.W., III. Intention to use light-rail transit in Houston, Texas, United States: Findings from the travel-related activity in neighborhoods study. Int. J. Sustain. Transp. 2021, 14, 944–955. [Google Scholar] [CrossRef]
- WHO. WHO Guidelines on Physical Activity and Sedentary Behaviour: At a Glance; WHO: Geneva, Switzerland, 2020; p. 535.
- WHO. Global Status Report on Physical Activity 2022; WHO: Geneva, Switzerland, 2022; ISBN 9789240059153.
- Zhao, M.; Veeranki, S.P.; Magnussen, C.G.; Xi, B. Recommended Physical Activity and All Cause and Cause Specific Mortality in US Adults: Prospective Cohort Study. BMJ 2020, 370, m2031. [Google Scholar] [CrossRef]
- Moore, S.C.; Lee, I.M.; Weiderpass, E.; Campbell, P.T.; Sampson, J.N.; Kitahara, C.M.; Keadle, S.K.; Arem, H.; De Gonzalez, A.B.; Hartge, P.; et al. Association of Leisure-Time Physical Activity with Risk of 26 Types of Cancer in 1.44 Million Adults. JAMA Intern. Med. 2016, 176, 816–825. [Google Scholar] [CrossRef]
- Mora, S.; Cook, N.; Buring, J.E.; Ridker, P.M.; Lee, I.M. Physical Activity and Reduced Risk of Cardiovascular Events: Potential Mediating Mechanisms. Circulation 2007, 116, 2110–2118. [Google Scholar] [CrossRef]
- WHO. Walking and Cycling: Latest Evidence to Support Policy-Making and Practice; WHO: Geneva, Switzerland, 2022; ISBN 9789289057882.
- Ezzatvar, Y.; Izquierdo, M.; Núñez, J.; Calatayud, J.; Ramírez-Vélez, R.; García-Hermoso, A. Cardiorespiratory Fitness Measured with Cardiopulmonary Exercise Testing and Mortality in Patients with Cardiovascular Disease: A Systematic Review and Meta-Analysis. J. Sport. Health Sci. 2021, 10, 609–619. [Google Scholar] [CrossRef]
- Falkai, P.; Schmitt, A.; Rosenbeiger, C.P.; Maurus, I.; Hattenkofer, L.; Hasan, A.; Malchow, B.; Heim-Ohmayer, P.; Halle, M.; Heitkamp, M. Aerobic Exercise in Severe Mental Illness: Requirements from the Perspective of Sports Medicine; Springer: Berlin/Heidelberg, Germany, 2022; Volume 272, ISBN 0123456789. [Google Scholar]
- Weikart, D.; Lin, D.; Dhingra, R.; Al-Shaar, L.; Sturgeon, K. Pre-Diagnosis Diet and Physical Activity and Risk of Cardiovascular Disease Mortality among Female Cancer Survivors. Cancers 2022, 14, 3096. [Google Scholar] [CrossRef]
- Mok, A.; Khaw, K.T.; Luben, R.; Wareham, N.; Brage, S. Physical Activity Trajectories and Mortality: Population Based Cohort Study. BMJ 2019, 365, l2323. [Google Scholar] [CrossRef] [PubMed]
- Lam, W.W.Y.; Loo, B.P.Y.; Mahendran, R. Neighbourhood Environment and Depressive Symptoms among the Elderly in Hong Kong and Singapore. Int. J. Health Geogr. 2020, 19, 48. [Google Scholar] [CrossRef] [PubMed]
- Gražulevičienė, R.; Andrušaitytė, S.; Dėdelė, A.; Gražulevičius, T.; Valius, L.; Kapustinskienė, V.; Bendokienė, I. Environmental Quality Perceptions and Health: A Cross-Sectional Study of Citizens of Kaunas, Lithuania. Int. J. Environ. Res. Public Health 2020, 17, 4420. [Google Scholar] [CrossRef] [PubMed]
- Buli, B.G.; Tillander, A.; Fell, T.; Bälter, K. Active Commuting and Healthy Behavior among Adolescents in Neighborhoods with Varying Socioeconomic Status: The NESLA Study. Int. J. Environ. Res. Public Health 2022, 19, 3784. [Google Scholar] [CrossRef] [PubMed]
- Herrmann-Lunecke, M.G.; Mora, R.; Vejares, P. Perception of the Built Environment and Walking in Pericentral Neighbourhoods in Santiago, Chile. Travel Behav. Soc. 2021, 23, 192–206. [Google Scholar] [CrossRef]
- Perez, L.G.; Kerr, J.; Sallis, J.F.; Slymen, D.; McKenzie, T.L.; Elder, J.P.; Arredondo, E.M. Perceived Neighborhood Environmental Factors That Maximize the Effectiveness of a Multilevel Intervention Promoting Physical Activity Among Latinas. Am. J. Health Promot. 2018, 32, 334–343. [Google Scholar] [CrossRef]
- European Commission. Sport and Physical Activity Project Title Special Eurobarometer 525-Sport and Physical Activity; European Commission: Brussels, Belgium, 2022.
- Boldina, A.; Chung, H.C.; Santos, A.M.C.; Steemers, K. Active Urbanism: Heart Rate and Oxygen Consumption Comparison When Walking on Imitation Steppingstones versus a Plain Surface. Cities Health 2022, 7, 398–415. [Google Scholar] [CrossRef]
- Aktürk, Ü.; Aktürk, S.; Erci, B. The Effects of Depression, Personal Characteristics, and Some Habits on Physical Activity in the Elderly. Perspect. Psychiatr. Care 2019, 55, 112–118. [Google Scholar] [CrossRef]
- Notthoff, N.; Reisch, P.; Gerstorf, D. Individual Characteristics and Physical Activity in Older Adults: A Systematic Review. Gerontology 2017, 63, 443–459. [Google Scholar] [CrossRef]
- Louro, A.; Franco, P.; da Costa, E.M. Determinants of Physical Activity Practices in Metropolitan Context: The Case of Lisbon Metropolitan Area, Portugal. Sustainability 2021, 13, 10104. [Google Scholar] [CrossRef]
- Congiu, T.; Sotgiu, G.; Castiglia, P.; Azara, A.; Piana, A.; Saderi, L.; Dettori, M. Built Environment Features and Pedestrian Accidents: An Italian Retrospective Study. Sustainability 2019, 11, 1064. [Google Scholar] [CrossRef]
- Kroesen, M.; van Wee, B. Understanding How Accessibility Influences Health via Active Travel: Results from a Structural Equation Model. J. Transp. Geogr. 2022, 102, 103379. [Google Scholar] [CrossRef]
- Tobia, L.; Scatigna, M.; Tolli, E.; Monache, S.D.; Vinciguerra, M.G.; Fabiani, L. The Implementation of a Workplace Physical Exercise Program at a University. Healthcare 2025, 13, 2195. [Google Scholar] [CrossRef]
- Tafireyi, C.G.S.; Grace, J.M. Status of the Health Promoting University (HPU) Globally and Its Relevance for Emerging African HPUs: An Integrative Review and Bibliometric Analysis. Glob. Health Promot. 2024, 31, 42–59. [Google Scholar] [CrossRef]
- ISCA. Report on Policy and Practice to Strengthen the Health Promoting School Approach Across the EU; Schools4Health: Brussels, Belgium, 2024. [Google Scholar]
- Suárez-Reyes, M.; Van den Broucke, S. Participation of University Community Members in Health Promoting University (HPU) Initiatives. Front. Public Health 2023, 11, 1217177. [Google Scholar] [CrossRef] [PubMed]
- Brau, L.; Ly, M. WISE-Initiatives and Strategies in Favour of Student Well-Being in Europe; Animafac: Paris, France, 2023. [Google Scholar]
- Van den Steen, N.; Herteleer, B.; Cappelle, J.; Vanhaverbeke, L. Motivations and Barriers for Using Speed Pedelecs for Daily Commuting. World Electr. Veh. J. 2019, 10, 87. [Google Scholar] [CrossRef]
- Jenkins, M.; Lustosa, L.; Chia, V.; Wildish, S.; Tan, M.; Hoornweg, D.; Lloyd, M.; Dogra, S. What Do We Know about Pedal Assist E-Bikes? A Scoping Review to Inform Future Directions. Transp. Policy 2022, 128, 25–37. [Google Scholar] [CrossRef]
- Philips, I.; Anable, J.; Chatterton, T. E-Bikes and Their Capability to Reduce Car CO2 Emissions. Transp. Policy 2022, 116, 11–23. [Google Scholar] [CrossRef]
- Oyeyemi Olayode, I.; Jamei, E.; Justice Alex, F. Integration of E-Bikes in Public Transportation Based on Their Impact, Importance, and Challenges: A Systematic Review. Multimodal Transp. 2025, 4, 100182. [Google Scholar] [CrossRef]
- Ogbu, I.S.; Obeagu, E.I. Anthropometric Parameters in Health and Diseases: A Review. Elite J. Public Health 2024, 2, 62–70. [Google Scholar]
- Cao, Q.; Yu, S.; Xiong, W.; Li, Y.; Li, H.; Li, J.; Li, F. Waist-Hip Ratio as a Predictor of Myocardial Infarction Risk A Systematic Review and Meta-Analysis. Medicine 2018, 97, e11639. [Google Scholar] [CrossRef]
- De, K. Waist Circumference, Waist-Hip Ratio and Body Mass Index in Assessing Nutritional Status and Central Obesity of Adolescent. Glob. J. Archaeol. Anthropol. 2017, 1, 555552. [Google Scholar] [CrossRef]
- Qin, G.; Qin, Y.; Liu, B. Association between BMI and Health-Related Physical Fitness: A Cross-Sectional Study in Chinese High School Students. Front. Public Health 2022, 10, 1047501. [Google Scholar] [CrossRef]
- Ke, J.F.; Wang, J.W.; Lu, J.X.; Zhang, Z.H.; Liu, Y.; Li, L.X. Waist-to-Height Ratio Has a Stronger Association with Cardiovascular Risks than Waist Circumference, Waist-Hip Ratio and Body Mass Index in Type 2 Diabetes. Diabetes Res. Clin. Pract. 2022, 183, 109151. [Google Scholar] [CrossRef]
- Catovic, A.; Halilovic, A. A Cross-Sectional Study on Assessment of Physical Activity Level and Anthropometric Indicators of Health Risk Among Students of Sixth Year of Faculty of Medicine of Sarajevo University. World J. Adv. Res. Rev. 2020, 2020, 2581–9615. [Google Scholar] [CrossRef]
- Kuo, F.C.; Lu, C.H.; Wu, L.W.; Kao, T.W.; Su, S.C.; Liu, J.S.; Chen, K.C.; Chang, C.H.; Kuo, C.C.; Lee, C.H.; et al. Comparison of 7-Site Skinfold Measurement and Dual-Energy X-Ray Absorptiometry for Estimating Body Fat Percentage and Regional Adiposity in Taiwanese Diabetic Patients. PLoS ONE 2020, 15, e0236323. [Google Scholar] [CrossRef]
- ACSM. ACSM’s Guidelines for Exercise Testing and Prescription; Wolters Kluwer Health: Waltham, MA, USA, 2010. [Google Scholar]
- Jagim, A.R.; Tinsley, G.M.; Merfeld, B.R.; Ambrosius, A.; Khurelbaatar, C.; Dodge, C.; Carpenter, M.; Luedke, J.; Erickson, J.L.; Fields, J.B.; et al. Validation of Skinfold Equations and Alternative Methods for the Determination of Fat-Free Mass in Young Athletes. Front. Sports Act. Living 2023, 5, 1240252. [Google Scholar] [CrossRef] [PubMed]
- Lang, J.J.; Phillips, E.W.; Orpana, H.M.; Tremblay, M.S.; Ross, R.; Ortega, F.B.; Silva, D.A.S.; Tomkinson, G.R. Field-Based Measurement of Cardiorespiratory Fitness to Evaluate Physical Activity Interventions. Bull. World Health Organ. 2018, 96, 794–796. [Google Scholar] [CrossRef]
- Canizares Fernandez, L.; Czarina, L.; Chavez, A. Field-Based Measurement of Cardiorespiratory Fitness for Children and the Youth in Low- and Middle-Income Settings. In Updates in Physical Fitness in Children; IntechOpen: London, UK, 2023. [Google Scholar]
- Ayán Pérez, C.; Reigosa Galáns, F.; Cancela Carral, J.M.; Rodríguez Barreiro, H.; Martínez-Lemos, I. Test-Retest Reliability and Convergent Validity of the Ruffier Index in Children Under 12 Years Old. Sci. Sports 2018, 33, 353–360. [Google Scholar] [CrossRef]
- Kidd, J.; Luden, N.D.; Saunders, M.J.; Womack, C.J. Validity and Reliability of the YMCA Submaximal Cycle Test Using an Electrically Braked Ergometer. Med. Sci. Sports Exerc. 2019, 51, 936. [Google Scholar] [CrossRef]
- Guo, Y.; Bian, J.; Li, Q.; Leavitt, T.; Rosenberg, E.I.; Buford, T.W.; Smith, M.D.; Vincent, H.K.; Modave, F. A 3-Minute Test of Cardiorespiratory Fitness for Use in Primary Care Clinics. PLoS ONE 2018, 13, e0201598. [Google Scholar] [CrossRef]
- Sartor, F.; Bonato, M.; Papini, G.; Bosio, A.; Mohammed, R.A.; Bonomi, A.G.; Moore, J.P.; Merati, G.; La Torre, A.; Kubis, H.P. A 45-Second Self-Test for Cardiorespiratory Fitness: Heart Rate-Based Estimation in Healthy Individuals. PLoS ONE 2016, 11, e0168154. [Google Scholar] [CrossRef]
- Trovato, B.; Roggio, F.; Petrigna, L.; Musumeci, G. Modified Isoinertial-Based Ruffier Test in Healthy Individuals: A Feasibility Study. J. Funct. Morphol. Kinesiol. 2023, 8, 36. [Google Scholar] [CrossRef]
- Beekley, M.D.; Brechue, W.F.; Garzarella, L.; Werber-Zion, G.; Pollock, M.L. Cross-Validation of the Ymca Submaximal Cycle Ergometer Test to Predict VO2max. Res. Q. Exerc. Sport 2004, 75, 337–342. [Google Scholar] [CrossRef] [PubMed]
- Jamnick, N.A.; By, S.; Pettitt, C.D.; Pettitt, R.W. Comparison of the YMCA and a Custom Submaximal Exercise Test for Determining VO2max. Med. Sci. Sports Exerc. 2016, 48, 254–259. [Google Scholar] [CrossRef] [PubMed]
- Naruse, M.; Vincenty, C.S.; Konopka, A.R.; Trappe, S.W.; Harber, M.P.; Trappe, T.A. Cycle Exercise Training and Muscle Mass: A Preliminary Investigation of 17 Lower Limb Muscles in Older Men. Physiol. Rep. 2023, 11, e15781. [Google Scholar] [CrossRef] [PubMed]
- Rhee, E.J. Weight Cycling and Its Cardiometabolic Impact. J. Obes. Metab. Syndr. 2017, 26, 237–242. [Google Scholar] [CrossRef]
- Betz, M.W.; Monsegue, A.P.; Houben, L.H.P.; Hendriks, F.K.; van Kranenburg, J.; Aussieker, T.; Adriaans, B.P.; Houben, A.J.H.M.; Verdijk, L.B.; van Loon, L.J.C.; et al. Aerobic Exercise Preconditioning Does Not Augment Muscle Hypertrophy During Subsequent Resistance Exercise Training in Healthy Older Adults. Sports Med. 2025, 55, 2323–2338. [Google Scholar] [CrossRef]
- Shah, H.; Mali, S.; Ranga, S.; Jadhav, C.; Rukadikar, A.; Singh, A.K.; Shamnani, G. Effect of Body Mass Index on Cardiorespiratory Parameters Among Medical Students: A Cross-Sectional Study. Int. J. Physiol. Pathophysiol. Pharmacol. 2022, 14, 4–9. [Google Scholar]
- Song, X.; Cui, X.; Su, W.; Shang, X.; Tao, M.; Wang, J.; Liu, C.; Sun, Y.; Yun, H. Comparative Effects of High-Intensity Interval Training and Moderate-Intensity Continuous Training on Weight and Metabolic Health in College Students with Obesity. Sci. Rep. 2024, 14, 16558. [Google Scholar] [CrossRef]
- Paley, C.A.; Johnson, M.I. Abdominal Obesity and Metabolic Syndrome: Exercise as Medicine? BMC Sports Sci. Med. Rehabil. 2018, 10, 7. [Google Scholar] [CrossRef]
- Cotie, L.M.; Marçal, I.R.; Way, K.L.; Lee, L.S.; Patterson, M.; Pearson, M.; Main, E.; Thornton, J.S.; Reed, J.L.; Banks, L. Sex Differences in Cardiovascular Adaptations Following Aerobic Exercise Training Programs: A Systematic Review and Meta-Analysis. Can. J. Cardiol. 2025, 41, 337–353. [Google Scholar] [CrossRef]
- Morrison, B.N.; Mittermaier, P.M.; Lester, G.R.; Bodner, M.E.; Cote, A.T. Sex Differences in Ventricular-Vascular Interactions Associated with Aerobic Capacity. Echo Res. Pract. 2025, 12, 2. [Google Scholar] [CrossRef]
- Santisteban, K.J.; Lovering, A.T.; Halliwill, J.R.; Minson, C.T. Sex Differences in VO2max and the Impact on Endurance-Exercise Performance. Int. J. Environ. Res. Public Health 2022, 19, 4946. [Google Scholar] [CrossRef]
- Lee, J.; Zhang, X. Is There Really a Proportional Relationship between VO2max and Body Weight? A Review Article. PLoS ONE 2021, 16, e0261519. [Google Scholar] [CrossRef] [PubMed]
- Kraemer, W.J.; Fragala, M.S.; Ratamess, N.A. Evolution of Resistance Training in Women: History and Mechanisms for Health and Performance. Sports Med. Health Sci. 2025, 7, 351–365. [Google Scholar] [CrossRef]
- Singh, H.; Esht, V.; Shaphe, M.A.; Rathore, N.; Chahal, A.; Kashoo, F.Z. Relationship between Body Mass Index and Cardiorespiratory Fitness to Interpret Health Risks among Sedentary University Students from Northern India: A Correlation Study. Clin. Epidemiol. Glob. Health 2023, 20, 101254. [Google Scholar] [CrossRef]
- Ullah, Z.; Ijaz, S.; Iqbal, A. Effect of Circuit Training on Maximum Oxygen Uptake (VO2max) of Adolescents. Sports Sci. Phys. Educ. Rev. 2024, 3, I–VIII. [Google Scholar]
- Powell-Wiley, T.M.; Poirier, P.; Burke, L.E.; Després, J.P.; Gordon-Larsen, P.; Lavie, C.J.; Lear, S.A.; Ndumele, C.E.; Neeland, I.J.; Sanders, P.; et al. Obesity and Cardiovascular Disease a Scientific Statement from the American Heart Association. Circulation 2021, 143, E984–E1010. [Google Scholar] [CrossRef]
- Rynda, V.M.; Qudsiyah, I.; Maharani, N.K.A.; Vera, D.; Rachelia, N.C.N.; Augusto, K.; Wulandari, M.A.M.; Juhanna, I.V. General Perspective of Cycling in Cardiovascular Health Associated with the Aging Process. Sport Fit. J. 2022, 10, 60–68. [Google Scholar] [CrossRef]
- Citherlet, T.; Mota, G.R.; Carletta, M.; Hayoz, K.; Pereira, D.S.; Millet, G.P. Effectiveness of Short-Term Cycling Interventions in Older Adults: A Randomized Trial of Hypoxic, Blood Flow Restriction, and Eccentric Cycling. Sci. Rep. 2025, 15, 25914. [Google Scholar] [CrossRef]
- Almquist, N.W.; Hansen, J.; Rønnestad, B.R. Development of Cycling Performance Variables and Durability in Female and Male National Team Cyclists: From Junior to Senior. Med. Sci. Sports Exerc. 2023, 55, 2053–2063. [Google Scholar] [CrossRef] [PubMed]
- Mabe-Castro, D.; Castillo-Aguilar, M.; Mabe-Castro, M.; Muñoz, R.M.; Basualto-Alarcón, C.; Nuñez-Espinosa, C.A. Associations between Physical Fitness, Body Composition, and Heart Rate Variability during Exercise in Older People: Exploring Mediating Factors. PeerJ 2024, 12, e18061. [Google Scholar] [CrossRef] [PubMed]
- Tegegne, T.K.; Rawstorn, J.C.; Skärsäter, I.; Hertz, A.-C.; Maddison, R. Acceptability of Cycling with Virtual Reality Among Older Adults Living Independently in a Retirement Village: An Observational Study. J. Aging Phys. Act. 2025, 33, 565–573. [Google Scholar] [CrossRef]
- Jurak, G.; Soric, M.; Sember, V.; Djuric, S.; Starc, G.; Kovac, M.; Leskosek, B. Associations of Mode and Distance of Commuting to School with Cardiorespiratory Fitness in Slovenian Schoolchildren: A Nationwide Cross-Sectional Study. BMC Public Health 2021, 21, 291. [Google Scholar] [CrossRef] [PubMed]
- Møller, N.C.; Østergaard, L.; Gade, J.R.; Nielsen, J.L.; Andersen, L.B. The Effect on Cardiorespiratory Fitness after an 8-Week Period of Commuter Cycling—A Randomized Controlled Study in Adults. Prev. Med. 2011, 53, 172–177. [Google Scholar] [CrossRef] [PubMed]
- Garcia-Pastor, T.; Salinero, J.J.; Sanz-Frias, D.; Pertusa, G.; Del Coso, J. Body Fat Percentage Is More Associated with Low Physical Fitness than with Sedentarism and Diet in Male and Female Adolescents. Physiol. Behav. 2016, 165, 166–172. [Google Scholar] [CrossRef] [PubMed]
Disclaimer/Publisher’s Note: The statements, opinions and data contained in all publications are solely those of the individual author(s) and contributor(s) and not of MDPI and/or the editor(s). MDPI and/or the editor(s) disclaim responsibility for any injury to people or property resulting from any ideas, methods, instructions or products referred to in the content. |
© 2026 by the authors. Licensee MDPI, Basel, Switzerland. This article is an open access article distributed under the terms and conditions of the Creative Commons Attribution (CC BY) license.