Abstract
Two towns in Renosterberg Local Municipality (RLM) in the Northern Cape Province of South Africa, Petrusville and Philipstown, have high Fetal Alcohol Spectrum Disorder (FASD) prevalence rates. FASD is linked to poverty and imposes high national economic costs. Thus, it is critical to understand the local economic development (LED) strategies used to mitigate the high prevalence of FASD. Moreover, there is sparse literature examining adult communities where FASD children reside. Understanding these adult communities is important because FASD cannot exist without adult gestational exposure to alcohol consumption. Using a mixed-method approach, this study uses a six-phase analytic approach to investigate the drinking culture and drinking motives in RLM, applied to two cross-sectional in-depth community needs assessments, five in-depth interviews, and three focus groups. This study also evaluates how the RLM targets FASD, as well as binge and risky drinking, in its municipal economic strategy by analysing its Integrated Development Plan (IDP) with respect to an eight-stage policy development process. The results indicate that 57% of respondents expressed concern regarding the unhealthy drinking culture in RLM, 40% felt that the residents of RLM drank in response to unemployment-related hopelessness, and 52% attributed the drinking culture to a lack of hobbies and recreational opportunities. The results of an analysis of the RLM IDP through the lens of Ryder’s eight-stage policy development process suggest that the decisive policy development process is not open to the public and that, furthermore, FASD is neglected. A dedicated alcohol consumption census-style study is recommended to broadly capture alcohol consumption in RLM, allowing researchers to identify the exact alcohol consumption patterns and priority areas for the IDP and public health policy. RLM should directly publicise its policy development process so that its IDP is inclusively formulated to address FASD, risky drinking, binge drinking, and gestational alcohol consumption.
1. Introduction
Alcohol is an important part of various cultural and recreational practices. However, it has also been linked to several harmful behaviours [1]. The use of alcohol during pregnancy is one such harmful behaviour. Globally, the estimated prevalence of alcohol use during pregnancy is 9.8% [1]. Alcohol consumption during pregnancy can create several challenges for infants, such as Fetal Alcohol Spectrum Disorder (FASD) [2]. FASD affects many Coloured, otherwise known as people of mixed heritage, communities across South Africa’s Cape region, a remnant of the dop system of apartheid-era South Africa [3]. The dop system (dop is the Afrikaans word for an alcoholic drink) is a system where alcoholic beverages were offered to farmworkers as their weekly wage instead of payment [4]. South Africa has reported FASD prevalence rates ranging from 6.7 per 1000 Grade 1 children in the Saldana Bay Local Municipality (SBLM) to 282 per 1000 Grade 1 children in the Renosterberg Local Municipality (RLM) [5,6,7]. The literature on FASD in South Africa focuses predominantly on childhood prevalence. There is sparse literature examining adult communities where FASD children reside. Understanding these adult communities is important because FASD cannot exist without adult gestational exposure to alcohol consumption.
Two towns in RLM in the Northern Cape Province of South Africa, namely Petrusville and Philipstown, have alarmingly high reported prevalence rates of FASD [3]. Moreover, the socioeconomic conditions in RLM are bleak. Most males seek employment outside the RLM in other municipalities or provinces in South Africa [8]. Women have limited economic opportunities for sustainable livelihoods [8]. From a local government perspective, RLM is classified as one of the ten least efficient municipalities in South Africa [9].
Local Economic Development (LED) is defined as an adaptive and responsive process where various partners work collectively to improve economic conditions for innovation-driven inclusive economic development in a specific area, in this case at the municipal level. Inclusive economic development is characterised by the achievement of knowledge transfer, employment generation, competence building, and revenue generation in a local area in order to improve its economic future and the quality of life for its inhabitants [10]. LED offers solutions to address socioeconomic challenges in local municipalities. There are many examples of successful applications of the LED approach, one of which is the case of a waste management initiative in Mutare, Zimbabwe [11]. The National Framework for Local Economic Development 2018/2028 (NFLED) in South Africa was developed to stimulate and cultivate a deeper understanding of LED [10]. The NFLED aims to provide strategic guidance to the key players and decision makers to identify local opportunities to adequately address local needs.
The linkage between poverty and mothers of children with FASD has been documented in the literature [12]. For example, women with lower socioeconomic status have a higher risk of bearing children with FASD [13,14]. Moreover, women with FASD children have lower levels of education and income and are employed far less frequently [13,14]. There are linkages between higher economic status and mothers of children with FASD [15]. However, these studies were conducted in developed countries such as Spain [16], the United Kingdom [17], and Australia [18]. FASD imposes high economic costs for the government and individuals [19]. For example, in Canada, FASD imposes both direct costs, e.g., screening, diagnosis, childcare, and special education, and indirect costs, e.g., productivity losses due to premature mortality, morbidity, and law enforcement, on the healthcare system. In 2013, the total overall FASD-related costs in Canada ranged from CAD 1,287,707,594 to CAD 23,412,655,151 [20]. Therefore, it is important to understand the LED strategies that can be used to mitigate the high prevalence of FASD. The aim of this study is to explore the socioeconomic status, drinking culture, and drinking motives of residents in RLM, as well as the current municipal economic strategies, to provide practical recommendations for future consideration.
2. Materials and Methods
2.1. Study Setting and Dataset
Data sources for the RLM are relatively sparse. As a result, this study makes use of multiple data sources. A mixed-method approach is defined as analysing both quantitative and qualitative primary and/or secondary data [21,22]. The study uses a mixed-method research design through an integrated analysis of various qualitative and quantitative primary and secondary data, as indicated in Table 1, some of which are not publicly available. The use of primary and secondary data sources received ethical clearance from the authors’ university research ethics committee and is outlined further in the Ethics Committee Statement at the end of this paper.

Table 1.
Summary of data sources.
Situated on the border with the Free State, Petrusville is the largest town in the RLM and is one of eight within the Pixley ka Seme district. The second largest town is Philipstown, followed by Vanderkloof [23]. For the primary data sources, applied convenience sampling was used for Petrusville and Philipstown, as this was logistically more manageable and cost effective. As a result, the study excluded the Vanderkloof population of 1228 people [23].
2.2. Instruments
The data collection instruments for the primary research component of the study consisted of focus groups and telephonic, structured, in-depth interviews. Due to COVID-19 pandemic restrictions, all primary research was undertaken virtually by the first author using the Microsoft Teams 2021 (Microsoft Teams is a messaging app used in organization workspaces for collaboration and communication in real time, as well as for meetings and file and app sharing) and Zoom 2021 (Zoom is a video conferencing software app that enables face-to-face communication when in-person meetings are not possible) software applications. A guiding questionnaire was used as a measure to ensure relevant and useful responses. Any community member from Petrusville or Philipstown was eligible to participate in the focus groups. Key stakeholders operating in the area were eligible for the in-depth interviews and were approached to participate by two community members. Only consenting community members and stakeholders were eventually included in the focus groups and in-depth interviews. Written informed consent was obtained from all participants involved in the study. The same two community members assisted with obtaining written consent from each participant. No formal training was necessary since the two community members had previous experience and training in primary data collection and the related ethics requirements for participation consent. We used open coding in Microsoft Excel 2021 (Microsoft Excel is a versatile spreadsheet software programme used for data visualisation and analysis) to develop our code for the initial themes and terminology in line with phase two of the six-phase analytic process [26]. We did not predefine the codes but rather determined the codes based on the responses received. Thereafter, we condensed the themes into larger groups based on the terminology provided by the participants. Two of the three authors conducted the open coding separately and compared the coding thereafter to confirm the suitability and reliability of the assigned code.
Secondary data were collected by the original researcher, who we refer to as Company A. Company A is a private company operating in RLM. Since the secondary data are not publicly available, we again applied for the relevant ethical clearance through our institution as outlined in the Ethics Committee Statement at the end of this document. Company A used various instruments to collect the data such as surveys, structured interviews, semi-structured interviews, questionnaires, and focus groups. The key motivation for utilising multiple data sources was to ensure that the interpretation of the results could be triangulated using two or more data sources in order to corroborate our research findings [27].
2.3. Univariate and Qualitative Analyses
This study began with a univariate, spatial analysis of RLM using census data related to infrastructure, education, employment, and household dynamics to gain in-depth insights into its socioeconomic conditions. Thereafter, the drinking culture and drinking motives in RLM were investigated by applying the six-phase analytic process to two cross-sectional in-depth community needs assessments, five in-depth interviews, and three focus groups [20]. This study also examined how the RLM targets FASD, as well as binge, risky and gestational drinking, in its municipal economic strategy by thematically analysing its IDP using Ryder’s 8-stage policy development process [28].
3. Results
The results of this study are divided into three sections. The first section describes the univariate spatial comparative analysis of RLM and SBLM using data sources 5–6, whereas the second section thematically explores the drinking motives and trends in RLM using data sources 1–4 and 7. The final section examines how the RLM targets FASD, as well as binge and risky drinking, in its municipal economic strategy.
3.1. Univariate Spatial Comparative Analysis of RLM and SBLM
The results of the univariate spatial analysis are summarised in Table 2, Table 3, Table 4, Table 5 and Table 6. The purpose of this section is to provide the context of the socioeconomic characteristics of the RLM. Where data were available, we included comparisons to the Saldana Bay Local Municipality (SBLM), which has the lowest reported FASD prevalence rates in South Africa, to demonstrate the differences in the economic characteristics [3].
Table 2.
Household dynamics in RLM and SBLM.
Table 3.
Labour market in RLM and SBLM.
Table 4.
Education in RLM and SBLM.
Table 5.
Infrastructure in RLM and SBLM.
Table 6.
Formal employment by sector in 2018/19 in RLM.
Table 2 indicates that the number of households in RLM increased by 568 between 2011 and 2016. Although the average household size remained constant, the number of formal dwellings decreased by 9.6%, whereas the number of houses owned increased by 15.8%. The percentage of female-headed households was almost double the national average of 16.9%. Table 2 also shows that the number of households in SBLM increased by 555 between 2011 and 2016. Although the average household size remained consistent at 0.1%, the number of formal dwellings decreased by 6.9%, whereas the number of houses owned increased by 10.3%. The percentage of female-headed households in SBLM also exceeded the national average by 16%. This table shows that RLM and SBLM were very similar with respect to household dynamics, except for the number of households, despite SBLM having a substantially lower reported FASD prevalence rate than RLM.
Table 3 provides an overview of the labour market in RLM and SBLM over a 10-year period. Unemployment increased by 4.17% in RLM and 9.53% nationally between 2011 and 2021. In the 10-year period, the employment rate decreased by 1.6% in RLM and 4% nationally. Even though unemployment increased by 8.18% in SBLM, it was still far below the national unemployment rate of 33.98%.
Table 4 shows that RLM and South Africa experienced positive growth with respect to completed secondary education between 2011 and 2016. Higher education attainment increased nationally by 2.8% but decreased in RLM by 1.8%. No schooling increased in RLM by 4.8%. These statistics do not sum to 100 as they exclude the primary education statistics. Table 4 shows that SBLM had a lower rate of no schooling, with slightly higher rates of completion for secondary and higher education.
Table 5 shows that access to a flushing toilet connected to a sewage system increased in both RLM and nationally. Access to other infrastructural amenities, such as weekly refuse removal, piped water inside the dwelling, and electricity for lighting, unfortunately, decreased in RLM over the reported 10-year period. Table 5 shows that SBLM had a higher rate of access to sewerage, weekly refuse removal, and piped water inside the dwelling.
The majority of the workforce in RLM is employed in the agriculture, hunting, and forestry sectors. Since agriculture is the main economic sector in RLM, it employs most of the labour force. The second-largest employment sector is community, social, and personal services, which consists largely of government employees from the local municipality and other government departments. This indicates that job opportunities are primarily in agriculture.
With respect to education, each town in the RLM has limited early childhood development (ECD) centres and primary and secondary schools. With respect to health, each town has only one clinic, which is inadequate for the population size, as outlined in Table 3. Although the number of sports fields and community halls provide some support for recreational activity, the lack of transport networks makes it difficult to commute and participate in recreational activities out of town. Even though they serve a larger community of people, SBLM contains more schools, healthcare facilities, access to transport, and community infrastructure. In addition, SBLM has opportunities for growth through the IDZ and residents have more options for recreation. Table 2, Table 3, Table 4, Table 5 and Table 7 show that compared to SBLM, fewer opportunities for education, a lack of access to basic infrastructure, higher rates of unemployment, and fewer recreational opportunities in RLM can be associated with its higher FASD prevalence rate, although this would need to be confirmed statistically, which is beyond the scope of this study.
Table 7.
Number of institutions per sector in RLM and SBLM.
Figure 1 represents the results from data source 2. Company A interviewed a representative sample of 50 people from both Petrusville (n = 25) and Philipstown (n = 25). The purpose of the interviews was to gather baseline data that would inform a community development strategy. The sample consisted of 24 males and 26 females. The racial composition of the sample was 19 African, 29 Coloured, and 2 White South Africans.
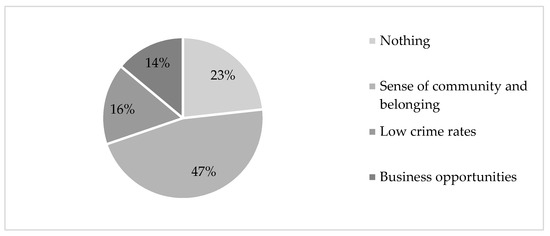
Figure 1.
What community members appreciate about RLM.
The survey participants were asked to complete a survey that consisted of two questions, namely (a) “name three things which you like about your town”, and (b) “name three things which you do not like about your town”.
Figure 1 summarises the key themes identified from the responses to the first question. The category titled “nothing” indicates that community members felt that there was nothing to like about their respective towns. A total of 23% of community members felt a sense of community and belonging towards their town, whereas 16% and 14%, respectively, appreciated the low crime rate. The business opportunities in RLM were appreciated by 14% of community members.
According to Figure 2, 30% of respondents did not appreciate the high levels of alcohol and substance abuse, 40% did not appreciate the poor education and skill levels in RLM, and 28% did not appreciate the lack of constructive and recreational activities.
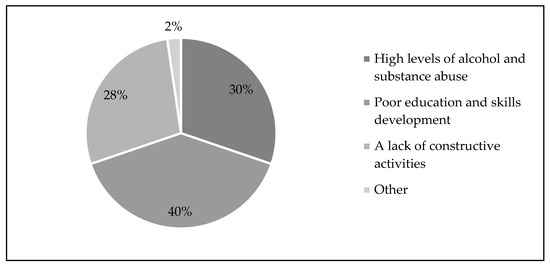
Figure 2.
What community members do not appreciate about RLM. Source: Company A, 2017.
3.2. Drinking Culture, Drinking Motives, and FASD
3.2.1. Drinking Culture
Based on the quotations presented in Table 8, excess alcohol intake begins at a very young age in RLM. Prenatal and gestational alcohol consumption is reported as the norm, with some believing that gestational alcohol consumption is beneficial for fetal development. People who are economically vulnerable have access to cheaper sources of alcohol and there is ample alcohol available for sale from households if one cannot purchase from a licensed liquor outlet. People drink to cope with their adverse socioeconomic or other circumstances and people encourage each other to drink. We applied a six-phase analytic process to analyse the themes from the community needs assessment, in-depth interviews, and focus groups [20].
Table 8.
The results of data sources 1, 3, 4, and 7 provide insights into the drinking culture in RLM.
3.2.2. Drinking Motives
The results of data sources 1, 3, 4, and 7 demonstrate the drinking culture in RLM. Table 9 provides an overview of the drinking motives in RLM.
Table 9.
Drinking motives in RLM.
There are limited after-school recreational activities for children. As a result, increased levels of boredom perpetuate the high rates of alcohol consumption among underage youth. There are few role models available in the community to inspire youth with respect to their career and life aspirations. Increased alcohol use and limited employment prospects also perpetuate the high rates of alcohol consumption. Alcohol is easily available on credit, which makes it easily accessible to those who cannot afford it. Spouses force each other to drink. The table also highlights respondents’ concerns related to the role of alcohol in gender-based violence, rape, and other crimes.
The thematic responses showed that 57% of respondents expressed concern regarding the unhealthy drinking culture in RLM, 40% felt that residents of RLM drank in response to unemployment-related hopelessness, and 52% attributed the drinking culture to a lack of hobbies and recreational opportunities. These percentages were generated by thematically grouping the responses from the focus groups. The percentages were then divided by the total number of respondents to the survey (n = 37).
The drinking culture and drinking motives outlined in Table 10 are linked to the views on FASD in Petrusville and Philipstown. The key results, as outlined in Table 10, illustrate that although training and awareness programs about FASD have been implemented in both Petrusville and Philipstown, this does not prevent mothers from drinking during pregnancy. Community views on FASD (commonly termed FAS by community members) illustrate that an alternative intervention is required in RLM since awareness training has a limited influence on changing drinking patterns during pregnancy.
Table 10.
Views on FASD.
3.3. Ryder’s Policy Development Process
The 2018/19 RLM IDP [23] is the only publicly available municipal document in RLM. Therefore, the analysis of the RLM IDP suggests that the decisive policy development process is not open to the public and that, furthermore, FASD is neglected. Table 11 utilises Ryder’s eight-stage policy development process [28] as a guideline for analysing the 2018/19 RLM IDP.
Table 11.
IDP evaluation using Ryder’s (1996) 8-stage policy development process.
A significant constraint on the development of the IDP is that most senior management of the municipality are temporarily employed, which causes a significant delay with respect to decision making and the implementation of the IDP in RLM. In addition, the IDP process is still regarded as new to many officials joining the municipality, which means that they have very little understanding of its purpose. Lastly, previous management failed to impart skills to junior officials to understand and implement the IDP [23]. In addition, there was no input to the IDP from the relevant government departments.
The results shown in Table 11 indicate that RLM has followed a clear approach to understanding its challenges. However, due to certain limitations, inputs from key government departments are not reflected in the IDP. Therefore, alcohol consumption and FASD are neglected in the IDP.
4. Discussion
The results illustrate that there is a strong interconnectedness of the challenges that RLM is facing. RLM is characterised by adverse socioeconomic conditions, as indicated in the results of the univariate spatial analysis. Compared to SBLM, which has the lowest reported FASD prevalence rate in South Africa, the findings from the univariate analysis show that fewer opportunities for education, a lack of access to basic infrastructure, higher rates of unemployment, and fewer recreational opportunities in RLM can be associated with its higher FASD prevalence rate, although this would need to be confirmed statistically, which is beyond the scope of this study.
Our findings are comparable with the existing literature. A previous study illustrated that female-headed households are predominately supported by grants and part-time employment [8]. Female-headed households in RLM are constantly experiencing shortages of money, food, clothing, and school supplies [8]. In addition, most female heads of households in RLM are unemployed and often rely on informal jobs to support their families. The association between poor socioeconomic conditions and mothers of children with FASD has also been documented in the literature. Women with lower socioeconomic status have a higher risk of bearing children with FASD [13,14]. Moreover, women with FASD children have lower levels of education and income and are employed far less frequently.
The results of the focus groups illustrate that the community in RLM understands that alcohol consumption adversely affects families and households. Besides the health risks, excessive alcohol use also contributes to other social problems such as high alcohol consumption rates among minors. Furthermore, access to cheap alcohol in RLM is problematic as it increases the accessibility of alcohol to residents who may not be able to typically afford it.
The culture of drinking is entrenched in the lives of many community members. Furthermore, an incomplete IDP, coupled with a lack of funds and a limited focus on FASD and prenatal, gestational, and excessive alcohol consumption, hinders the improvement of the conditions within RLM. The literature on FASD-related policy development illustrates that although there has been an increase in the number of policy documents mentioning FASD in the last 10 years [31], a holistic and comprehensive policy approach is still required to address FASD.
Limitations
This study has limitations, and the findings cannot be generalised. Firstly, the study interviewed a limited number of people for the qualitative aspect of the study and only one focus group took place in Philipstown. Thus, the interpretation of the results is limited to a small group of people in RLM. Secondly, the IDP analysis in this study is dated. It is possible that RLM has made some progress towards improving the socioeconomic conditions of the community. However, it is difficult to identify the exact improvements in the most recent IDP and LED strategies for RLM, as these documents are not publicly available.
5. Conclusions
Spatially, RLM experiences substantial socioeconomic challenges, an unhealthy drinking culture, economic despair, and a municipal economic strategy that fails to address FASD. A dedicated alcohol consumption census-style study is needed to broadly capture alcohol consumption in RLM. This will allow researchers to identify the exact alcohol consumption patterns and priority areas for the IDP and public health policy. RLM should more widely publicise and actively improve its policy development process so that its IDP is inclusively formulated to directly address FASD, risky and binge drinking, and prenatal and gestational alcohol consumption. The thematic analysis of the RLM IDP indicates that FASD is neglected and that a practical FASD policy development process should be instituted with input from all relevant stakeholders. The effectiveness of interventions targeting a reduction in gestational alcohol consumption should be monitored more frequently to better understand its impact.
Author Contributions
Conceptualisation, B.J., N.R. and M.V.; methodology, B.J. and N.R.; software, B.J.; validation, B.J., N.R. and M.V.; formal analysis, B.J. and N.R.; investigation, B.J.; resources, B.J., N.R. and M.V.; data curation, B.J.; writing—original draft preparation, B.J. and N.R.; writing—review and editing, N.R. and M.V.; visualisation, B.J. and N.R.; supervision, N.R. and M.V.; project administration, B.J. All authors have read and agreed to the published version of the manuscript.
Funding
This research received no external funding.
Institutional Review Board Statement
This study was conducted in accordance with the Declaration of Helsinki and approved by the Ethics Committee of the School of Economics at the University of Johannesburg (protocol codes 21SECO023A and 21SECO022B) on 6 February 2021.
Informed Consent Statement
Informed consent was obtained from all subjects involved in the study.
Data Availability Statement
Demographic and economic data for RLM and South Africa and municipal IDPs are publicly available. All other data sources are not publicly available to ensure the privacy and confidentiality of the participants.
Acknowledgments
We would like to thank our language editor, Jacqueline Gamble, for her timely and valuable assistance. We also wish to thank the anonymous reviewers for their invaluable feedback, which improved the quality of this manuscript.
Conflicts of Interest
The authors declare no conflict of interest.
References
- World Health Organization. Global Status Report on Alcohol and Health 2018; World Health Organization: Geneva, Switzerland, 2018. [Google Scholar]
- Popova, S.; Lange, S.; Chudley, A.E.; Reynolds, J.N.; Rehn, J. World Health Organization International Study on the Prevalence of Fetal Alcohol Spectrum Disorder (FASD); Institute for Mental Health Policy Research, Centre for Addiction and Mental Health: Toronto, ON, Canada, 2018. [Google Scholar]
- Olivier, L. Fetal Alcohol Spectrum Disorder in South Africa: A 20-Year Journey. Ph.D. Thesis, Maastricht University, Maastricht, The Netherlands, 2017. [Google Scholar]
- Adebiyo, B.; Mkumbang, F.C.; Beytell, A. Policy Requirements for the Prevention and Management of Foetal Alcohol Spectrum Disorder in South Africa: A Policy Briefing. Front. Public Health 2021, 9, 592726. [Google Scholar] [CrossRef] [PubMed]
- Olivier, L. Fetal Alcohol Spectrum Disorder prevalence data for Renosterberg Study. Unpublished raw data. 2017. [Google Scholar]
- May, P.A.; Vries, M.; Marais, A.-S.; Kalberg, W.O.; Adnams, C.M.; Hasken, J.M.; Tabachnick, B.; Robinson, L.K.; Manning, M.A.; Jones, K.L.; et al. The continuum of fetal alcohol spectrum disorders in four rural communities in South Africa: Prevalence and Characteristics. Drug Alcohol Depend. 2015, 159, 207–218. [Google Scholar] [CrossRef] [PubMed]
- Olivier, L.; Curfs, L.M.G.; Viljoen, D.L. Fetal alcohol spectrum disorders: Prevalence rates. S. Afr. Med. J. 2016, 106, 103–106. [Google Scholar] [CrossRef] [PubMed]
- Phuzi, B. Understanding Sustainable Livelihood Strategies of Female-Headed Households: The Case of Renosterberg Municipality, Pixley Ka Seme District, Northern Cape. Master’s Thesis, University of the Free State, Bloemfontein, South Africa, November 2021. [Google Scholar]
- Vacu, N.P. Spending efficiency in South African rural local municipalities. Euro Econ. 2019, 1, 128–136. [Google Scholar]
- Department of Cooperative Governance. The National Framework for Local Economic Development; Department of Cooperative Governance: Pretoria, South Africa, 2018. [Google Scholar]
- Rodriguez-Pose, A.; Tijmstra, S.A.R. Local economic development in Sub-Saharan Africa. Environ. Plan. C Gov. Policy 2007, 25, 516–536. [Google Scholar] [CrossRef]
- Lubbe, M.; van Walbeek, C.; Vellios, N. The prevalence of Fetal Alcohol Syndrome and its impact on a child’s classroom performance: A case study of a rural South African school. Int. J. Environ. Res. Public Health 2017, 14, 896. [Google Scholar] [CrossRef] [PubMed]
- Thanh, N.X.; Jonsoon, E.; Moffat, J.; Dennett, L. Fetal Alcohol Spectrum Disorder--Poverty trap? J. Popul. Ther. Clin. Pharmacol. 2013, 20, 63–66. [Google Scholar]
- Astley, S.J.; Bailey, D.; Talbot, D.; Clarren, S.K. Fetal Alcohol Syndrome (FAS) Primary Prevention Through FAS Diagnosis: II A comprehensive profile of 80 birth mothers of children with FAS. Alcohol Alcohol. 2000, 35, 509–519. [Google Scholar] [CrossRef] [PubMed]
- Corrales-Gutierrez, I.; Mendoz, R.; Gomez-Baya, D.; Leon-Larios, F. Understanding the Relationship between Predictors of Alcohol Consumption in Pregnancy: Toward Efective Prevention of FASD. Int. J. Environ. Res. Public Health 2020, 17, 138816. [Google Scholar] [CrossRef]
- Mendoza, R.; Morales-Marente, E.; Palacios, M.; Rodríguez-Reinado, C.; Corrales-Gutiérrez, I.; García-Algar, Ó. Health advice on alcohol consumption in pregnant women in Seville (Spain). Gac. Sanit. 2019, 34, 449–458. [Google Scholar] [CrossRef]
- Raymond, N.; Beer, C.; Glazebrook, C.; Sayal, K. Pregnant women’s attitudes towards alcohol consumption. BMC Public Health 2009, 9, 175. [Google Scholar] [CrossRef]
- Anderson, A.E.; Hure, A.J.; Kay-Lambkin, F.J.; Loxton, D.J. Women’s perceptions of information about alcohol use during pregnancy: A qualitative study. BMC Public Health 2014, 14, 1048. [Google Scholar] [CrossRef] [PubMed]
- Thanh, N.X.; Dennett, L.L.; Jacobs, P.; Jonsson, E. Economic burden of Fetal Alcohol Spectrum Disorder: A health policy perspective. In Fetal Alcohol Spectrum Disorder: Management and Policy Perspectives of FASD; Riley, E.P., Clarren, S., Weinberg, J., Jonsson, E., Eds.; Wiley-Blackwell: Denmark, Germany, 2011. [Google Scholar]
- Popova, S.; Lange, S.; Burd, L.; Rehm, J. The Economic Burden of Fetal Alcohol Spectrum Disorder in Canada in 2013. Alcohol Alcohol. 2016, 51, 367–375. [Google Scholar] [CrossRef] [PubMed]
- Plano-Clark, V.L.; Ivankova, N.V. Mixed Methods Research: A Guide to the Field, 1st ed.; Sage Publications: London, UK, 2016. [Google Scholar]
- Wakins, C.D. 2021. Secondary Data in Mixed Methods Research; Sage Publications: London, UK, 2022; Volume 8. [Google Scholar]
- Renosterberg Local Municipality. Integrated Development Plan of Renosterberg Local Municipality 2018/19. Available online: http://mfma.treasury.gov.za/Documents/01.%20Integrated%20Development%20Plans/2019-20/02.%20Local%20municipalities/NC075%20Renosterberg/IDP.pdf (accessed on 16 December 2022).
- Statistics South Africa. Census 2011 Municipal Report Northern Cape. 2011. Available online: http://www.statssa.gov.za/census/census_2011/census_products/NC_Municipal_Report.pdf (accessed on 19 December 2022).
- Municipalities of South Africa. Renosterberg Local Municipality (NC075). 2022. Available online: https://municipalities.co.za/demographic/1175/renosterberg-local-municipality (accessed on 16 December 2022).
- Braun, V.; Clarke, V. Thematic Analysis: A Practical Guide; Sage Publications: London, UK, 2021. [Google Scholar]
- Sandelowski, M. Whatever happened to qualitative description? Res. Nurs. Health 2000, 23, 334–340. [Google Scholar] [CrossRef] [PubMed]
- Ryder, D. The analysis of policy: Understanding the process of policy development. Addiction 1996, 91, 1265–1270. [Google Scholar] [CrossRef] [PubMed]
- Municipalities of South Africa. Saldanha Bay Local Municipality (WC014). 2022. Available online: https://municipalities.co.za/demographic/1229/saldanha-bay-local-municipality (accessed on 7 February 2023).
- Saldanha Bay Local Municipality. Integrated Development Plan of Saldanha Bay Local Municipality 2022. Available online: https://sbm.gov.za/integrated-development-planning/ (accessed on 7 February 2023).
- Adebiyi, B.O.; Mukumbang, F.C.; Beytell, A. To what extent is Fetal Alcohol Spectrum Disorder considered in policy-related 328 documents in South Africa? A document review. Health Res. Policy Syst. 2019, 17, 46. [Google Scholar] [CrossRef] [PubMed]
Disclaimer/Publisher’s Note: The statements, opinions and data contained in all publications are solely those of the individual author(s) and contributor(s) and not of MDPI and/or the editor(s). MDPI and/or the editor(s) disclaim responsibility for any injury to people or property resulting from any ideas, methods, instructions or products referred to in the content. |
© 2023 by the authors. Licensee MDPI, Basel, Switzerland. This article is an open access article distributed under the terms and conditions of the Creative Commons Attribution (CC BY) license (https://creativecommons.org/licenses/by/4.0/).