Abstract
As an important part of urban green infrastructure, the landscape effect of the urban waterfront green space varies, and sometimes, the green space with an excellent landscape aesthetic value fails to serve the needs of most citizens. This seriously affects the construction of a green ecological civilization and the implementation of the concept of “common prosperity” in China. Based on multi-source data, this study took the Qiantang River Basin as an example, selected 12 representative waterfront green spaces along the river as the research objects, and used qualitative and quantitative analysis methods to determine the landscape aesthetic value of the research area from the different dimensions of space, psychology, and physiology. We examined the relationship between each dimension so as to objectively and comprehensively reflect the landscape value characteristics of the waterfront green space in the study area and provide a reasonable theoretical framework and practical development path for future urban waterfront green space landscape design. We obtained the following results: (1) The results of the spatial dimension research indicated that the spatial value index of the waterfront green space in the study area was three-dimensional space > vertical space > horizontal space, and the overall spatial value was low; Qianjiang Ecological Park obtained the highest value (0.5473), and Urban Balcony Park obtained the lowest value (0.4619). (2) The results of the psychological dimension indicated that people’s perceptions of the waterfront green space in the study area were relatively weak, mainly focusing on visual perception, but the waterfront green space with a relative emotional value greater than one accounted for 75%, and the overall recognition of the landscape was high. (3) The results of the behavioral dimension showed that the overall heat of the waterfront green space in the study area was insufficient (1.3719–7.1583), which was mainly concentrated in low-heat levels, and the population density was unevenly distributed (0.0014–0.0663), which was mainly concentrated in the medium-density level. The main purpose of users was to visit, and they stayed an average of 1.5 h. (4) The results of the coupling coordination analysis of the spatial–psychological–behavioral dimensions showed that the landscape value of the waterfront green space in the study area presented a form of ‘high coupling degree and low coordination degree’.
1. Introduction
As an important part of urban green infrastructure, waterfront green space has multiple values, including a natural society. From the perspective of natural value, urban waterfront green space is located in the land–water transition zone, and as an ecological buffer zone, it has ecological functions such as soil and water conservation, microclimate regulation, air purification, enhancement, and protection of biodiversity [1,2,3]. From the perspective of social value, urban waterfront green space, as a window of modern cities and an important symbol of civilization, can significantly improve the urban landscape, drive the surrounding economic development, optimize the living environment, and have many positive impacts on human health and well-being [4,5]. For example, coastal ecosystems tend to be characterized by high human well-being, clean water, clean air, and aesthetic pleasure, and the jogging and walking space on the waterfront gives it the durability, stability, and productivity of a natural system [6]. From the perspective of spatial division, waterfront projects use the blue line (water protection zone control line) and the green line (urban green space control line) as the main control lines to divide ‘blue space’ and ‘green space’ [7,8,9]. The ‘waterfront green space’ represents a mixed location of ecological, economic, and social transition and diffusion areas and is spatially concretized between land and water [1]. However, at this stage, sometimes the landscape effect of urban waterfront green space varies, and the green space with excellent landscape aesthetic value fails to serve the needs of most citizens. This leads to the uneven distribution of public social resources [10,11,12,13,14], the simple pursuit of modernization and standardization of waterfront landscape [15,16], and the intensification of contradictions between different types of land use in waterfront areas [17,18,19,20,21,22]. These phenomena are not conducive to China’s development of green ecological civilization construction ideas or China’s common prosperity concept. Therefore, it is necessary to explore the multi-landscape of both green space and blue space and optimize the organization of the waterfront landscape to enhance the aesthetic value of urban waterfront green space [23,24].
The study of landscape aesthetics began in the late 1960s [25,26,27]. The research methods are divided into subjective paradigm (based on perception and public preference) and objective paradigm (based on landscape metrics to evaluate the objective visual value quality of landscape) [28,29,30,31,32,33,34,35]. With the development of landscape aesthetics research, nowadays, landscape aesthetics evaluation mainly relies on spatial, psychological, and physiological perspectives. Among them, landscape space aesthetics evaluation methods are mainly based on the quantitative analysis of sites based on remote sensing image data [36,37,38,39,40,41], such as environmental simulation prediction models to quantify the aesthetic quality of urban waterfront space [42] and mobile LiDAR point clouds to draw three-dimensional models of urban street environments [43]. Psychological and aesthetic evaluation is mainly based on crowd perception [44,45], using public participation, semantic analysis, and other methods to obtain the results of the crowd’s emotional perceptions to determine the value quality of landscape aesthetics [46,47]. For example, social media texts are used to explore the emotional reactions of users to waterfront landscapes [48], and urban landscape perception research is based on public streetscape images [49]. Behavioral aesthetics evaluation is mainly conducted through field research and other methods to obtain multi-source big data, to study the crowd recreation behavior, and thus to reflect the aesthetic value of the study area [50]. For example, studies of user behavior characteristics were based on behavior observation and GIS [51,52] and analyzed users’ responses to the Washington Cherry Blossom Festival through their behavioral motivation [53]. However, because of the comprehensive influence of natural and social factors such as the regional economy and surrounding environment, the existing landscape aesthetics research cannot unify the dimensions of space, behavior, and psychology [27,33]. Only a single-level analysis can fully and accurately evaluate the aesthetic characteristics of the site, reflecting its aesthetic value; therefore, we must build a more scientific, systematic, and humane multi-dimensional landscape aesthetic evaluation system [54,55,56].
The Qiantang River is the largest river in Zhejiang Province, China. It is the birthplace of Wuyue culture. It has a long history and important cultural, ecological, and economic values. There are a variety of urban waterfront green space landscapes on both sides of the river, attracting many people for leisure and relaxation. Therefore, this study took the Hangzhou section of the Qiantang River as the research scope and selected 12 waterfront parks on both sides of the river as the specific research objects. Aiming to investigate the problems of unreasonable spatial element structure, the unmet unsatisfactory viewing needs of leisure travelers, and their low recognition of waterfront green space, we constructed a theoretical framework of landscape aesthetics based on space–psychology–behavior and comprehensively summarized the aesthetic characteristics of the waterfront green space landscape in the study area. This will provide a reasonable and feasible theoretical framework and practical development path for the Qiantang River waterfront green landscape design.
2. Materials and Methods
2.1. Study Area
With advances in urbanization and industrial upgrading and transformation in Hangzhou (the capital city of Zhejiang Province, China), the urban center has gradually shifted eastward. This has been developed as the central activity area planned by Hangzhou and the main center of the city. Hangzhou has shifted from the ‘West Lake era’ to the ‘Qiantang River era’. As an important urban ecological corridor throughout the whole city of Hangzhou, the Qiantang River (the downstream waterway of Wenjiayan in Hangzhou) is the leading linear landscape element of urban development. In this study, the urban rapid ring road around the river was designated as the research area (Figure 1), and 12 representative waterfront green spaces along the coast were selected as the research objects (Table 1), namely, Qianjiang Century Park (QCP), Qianjiang Ecological Park (QEC), Yanjiang Wetland Park (YWP), National Water Museum of China (NWMC), Yanjiang Park (YP), CBD Park (CP), Wangjiang Park (WP), Baita Park (BTP), Binjiang Park (BP), Liuheta Cultural Park (LCP), Wenyan Riverside Park (WRP), and Urban Balcony Park (UBP). The selected objects are all open parks (Figure 2). According to the division of their administrative regions, they span five administrative regions in Hangzhou: Xiaoshan District (NWMC, QCP, YP, WRP), Qiantang District (YWP, QEP), Binjiang District (BP), Shangcheng District (CP, BTP, WP, UBP), and West Lake District (LCP). The Ministry of Housing and Urban-Rural Development of China in 2017 issued the urban green space classification standard in the park green space category: there are 7 comprehensive parks, including NWMC, QCP, CP, QEP, BTP, UBP, WRP; 2 special parks, including LCP (Heritage Park) and YWP (Urban Wetland Park); 2 linear parks, including BP and YP; 1 green space beside the street, which is WP. According to the location relationship between parks and the water, 7 parks are located on the north bank of the river, and 5 parks are located on the south bank of the river.

Figure 1.
Location and distribution of waterfront parks.

Table 1.
Location and area of the waterfront parks (Hangzhou City, Zhejiang Province).
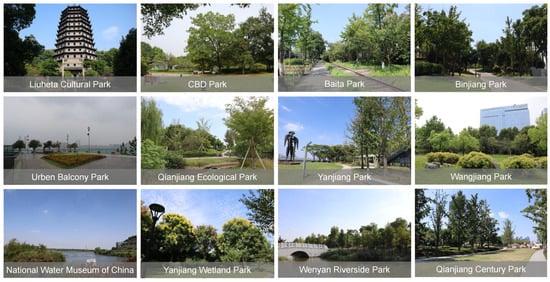
Figure 2.
Present situation of waterfront parks.
2.2. Landscape Aesthetic Evaluation Method
This study was based on multi-source data and combined quantitative and qualitative research methods to study the aesthetic value of the research area regarding three dimensions: space, behavior, and psychology. On this basis, we made an in-depth study of the relationship between space, behavior, and psychology and analyzed its internal reasons (Figure 3). Figure 3 shows the index evaluation results of the spatial dimension, which were used as the preliminary information for the aesthetic characteristics of the waterfront park. This system integrated the spatial–psychological–behavioral dimension to evaluate the aesthetic characteristics of the waterfront parks.
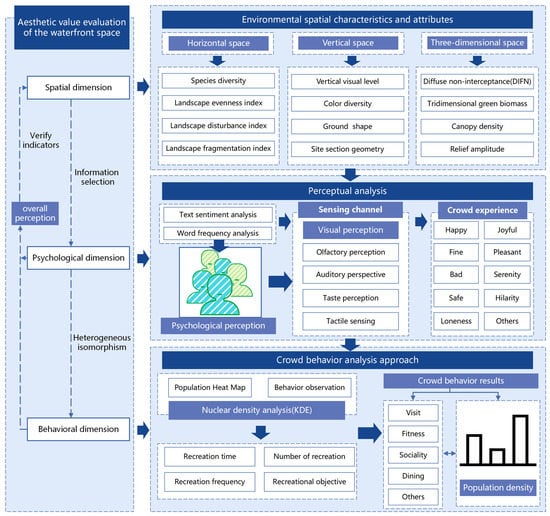
Figure 3.
Space–psychology–behavior dimension landscape aesthetic evaluation mechanism.
2.2.1. Spatial Dimension of Landscape Aesthetics Research
This study established a spatial aesthetic evaluation system based on horizontal, vertical, and three-dimensional spaces (Table 2) [57,58]. The horizontal space contained the four indicators of species diversity, landscape evenness index, landscape disturbance index, and landscape fragmentation index; the vertical space included four indexes: vertical visual level, color diversity, slope shape, and site section geometry. Three-dimensional space included four indicators: diffuse non-interceptance (DIFN), tridimensional green biomass, canopy density, and relief amplitude. According to the normalization of each index, the geometric average was taken to obtain the different spaces and overall aesthetic value of the green landscape space in the study area.
Table 2.
Waterfront landscape space aesthetic value evaluation index.
2.2.2. Psychological Dimension of Landscape Aesthetics Research
Based on text sentiment analysis technology [71,72,73], this study evaluated the landscape aesthetics of the research object from the psychological point of view of users. The specific steps were as follows.
First, by calculating the Weibo evaluation related to the landscape experience, we derived the landscape emotional value and park emotional value. After conversion by text emotion technology, the value was between 0 and 10. When the value was greater than 5, the experience had a positive emotional perception. The greater the value, the higher the positive degree of experience perception.
Second, the relative emotional value was obtained from the ratio of the landscape emotional value to the park emotional value so as to exclude the influence of the park itself on the users and obtain the attractiveness evaluation of the park landscape. When the relative emotional value was greater than 1, the landscape had a positive attraction perception. The larger the value, the greater the attraction of the park landscape to visitors and the higher the recognition of it.
Subsequently, this study used linear regression analysis to verify the relationship between visitors’ landscape experiences and emotional perceptions [74]. The landscape relative evaluation rate represented the landscape experience as an independent variable, while the relative emotional value represented the emotional perception as a dependent variable. If the significance (p) of the landscape relative evaluation rate was less than 0.05, the visitors’ landscape experiences and emotional perceptions had a positive impact relationship. The closer the R2 of the fitting situation was to 1, the stronger the linear correlation between the two variables.
Finally, in order to further analyze the characteristics and differences in users’ sensory evaluations, this study conducted word frequency analysis on the parks with emotional values greater than 1 based on the results of relative emotional values. The word frequency analysis technology was used to segment, check, and fit the evaluation of the park [75,76], and people’s emotional perceptions were obtained from the five aspects of vision, smell, hearing, touch, and taste, so as to analyze the results of the crowd experience of different waterfront spaces.
2.2.3. Behavioral Dimension of Landscape Aesthetics Research
From the perspective of user behavior, this study was based on a Baidu heat map [77,78], nuclear density method [79,80,81], recreational behavior observation method [82], and the social attributes and recreational behaviors of different groups in the study area, thus reflecting the landscape aesthetic value of the waterfront park. The specific steps were as follows.
First, the thermal population distribution of waterfront park was obtained by calculating the thermal value with ArcGIS 10.7.
Second, according to the results of behavior observation, the recreation time, number, frequency, and purpose of park visitors were obtained.
Finally, using the above results, the study calculated and drew the nuclear density map of the park population in ArcGIS 10.7 and obtained the nuclear density values of different parks, so as to analyze the behavior and environmental preferences of users.
2.3. Data Collection and Preprocessing
Land-use data: This study purchased the latest land-use data of Hangzhou in 2020 from the Esri official website, with an accuracy of 10 M.
Elevation data: According to ALOS satellite (Advanced Land Observation Satellite), the Hangzhou Digital Elevation Model (DEM) was obtained with an accuracy of 12.5 M.
Panoramic photos: This study obtained panoramic photos by the grid method in the park space. Because of the large area difference between the research objects, we divided the park into two categories according to the area. The park area within 290,000 square meters was divided into 15 m × 15 m equal grid and the park area larger than 290,000 square meters was a 30 m × 30 m equal grid. We shot in the center of each grid. We took the direction of the park route as a perspective for the panoramic photos, which was consistent with the residual light perspective of the human eye (horizontal 180 degrees, vertical 90 degrees). The shooting tool selected the panoramic photography mode of the Apple mobile phone, and we used the tripod to keep the shooting stable. Shooting height refers to the average height of the line of sight, which was set at 165 cm (Figure 4). The shooting dates were 24 August to 12 September 2022, and the shooting time was unified between 9:30–11:30 in the morning and 1:30–4:30 in the afternoon when the weather was sunny. According to the shooting points investigated, we finally selected a total of 625 effective photos.
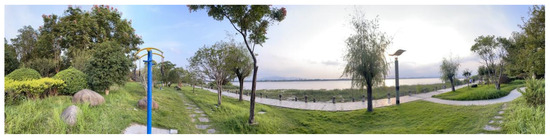
Figure 4.
Panoramic picture sample.
Spatial dimension data preprocessing: We first extracted the land use data and elevation data of each park in ArcGIS 10.7, put the land use data of the park into the calculation results of Fragstats, entered them into ArcGIS 10.7 to obtain C1, C2, C3, and C4, and then used the elevation data to calculate C7, C8, and C12 in ArcGIS 10.7. Subsequently, C5, C6, C9, C10, and C11 were calculated in Photoshop 2022 with the park panorama and plan. Finally, all the results were normalized to obtain the final value. The evaluation results were divided into four grades by natural breakpoint method. The higher the grade, the higher the landscape space value of the park.
Weibo comments: This study used Octopus (a web information collection software) to obtain the relevant microblog evaluation of the waterfront park over the past five years for analysis. Specific content included user ID, gender, check-in point, release time, and evaluation text. Octopus software was used to crawl the data, and 6854 Weibo evaluations were obtained. Over 3 days, we eliminated redundant information, such as meaningless evaluations and advertisements, and finally obtained 4454 valid data.
Crowd thermal data: Real-time data were obtained according to the Baidu heat map. The dates were 12–18 August 2022. Nine heat maps were intercepted every day, one at 8:00, 9:00, and 10:00, one at 2:00, 3:00, and 4:00, and one at 19:00, 20:00, and 21:00.
Crowd recreation behavior data: This study used the user behavior observation method to obtain the crowd entertainment behavior data. The survey dates were from 20 July to 20 August 2022. The observation time was from 8:00 to 19:00. The observation method included the total number of visitors entering the park per hour at the main entrance. We asked users at the entrance to the park how much time they planned to spend visiting the park and how often they visited, and another researcher observed visitor behavior in the park.
3. Results
3.1. Spatial Dimension of Landscape Aesthetics Research
The Hangzhou section of the Qiantang River waterfront park space index results was mainly concentrated in the 0.4619–0.5473 range (Table 3). Among them, the landscape space value of QEP was the highest, and the UBP landscape space value was the lowest. According to the evaluation grade analysis, the aesthetic value of the waterfront park space was mainly concentrated in the second level, accounting for 41.6% (the number of second-level parks accounting for the proportion of all parks) and comprising YP, WRP, YWP, BTP, and NWMC; the third level included CP, BP, LCP, accounting for 25% (the number of third level parks accounting for the proportion of all parks); the first-level and fourth-level parks were the least distributed, accounting for 16.7% (the number of first-level and fourth-level parks of the same accounting for the proportion of all parks). The overall aesthetic value of waterfront open green space in the Hangzhou section of the Qiantang River was low, and the distribution of spatial aesthetic value was uneven.
Table 3.
Waterfront park space aesthetic value index calculation results.
In order to further analyze the heterogeneity of the regional aesthetic landscape, the characteristics of the aesthetic value of the horizontal–vertical–three-dimensional spatial landscape were analyzed (Table 4).
Table 4.
Horizontal–vertical–three-dimensional spatial index calculation mean.
According to the mean value of the calculated index results, the horizontal space results were distributed between 0.3316 and 0.5944. Among them, more than 0.5 parks, 0.4–0.5 parks, and less than 0.4 parks had the same ratio as the total number of parks. The horizontal space result of UBP was the lowest of all results, with a value of 0.3316. The vertical spatial results were distributed between 0.4047 and 0.4921; UBP had the highest value and QEP the lowest. The three-dimensional spatial results were distributed between 0.4932 and 0.6987. Among them, the three-dimensional spatial value of CP was the highest, and the value of NWMC was the lowest. Overall, the parks’ horizontal space numerical differentiation was most obvious, followed by three-dimensional space; the vertical space differentiation was small. Among them, the aesthetic value of three-dimensional space was relatively good, and the aesthetic value of vertical space was poor.
3.2. Psychological Dimension of Landscape Aesthetics Research
According to the results of sentiment text analysis (Table 5), the landscape emotional values of QCP, YWP, and BTP were greater than 5, accounting for 25%. YWP had the highest landscape emotional value of 7.8. Park emotional values were distributed between 4.5 and 0.8.
Table 5.
Landscape visitor evaluation and emotional response to waterfront parks.
According to the analysis of relative emotional value, the parks with a value greater than one were QCP, YWP, NWMC, YP, CP, BTP, BP, LCP, and WRP, accounting for 75%, indicating that these park landscapes had a positive attractiveness to visitors. Among them, the relative emotional values of QCP and BTP were greater than 2, which indicated that visitors had a strong perception of the two park landscapes. The park landscape had a strong attraction for visitors, and visitors had a high recognition of the park landscape.
According to the results of the linear fitting analysis, there was a significant linear positive correlation between the landscape relative evaluation rate and the relative emotional value (Figure 5), p = 0.028, R2 = 0.398. It can be seen that the stronger the experience of the park landscape, the better the emotional perception and the higher the recognition of the park landscape.
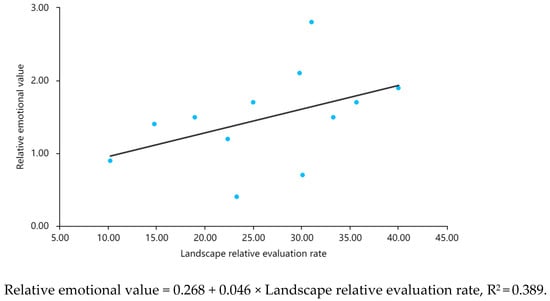
Figure 5.
Scatter diagram of relative evaluation rates and relative emotion values of the landscape.
Parks with relative emotional values greater than two (Qianjiang Century Park, Baita Park) had more terms related to all senses and feelings because people commented on them the most (Table 6). There were some differences in the sensory experience of parks (such as Wenyan Riverside Park, Yanjiang Park, and Yanjiang Wetland Park) with emotional values between one and two. Visitors had a good feeling about the park landscape; most perceptions were positive, such as those reflecting comfort and happiness. Among them, visual perception was stronger, and the other four senses were less evaluated, indicating that the five senses of visitors in the waterfront park were not balanced.
Table 6.
User sensory evaluation of the park landscape.
3.3. Behavioral Dimension of Landscape Aesthetics Research
According to the average thermal value of the study area (Table 7). Using the natural breakpoint method, the areas with a heat intensity of 5.0001–8 are collectively referred to as a high-heat area, the areas with a heat intensity of 2.0001–5 are collectively referred to as a sub-heat area, and the areas of 1–2 are collectively referred to as a low-heat area. The results indicated that the average thermal value of the research object was concentrated from 1.3719 to 7.1583. According to the analysis of evaluation grade, the distribution of thermal grade was mainly concentrated in the low-heat grade, accounting for 50% of the total parks. The high-grade parks were CP, UBP, and QEP, accounting for 25%. Therefore, the waterfront park had insufficient heat and uneven distribution.
Table 7.
Park thermal value data.
The results of user behavior observation (Table 8) indicated that a total of 23 kinds of activities were recorded over eight observation days. According to the characteristics and frequency of activities, the frequency of users’ recreational purposes from high to low was sightseeing, fitness, social networking, catering, and others. According to the analysis of recreation time, the average recreation time of users was 1–2 h, followed by 0.5 h. Among them, users who were motivated to visit (66.6%) mostly preferred to walk, take a sightseeing bus, or use a multi-bike, so they stayed longer, mostly 1.5 h or more.
Table 8.
User behavior observation record form.
In order to further study the distribution of users’ environmental preferences, this study conducted a nuclear density analysis based on the Baidu heat map and user behavior observation analysis. The results (Figure 6) indicated that the density of users was 0.0014–0.0663 persons/m2, which was divided into high, medium, and low density according to the natural breakpoint method. The kernel density of the waterfront green space in the study area was concentrated in the low-density level, ranging from 0.0014 to 0.0197, accounting for 41.7% of the total parks. The high-density green spaces were CP, QCP, and LCP, accounting for 25% of the total parks. The crowd concentration of UBP, WRP, QEP, and BTP was medium density level. Thus, the study area waterfront park population density was low.
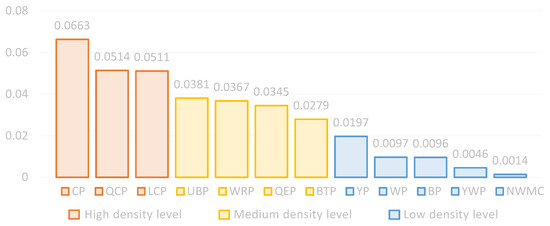
Figure 6.
Park kernel density estimation mean data (persons/m2).
4. Discussion
4.1. The Interaction among Space, Psychology and Behavior Dimensions
Urban riverside green space is not only an important part of the urban ecosystem but also an important carrier of urban civilization. It is also a green space for people to visit and relax in every day; at the same time, the ecosystem of waterfront green space provides a series of services, including economic benefits, improved air quality, and improved physical and social well-being and mental health [83]. Studies have shown that people’s psychology and behavior are closely related to spatial quality, and the spatial quality of an excellent landscape has a positive impact on people’s social lives, psychology, and behavior [84]. The research on the relationship between user psychology and behavior is useful for public space design [85].
We live in an extremely complex and interconnected world. People’s psychological perceptions can reflect, adapt, and change the world around them, and they have an important influence on their behavior [86]. At present, it can be proved that people’s psychology and behaviors are affected by their perceptions [87]. Therefore, we regard them as a perception system. If we assume that spatial quality can drive an individual’s perception system, we must consider that the quality of the entire space can be changed with changes in those landscape elements. At the same time, in order to pursue a higher aesthetic quality, we must further explore the coupling and coordination relationship between landscape space and people’s psychological and behavioral perceptions and analyze the degree of coupling between the different dimensions.
4.2. The Coupling Coordination Results of Spatial, Psychological and Behavioral Dimensions
First of all, according to the space–psychology–behavior dimension coupling coordination model analysis (Figure 7), the coupled coordination degree of this dimension of the parks was not balanced (Table 9), with a coordination level distribution at the 3–9 level, showing a ‘high degree of coupling, low coordination degree’ form. QCP was the park with the highest aesthetic value under the spatial–psychological–behavior dimension. The park had the spatial characteristics of high biodiversity, color diversity, and tridimensional green biomass. In the study of users’ psychological perceptions and behavior, it was proven that users had a positive perception of these spatial characteristics. At the same time, the study found that the calculation results of the space–psychology–behavior dimension of the park were relatively high and balanced. Studies have shown that people have a positive and healthy response to the space when they perceive the benefits of the ecosystem. Improving the space quality according to the characteristics of the indicators can improve people’s satisfaction preference for space so that users experience effective and positive psychology and behavior [88], which accounts for the good coupling and coordination of the park. WP was the park with the lowest comprehensive aesthetic value. The study found that the park’s low species diversity and canopy density had a negative impact on public sentiment, and there were phenomena such as neglect of ecological landscape construction and weak management intensity. At the same time, the calculation results of the spatial–psychological–behavior dimension of the park varied greatly, which explained the moderate imbalance of the coupling coordination degree. Considering the influence of spatial dimension factors on users’ moods, the construction department should strictly plan and manage the green space landscape, actively solve the problems that hinder the ecological development of green space, and bring a superior aesthetic experience to the public.
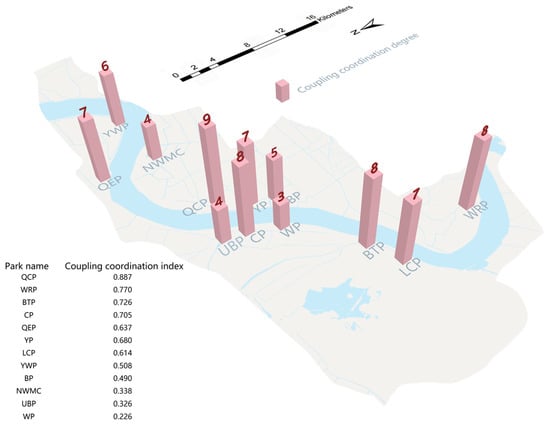
Figure 7.
Coupling coordination degree distribution of waterfront parks.
Table 9.
Spatial–psychological–behavioral dimension coupling coordination degree.
Second, the coupling relationship of the spatial dimension, psychological dimension, and behavior dimension of the waterfront park presented differentiated distributions in the results (Table 10, Table 11 and Table 12). The research indicated that (1) QCP, YP, WRP, YWP, and BTP had a strong spatial–psychological coupling. These parks had good overall landscape quality and high interaction with the landscape to enhance the positive emotions of users, and visual sensory factors such as good sky visibility and rich colors also improved the emotional perceptions of users, which was conducive to their physical and mental health, reduced depression, and made them feel happy. (2) QCP, CP, WRP, BTP, and LCP had a strong coupling degree of the psychological–behavioral dimensions. Behavioral observation studies have found that there is a positive correlation between landscape perception and recreation frequency, which explains the relatively high nuclear density of the park. (3) QCP, QEP, YWP, and CP had a strong coupling degree of the space–behavior dimension. Through analysis, we found that these parks had a good spatial quality to enrich users’ recreation behavior and diversify their recreation behavior.
Table 10.
Spatial–psychological dimension coupling coordination degree.
Table 11.
Psychological–behavioral dimension coupling coordination degree.
Table 12.
Spatial–behavioral dimension coupling coordination degree.
4.3. Future Recommendations and Deficiency
This study analyzed the landscape aesthetic value of the study area from the spatial–psychological–behavioral dimension. Importantly, we determined the landscape aesthetic value of different waterfront parks so as to provide relevant guidance for stakeholders according to regional differences and actual conditions. For low aesthetic landscape parks, when improving the quality of space, we should further strengthen the supervision mechanism and establish a hierarchical risk management strategy [89] so as to minimize the negative effects caused by human beings and improve the wetland ecosystem services function of the city [90,91]. In addition, cities with wetlands should determine vacant areas of wetland protection based on the existing important wetland landscape [92].
This study has limitations. First of all, Sina Weibo users are mostly young people, which affected the statistical accuracy of waterfront park visitors’ emotions. Second, the calculation results of panoramic images do not fully represent the visual experience of pedestrians and may affect the overall rating. Therefore, more advanced technologies (artificial intelligence combined with big geographic data) will be used in future research to improve the aesthetic quality data of the waterfront landscape space. Some of the calculations are based on very few opinions about the parks (Table 5); this, too, should be verified in the future as the results obtained so far may not be very representative. In addition, we were affected by the epidemic when we investigated, and there was no great difference in recreation behavior between different groups of people, such as tourists and local residents. In the future, we will distinguish between park users with different attributes and further study the differences in user behavior patterns.
5. Conclusions
This study took the Qiantang River Basin as an example and, based on multi-source data, selected 12 representative waterfront green spaces along the coast as the research objects. We used comprehensive qualitative and quantitative analysis methods, analyzed the landscape aesthetic value of the research area from the different dimensions of space, psychology, and physiology, and investigated the relationship between each dimension so as to objectively and comprehensively reflect the landscape value characteristics of the waterfront green space in the research area. The spatial dimension landscape aesthetic evaluation, based on land-use data, elevation data, site panoramic images, and other data, established a horizontal–vertical–three-dimensional evaluation model to evaluate the spatial aesthetic value; the psychological dimension landscape aesthetic evaluation was based on Weibo evaluation information, using text sentiment analysis and word frequency analysis technology. The behavior dimension landscape aesthetic value was based on Baidu thermal data, the integrated use of behavior observation, and kernel density analysis. The main findings are as follows:
- (1)
- The spatial dimension of landscape aesthetics research indicated that the overall aesthetic value of the waterfront green space in the study area was low. Among them, the QEP space aesthetic value index was the highest, and the lowest was UBP. According to the evaluation grade analysis, the study area waterfront park space aesthetic value was mainly concentrated in the secondary level. The spatial aesthetic value of the waterfront park was three-dimensional space > vertical space > horizontal space.
- (2)
- The psychological dimension of landscape aesthetics research indicated that people’s perceptions of the waterfront green space in the study area were relatively weak. The waterfront green space landscape had a positive attraction for visitors, and the waterfront green space with a relative emotional value greater than one accounted for 75%. The higher the relative emotional value of the waterfront green space landscape, the richer and more comprehensive the five-sense sensory experience of users, which also has a connection to a large number of comments available about the park. Among them, QCP had the highest relative emotional value, and WP had the lowest.
- (3)
- The behavioral dimension of landscape aesthetics research indicated that the overall thermal value of the waterfront green space in the study area was insufficient and, distributed from 1.3719 to 7.1583, was mainly concentrated in low-heat levels. Users were mostly motivated by sightseeing. The population density of the waterfront green space in the study area was generally low, and the kernel density value was distributed in the 0.0014–0.0663 range, mainly concentrated in the low-density level. CP had the highest population density, and NWMC had the lowest population density.
- (4)
- The results of the coupling coordination analysis indicated that the distribution of the coupling coordination degrees of the waterfront green space in the study area was not balanced, showing the form of ‘high coupling degree and low coordination degree’. Among them, the spatial–behavior–psychological coupling coordination degree of QCP was the best, and the spatial–behavior–psychological coupling coordination degree of WP was the lowest. The spatial–psychological dimension coupling degrees of QCP, YP, WRP, YWP, and BTP were strong. The coupling degrees of the psychological–behavior dimension of QCP, CP, WRP, BTP, and LCP were strong. The coupling degrees of the space–behavior dimension of QCP, QEP, YWP, and CP were strong.
- (5)
- This study avoided the shortcomings of fewer data points, high cost, and the low efficiency of traditional research methods, providing a practical value evaluation method for future landscape aesthetics.
Author Contributions
Conceptualization, X.L. and Y.J.; methodology, X.L. and X.C.; software, X.L.; validation, X.L., X.C. and Y.J.; data curation, X.L. and M.Z.; writing—original draft preparation, X.L. and X.C.; writing—review and editing, X.L., X.C. and W.W.; supervision, X.C., Y.J. and Y.H.; funding acquisition, Y.J. and Y.H. All authors have read and agreed to the published version of the manuscript.
Funding
This research was funded by the National Natural Science Foundation of China (grant number 51208467), and Special topic of common prosperity of Zhejiang University of Technology (grant number SKY-ZX-20220265).
Institutional Review Board Statement
Not applicable.
Informed Consent Statement
Not applicable.
Data Availability Statement
The original data are included in the article; further inquiries can be directed to the corresponding author.
Acknowledgments
The authors would like to thank the editor and the anonymous reviewers for their helpful comments.
Conflicts of Interest
The authors declare that the research was conducted in the absence of any commercial or financial relationships that could be construed as a potential conflict of interest.
Abbreviations
| QCP | Qianjiang Century Park |
| QEP | Qianjiang Ecological Park |
| YWP | Yanjiang Wetland Park |
| NWMC | National Water Museum of China |
| YP | Yanjiang Park |
| CP | CBD Park |
| WP | Wangjiang Park |
| BTP | Baita Park |
| BP | Binjiang Park |
| LCP | Liuheta Cultural Park |
| WRP | Wenyan Riverside Park |
| UBP | Urban Balcony Park |
| DIFN | Diffuse non-interceptance |
| ALOS | Advanced Land Observation Satellite |
| DEM | Digital Elevation Model |
References
- Taufen, A.; Yocom, K. Transitions in Urban Waterfronts: Imagining, Contesting, and Sustaining the Aquatic/Terrestrial Interface. Sustainability 2021, 13, 366. [Google Scholar] [CrossRef]
- Jiang, Y.; Huang, J.; Shi, T.; Wang, H. Interaction of Urban Rivers and Green Space Morphology to Mitigate the Urban Heat Island Effect: Case-Based Comparative Analysis. Int. J. Environ. Res. Public Health 2021, 18, 11404. [Google Scholar] [CrossRef] [PubMed]
- Dai, F.; Wang, Y.; Chen, M.; Huang, Y.; Guo, L. Study on the Planning and Protection of Waterfront Green Space Under the Vision of “Park City”: A Case Study of Hundreds-kilometers Riverbank Parks Group of the Yangtze River in Wuhan. Shanghai Urban Plan. Rev. 2019, 1, 19–26. [Google Scholar]
- Kondo, M.; Fluehr, J.; McKeon, T.; Branas, C. Urban Green Space and Its Impact on Human Health. Int. J. Environ. Res. Public Health 2021, 15, 445. [Google Scholar] [CrossRef]
- Ahmed, S.; Meenar, M.; Alam, A. Designing a Blue-Green Infrastructure (BGI) Network: Toward Water-Sensitive Urban Growth Planning in Dhaka, Bangladesh. Land 2019, 8, 138. [Google Scholar] [CrossRef]
- Reid, W.V.; Mooney, H.; Cropper, A.; Capistrano, D.; Carpenter, S.R.; Chopra, K.R.; Dasgupta, P.; Dietz, T.; Duraiappah, A.K.; Hassan, R.M.; et al. Ecosystems and Human Well-Being—Synthesis: A Report of the Millennium Ecosystem Assessment; Island Press: Washington, DC, USA, 2005. [Google Scholar]
- Sousa, R.D.; Paiva, P.D.; Reis, M.V.; Carcaud, N. The Trajectory of the Landscape and Functionality of Urban Watercourses: A Study of Lavras City, Brazil. Front. Sustain. Cities 2022, 4, 793288. [Google Scholar] [CrossRef]
- Yang, C.X.; Geng, H.Z.; Qin, M. Optimizing the Organization Models of Control Lines in Chinese Waterfronts. Adv. Mater. Res. 2013, 869, 124–129. [Google Scholar] [CrossRef]
- Shi, D.; Song, J.; Huang, J.; Zhuang, C.; Guo, R.; Gao, Y. Synergistic Cooling Effects (SCEs) of Urban Green-blue Spaces on Local Thermal Environment: A Case Study in Chongqing, China. Sustain. Cities Soc. 2020, 55, 102065. [Google Scholar] [CrossRef]
- Cheng, Y.; Wu, C. Planning Approach of Urban Blue-green Space Based on Local Climate Optimization: A Review. Chin. J. Appl. Ecol. 2020, 31, 3935–3945. [Google Scholar]
- Zhang, Q.; Lee, J.; Jiang, B.; Kim, G. Revitalization of the Waterfront Park Based on Industrial Heritage Using Post-Occupancy Evaluation-A Case Study of Shanghai (China). Int. J. Environ. Res. Public Health 2022, 19, 9107. [Google Scholar] [CrossRef]
- Gascon, M.; Zijlema, W.L.; Vert, C.; White, M.P.; Nieuwenhuijsen, M.J. Outdoor Blue Spaces, Human Health and Well-being: A Systematic Review of Quantitative Studies. Int. J. Hyg. Environ. Health 2017, 220, 1207–1221. [Google Scholar] [CrossRef]
- Sun, D.; Hu, C.; Wang, Y.; Wang, Z.; Zhang, J. Examining Spatio-Temporal Characteristics of Urban Heat Islands and Factors Driving Them in Hangzhou, China. IEEE J. 2021, 14, 8316–8325. [Google Scholar] [CrossRef]
- Song, Y.; Chen, B.; Ho, H.C.; Kwan, M.; Liu, D.; Wang, F.; Wang, J.; Cai, J.; Li, X.; Xu, Y.; et al. Observed Inequality in Urban Greenspace Exposure in China. Environ. Int. 2021, 156, 106778. [Google Scholar] [CrossRef] [PubMed]
- Avni, N.; Teschner, N. Urban Waterfronts: Contemporary Streams of Planning Conflicts. J. Plan. Lit. 2019, 34, 408–420. [Google Scholar] [CrossRef]
- Wang, Y.; Dewancker, B.; Qi, Q. Citizens’ Preferences and Attitudes Towards Urban Waterfront Spaces: A Case Study of Qiantang Riverside Development. Environ. Sci. Pollut. Res. 2020, 27, 45787–45801. [Google Scholar] [CrossRef]
- Botequilha-Leito, A.; Díaz-Varela, E.R. Performance Based Planning of complex urban social-ecological systems: The quest for sustainability through the promotion of resilience. Sustain. Cities Soc. 2020, 56, 102089. [Google Scholar] [CrossRef]
- Zhang, X.; Du, H.; Wang, Y.; Chen, Y.; Ma, L.; Dong, T. Watershed Landscape Ecological Risk Assessment and Landscape Pattern Optimization: Take Fujiang River Basin as an Example. Hum. Ecol. Risk Assess. Int. J. 2021, 27, 2254–2276. [Google Scholar] [CrossRef]
- Wang, Y.; Pan, J. Building Ecological Security Patterns Based on Ecosystem Services Value Reconstruction in an Arid Inland Basin: A Case Study in Ganzhou District, NW China. J. Clean. Prod. 2019, 241, 118337. [Google Scholar] [CrossRef]
- Hartog, H.D. Engineering an Ecological Civilization Along Shanghai’s Main Waterfront and Coastline: Evaluating Ongoing Efforts to Construct an Urban Eco-Network. Front. Media SA 2021, 9, 639739. [Google Scholar] [CrossRef]
- Meenar, M.; Heckert, M.; Adlakha, D. “Green Enough Ain’t Good Enough:” Public Perceptions and Emotions Related to Green Infrastructure in Environmental Justice Communities. Int. J. Environ. Res. Public Health 2022, 19, 1448. [Google Scholar] [CrossRef]
- Lomnicky, G.A.; Herlihy, A.T.; Kaufmann, P.R. Quantifying the Extent of Human Disturbance Activities and Anthropogenic Stressors in Wetlands across the Conterminous United States:Results from the National Wetland Condition Assessment. Environ. Monit. Assess. 2019, 191, 324. [Google Scholar] [CrossRef] [PubMed]
- Othman, A.; Al-Hagla, K.; Hasan, A.E. The Impact of Attributes of Waterfront Accessibility on Human Well-being: Alexandria Governorate as A Case Study. Ain Shams Eng. J. 2020, 12, 1033–1047. [Google Scholar]
- Wu, C.J.; He, X.Y. Environmental Aesthetic Value Influences the Intention for Moral Behavior: Changes in Behavioral Moral Judgment. Int. J. Environ. Res. Public Health 2021, 18, 6477. [Google Scholar] [CrossRef] [PubMed]
- Hermida, M.A.; Cabrera-Jara, N.; Osorio, P.; Cabrera, S. Methodology for the Assessment of Connectivity and Comfort of Urban Rivers. Cities 2019, 95, 102376. [Google Scholar] [CrossRef]
- Zhang, N.; Zheng, X.R.; Wang, X. Assessment of Aesthetic Quality of Urban Landscapes by Integrating Objective and Subjective Factors: A Case Study for Riparian Landscapes. Front. Ecol. Evol. 2022, 9, 735905. [Google Scholar] [CrossRef]
- Tan, X.; Li, X.; Peng, Y. Aesthetic Evaluation of Plant Landscape Based on Principal Factor Analysis and SBE in Wetland Park-A Case Study of Jinlong Lake Wetland Park(China). J. Environ. Eng. Landsc. Manag. 2021, 29, 40–47. [Google Scholar] [CrossRef]
- Djuki, A.; Mari, J.; Antoni, B.; Kova, V.; Jokovi, J.; Dinki, N. The Evaluation of Urban Renewal Waterfront Development: The Case of the Sava Riverfront in Belgrade, Serbia. Sustainability 2020, 12, 6620. [Google Scholar] [CrossRef]
- Gao, S.; Liu, S.F. Exploration and Analysis of the Aesthetic Cognitive Schema of Contemporary Western Urban Landscapes. Int. J. Environ. Res. Public Health 2021, 18, 5152. [Google Scholar] [CrossRef]
- Luo, J.; Zhao, T.; Cao, L.; Biljecki, F. Water View Imagery: Perception And Evaluation of Urban Waterscapes Worldwide. Ecol. Indic. 2022, 145, 109615. [Google Scholar] [CrossRef]
- Cheng, S.Y.; Zhai, Z.R.; Sun, W.Z.; Wang, Y.; Yu, R.; Ge, X.Y. Research on the Satisfaction of Beijing Waterfront Green Space Landscape Based on Social Media Data. Land 2022, 11, 1849. [Google Scholar] [CrossRef]
- Gobster, P.H.; Ribe, R.G.; Palmer, J.F. Themes and Trends in Visual Assessment Research: Introduction to the Landscape and Urban Planning Special Collection on the Visual Assessment of Landscapes. Landsc. Urban Plan. 2019, 191, 103635. [Google Scholar] [CrossRef]
- Sun, D.; Li, Q.; Gao, W.; Huang, G.; Tang, N.; Lyu, M.; Yu, Y. On the Relation Between Visual Quality and Landscape Characteristics: A Case Study Application to the Waterfront Linear parks in Shenyang, China. Environ. Res. Commun. 2021, 3, 115013. [Google Scholar] [CrossRef]
- Hong, C.; Chang, H.; Chung, E. Comparing the Functional Recognition of Aesthetics, Hydrology, and Quality in Urban Stream Restoration Through the Framework of Environmental Perception. River Res. Appl. 2019, 35, 543–552. [Google Scholar] [CrossRef]
- Liu, Q.; Zhu, Z.; Zeng, X.; Zhuo, Z.; Ye, B.; Fang, L.; Huang, Q.; Lai, P. The Impact of Landscape Complexity on Preference Ratings and Eye Fixation of Various Urban Green Space Settings. Urban For. Urban Green. 2021, 66, 127411. [Google Scholar] [CrossRef]
- Zhang, Z.C.; Zhang, H.J.; Feng, J.; Wang, Y.R.; Liu, K. Evaluation of Social Values for Ecosystem Services in Urban Riverfront Space Based on the SolVES Model: A Case Study of the Fenghe River, Xi’an, China. Int. J. Environ. Res. Public Health 2021, 18, 2765. [Google Scholar] [CrossRef] [PubMed]
- Wu, L.; Dong, Q.; Luo, S.; Jiang, W.; Hao, M.; Chen, Q. Effects of Spatial Elements of Urban Landscape Forests on the Restoration Potential and Preference of Adolescents. Environ. Sci. 2021, 10, 1349. [Google Scholar] [CrossRef]
- Wu, Y. The Research on Microclimate Effect of the Three-Dimension Morphology on Urban Waterfront Green Space Vegetation. Master’s Thesis, East China Normal University, Shanghai, China, 2020. [Google Scholar]
- Hu, D.; Hao, X.; Liu, C. Research on the Application of Public Art Design Based on Digital Technology and Multisensor Fusion Technology in Urban Landscape Construction. J. Sen. 2022, 2022, 8366667. [Google Scholar] [CrossRef]
- Ma, B.; Hauer, R.J.; Xu, C. Effects of Design Proportion and Distribution of Color in Urban and Suburban Green Space Planning to Visual Aesthetics Quality. Forests 2020, 11, 278. [Google Scholar] [CrossRef]
- Tan, X.; Peng, Y.Y. Scenic Beauty Evaluation of Plant Landscape in Yunlong Lake Wetland Park of Xuzhou City, China. Arab. J. Geosci. 2020, 13, 701. [Google Scholar] [CrossRef]
- Li, X.; Wang, X.R.; Jiang, X.; Han, J.Y.; Wang, Z.Y.; Wu, D.Z.; Lin, Q.; Li, L.; Zhang, S.Y.; Dong, Y. Prediction of Riverside Greenway Landscape Aesthetic Quality of Urban Canalized Rivers Using Environmental Modeling. J. Clean. Prod. 2022, 367, 133066. [Google Scholar] [CrossRef]
- Zhao, Y.; Wu, B.; Wu, J.; Shu, S.; Liang, H.; Liu, M.; Badenko, V.; Fedotov, A.; Yao, S.; Yu, B. Mapping 3d Visibility in an Urban Street Environment from Mobile Lidar Point Clouds. Giscience Remote Sens. 2020, 57, 797–812. [Google Scholar] [CrossRef]
- Kothencz, G.; Kolcsár, R.; Cabrera-Barona, P.; Szilassi, P. Urban Green Space Perception and Its Contribution to Well-Being. Int. J. Environ. Res. Public Health 2017, 14, 766. [Google Scholar] [CrossRef] [PubMed]
- Solecka, I.; Rinne, T.; Martins, R.C.; Kytta, M.; Albert, C. Important Places in Landscape-investigating the Determinants of Perceived Landscape Value in the Suburban Area of Wroclaw, Poland. Landsc. Urban Plan. 2022, 218, 104289. [Google Scholar] [CrossRef]
- Jisoo, S.; Miller, P.; Swarup, S. Tweeting the High Line Life: A Social Media Lens on Urban Green Spaces. Sustainability 2020, 12, 8895. [Google Scholar]
- Li, H.E.; You, C.; Li, J.; Li, M.; Tan, M.; Zhang, G.F.; Zhong, Y.P. Influence of Environmental Aesthetic Value and Anticipated Emotion on Pro-Environmental Behavior: An ERP Study. Int. J. Environ. Res. Public Health 2022, 19, 5714. [Google Scholar] [CrossRef]
- Yue, M.; Ling, C.; Wu, J. Exploring the Spatial Distribution Characteristics of Emotions of Weibo Users in Wuhan Waterfront Based on Gender Differences Using Social Media Texts. ISPRS Int. J. Geo Inf. 2020, 9, 465. [Google Scholar]
- Xia, Y.; Yabuki, N.; Fukuda, T. Development of A system for Assessing the Quality of Urban Street-level Greenery Using Street View Images and Deep Learning. Urban For. Urban Green. 2021, 59, 126995. [Google Scholar] [CrossRef]
- Vian, F.D.; Izquierdo, J.; Martínez, M.S. River-city Recreational Interaction: A Classification of Urban Riverfront Parks and Walks. Urban For. Urban Green. 2021, 59, 127042. [Google Scholar] [CrossRef]
- Xue, J.; Shi, J.H. Spatio-temporal Big Data Analysis of Tourists: A Case Study of Hangzhou. In Proceedings of the International Conference on Environmental Remote Sensing and Big Data (ERSBD 2021), Wuhan, China, 9 December 2021; p. 12129. [Google Scholar]
- Huang, X.; Li, M.; Zhang, J.; Zhang, L.; Zhang, H.; Yan, S. Tourists’ Spatial-temporal Behavior Patterns in Theme Parks: A Case Study of Ocean Park HongKong. J. Destin. Mark. Manag. 2020, 15, 100411. [Google Scholar] [CrossRef]
- Li, J.; Deng, J.; Pierskalla, C. Impact of attendees’ motivation and past experience on their attitudes toward the national cherry blossom festival in Washington, D.C. Urban For. Urban Green. 2018, 36, 57–67. [Google Scholar] [CrossRef]
- Schirpke, U.; Zoderer, B.M.; Tappeiner, U.; Tasser, E. Effects of Past Landscape Changes on Aesthetic Landscape Values in the European Alps. Landsc. Urban Plan. 2021, 212, 104109. [Google Scholar] [CrossRef]
- Wang, R.; Jiang, W.; Lu, T. Landscape Characteristics of University Campus in Relation to Aesthetic Quality and Recreational Preference. Urban For. Urban Green. 2021, 66, 127389. [Google Scholar] [CrossRef]
- Gülçin, D.; Yalçınkaya, N.M. Correlating Fluency Theory-based Visual Aesthetic Liking of Landscape with Landscape Types and Features. Geo Spat. Inf. Sci. 2022. [Google Scholar] [CrossRef]
- Korlyakov, K.A.; Gashev, S.N. Classification of Ecotones In Three-dimensionalspace: Horizontal, Verticaland Cross-horizontalecotones. In Proceedings of the VI International Scientific Conference on Advanced Agritechnologies, Environmental Engineering and Sustainable Development, Krasnoyarsk, Russia, 17–19 November 2021. [Google Scholar]
- Cha, I.; Park, I.K. A Study on the Relationship between the User’s Behavior and Lighting Design by Horizontal-Vertical-Three Dimensional elements of Light in Brand Coffee Shop. Des. Converg. Study 2014, 13, 171–186. [Google Scholar]
- Pototan, B.L.; Capin, N.C.; Delima, A.G.; Novero, A.U. Assessment of Mangrove Species Diversity in Banaybanay, Davao Oriental, Philippines. Biodiversitas J. Biol. Divers. 2020, 22, 144–153. [Google Scholar] [CrossRef]
- Yeboah, D.; Chen, H.Y.; Kingston, S.R. Tree species richness decreases while species evenness increases with disturbance frequency in a natural boreal forest landscape. Ecol. Evol. 2016, 6, 842–850. [Google Scholar] [CrossRef]
- Wu, T.; Zha, P.; Yu, M.; Jiang, G.; Zhang, J.; You, Q.; Xie, X. Landscape Pattern Evolution and Its Response to Human Disturbance in a Newly Metropolitan Area: A Case Study in Jin-Yi Metropolitan Area. Land 2021, 10, 767. [Google Scholar] [CrossRef]
- Srinivasan, K.; Sebastian, A.; Menachery, M.P.; Pant, G. Landscape Fragmentation Analysis in and around Rajaji, National Park, Uttarakhand, India. Indian J. Ecol. 2022, 49, 590–595. [Google Scholar]
- Jie, L.Y. Research and Application of Image Semantic Segmentation Algorithm Based on CNN. Master’s Dissertation, Chang’an University, Xi’an, China, 2020. [Google Scholar]
- Haobo, J.; Shan, L.U.; Yang, X. Method of Urban Color Evaluation for Historic and Cultural Areas in Shanghai Based on Street View Technology. Urban Paning Forum 2022, 269, 111–118. [Google Scholar]
- Xiang, J.l.; Yan, H.; Jin, L.; Fang, J.; Ming, Y. Relationship Between Slope Shape and Soil and Water Loss: A Case Study of Xixi Catchment Watershed. J. China Agric. Univ. 2019, 24, 161–171. [Google Scholar]
- Krebs, P.; Stocker, M.; Pezzatti, G.B.; Conedera, M. An Alternative Approach to Transverse and Profile Terrain Curvature. Int. J. Geogr. Inf. Sci. 2015, 29, 643–666. [Google Scholar] [CrossRef]
- Grimmond, C.S.; Potter, S.; Zutter, H.N.; Souch, C. Rapid Methods to Estimate Sky-view Factors Applied to Urban Areas. Int. J. Climatol. 2001, 21, 903–913. [Google Scholar] [CrossRef]
- Jia, B.L.; Ying, F.Z.; Han, L.B.; Chen, M.; Zheng, H.Y.; Tong, T.S.; Zheng, Y.H.; Chao, Z.; Shu, C.F. Quick Estimation of Three-dimensional Vegetation Volume Based on Images from an Unmanned Aerial Vehicle: A Case Study on Shanghai Botanical Garden. J. East China Norm. Univ. Nat. Sci. 2022, 2022, 122–134. [Google Scholar]
- Paudel, A.; Karkee, M.; Davidson, J.R.; Grimm, C. Canopy Density Estimation of Apple Trees. IFAC-PapersOnLine 2022, 55, 124–128. [Google Scholar] [CrossRef]
- Yang, S.; Zhang, Y.; Chen, S. Extraction of Terrain Relief Amplitude Based on GIS and Change Point Theory. In DEStech Transactions on Computer Science and Engineering; DEStech Publications: Lancaster, PA, USA, 2018. [Google Scholar]
- Yang, L.; Li, Y.; Wang, J.; Sherratt, R.S. Sentiment Analysis for E-Commerce Product Reviews in Chinese Based on Sentiment Lexicon and Deep Learning. IEEE Access 2020, 8, 23522–23530. [Google Scholar] [CrossRef]
- Xu, G.; Meng, Y.; Qiu, X.; Yu, Z.; Wu, X. Sentiment Analysis of Comment Texts Based on BiLSTM. IEEE Access 2019, 7, 51522–51532. [Google Scholar] [CrossRef]
- Guan, C.; Song, J.; Keith, M.; Akiyama, Y.; Shibasaki, R.; Sato, T. Delineating Urban Park Catchment Areas Using Mobile Phone Data: A Case Study of Tokyo. Comput. Environ. Urban Syst. 2020, 81, 101474. [Google Scholar] [CrossRef]
- Wang, S.; Ning, Y.; Shi, H. A New Uncertain Linear Regression Model Based on Equation Deformation. Soft Comput. 2021, 25, 12817–12824. [Google Scholar] [CrossRef]
- Tang, J.; Xue, Y.; Wang, Z.; Hu, S.; Gong, T.; Chen, Y.; Zhao, H.; Xiao, L. Bayesian Estimation-based Sentiment Word Embedding Model for Sentiment Analysis. CAAI Trans. Intell. Technol. 2022, 7, 144–155. [Google Scholar] [CrossRef]
- Englhardt, A.; Willkomm, J.; Schäler, M.; Böhm, K. Improving Semantic Change Analysis by Combining Word Embeddings and Word Frequencies. Int. J. Digit. Libr. 2019, 21, 247–264. [Google Scholar] [CrossRef]
- Feng, D.; Tu, L.; Sun, Z. Research on Population Spatiotemporal Aggregation Characteristics of a Small City: A Case Study on Shehong County Based on Baidu Heat Maps. Sustainability 2019, 11, 6276. [Google Scholar] [CrossRef]
- Zhang, S.; Zhang, W.; Wang, Y.; Zhao, X.; Mayer, A.L. Comparing Human Activity Density and Green Space Supply Using the Baidu Heat Map in Zhengzhou, China. Sustainability 2020, 12, 7075. [Google Scholar] [CrossRef]
- Li, J.; Li, J.; Yuan, Y.; Li, G. Spatiotemporal Distribution Characteristics and Mechanism Analysis of Urban Population Density: A Case of Xi’an, Shaanxi, China. Cities 2019, 86, 62–70. [Google Scholar] [CrossRef]
- Shi, R.; Li, G.; Wei, W.; Liu, Z. Personalized Image Observation Behavior Learning in Fixation Based Personalized Salient Object Segmentation. Neurocomputing 2021, 445, 255–266. [Google Scholar] [CrossRef]
- Peng, Y.; Liu, J.; Zhang, T.; Li, X. The Relationship between Urban Population Density Distribution and Land Use in Guangzhou, China: A Spatial Spillover Perspective. Int. J. Environ. Res. Public Health 2021, 18, 12160. [Google Scholar] [CrossRef]
- Dong, X.M.; Xu, S.N. Spatial Evolution Characteristics of Urban and Rural Settlements in Inner Mongolia. Arab. J. Geosci. 2020, 13, 1214. [Google Scholar] [CrossRef]
- Sen, S.; Guchhait, S.K. Urban Green Space in India: Perception of Cultural Ecosystem Services and Psychology of Situatedness and Connectedness. Ecol. Indic. 2021, 123, 107338. [Google Scholar] [CrossRef]
- Zhiman, Z.; Xianyu, Z. Study on Landscape Design of Urban Riverside Green Space Based on Environmental Behavior—Take the Small Garden of Nanchuan East Road in Xining City as an Example. In Proceedings of the 2021 6th International Conference on Minerals Source, Geotechnology and Civil Engineering, Guangzhou, China, 9–11 April 2021; Volume 768, p. 012149. [Google Scholar]
- Turan, I.A.; True, E.M. Research on the user—Space relations of a historical node. Fresenius Environ. Bull. 2020, 29, 9880–9888. [Google Scholar]
- Maes, M.J.; Pirani, M.; Booth, E.R.; Shen, C.; Milligan, B.; Jones, K.E.; Toledano, M.B. Benefit of woodland and other natural environments for adolescents’ cognition and mental health. Nat. Sustain. 2021, 4, 851–858. [Google Scholar] [CrossRef]
- Candini, M.; Giuberti, V.; Santelli, E.; di Pellegrino, G.; Frassinetti, F. When Social and Action Spaces Diverge: A Study in Children with Typical Development and Autism. Autism 2019, 23, 1687–1698. [Google Scholar] [CrossRef]
- Zhang, Z.; Gao, Y.; Zhou, S.T.; Zhang, T.; Zhang, W.K.; Meng, H. Psychological Cognitive Factors Affecting Visual Behavior and Satisfaction Preference for Forest Recreation Space. Forests 2022, 13, 136. [Google Scholar] [CrossRef]
- Zhou, S.; Chang, J.; Hu, T.; Luo, P.; Zhou, H. Spatiotemporal Variations of Land Use and Landscape Ecological Risk in A Resource-based City, From Rapid Development to Recession. Pol. J. Environ. Stud. 2019, 29, 475–490. [Google Scholar] [CrossRef]
- Li, Y.; Commenges, H.; Bordignon, F.; Bonhomme, C.; Deroubaix, J.F. The Tianjin Eco-City Model in the Academic Literature on Urban Sustainability. J. Clean. Prod. 2019, 213, 59–74. [Google Scholar] [CrossRef]
- Li, Q.; Yu, Y.; Jiang, X.; Guan, Y. Multifactor-based Environmental Risk Assessment for Sustainable Land-use Planning in Shenzhen, China. Sci. Total Environ. 2019, 657, 1051–1063. [Google Scholar] [CrossRef]
- Jia, Y.; Tang, X.; Liu, W. Spatial–temporal Evolution and Correlation Analysis of Ecosystem Service Value and Landscape Ecological Risk in Wuhu city. Sustainability 2020, 12, 2803. [Google Scholar] [CrossRef]


Disclaimer/Publisher’s Note: The statements, opinions and data contained in all publications are solely those of the individual author(s) and contributor(s) and not of MDPI and/or the editor(s). MDPI and/or the editor(s) disclaim responsibility for any injury to people or property resulting from any ideas, methods, instructions or products referred to in the content. |
© 2023 by the authors. Licensee MDPI, Basel, Switzerland. This article is an open access article distributed under the terms and conditions of the Creative Commons Attribution (CC BY) license (https://creativecommons.org/licenses/by/4.0/).