
The Prevalence of Cardiometabolic Health Risk Factors among Airline Pilots: A Systematic Review


Abstract

1. Introduction
2. Materials and Methods
2.1. Protocol
2.2. Literature Search
2.3. Eligibility Criteria
2.4. Screening Process
2.5. Methodological Quality Assessment
2.6. Data Extraction
2.7. Analysis of Data
3. Results
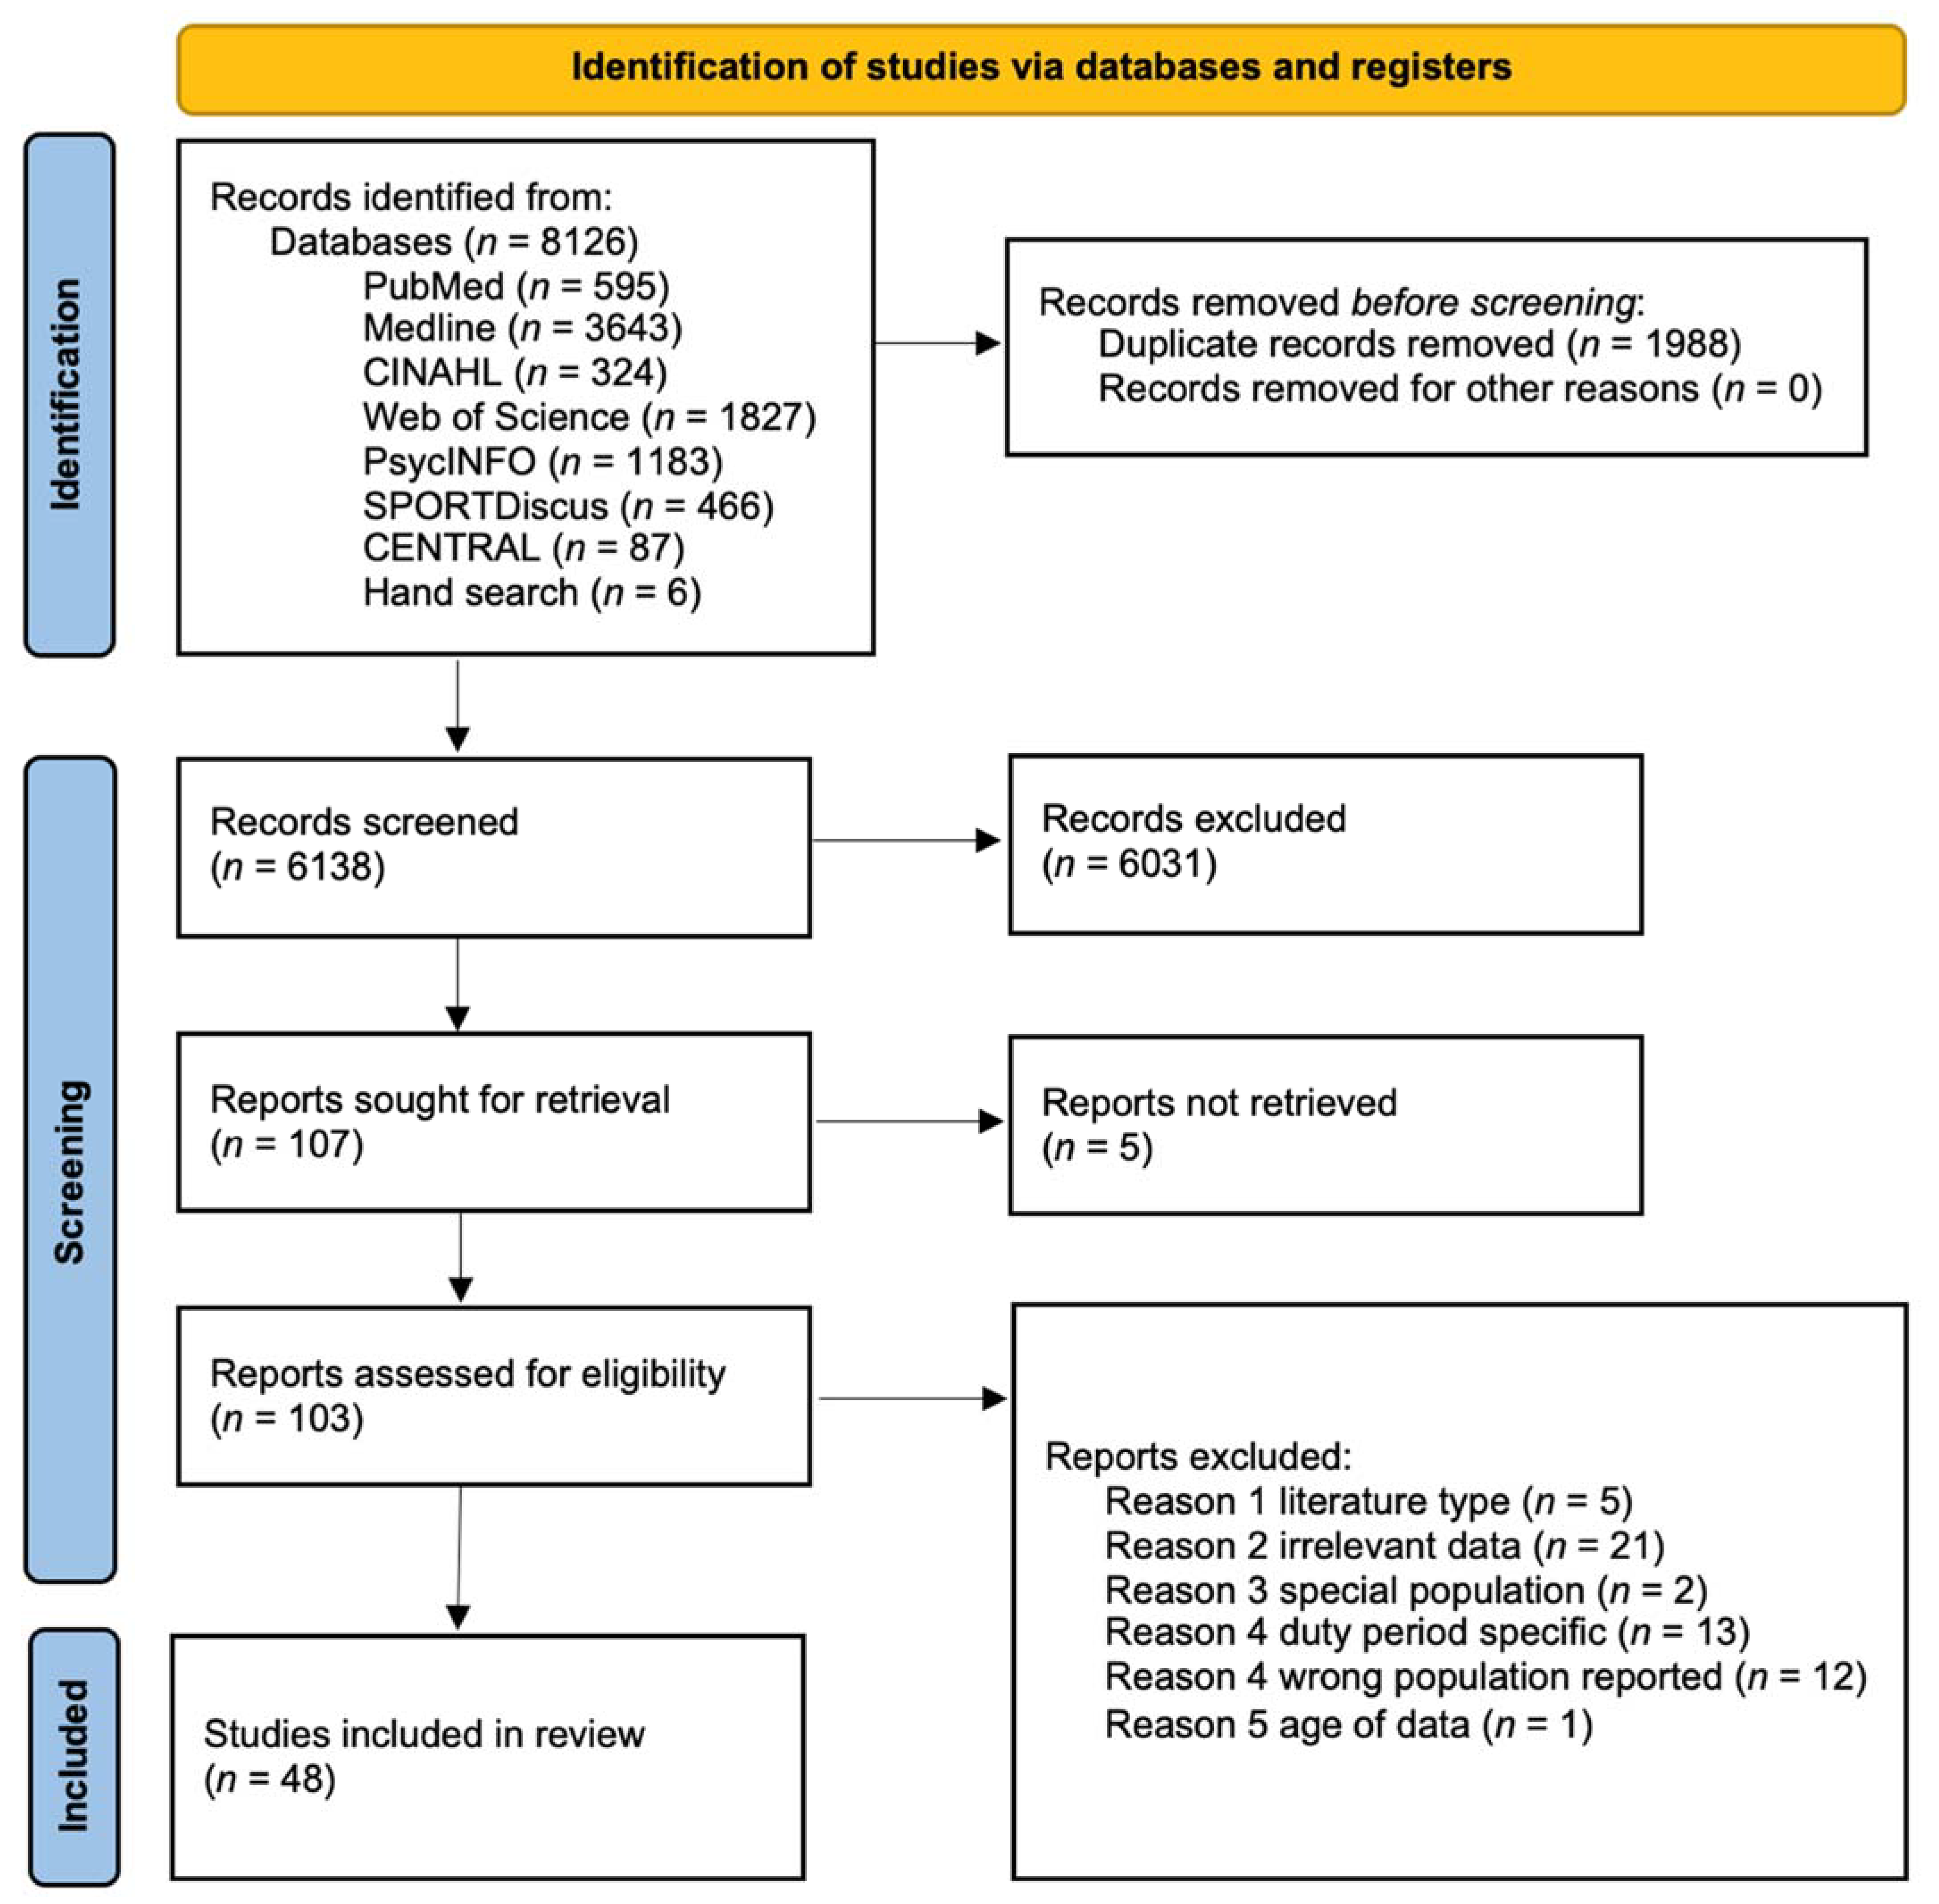
3.1. Study Selection
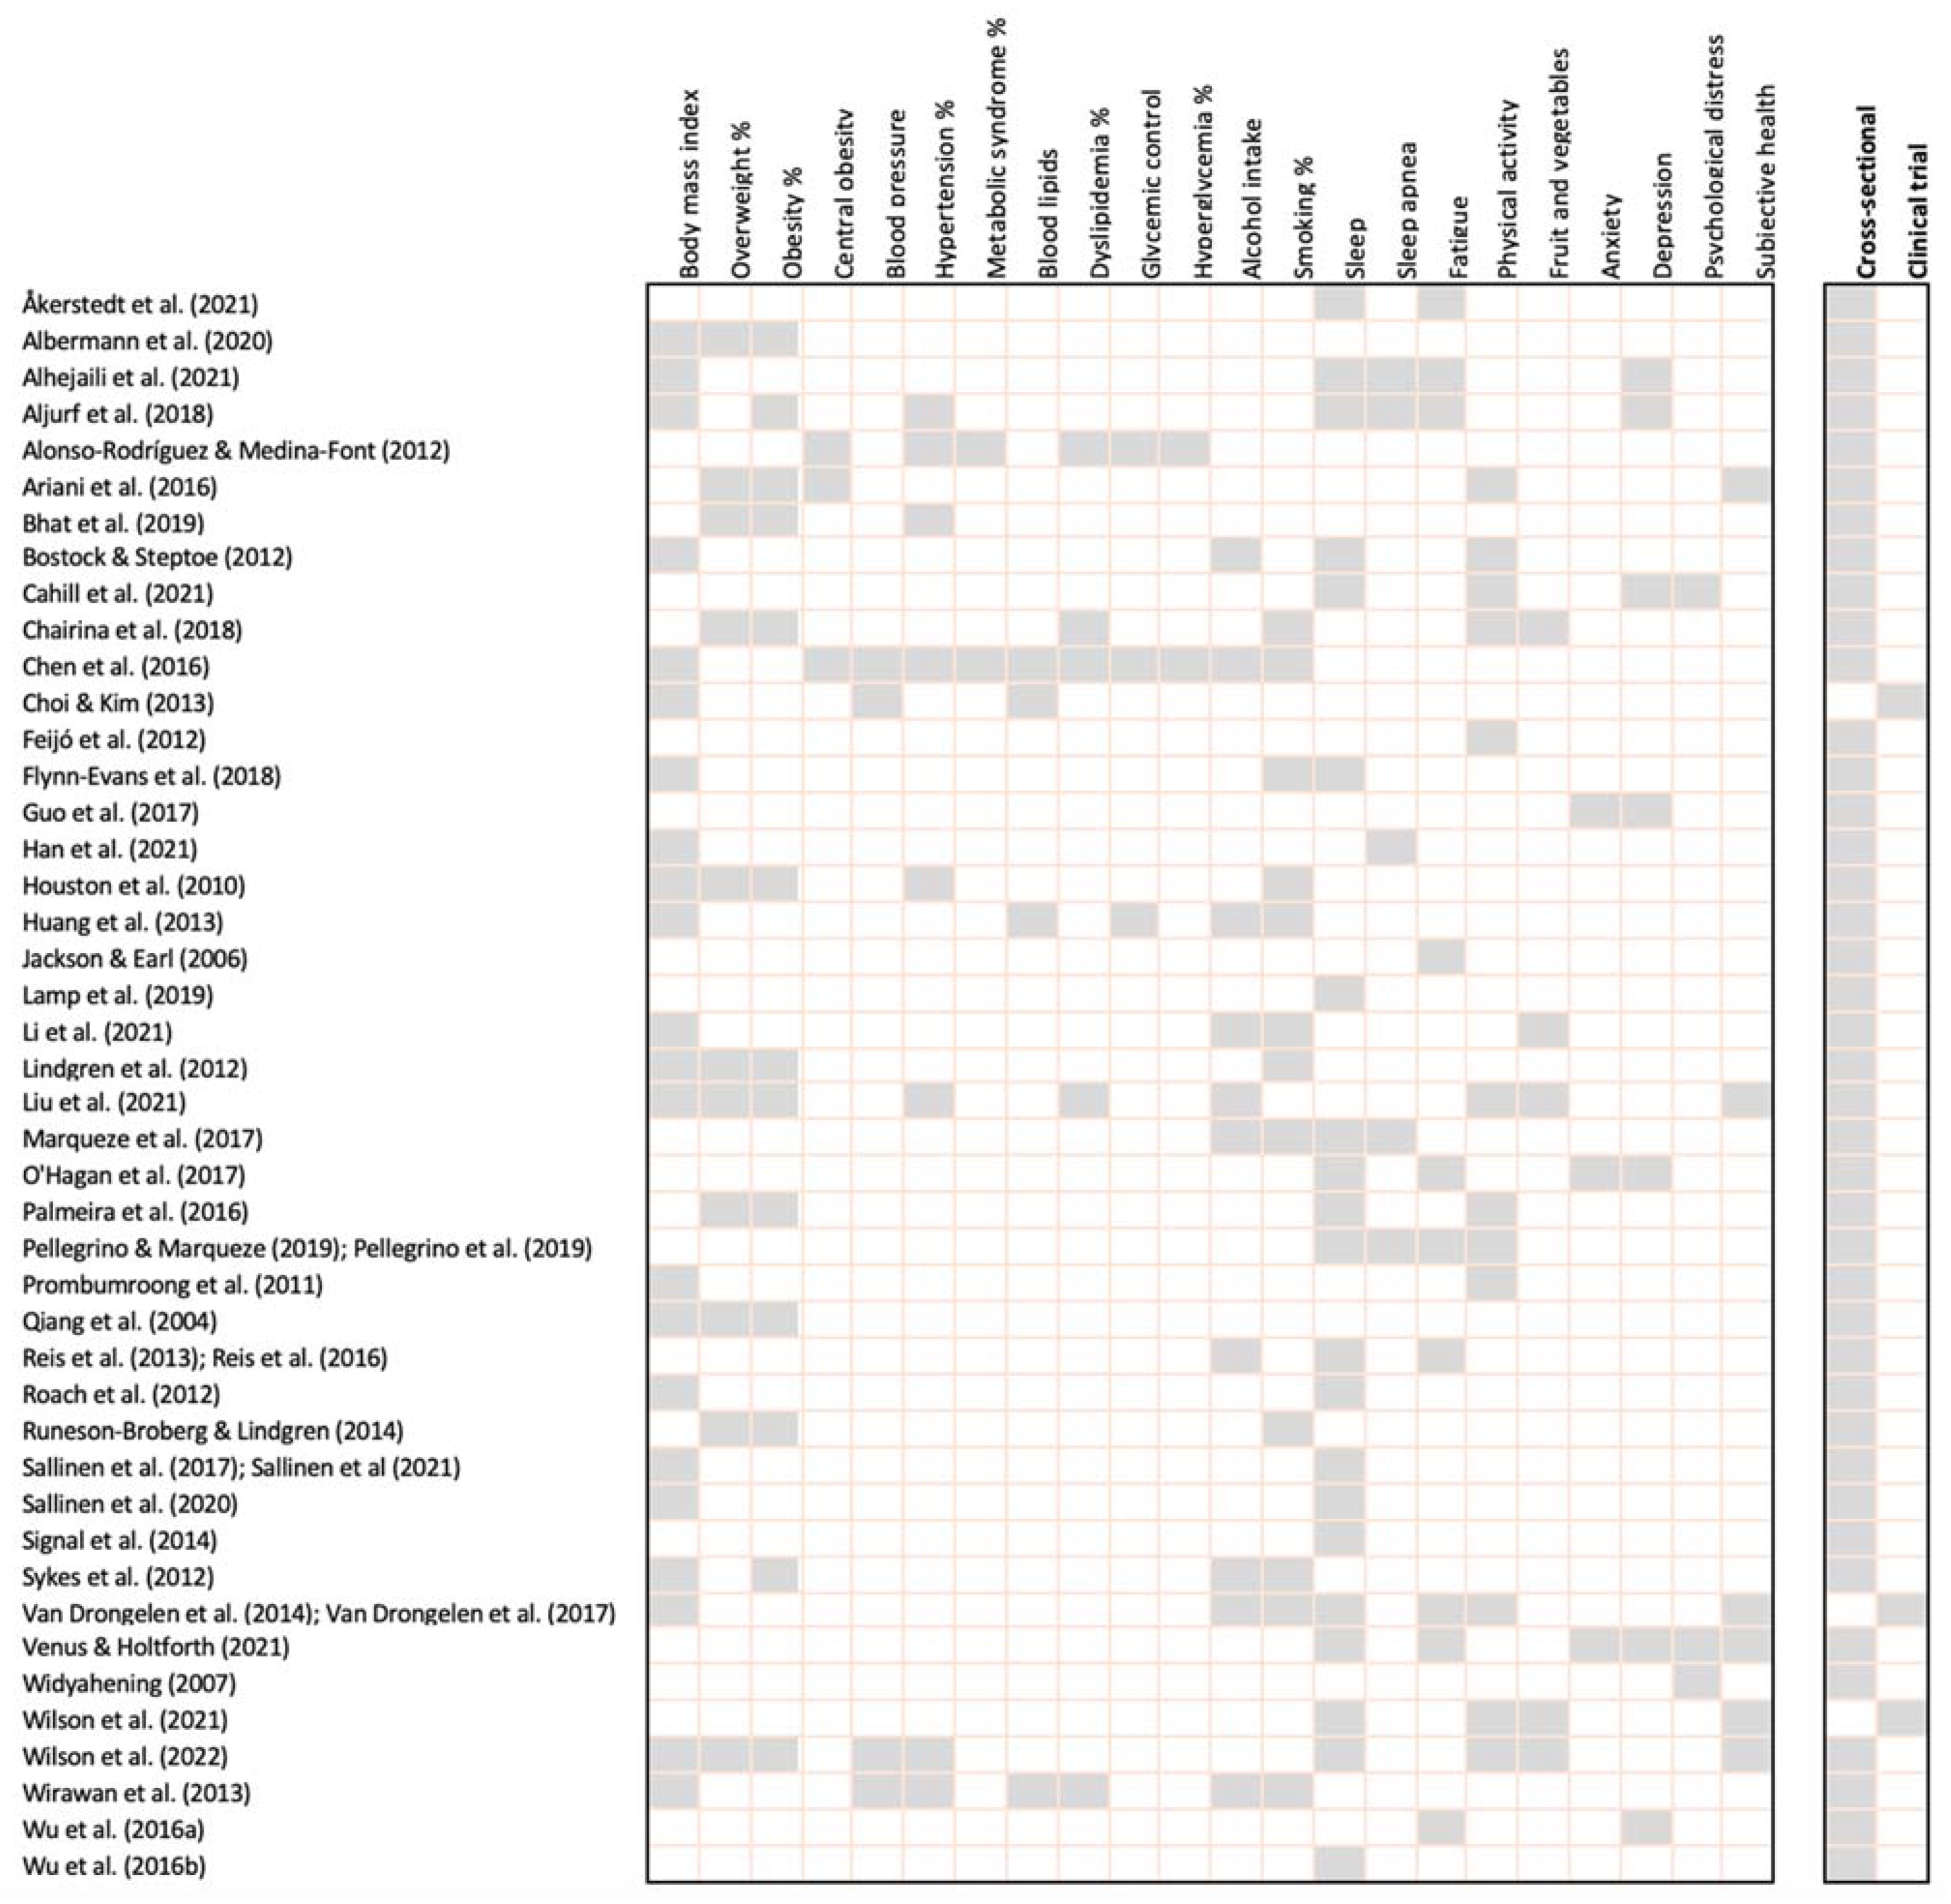
3.2. Study Characteristics
3.3. Quality of Reviewed Articles
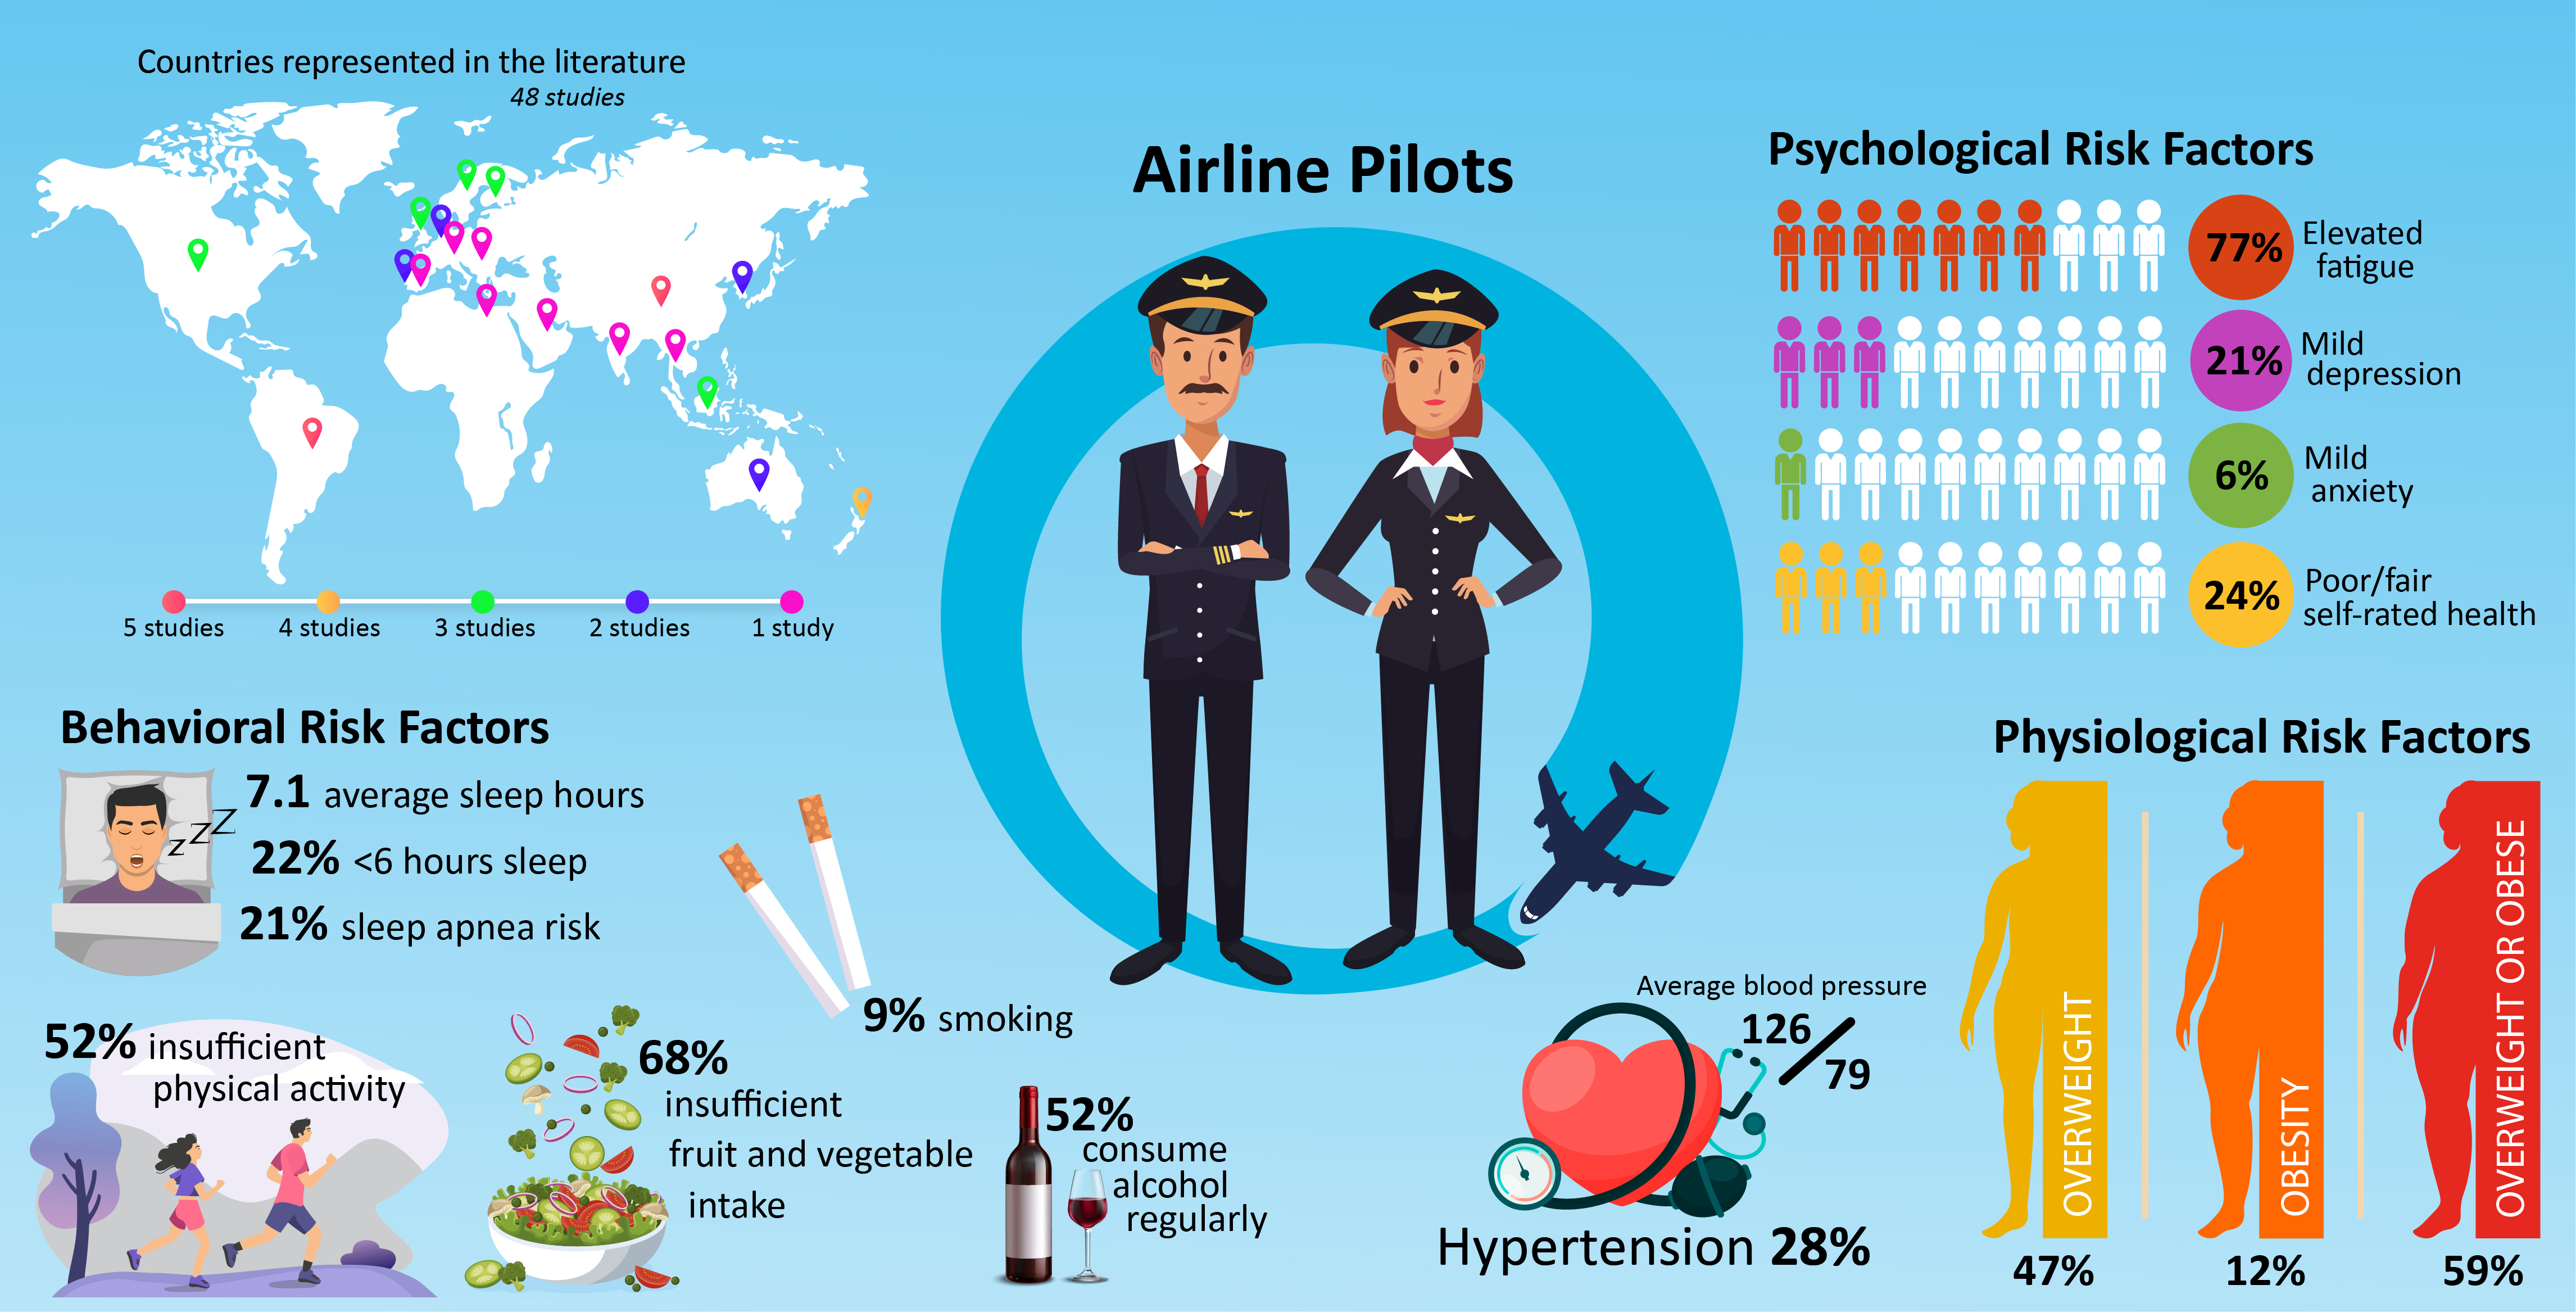
3.4. Physiological Cardiometabolic Risk Factors among Pilots
3.5. Behavioral Cardiometabolic Risk Factors among Pilots
3.6. Psychological Cardiometabolic Risk Factors among Pilots
4. Discussion
4.1. Prevalence of Physiological Cardiometabolic Risk Factors among Pilots
4.2. Prevalence of Behavioral Cardiometabolic Risk Factors among Pilots
4.3. Prevalence of Psychological Cardiometabolic Risk Factors among Pilots
4.4. Study Strengths
4.5. Study Limitations
5. Conclusions
Author Contributions
Funding
Institutional Review Board Statement
Informed Consent Statement
Data Availability Statement
Conflicts of Interest
Appendix A

| Study (Year) | Aim of Study | Design; Data; Country | Sample; % Male; Age | Key Findings | Instruments |
|---|---|---|---|---|---|
| Åkerstedt et al. (2021) [17] | Investigate associations among schedule, fatigue, and sleep | Cross-sectional; subjective; Sweden | n = 89; 76%; 38 ± 9 years | Fatigue (KSS) = 4.2 ± 1.8; sleep = 6.8 ± 1.4 h; sleep, duty time, and early starts are important predictors of fatigue in the 24 h window and that the number of very early starts and short sleep have cumulative effects on fatigue across a 7 day work period | Karolinska Sleepiness Scale; sleep duration self-report |
| Albermann et al. (2020) [18] | Evaluate the prevalence of lower-back pain compared with the general population | Cross-sectional; subjective; Germany | n = 698; 92%; 40 ± 9 years | BMI = 24.4 ± 2.7; overweight = 35% and obesity = 3.2%; chronic lower-back pain = 83%; time spent sitting during work = 90% | BMI (self-report); Oswestry Lower-Back Pain Disability Index |
| Alhejaili et al. (2021) [19] | Evaluate the presence of obstructive sleep apnea in pilots | Cross-sectional; subjective and objective; Saudi Arabia | n = 39; 100%; 43 ± 10 years | BMI = 24.5 ± 2.4; insomnia prevalence (AIS ≥ 6) = 31%; high risk of obstructive apnea = 5%; abnormal sleepiness = 23%; mild depression = 26%; moderate severity depression = 10%; suboptimal sleep quality = 39%; severe fatigue = 33%; VAFS abnormal fatigue = 23% | BMI; Athens insomnia scale (AIS); Berlin Questionnaire; Epworth Sleepiness Scale (ESS); Pittsburgh Sleep Quality Index (PSQI); Fatigue Severity Scale (FSS); Visual Analog Fatigue Scale (VAFS); Patient Health Questionnaire (PHQ-9) |
| Aljurf et al. (2018) [20] | Evaluate the prevalence of fatigue, depression, sleepiness, and the risk of obstructive sleep apnea | Cross-sectional; subjective; Arab states | n = 328; 99%; 41 ± 10 years | BMI = 27.6 ± 5.0; BMI ≥ 30 = 24%; Sleep <6 h = 22%; known hypertension = 13%; severe fatigue (FSS ≥ 36) = 68%; reported mistakes being made in the cockpit because of fatigue = 67%; ESS excessive sleepiness = 34%; high risk of OSA = 29%; depression (HADS ≥ 8) = 35% | Fatigue Severity Scale (FSS); Berlin Questionnaire; Epworth Sleepiness Scale (ESS); Hospital Anxiety and Depression Scale (HADS) |
| Alonso-Rodríguez and Medina-Font (2012) [21] | Evaluate C-reactive protein levels and the prevalence of metabolic syndrome | Cross-sectional; objective; Spain | n = 1009; 100%; 42 ± 11 years | elevated BP = 38%; hyperglycemia = 31%; elevated serum triglycerides = 24%; abdominal obesity = 18%; low HDL cholesterol = 8%; hs-CRP serum levels = 1.7 ± 1.8 mg/L; high hs-CRP incidence increased with age; metabolic syndrome (MS) prevalence = 15%; MS in pilots <35 years old = 4%; MS in pilots 35–50 years old = 14%; MS in pilots >50 years old = 29%; hs-CRP was significantly higher in pilots with MS than those without MS | Venous blood test; waist circumference; blood pressure; not all instruments specified |
| Ariani et al. (2016) [22] | Evaluate physical exercise habits and associated factors | Cross-sectional; subjective; Indonesia | n = 332; 100%; 20–29 years = 39%, 30–39 years = 23%, 40–49 years = 21%, 50–65 years = 16% | <150 MVPA min per week = 56%; overweight = 28% and obesity = 53%; central obesity = 46%; low or average SLS score (≤24) = 39% | BMI (self-report); Satisfaction with Life Scale (SLS); not all instruments specified |
| Bhat et al. (2019) [23] | Examine the prevalence of hypertension and obesity and their relationship | Cross-sectional; objective; India | n =1185; 89%; 35 ± 14 years | Overweight = 39% and obesity = 7%; hypertension = 11% | BMI; blood pressure |
| Bostock and Steptoe (2012) [24] | Investigate work schedule influence on diurnal cortisol rhythm | Cross-sectional; subjective; the United Kingdom | n = 30; 100%; 20–29 years = 15%, 30–39 years = 41%, 40–49 years = 30%, 50–65 years = 15% | BMI = 25.6 ± 2.5; sleep = 8.2 ± 1 h; consumed alcohol on nonwork days = 52%; exercised >10 min on nonwork days = 28% | BMI (self-report); not all instruments specified |
| Cahill et al. (2021) [25] | Investigate the relationship among work-related stress, wellbeing, and coping mechanisms | Cross-sectional; subjective; international | n = 821; 88%; <25 years = 5%, 25–35 years = 27%, 36–45 years = 31%, 46–55 years = 26%, 56–65 years = 12% | Mild depression = 40%; moderate-severity depression = 4%; severe depression = 2%; regular exercise (≥3 times per week) = 25%; perceived regular sleep difficulties = 81%; regular work stress digestive symptoms = 59%; regular work stress induced psychosocial distress = 37% | Patient Health Questionnaire-9 (PHQ-9); Oldenburg Burnout |
| Chairina et al. (2018) [26] | Identify the risk factors associated with dyslipidemia | Cross-sectional; subjective and objective; Indonesia | n = 128; 100%; not reported | Overweight = 20% and obesity = 65%; <150 MVPA min per week = 71%; inappropriate or excessive food intake = 66%; smoking = 45%; dyslipidemia = 62%; elevated TG = 29%; elevated LDL = 47%; low HDL = 57% | Instruments not specified |
| Chen et al. (2016) [27] | Evaluate metabolic syndrome and periodontal disease status | Cross-sectional; objective; China | n = 303; 100%; 35 ± 8 years | BMI = 23.6 ± 2.6; smoking = 33%; regular alcohol drinker = 20%; metabolic syndrome =3 8%; elevated waist circumference = 64%, 87.6 ± 8.5 (cm); low HDL-C levels = 46%, 1.2 ± 1.9 (mmol/L); elevated fasting plasma glucose = 30%, 5.4 ± 0.6 (mmol/L); high systolic BP = 28%, 124 ± 11 (mmHg); elevated TG levels = 28%, 1.5 ± 0.8 (mmol/L); high diastolic pressure = 17%, 79 ± 7 (mmHg) | Venous blood test; saliva test; periodontal examination; blood pressure; waist circumference; BMI; Community Periodontal Index |
| Choi and Kim (2013) [3] | Evaluate the effects of physical examination and diet consultation on risk factors for CVD | Clinical trial; subjective and objective; Korea | n = 326; 100%; 30–39 years = 47%, 40–49 years = 33%, 50–59 years = 20% | TC > 220 mg/dL = 18%; TC (mg/dL) = 236 ± 13; HDL (mg/dL) = 51 ± 11; LDL (mg/dL) = 155 ± 16; TG (mg/dL) = 154 ± 81; BMI = 24.5 ± 2.1; weight (kg) = 73 ± 8; SBP (mmHg) = 118 ± 12; DBP (mmHg) = 76 ± 9 | BMI; venous blood test; blood pressure |
| Feijó et al. (2012) [28] | Evaluate the prevalence of common mental disorders and related factors | Cross-sectional; subjective; Brazil | n = 807; 92%; 46 years | Regular physical activity practice = 61%; common mental disorders = 7% | Self-Reporting Questionnaire—20 items |
| Flynn-Evans et al. (2018) [29] | Investigate work schedule effects on neurobehavioral performance and sleep | Cross-sectional; subjective and objective; USA | n = 44; 91%; 31 ± 7 years | BMI = 24.2 ± 2.6; sleep = 6.8 ± 0.9 h; sleep latency 18%; sleep efficiency = 83%; smoking habit = 5% | Sleep diary; Psychomotor Vigilance Task; Samn–Perelli fatigue scale; actigraphy |
| Guo et al. (2017) [30] | Investigate the effects of emotional intelligence on depression and anxiety | Cross-sectional; subjective; China | n = 319; 100%; 31 ± 6 years | Mild depression = 24%; moderate depression = 1%; mild anxiety = 4%; moderate anxiety = 0.3% | Trait Meta Mood Scale; Proactive Coping Scale; The Patient Health Questionnaire (PHQ-9); Generalized Anxiety Disorder-7 (GAD-7) |
| Han et al. (2021) [31] | Investigate the occurrence of obstructive sleep apnea | Cross-sectional; subjective and objective; Korea | n = 103; 100%; 44 ± 8 years | BMI = 24.6 ± 2.1; neck circumference = 38 ± 2 (cm); OSA high risk = 32% | BMI; Epworth Sleepiness Scale (ESS); Berlin questionnaire; neck circumference; polysomnography; apnea–hypopnea index; oxygen desaturation index; respiratory disturbance index |
| Houston et al. (2010) [32] | Identify the 10 year absolute CVD risk of pilots using a cardiovascular disease risk prediction model | Cross-sectional; subjective and objective; the United Kingdom | n = 14,379; 95%; not reported | BMI = 26.0 (male) and 23.9 (female); overweight = 47% (male) and 28% (female); obesity = 12% (male) and 6% (female); smoking = 8% (male) and 6% (female); hypertension = 29% (male) and 14% (female); population 10 year absolute CVD risk = 8% ± 7%; 10 year absolute CVD risk >20% (high risk) was 9% for males and 0% for females | BMI; blood pressure; not all instruments specified |
| Huang et al. (2013) [33] | Evaluate distribution of APOE gene polymorphism, dyslipidemia, and overweight | Cross-sectional; subjective and objective; China | n = 416; 100%; 39 ± 11 years | BMI = 24.2 ± 2.5; fasting glucose = 5.2 ± 0.6 (mmol/L); smoking = 54%; regular alcohol intake = 32%; total cholesterol = 4.6 ± 0.9 (mmol/L); LDL (mmol/L) = 2.8 ± 0.8; HDL = 1.3 ± 0.3 (mmol/L); TG = 1.6 ± 0.9 (mmol/L) | BMI; venous blood test; not all instruments specified |
| Jackson and Earl (2006) [34] | Evaluate fatigue prevalence | Cross-sectional; subjective; the United Kingdom | n = 162; 94%; 38 ± 9 years, range 21–59 years | Global CFS fatigue score = 18 ± 5; severe fatigue on the CFS = 75%; “fatigue worse than 2 years ago” = 81%; “feel tired with impaired judgement while flying?” = 80%; “concerned with the level of fatigue you experience?” = 78% | Chronic Fatigue Scale (CFS) |
| Lamp et al. (2019) [35] | Evaluate sleep timing and duration | Cross-sectional; subjective and objective; USA | n = 92; 84%; 51 ± 9 years | Sleep = 8.2 ± 1.7h | Actigraphy |
| Li et al. (2021) [36] | Investigate the prevalence of functional gastrointestinal disorders and associated triggers | Cross-sectional; subjective; China | n = 212; 100%; 34 ± 7 years | BMI = 23.8 ± 2.4, range 19–29; regular alcohol = 31%; smoking = 49%; functional gastrointestinal disorder prevalence = 39% | BMI (self-report); semi-quantitative food frequency questionnaire (SQFFQ) |
| Lindgren et al. (2012) [37] | Investigate associations among digestive symptoms and diet, insomnia, and lifestyle factors | Cross-sectional; subjective; Sweden | n = 354; 91%; 49 ± 6 years | Male BMI = 25.2; female BMI = 22.7; overall overweight = 41% and obesity = 4%; smoking = 5% | BMI (self-report); not all instruments specified |
| Liu et al. (2021) [38] | Investigate health-related quality of life and its related factors | Cross-sectional; subjective; China | n = 373; 100%; 35 ± 8 years | BMI = 23.8 ± 2.2; hypertension = 7%; dyslipidemia = 19%; overweight = 46% and obesity = 3%; smoking = 39%; regular alcohol intake = 38%; physical activity days per week = 2 (range 1–3); vegetable intake ≤300 g per day = 19%; fruit intake ≤200 g per day = 33%; self-rated health (very poor or poor) = 13%; self-rated quality of life (very poor or poor) = 8%; self-rated energy and fatigue (very poor or poor) = 6% | BMI (self-report); WHOQOL-BREF; not all instruments specified |
| Marqueze et al. (2017) [39] | Evaluate factors associated with unintentional sleep at work of airline pilots | Cross-sectional; subjective; Brazil | n = 1234; 97%; 39 ± 10 years | Smoking = 7%; regular alcohol = 75%; moderate alcohol intake = 24%; harmful use of alcohol = 1%; sleep 6.9 ± 1.2 h; unintentional sleep while on duty = 58%; sleep quality “fairly or very bad” = 11%; OSA high risk = 20%; excessive sleepiness = 42% | Alcohol Use Disorders Identification Test; Karolinska Sleep Questionnaire; Berlin questionnaire; Epworth Sleepiness Scale; Work Ability Index |
| O’Hagan et al. (2017) [40] | Investigate the differences in self-reported depression or anxiety | Cross-sectional; subjective; Europe | n = 701; 95%; not reported | Depression or anxiety in the past 12 months prevalence = 54%; working >41 h per week, sleep disruption, elevated fatigue, and being female were factors associated with higher probability of reporting feeling depressed or anxious in the last 12 months | Internally validated questionnaire |
| Palmeira et al. (2016) [41] | Identify the prevalence and associated factors of overweight and obesity | Cross-sectional; subjective; Brazil | n = 1198; 100%; 39 ± 10 years, range 21–67 years | Overweight = 54% and obesity = 15%; factors associated with obesity included ≤150 min of weekly physical activity, ≤6 h of sleep during days off, sleepiness, and time of being a pilot were associated with obesity | BMI (self-report); Karolinska Sleep Questionnaire |
| Pellegrino and Marqueze (2019) [42]; Pellegrino et al. (2019) [43] | Investigate the association of work organization and sleep aspects with work ability | Cross-sectional; subjective; Brazil | n =1234; 97%; 39 ± 10 years | <150 MVPA min per week = 50%; perceived insufficient sleep = 32%; excessive sleepiness = 43%; perceived of high fatigue = 27%; OSA high risk = 21%; poor sleep quality = 48%; poor sleep quality was associated with shift characteristics, being insufficiently physically active, and sleeping <6 h on days off. | Karolinska Sleepiness Scale; Berlin questionnaire; Epworth Sleepiness Scale; Yoshitake questionnaire; Work Ability Index; Job Stress Scale; Need for Recovery Scale |
| Prombumroong et al. (2011) [44] | Evaluate the prevalence of lower-back pain and associated factors | Cross-sectional; subjective; Thailand | n = 684; 100%; 40 ± 10 years | BMI = 24.3 ± 2.8; no regular exercise = 64%; lower-back pain in the last 12 months = 56% | BMI (self-report); Job Content Questionnaire Thai version (JCQ Thai version); Nordic questionnaire for lower-back pain |
| Qiang et al. (2004) [45] | Evaluate the association of body mass index with cardiovascular disease | Cross-sectional and prospective; subjective and objective; USA | n =3019; 100%; range 45–54 years | BMI = 27.2 ± 3.4; overweight = 55% and obesity = 7%; pilots who were overweight and obese had 6% and 22% higher CVD risk, respectively | BMI; blood pressure |
| Reis et al. (2013) [46]; Reis et al. (2016) [47] | Evaluate the prevalence of fatigue and compare the differences among fatigue, sleep, and labor specificities | Cross-sectional; subjective; Portugal | n = 456; 97%; 39 ± 8 years | Total fatigue prevalence (FSS ≥ 4) = 89%; JSS ≥ 4 = 35.0%; excessive sleepiness = 59%; alcohol intake >3 times per week = 1% | Internally validated questionnaire; Fatigue Severity Scale (FSS); Epworth Sleepiness Scale (ESS); Jenkins Sleep Scale (JSS) |
| Roach et al. (2012) [48] | Evaluate the impact of work schedule on the sleep and fatigue | Cross-sectional; subjective and objective; Australia | n = 19; 100%; 54 ± 2 years | BMI = 25.0 ± 2.4; sleep hours = 7.2 h | Samn–Perelli Fatigue Checklist; actigraphy; not all instruments specified |
| Runeson-Broberg and Lindgren (2014) [49] | Assess the prevalence of musculoskeletal symptoms | Cross-sectional; subjective; Sweden | n = 354; 91%; 31–40 years = 9%, 41–50 years = 61%, 51–60 years = 29%, 61+ years = 2% | Overweight = 41% and obesity = 4%; smokers = 5% | BMI (self-report); Nordic questionnaire for analyzing musculoskeletal symptoms |
| Sallinen et al. (2017) [50]; Sallinen et al. (2021) [52] | Evaluate and compare sleep patterns, sleepiness, and management strategies | Cross-sectional; subjective and objective; Finland | n = 477; 100%; 43 ± 7 years | BMI = 25.1 ± 2.9; sleep = 7 h 27 min ± 51 min | Actigraphy; Karolinska Sleepiness Scale; BMI (self-report) |
| Sallinen et al. (2020) [51] | Compare sleepiness ratings of airline pilot and truck drivers | Cross-sectional; subjective and objective; Finland | n = 33; 100%; 44 ± 7 years | Sleep = 7 h 48 min ± 56 min; BMI = 25.6 ± 3.6; KSS = 4.0 | Actigraphy; Karolinska Sleepiness Scale; BMI (self-report); not all instruments specified |
| Signal et al. (2014) [53] | Evaluate the uptake and effectiveness of fatigue mitigation guidance material | Cross-sectional; objective; New Zealand | n = 52; 100%; 55 years | Sleep hours = 7.0 ± 1.2 h; sleep efficiency = 88 ± 5% | Actigraphy |
| Sykes et al. (2012) [6] | Compare the prevalence of medical conditions and risk factors with the general population | Cross-sectional; subjective and objective; New Zealand | n = 595; 97%; not reported | BMI = 27.1; obesity prevalence = 20%; smoking = 2%; alcoholic drink per week = 5.4 | Instruments not specified |
| Van Drongelen et al. (2014) [60]; Van Drongelen et al. (2017) [61] | Investigate the effects of an mHealth intervention to mitigate fatigue and determine risk factors for fatigue | Clinical trial; subjective; the Netherlands | n = 502; 93%; 41 ± 8 years | BMI = 24.1 ± 2.3; alcohol intake several days per week = 67%; smoking = 11.2%; CIS = 62 ± 22; moderate physical activity (days p/w) = 3.3 ± 1.9; strenuous physical activity (days p/w) = 2.0 ± 1.4; number of snacks per duty = 4.6 ± 3.6; sleep quality (1–20 scale) = 7.5 ± 3.9; sleep duration <6 h = 20%; health perception (1–5 scale, higher value denotes better health) = 3.4 ± 0.8; CIS fatigue prevalence = 30% | BMI (self-report); Checklist Individual Strength (CIS); Need for Recovery scale; Dutch Questionnaire on the Experience and Evaluation of Work; Jenkins Sleep Scale; Pittsburgh Sleep Quality Index; Short Form 36-item (SF-36) Health Survey |
| Venus and Holtforth (2021) [54] | Evaluate work schedule effects on fatigue risks on flight duty, stress, sleep problems, fatigue severity, wellbeing, and mental health | Cross-sectional; subjective; International | n = 406; 92%; 41 ± 11 years | PHQ stress = 5.0 ± 3.5; WHO5 PR (wellbeing) = 55 ± 20; PHQ-8 = 5.7 ± 4.4; SRQ-20 (common mental disorders) = 3.9 ± 4.0; Fatigue Severity Scale = 4.5 ± 1.0; Jenkins Sleep Scale = 2.0 ± 1.1; high fatigue = 33% and severe fatigue = 42%; PHQ8 ≥ 10 = 19%; GAD-7 = 3.9 ± 3.8; GAD7 ≥ 10 = 7.2% | Fatigue Severity Scale; Jenkins Sleep Scale; WHO5; Self-Reporting Questionnaire-20 (SRQ20); Patient Health Questionnaire (PHQ-8); Generalized Anxiety Disorder-7 (GAD-7) |
| Widyahening (2007) [55] | Identify the effect of work stressors and other factors on mental–emotional disturbances among airline pilots | Cross-sectional; subjective; Indonesia | n = 109; 100%; <40 years = 65%, >40 years = 56% | Mental–emotional disturbance = 39%; poor physical conditions, high work stressors, and household tension were associated with mental–emotional disturbance | Symptom Checklist 90 (SCL90) questionnaire |
| Wilson et al. (2021) [62] | Evaluate the efficacy of an intervention for enhancing health behaviors | Clinical trial; subjective; New Zealand | n = 79; 82%; 42 ± 12 years | Sleep = 7.2 ± 0.5 h; PSQI global score = 5.4 ± 2.7; weekly walking min = 110 ± 117; weekly MVPA min = 145 ± 72; <150 MVPA min per week = 49%; fruit and vegetable intake (servings/day) = 3.6 ± 0.9; <2 fruit (servings/day) = 65%; <3 vegetables (servings/day) = 47%; <5 fruit and vegetables (servings/day) = 84%; physical health score (SF-12v2) = 48 ± 7; mental health score (SF-12v2) = 51 ± 5 | Pittsburgh Sleep Quality Index (PSQI); International Physical Activity Questionnaire (IPAQ) Short Form; Short Health Form 12v2 (SF-12v2); dietary recall |
| Wilson et al. (2022) [56] | Explore the prevalence and distribution of health risk factors in airline pilots and compare these with the general population | Cross-sectional; subjective and objective; New Zealand | n = 504; 91%; 46 ± 10 years | BMI = 26.6; overweight = 51%; obesity = 16%; SBP = 131 ± 13; DBP = 81 ± 9; hypertension = 27%; sleep <7 h = 34%; sleep = 7 h 11 min; weekly MVPA = 141 ± 87; insufficient physical activity = 48%; physical health score (SF-12v2) = 47 ± 6; mental health score (SF-12v2) = 49 ± 8; fruit and vegetable intake (servings/day) = 3.7 ± 1.7; <2 fruit (servings/day) = 60%; <3 vegetables (servings/day) = 48%; <5 fruit and vegetables (servings/day) = 68%; poor or fair self-rated health = 25% | International Physical Activity Questionnaire (IPAQ) Short Form; Short Health Form 12v2 (SF-12v2); dietary recall |
| Wirawan et al. (2013) [57] | Investigate the prevalence of excessive CVD risk score | Cross-sectional; subjective and objective; Oceania | n = 595; 100%; 46 ± 12 years | BMI = 26.5 ± 4.0; smoking = 2%; alcohol consumption 5 ± 6 u/week; known hypertension = 6%; SBP = 128 ± 15; DBP = 78 ± 10; hyperlipidemia history = 10%; TC = 5.3 ± 1.1; HDL = 1.3 ± 0.5; TG = 1.1 ± 0.8; cholesterol–HDL ratio = 3.9 ± 1.4; pilots who were found to have 5 year CVD risk score of 10–15% or higher = 3.5% | Instruments not specified |
| Wu et al. (2016a) [58] | Investigate the prevalence of depression | Cross-sectional; subjective; international | n = 1826; 86%; not reported | 13% of males and 11% of females met depression threshold; 4.1% reported suicidal thoughts within the past two weeks; 5% reported experiencing fatigue daily | Patient Health Questionnaire 9 (PHQ-9) |
| Wu et al. (2016b) [59] | Characterize sleep behaviors | Cross-sectional; objective; international | n = 332; 100%; 52 years, range 23–64 years | Sleep = 7.6 h (self-report) and 6.8 h (objective); sleep ≤ 6 h = 23%; sleep > 9 h = 1% | Actigraphy and self-report |
References
- Miranda, J.J.; Barrientos-Gutiérrez, T.; Corvalan, C.; Hyder, A.A.; Lazo-Porras, M.; Oni, T.; Wells, J.C.K. Understanding the rise of cardiometabolic diseases in low- and middle-income countries. Nat. Med. 2019, 25, 1667–1679. [Google Scholar] [CrossRef] [PubMed]
- Townsend, N.; Wilson, L.; Bhatnagar, P.; Wickramasinghe, K.; Rayner, M.; Nichols, M. Cardiovascular disease in Europe: Epidemiological update 2016. Eur. Heart J. 2016, 37, 3232–3245. [Google Scholar] [CrossRef]
- Choi, Y.Y.; Kim, K.Y. Effects of physical examination and diet consultation on serum cholesterol and health-behavior in the Korean pilots employed in commercial airline. Ind. Health 2013, 51, 603–611. [Google Scholar] [CrossRef] [PubMed]
- Evans, S.; Radcliffe, S.A. The annual incapacitation rate of commercial pilots. Aviat. Space Environ. Med. 2012, 83, 42–49. [Google Scholar] [CrossRef] [PubMed]
- International Civial Aviation Authority. Manual of Civil Aviation Medicine, 3rd ed.; International Civial Aviation Authority: Montreal, QC, Canada, 2012; p. 580. [Google Scholar]
- Sykes, A.J.; Larsen, P.D.; Griffiths, R.F.; Aldington, S. A Study of Airline Pilot Morbidity. Aviat. Space Environ. Med. 2012, 83, 1001–1005. [Google Scholar] [CrossRef] [PubMed]
- Wilson, D.; Driller, M.; Winwood, P.; Johnston, B.; Gill, N. The Effects of a Brief Lifestyle Intervention on the Health of Overweight Airline Pilots during COVID-19: A 12-Month Follow-Up Study. Nutrients 2021, 13, 4288. [Google Scholar] [CrossRef] [PubMed]
- Coombes, C.; Whale, A.; Hunter, R.; Christie, N. Sleepiness on the flight deck: Reported rates of occurrence and predicted fatigue risk exposure associated with UK airline pilot work schedules. Saf. Sci. 2020, 129, 104833. [Google Scholar] [CrossRef]
- Eckel, R.H.; Grundy, S.M.; Zimmet, P.Z. The metabolic syndrome. Lancet 2005, 365, 1415–1428. [Google Scholar] [CrossRef]
- Marmot, M.; Bell, R. Social determinants and non-communicable diseases: Time for integrated action. BMJ 2019, 364, l251. [Google Scholar] [CrossRef]
- Basu, N.; Yang, X.; Luben, R.N.; Whibley, D.; Macfarlane, G.J.; Wareham, N.J.; Khaw, K.-T.; Myint, P.K. Fatigue is associated with excess mortality in the general population: Results from the EPIC-Norfolk study. BMC Med. 2016, 14, 122. [Google Scholar] [CrossRef]
- Lasserre, A.M.; Strippoli, M.P.F.; Glaus, J.; Gholam-Rezaee, M.; Vandeleur, C.L.; Castelao, E.; Marques-Vidal, P.; Waeber, G.; Vollenweider, P.; Preisig, M. Prospective associations of depression subtypes with cardio-metabolic risk factors in the general population. Mol. Psychiatry 2017, 22, 1026–1034. [Google Scholar] [CrossRef] [PubMed]
- Page, M.J.; McKenzie, J.E.; Bossuyt, P.M.; Boutron, I.; Hoffmann, T.C.; Mulrow, C.D.; Shamseer, L.; Tetzlaff, J.M.; Akl, E.A.; Brennan, S.E.; et al. The PRISMA 2020 statement: An updated guideline for reporting systematic reviews. BMJ 2021, 372, n71. [Google Scholar] [CrossRef] [PubMed]
- Hoy, D.; Brooks, P.; Woolf, A.; Blyth, F.; March, L.; Bain, C.; Baker, P.; Smith, E.; Buchbinder, R. Assessing risk of bias in prevalence studies: Modification of an existing tool and evidence of interrater agreement. J. Clin. Epidemiol. 2012, 65, 934–939. [Google Scholar] [CrossRef] [PubMed]
- Sterne, J.A.C.; Savović, J.; Page, M.J.; Elbers, R.G.; Blencowe, N.S.; Boutron, I.; Cates, C.J.; Cheng, H.-Y.; Corbett, M.S.; Eldridge, S.M.; et al. RoB 2: A revised tool for assessing risk of bias in randomised trials. BMJ 2019, 366, l4898. [Google Scholar] [CrossRef]
- Cochran, W.G. The Combination of Estimates from Different Experiments. Biometrics 1954, 10, 101–129. [Google Scholar] [CrossRef]
- Akerstedt, T.; Klemets, T.; Karlsson, D.; Habel, H.; Widman, L.; Sallinen, M. Acute and cumulative effects of scheduling on aircrew fatigue in ultra-short-haul operations. J. Sleep Res. 2021, 30, e13305. [Google Scholar] [CrossRef]
- Albermann, M.; Lehmann, M.; Eiche, C.; Schmidt, J.; Prottengeier, J. Low Back Pain in Commercial Airline Pilots. Aerosp. Med. Hum. Perform. 2020, 91, 940–947. [Google Scholar] [CrossRef]
- Alhejaili, F.; Hafez, A.; Wali, S.; Alshumrani, R.; Alzehairi, A.M.; Balkhyour, M.; Pandi-Perumal, S.R. Prevalence of Obstructive Sleep Apnea Among Saudi Pilots. Nat. Sci. Sleep 2021, 13, 537–545. [Google Scholar] [CrossRef]
- Aljurf, T.M.; Olaish, A.H.; BaHammam, A.S. Assessment of sleepiness, fatigue, and depression among Gulf Cooperation Council commercial airline pilots. Sleep Breath. 2018, 22, 411–419. [Google Scholar] [CrossRef]
- Alonso-Rodriguez, C.; Medina-Font, J. High Sensitivity C-Reactive Protein in Airline Pilots with Metabolic Syndrome. Aviat. Space Environ. Med. 2012, 83, 504–508. [Google Scholar] [CrossRef]
- Ariani, C.; Soemarko, D.S.; Yuliawati, I.; Basuki, B. Flight hours of unplanned flight and other risk factors affecting exercise habit among commercial pilots in Indonesia. Health Sci. J. Indones. 2016, 8, 36–42. [Google Scholar] [CrossRef]
- Bhat, K.G.; Verma, N.; Pant, P.; Marwaha, M.P.S. Hypertension and obesity among civil aviation pilots. Aerosp. Med. Hum. Perform. 2019, 90, 703–708. [Google Scholar] [CrossRef] [PubMed]
- Bostock, S.; Steptoe, A. Influences of early shift work on the diurnal cortisol rhythm, mood and sleep: Within-subject variation in male airline pilots. Psychoneuroendocrinology 2013, 38, 533–541. [Google Scholar] [CrossRef] [PubMed]
- Cahill, J.; Cullen, P.; Anwer, S.; Wilson, S.; Gaynor, K. Pilot Work Related Stress (WRS), Effects on Wellbeing and Mental Health, and Coping Methods. Int. J. Aerosp. Psychol. 2021, 31, 87–109. [Google Scholar] [CrossRef]
- Chairina, N.; Werdhani, R.A.; Gathmyr, D. Association of total flight hours with lipid blood profiles among civilian pilots in Indonesia. J. Phys. Conf. Ser. 2018, 1073, 042012. [Google Scholar] [CrossRef]
- Chen, X.; Xie, L.; Liu, Y.; Chen, D.J.; Yu, Q.; Gan, X.Q.; Yu, H.Y. Metabolic Syndrome and Periodontal Disease Among Civilian Pilots. Aerosp. Med. Hum. Perform. 2016, 87, 1016–1020. [Google Scholar] [CrossRef]
- Feijo, D.; Luiz, R.R.; Camara, V.M. Common Mental Disorders Among Civil Aviation Pilots. Aviat. Space Environ. Med. 2012, 83, 509–513. [Google Scholar] [CrossRef]
- Flynn-Evans, E.E.; Arsintescu, L.; Gregory, K.; Mulligan, J.; Nowinski, J.; Feary, M. Sleep and neurobehavioral performance vary by work start time during non-traditional day shifts. Sleep Health 2018, 4, 476–484. [Google Scholar] [CrossRef]
- Guo, Y.N.; Ji, M.; You, X.Q.; Huang, J. Protective Effects of Emotional Intelligence and Proactive Coping on Civil Pilots’ Mental Health. Aerosp. Med. Hum. Perform. 2017, 88, 858–865. [Google Scholar] [CrossRef]
- Han, S.H.; Lee, G.Y.; Hyun, W.; Kim, Y.; Jang, J.S. Obstructive sleep apnea in airline pilots during daytime sleep following overnight flights. J. Sleep Res. 2021, 30, e13375. [Google Scholar] [CrossRef]
- Houston, S.; Mitchell, S.; Evans, S. Application of a Cardiovascular Disease Risk Prediction Model Among Commercial Pilots. Aviat. Space Environ. Med. 2010, 81, 768–773. [Google Scholar] [CrossRef] [PubMed]
- Huang, H.; Liu, J.; Feng, Y.J.; Chen, W.R. The distribution of apolipoprotein E gene polymorphism in Chinese civil aircrews, and a possible risk factor to their overweight and dyslipidemia is cumulative flight time. Clin. Chim. Acta 2013, 416, 36–40. [Google Scholar] [CrossRef] [PubMed]
- Jackson, C.A.; Earl, L. Prevalence of fatigue among commercial pilots. Occup. Med.-Oxf. 2006, 56, 263–268. [Google Scholar] [CrossRef]
- Lamp, A.; McCullough, D.; Chen, J.M.C.; Brown, R.E.; Belenky, G. Pilot Sleep in Long-Range and Ultra-Long-Range Commercial Flights. Aerosp. Med. Hum. Perform. 2019, 90, 109–115. [Google Scholar] [CrossRef] [PubMed]
- Li, C.; Xu, J.R.; Yin, D.W.; Zhang, Y.H.; Shan, D.Z.; Jiang, X.; Shang, L. Prevalence and trigger factors of functional gastrointestinal disorders among male civil pilots in China. Sci. Rep. 2021, 11, 2021. [Google Scholar] [CrossRef] [PubMed]
- Lindgren, T.; Runeson, R.; Wahlstedt, K.; Wleslander, G.; Dammstrom, B.G.; Norback, D. Digestive Functional Symptoms Among Commercial Pilots in Relation to Diet, Insomnia, and lifestyle Factors. Aviat. Space Environ. Med. 2012, 83, 872–878. [Google Scholar] [CrossRef] [PubMed]
- Liu, T.B.; Qiu, B.; Zhang, C.Y.; Deng, M.Z.; Liang, Z.H.; Qi, Y.M. Health-related quality of life in pilots of a Chinese commercial airline. Arch. Environ. Occup. Health 2021, 76, 511–517. [Google Scholar] [CrossRef]
- Marqueze, E.C.; Nicola, A.C.B.; Diniz, D.; Fischer, F.M. Working hours associated with unintentional sleep at work among airline pilots. Rev. De Saude Publica 2017, 51, 61. [Google Scholar] [CrossRef]
- O’Hagan, A.D.; Issartel, J.; Nevill, A.; Warrington, G. Flying Into Depression: Pilot’s Sleep and Fatigue Experiences Can Explain Differences in Perceived Depression and Anxiety Associated With Duty Hours. Workplace Health Saf. 2017, 65, 109–117. [Google Scholar] [CrossRef]
- Palmeira, M.L.D.; Marqueze, E.C. Excess weight in regular aviation pilots associated with work and sleep characteristics. Sleep Sci. 2016, 9, 266–271. [Google Scholar] [CrossRef]
- Pellegrino, P.; Marqueze, E.C. Aspects of work and sleep associated with work ability in regular aviation pilots. Rev. De Saude Publica 2019, 53, 31. [Google Scholar] [CrossRef] [PubMed]
- Pellegrino, P.; Moreno, C.R.D.; Marqueze, E.C. Aspects of work organization and reduced sleep quality of airline pilots. Sleep Sci. 2019, 12, 43–48. [Google Scholar] [CrossRef] [PubMed]
- Prombumroong, J.; Janwantanakul, P.; Pensri, P. Prevalence of and Biopsychosocial Factors Associated with Low Back Pain in Commercial Airline Pilots. Aviat. Space Environ. Med. 2011, 82, 879–884. [Google Scholar] [CrossRef] [PubMed]
- Qiang, Y.; Li, G.; Rebok, G.W.; Baker, S.P. Body mass index and cardiovascular disease in a birth cohort of commuter air carrier and air taxi pilots. Ann. Epidemiol. 2005, 15, 247–252. [Google Scholar] [CrossRef]
- Reis, C.; Mestre, C.; Canhao, H. Prevalence of Fatigue in a Group of Airline Pilots. Aviat. Space Environ. Med. 2013, 84, 828–833. [Google Scholar] [CrossRef]
- Reis, C.; Mestre, C.; Canhao, H.; Gradwell, D.; Paiva, T. Sleep and Fatigue Differences in the Two Most Common Types of Commercial Flight Operations. Aerosp. Med. Hum. Perform. 2016, 87, 811–815. [Google Scholar] [CrossRef]
- Roach, G.D.; Petrilli, R.M.A.; Dawson, D.; Lamond, N. Impact of Layover Length on Sleep, Subjective Fatigue Levels, and Sustained Attention of Long-Haul Airline Pilots. Chronobiol. Int. 2012, 29, 580–586. [Google Scholar] [CrossRef]
- Runeson-Broberg, R.; Lindgren, T.; Norback, D. Musculoskeletal symptoms and psychosocial work environment, among Swedish commercial pilots. Int. Arch. Occup. Environ. Health 2014, 87, 685–693. [Google Scholar] [CrossRef]
- Sallinen, M.; Sihvola, M.; Puttonen, S.; Ketola, K.; Tuori, A.; Harma, M.; Kecklund, G.; Akerstedt, T. Sleep, alertness and alertness management among commercial airline pilots on short-haul and long-haul flights. Accid. Anal. Prev. 2017, 98, 320–329. [Google Scholar] [CrossRef]
- Sallinen, M.; Pylkkonen, M.; Puttonen, S.; Sihvola, M.; Akerstedt, T. Are long-haul truck drivers unusually alert? A comparison with long-haul airline pilots. Accid. Anal. Prev. 2020, 137, 105442. [Google Scholar] [CrossRef]
- Sallinen, M.; Onninen, J.; Ketola, K.; Puttonen, S.; Tuori, A.; Virkkala, J.; Akerstedt, T. Self-reported reasons for on-duty sleepiness among commercial airline pilots. Chronobiol. Int. 2021, 38, 1308–1318. [Google Scholar] [CrossRef] [PubMed]
- Signal, T.L.; Mulrine, H.M.; van den Berg, M.J.; Smith, A.A.; Gander, P.H.; Serfontein, W. Mitigating and monitoring flight crew fatigue on a westward ultra-long-range flight. Aviat. Space Environ. Med. 2014, 85, 1199–1208. [Google Scholar] [CrossRef]
- Venus, M.; Holtforth, M.G. Short and Long Haul Pilots Rosters, Stress, Sleep Problems, Fatigue, Mental Health, and Well-Being. Aerosp. Med. Hum. Perform. 2021, 92, 786–797. [Google Scholar] [CrossRef] [PubMed]
- Widyahening, I.S. High level of work stressors increase the risk of mental-emotional disturbances among airline pilots. Med. J. Indones. 2007, 16, 117–121. [Google Scholar] [CrossRef][Green Version]
- Wilson, D.; Driller, M.; Johnston, B.; Gill, N. The prevalence and distribution of health risk factors in airline pilots: A cross-sectional comparison with the general population. Aust. N. Z. J. Public Health 2022. [Google Scholar] [CrossRef]
- Wirawan, I.M.A.; Aldington, S.; Griffiths, R.F.; Ellis, C.J.; Larsen, P.D. Cardiovascular Investigations of Airline Pilots with Excessive Cardiovascular Risk. Aviat. Space Environ. Med. 2013, 84, 608–612. [Google Scholar] [CrossRef]
- Wu, A.C.; Donnelly-McLay, D.; Weisskopf, M.G.; McNeely, E.; Betancourt, T.S.; Allen, J.G. Airplane pilot mental health and suicidal thoughts: A cross-sectional descriptive study via anonymous web-based survey. Environ. Health A Glob. Access Sci. Source 2016, 15, 121. [Google Scholar] [CrossRef]
- Wu, L.J.; Gander, P.H.; van den Berg, M.J.; Signal, T.L. Estimating long-haul airline pilots’ at-home baseline sleep duration. Sleep Health 2016, 2, 143–145. [Google Scholar] [CrossRef]
- van Drongelen, A.; Boot, C.R.L.; Hlobil, H.; Twisk, J.W.R.; Smid, T.; van der Beek, A.J. Evaluation of an mHealth intervention aiming to improve health-related behavior and sleep and reduce fatigue among airline pilots. Scand. J. Work Environ. Health 2014, 40, 557–568. [Google Scholar] [CrossRef]
- van Drongelen, A.; Boot, C.R.L.; Hlobil, H.; Smid, T.; van der Beek, A.J. Risk factors for fatigue among airline pilots. Int. Arch. Occup. Environ. Health 2017, 90, 39–47. [Google Scholar] [CrossRef]
- Wilson, D.; Driller, M.; Ben, J.; Gill, N. The effectiveness of a 17-week lifestyle intervention on health behaviors among airline pilots during COVID-19. J. Sport Health Sci. 2021, 10, 333–340. [Google Scholar] [CrossRef] [PubMed]
- GBD 2015 Obesity Collaborators. Health Effects of Overweight and Obesity in 195 Countries over 25 Years. N. Engl. J. Med. 2017, 377, 13–27. [Google Scholar] [CrossRef] [PubMed]
- De Stavola, B.L.; Pizzi, C.; Clemens, F.; Evans, S.A.; Evans, A.D.; Silva, I.D. Cause-specific mortality in professional flight crew and air traffic control officers: Findings from two UK population-based cohorts of over 20,000 subjects. Int. Arch. Occup. Environ. Health 2012, 85, 283–293. [Google Scholar] [CrossRef] [PubMed]
- Pizzi, C.; Evans, S.A.; De Stavola, B.L.; Evans, A.; Clemens, F.; Silva, I.D. Lifestyle of UK commercial aircrews relative to air traffic controllers and the general population. Aviat. Space Environ. Med. 2008, 79, 964–974. [Google Scholar] [CrossRef]
- Janssen, I.; Katzmarzyk, P.T.; Ross, R. Body mass index, waist circumference, and health risk: Evidence in support of current National Institutes of Health guidelines. Arch. Intern. Med. 2002, 162, 2074–2079. [Google Scholar] [CrossRef] [PubMed]
- Mills, K.T.; Bundy, J.D.; Kelly, T.N.; Reed, J.E.; Kearney, P.M.; Reynolds, K.; Chen, J.; He, J. Global Disparities of Hypertension Prevalence and Control. Circulation 2016, 134, 441–450. [Google Scholar] [CrossRef]
- Kopin, L.; Lowenstein, C.J. Dyslipidemia. Ann. Intern. Med. 2017, 167, ITC81–ITC96. [Google Scholar] [CrossRef]
- Cho, N.H.; Shaw, J.E.; Karuranga, S.; Huang, Y.; da Rocha Fernandes, J.D.; Ohlrogge, A.W.; Malanda, B. IDF Diabetes Atlas: Global estimates of diabetes prevalence for 2017 and projections for 2045. Diabetes Res. Clin. Pract. 2018, 138, 271–281. [Google Scholar] [CrossRef]
- Russell-Jones, D.L.; Hutchison, E.J.; Roberts, G.A. Pilots flying with insulin-treated diabetes. Diabetes Obes. Metab. 2021, 23, 1439–1444. [Google Scholar] [CrossRef]
- Wingelaar-Jagt, Y.Q.; Wingelaar, T.T.; Riedel, W.J.; Ramaekers, J.G. Fatigue in Aviation: Safety Risks, Preventive Strategies and Pharmacological Interventions. Front. Physiol. 2021, 12, 712628. [Google Scholar] [CrossRef]
- Hirshkowitz, M.; Whiton, K.; Albert, S.M.; Alessi, C.; Bruni, O.; DonCarlos, L.; Hazen, N.; Herman, J.; Adams Hillard, P.J.; Katz, E.S.; et al. National Sleep Foundation’s updated sleep duration recommendations: Final report. Sleep Health 2015, 1, 233–243. [Google Scholar] [CrossRef] [PubMed]
- Ford, E.S.; Cunningham, T.J.; Croft, J.B. Trends in Self-Reported Sleep Duration among US Adults from 1985 to 2012. Sleep 2015, 38, 829–832. [Google Scholar] [CrossRef] [PubMed]
- Petrie, K.J.; Powell, D.; Broadbent, E. Fatigue self-management strategies and reported fatigue in international pilots. Ergonomics 2004, 47, 461–468. [Google Scholar] [CrossRef] [PubMed]
- Reitsma, M.B.; Fullman, N.; Ng, M.; Salama, J.S.; Abajobir, A.; Abate, K.H.; Abbafati, C.; Abera, S.F.; Abraham, B.; Abyu, G.Y.; et al. Smoking prevalence and attributable disease burden in 195 countries and territories, 1990–2015: A systematic analysis from the Global Burden of Disease Study 2015. Lancet 2017, 389, 1885–1906. [Google Scholar] [CrossRef]
- Guthold, R.; Stevens, G.A.; Riley, L.M.; Bull, F.C. Worldwide trends in insufficient physical activity from 2001 to 2016: A pooled analysis of 358 population-based surveys with 1·9 million participants. Lancet Glob. Health 2018, 6, e1077–e1086. [Google Scholar] [CrossRef]
- Manthey, J.; Shield, K.D.; Rylett, M.; Hasan, O.S.M.; Probst, C.; Rehm, J. Global alcohol exposure between 1990 and 2017 and forecasts until 2030: A modelling study. Lancet 2019, 393, 2493–2502. [Google Scholar] [CrossRef]
- Kraus, C.K.; Li, G. Pilot alcohol violations reported in U.S. newspapers, 1990-2006. Aviat. Space Environ. Med. 2006, 77, 1288–1290. [Google Scholar]
- Aune, D.; Giovannucci, E.; Boffetta, P.; Fadnes, L.T.; Keum, N.; Norat, T.; Greenwood, D.C.; Riboli, E.; Vatten, L.J.; Tonstad, S. Fruit and vegetable intake and the risk of cardiovascular disease, total cancer and all-cause mortality—A systematic review and dose-response meta-analysis of prospective studies. Int. J. Epidemiol. 2017, 46, 1029–1056. [Google Scholar] [CrossRef]
- Murphy, M.M.; Barraj, L.M.; Spungen, J.H.; Herman, D.R.; Randolph, R.K. Global assessment of select phytonutrient intakes by level of fruit and vegetable consumption. Br. J. Nutr. 2014, 112, 1004–1018. [Google Scholar] [CrossRef]


| 1. Airline Pilots | 2. Cardiometabolic Risk Markers | 3. MeSH |
|---|---|---|
| Pilots OR “airline pilot *” OR “commercial pilot *” OR “professional pilot *” OR “civil pilot *” OR “civilian pilot *” OR “aviation pilot *” OR “commercial airline *” OR aircrew OR “cockpit crew *” NOT military * NOT army NOT “pilot study” NOT piloted NOT “pilot project” NOT “pilot research” | “Health risk *” OR “risk factor *” OR cardiometabolic OR cardio-metabolic OR cardiovascular OR “cardiometabolic risk” OR “metabolic syndrome” OR “syndrome x” OR diabetes OR hypertension OR weight OR overweight OR obesity OR “body composition” OR adiposity OR “physical activity” OR exercise OR sleep OR circadian OR apnoea OR apnea OR nutrition OR diet OR eating OR fruit * OR vegetable * OR stress OR lipids OR cholesterol OR glucose OR insulin OR “insulin resistance” OR “insulin sensitivity” OR “waist circumference” OR fat OR “blood pressure” OR hypertension OR “C-reactive protein” OR “inflammatory markers” OR inflammation OR “microvascular dysfunction” OR fatigue OR medical OR depression OR stress OR distress OR anxiety OR alcohol OR smok * OR microalbumin * OR “endothelial dysfunction” | MeSH terms: “risk factors” [mesh] OR “health risk behaviors” [mesh] OR “health status indicators” [mesh] OR “risk assessment” [mesh] |
| Author (Year) | External Validity | Internal Validity | |||||||||
|---|---|---|---|---|---|---|---|---|---|---|---|
| 1 | 2 | 3 | 4 | 5 | 6 | 7 | 8 | 9 | 10 | Quality | |
| Åkerstedt et al. (2021) [17] | N | N | N | Y | Y | Y | Y | Y | Y | Y | (3) High |
| Albermann et al. (2020) [18] | Y | Y | N | Y | Y | Y | N | Y | Y | Y | (2) High |
| Alhejaili et al. (2021) [19] | N | N | N | N | Y | Y | Y | Y | Y | Y | (4) Med |
| Aljurf et al. (2018) [20] | Y | N | N | N | Y | Y | Y | Y | Y | Y | (3) High |
| Alonso-Rodríguez and Medina-Font (2012) [21] | Y | Y | N | Y | Y | Y | Y | N | Y | Y | (2) High |
| Ariani et al. (2017) [22] | N | N | N | N | N | Y | N | Y | Y | Y | (6) Med |
| Bhat et al. (2019) [23] | Y | Y | N | N | Y | Y | Y | Y | Y | Y | (2) High |
| Bostock and Steptoe (2012) [24] | Y | N | N | N | Y | Y | N | Y | Y | Y | (4) Med |
| Cahill et al. (2021) [25] | N | N | N | N | Y | Y | Y | Y | N | Y | (5) Med |
| Chairina et al. (2018) [26] | N | N | N | N | Y | N | N | N | Y | Y | (7) Low |
| Chen et al. (2016) [27] | Y | N | N | N | Y | Y | Y | Y | N | Y | (4) Med |
| Feijó et al. (2012) [28] | Y | Y | N | N | Y | Y | Y | Y | Y | Y | (2) High |
| Flynn-Evans et al. (2018) [29] | N | N | N | Y | Y | Y | N | Y | Y | Y | (4) Med |
| Guo et al. (2017) [30] | Y | N | N | N | Y | Y | Y | Y | N | Y | (4) Med |
| Han et al. (2020) [31] | N | N | N | N | Y | Y | Y | Y | N | Y | (5) Med |
| Houston et al. (2010) [32] | Y | Y | Y | Y | Y | Y | Y | Y | Y | N | (1) High |
| Huang et al. (2012) [33] | N | Y | N | Y | Y | Y | N | N | N | Y | (5) Med |
| Jackson and Earl (2006) [34] | N | N | N | N | Y | Y | N | Y | N | Y | (6) Med |
| Lamp et al. (2019) [35] | N | N | N | N | Y | Y | Y | Y | N | Y | (5) Med |
| Li et al. (2021) [36] | N | N | N | N | Y | Y | Y | Y | Y | Y | (4) Med |
| Lindgren et al. (2012) [37] | Y | Y | N | N | Y | Y | N | Y | N | Y | (4) Med |
| Liu et al. (2021) [38] | N | Y | N | Y | Y | Y | N | Y | N | Y | (4) Med |
| Marqueze et al. (2017) [39] | Y | Y | N | N | Y | Y | Y | Y | Y | Y | (2) High |
| O’Hagen et al. (2016) [40] | Y | N | N | N | Y | Y | N | Y | Y | Y | (4) Med |
| Palmeira et al. (2016) [41] | Y | Y | Y | N | Y | Y | N | Y | Y | Y | (2) High |
| Pellegrino and Marqueze (2018) [42] | N | N | N | N | Y | Y | Y | Y | Y | Y | (4) Med |
| Pellegrino et al. (2018) [43] | N | N | N | N | Y | Y | Y | Y | Y | Y | (4) Med |
| Prombumroong et al. (2011) [44] | N | N | N | N | Y | Y | Y | Y | Y | Y | (4) Med |
| Qiang et al. (2004) [45] | N | Y | N | Y | Y | Y | Y | Y | Y | Y | (2) High |
| Reis et al. (2013) [46]; Reis et al. (2016) [47] | Y | N | N | N | Y | Y | N | Y | Y | Y | (4) Med |
| Roach et al. (2012) [48] | N | N | N | N | Y | Y | Y | Y | N | Y | (5) Med |
| Runeson-Broberg and Lindgren (2013) [49] | Y | Y | N | N | Y | Y | N | Y | N | Y | (4) Med |
| Sallinen et al. (2017) [50] | Y | N | Y | Y | Y | N | Y | N | N | N | (5) Med |
| Sallinen et al. (2020) [51] | Y | N | N | Y | Y | N | Y | N | Y | N | (5) Med |
| Sallinen et al. (2021) [52] | N | N | N | N | Y | Y | N | Y | Y | Y | (5) Med |
| Signal et al. (2014) [53] | N | N | N | N | Y | Y | Y | Y | Y | Y | (4) Med |
| Sykes et al. (2012) [6] | Y | Y | N | N | Y | Y | N | Y | Y | Y | (3) High |
| Venus and Holtforth (2021) [54] | N | N | N | N | Y | Y | Y | Y | Y | Y | (4) Med |
| Widyahening (2007) [55] | N | N | N | N | Y | N | N | Y | N | Y | (7) Low |
| Wilson et al. (2022) [56] | Y | Y | Y | N | Y | Y | Y | Y | Y | Y | (1) High |
| Wirawan et al. (2013) [57] | Y | Y | N | N | Y | Y | N | N | N | Y | (5) Med |
| Wu et al. (2016a) [58] | N | N | N | N | Y | Y | Y | Y | Y | Y | (4) Med |
| Wu et al. (2016b) [59] | Y | N | N | N | Y | Y | Y | Y | Y | Y | (3) High |
| Author (Year) | 1 | 2 | 3 | 4 | 5 | 6 | 7 |
|---|---|---|---|---|---|---|---|
| Choi and Kim 2013 [3] | High | High | High | High | Unclear | Low | Low |
| Van Drongelen et al. 2014 [60]; Van Drongelen et al. 2016 [61] | Low | High | High | High | Low | Low | High |
| Wilson et al. 2021 [62] | High | High | High | Low | Low | Low | Low |
Publisher’s Note: MDPI stays neutral with regard to jurisdictional claims in published maps and institutional affiliations. |
© 2022 by the authors. Licensee MDPI, Basel, Switzerland. This article is an open access article distributed under the terms and conditions of the Creative Commons Attribution (CC BY) license (https://creativecommons.org/licenses/by/4.0/).
Share and Cite
Wilson, D.; Driller, M.; Johnston, B.; Gill, N. The Prevalence of Cardiometabolic Health Risk Factors among Airline Pilots: A Systematic Review. Int. J. Environ. Res. Public Health 2022, 19, 4848. https://doi.org/10.3390/ijerph19084848
Wilson D, Driller M, Johnston B, Gill N. The Prevalence of Cardiometabolic Health Risk Factors among Airline Pilots: A Systematic Review. International Journal of Environmental Research and Public Health. 2022; 19(8):4848. https://doi.org/10.3390/ijerph19084848
Chicago/Turabian StyleWilson, Daniel, Matthew Driller, Ben Johnston, and Nicholas Gill. 2022. "The Prevalence of Cardiometabolic Health Risk Factors among Airline Pilots: A Systematic Review" International Journal of Environmental Research and Public Health 19, no. 8: 4848. https://doi.org/10.3390/ijerph19084848
APA StyleWilson, D., Driller, M., Johnston, B., & Gill, N. (2022). The Prevalence of Cardiometabolic Health Risk Factors among Airline Pilots: A Systematic Review. International Journal of Environmental Research and Public Health, 19(8), 4848. https://doi.org/10.3390/ijerph19084848