
Did Children in Single-Parent Households Have a Higher Probability of Emotional Instability during the COVID-19 Pandemic? A Nationwide Cross-Sectional Study in Japan


Abstract
:1. Introduction
2. Materials and Methods
2.1. Study Design
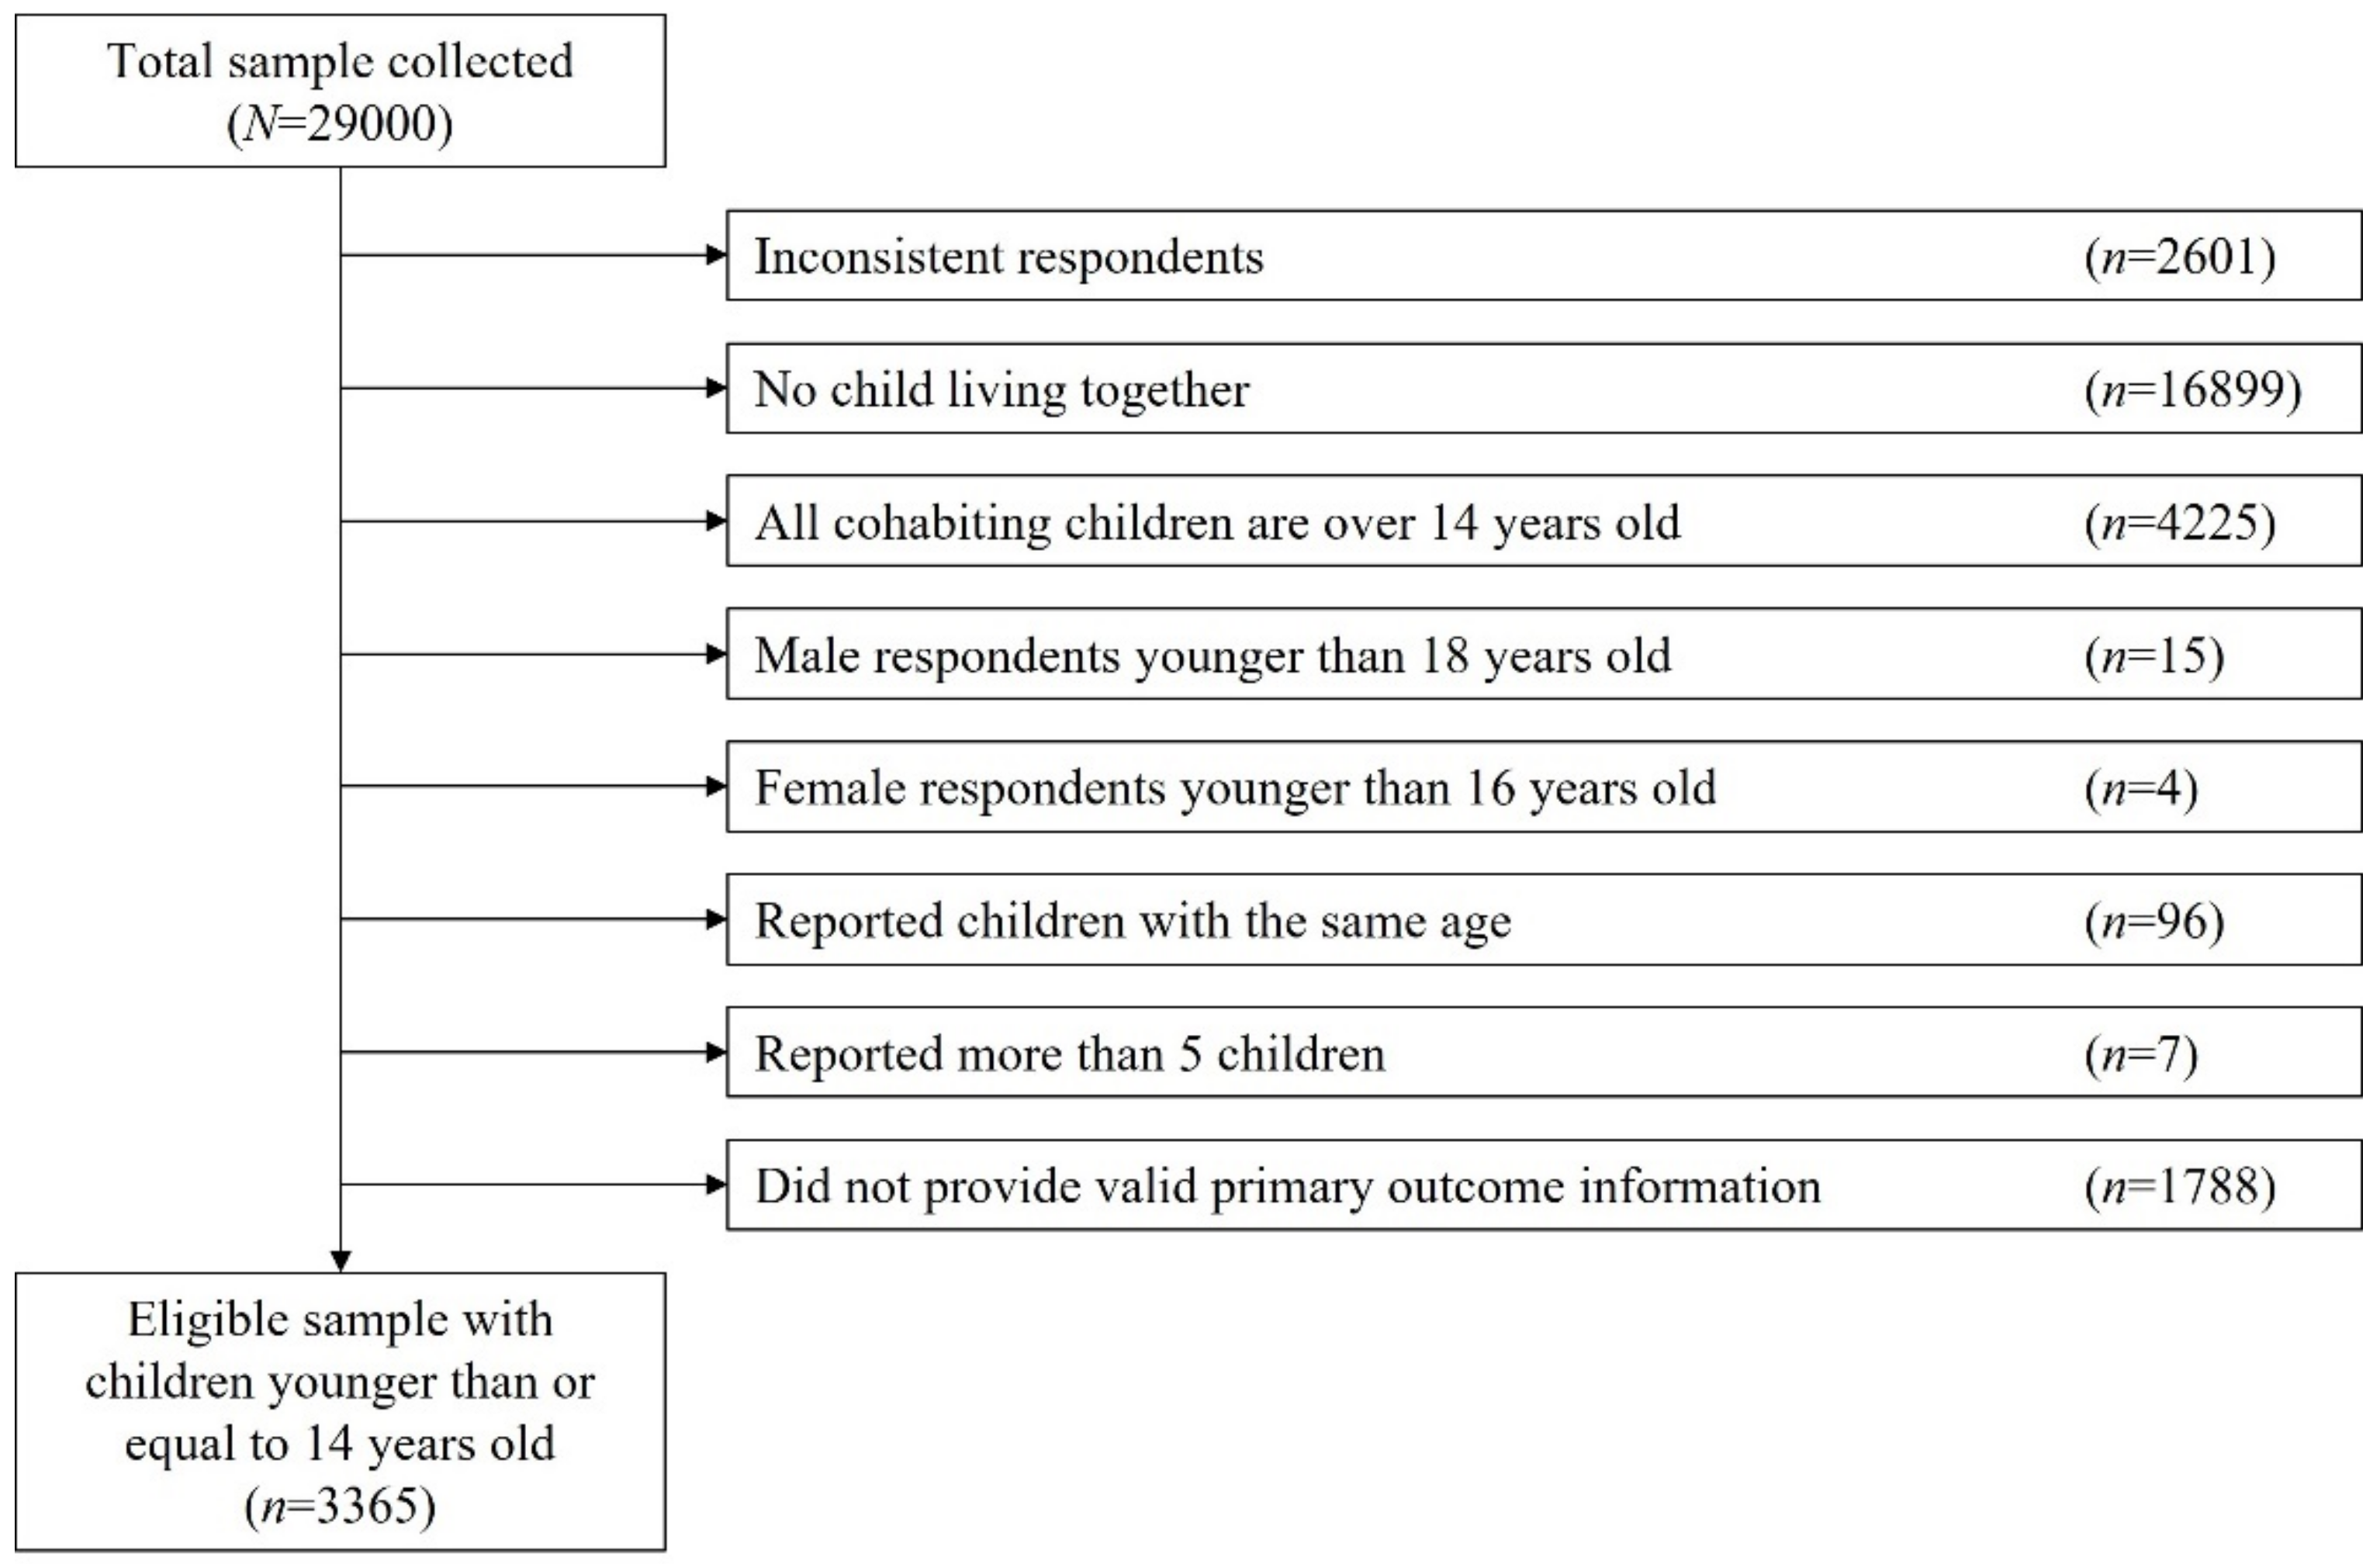
2.2. Study Population
2.3. Outcome (Emotional Instability)
2.4. Exposure (Single-Parent)
2.5. Covariates
2.6. Statistical Analysis
3. Results
3.1. Characteristics
3.2. Children’s Emotional Instability
3.3. Stratifying by Environment and Daily Activities
4. Discussion
5. Conclusions
Author Contributions
Funding
Institutional Review Board Statement
Informed Consent Statement
Data Availability Statement
Acknowledgments
Conflicts of Interest
Appendix A

| Daily Activities, % | Two-Parent | Single-Parent | p-Value 1 | |
|---|---|---|---|---|
| Total | Sleep ≥ 8 h | 81.9 | 79.7 | 0.32 |
| Study ≥ 1 h | 49.5 | 50.9 | <0.01 | |
| Physical activity ≥ 30 min | 53.5 | 40.0 | <0.01 | |
| Reading ≥ 30 min | 39.3 | 33.3 | <0.01 | |
| Watching TV/online entertainment ≥ 2 h | 44.4 | 50.8 | <0.01 | |
| Gaming ≥ 1 h | 43.0 | 53.1 | <0.01 | |
| 0–5 years old | Sleep ≥ 8 h | 88.7 | 83.5 | 0.14 |
| Study ≥ 1 h | 7.4 | 5.0 | 0.07 | |
| Physical activity ≥ 30 min | 67.0 | 54.0 | <0.01 | |
| Reading ≥ 30 min | 35.4 | 24.5 | 0.04 | |
| Watching TV/online entertainment ≥ 2 h | 37.2 | 30.2 | 0.22 | |
| Gaming ≥ 1 h | 9.6 | 14.4 | 0.13 | |
| 6–9 years old | Sleep ≥ 8 h | 87.8 | 89.2 | 0.30 |
| Study ≥ 1 h | 59.0 | 54.9 | 0.54 | |
| Physical activity ≥ 30 min | 56.1 | 42.1 | <0.01 | |
| Reading ≥ 30 min | 40.4 | 34.4 | 0.27 | |
| Watching TV/online entertainment ≥ 2 h | 40.9 | 44.6 | 0.55 | |
| Gaming ≥ 1 h | 46.2 | 49.7 | 0.62 | |
| 10–12 years old | Sleep ≥ 8 h | 80.0 | 79.9 | 0.23 |
| Study ≥ 1 h | 75.3 | 67.0 | <0.01 | |
| Physical activity ≥ 30 min | 44.8 | 36.9 | 0.01 | |
| Reading ≥ 30 min | 45.2 | 38.4 | 0.04 | |
| Watching TV/online entertainment ≥ 2 h | 50.0 | 57.0 | 0.07 | |
| Gaming ≥ 1 h | 66.8 | 69.9 | 0.47 | |
| 13–14 years old | Sleep ≥ 8 h | 52.7 | 63.1 | 0.07 |
| Study ≥ 1 h | 72.0 | 58.4 | 0.01 | |
| Physical activity ≥ 30 min | 33.0 | 30.2 | 0.83 | |
| Reading ≥ 30 min | 30.5 | 30.9 | 0.98 | |
| Watching TV/online entertainment ≥ 2 h | 58.4 | 66.4 | 0.14 | |
| Gaming ≥ 1 h | 62.7 | 62.4 | 1.00 |
| Respondents’ Gender | ||||
|---|---|---|---|---|
| Male | Female | Total | ||
| (n = 1322) | (n = 1281) | (n = 2603) | p | |
| Age, mean (SD) | 42 (7.5) | 39.4 (7) | 40.7 (7.4) | <0.01 3 |
| Educational attainment, % | <0.01 4 | |||
| High school or lower | 16.0 | 23.1 | 19.5 | |
| College or higher | 83.8 | 76.8 | 80.4 | |
| Household income level, % 1 | <0.01 4 | |||
| Higher | 28.1 | 18.4 | 23.3 | |
| Intermediate | 47.8 | 39.8 | 43.9 | |
| Lower | 17.5 | 26.5 | 21.9 | |
| Not answered | 6.7 | 15.2 | 10.9 | |
| Number of children, mean (SD) | 1.88 (0.74) | 1.82 (0.76) | 1.85 (0.75) | 0.02 3 |
| Number of family member, % 2 | 0.04 4 | |||
| ≤3 persons | 30.1 | 34.7 | 32.3 | |
| 4 persons | 48.7 | 45.1 | 46.9 | |
| ≥5 persons | 21.2 | 20.2 | 20.7 | |
| Employment status, % | <0.01 4 | |||
| Employer | 6.3 | 0.9 | 3.6 | |
| Self-employed | 5.4 | 2.0 | 3.8 | |
| Regular employee | 84.9 | 22.8 | 54.4 | |
| Non-regular employee | 2.1 | 32.6 | 17.1 | |
| Unemployed | 1.2 | 41.6 | 21.1 | |
| Living with a grandparent, % | 8.7 | 6.7 | 7.7 | 0.06 4 |
| Total Number | Prevalence | Crude PR (95%CI) | Adjusted PR (95%CI) 1 | p-Interaction 2 | ||||
|---|---|---|---|---|---|---|---|---|
| Violence towards others | ||||||||
| Children’s age | ||||||||
| 0–5 years old | Reference | |||||||
| Two-parent | 1557 | 4.7% | Reference | Reference | ||||
| Single-parent | 271 | 6.3% | 1.37 (0.83–2.25) | 1.43 (0.79–2.60) | ||||
| 6–9 years old | 0.37 | |||||||
| Two-parent | 1028 | 6.9% | Reference | Reference | ||||
| Single-parent | 275 | 6.5% | 0.99 (0.61–1.62) | 0.99 (0.59–1.68) | ||||
| 10–12 years old | 0.71 | |||||||
| Two-parent | 1054 | 4.7% | Reference | Reference | ||||
| Single-parent | 382 | 5.8% | 1.21 (0.75–1.97) | 1.01 (0.60–1.70) | ||||
| 13–14 years old | 0.32 | |||||||
| Two-parent | 377 | 3.4% | Reference | Reference | ||||
| Single-parent | 213 | 2.8% | 0.83 (0.32–2.15) | 0.88 (0.36–2.18) | ||||
| Abusive language towards others | ||||||||
| Children’s age | ||||||||
| 0–5 years old | Reference | |||||||
| Two-parent | 1557 | 5.8% | Reference | Reference | ||||
| Single-parent | 271 | 8.5% | 1.50 (0.98–2.28) | 1.29 (0.80–2.09) | ||||
| 6–9 years old | 0.29 | |||||||
| Two-parent | 1028 | 14.8% | Reference | Reference | ||||
| Single-parent | 275 | 16.0% | 1.12 (0.83–1.51) | 0.99 (0.71–1.37) | ||||
| 10–12 years old | 0.70 | |||||||
| Two-parent | 1054 | 14.6% | Reference | Reference | ||||
| Single-parent | 382 | 19.6% | 1.35 (1.06–1.71) | 1.21 (0.93–1.57) | ||||
| 13–14 years old | 0.82 | |||||||
| Two-parent | 377 | 10.1% | Reference | Reference | ||||
| Single-parent | 213 | 13.6% | 1.38 (0.89–2.15) | 1.45 (0.92–2.29) | ||||
| Demotivation to study | ||||||||
| Children’s age | ||||||||
| 0–5 years old | Reference | |||||||
| Two-parent | 1557 | 2.8% | Reference | Reference | ||||
| Single-parent | 271 | 2.6% | 0.96 (0.44–2.07) | 0.85 (0.39–1.85) | ||||
| 6–9 years old | 0.76 | |||||||
| Two-parent | 1028 | 25.8% | Reference | Reference | ||||
| Single-parent | 275 | 27.6% | 1.08 (0.88–1.32) | 1.02 (0.82–1.27) | ||||
| 10–12 years old | 0.51 | |||||||
| Two-parent | 1054 | 33.5% | Reference | Reference | ||||
| Single-parent | 382 | 42.1% | 1.25 (1.09–1.42) | 1.25 (1.08–1.44) | ||||
| 13–14 years old | 0.47 | |||||||
| Two-parent | 377 | 34.0% | Reference | Reference | ||||
| Single-parent | 213 | 42.3% | 1.26 (1.05–1.52) | 1.34 (1.10–1.62) | ||||
| Absenteeism | ||||||||
| Children’s age | ||||||||
| 0–5 years old | Reference | |||||||
| Two-parent | 1557 | 1.3% | Reference | Reference | ||||
| Single-parent | 271 | 2.2% | 1.66 (0.68–4.04) | 1.28 (0.56–2.91) | ||||
| 6–9 years old | 0.71 | |||||||
| Two-parent | 1028 | 3.7% | Reference | Reference | ||||
| Single-parent | 275 | 4.7% | 1.33 (0.73–2.46) | 1.20 (0.60–2.41) | ||||
| 10–12 years old | 0.94 | |||||||
| Two-parent | 1054 | 3.6% | Reference | Reference | ||||
| Single-parent | 382 | 6.0% | 1.66 (1.00–2.73) | 1.51 (0.79–2.91) | ||||
| 13–14 years old | 0.23 | |||||||
| Two-parent | 377 | 2.9% | Reference | Reference | ||||
| Single-parent | 213 | 9.4% | 3.20 (1.57–6.50) | 3.12 (1.44–6.78) | ||||
References
- World Health Organization. WHO Coronavirus Disease (COVID-19) Dashboard. Available online: https://covid19.who.int/ (accessed on 4 March 2021).
- Johanna, N.; Citrawijaya, H.; Wangge, G. Mass screening vs lockdown vs combination of both to control COVID-19: A systematic review. J. Public Health Res. 2020, 9, 2011. [Google Scholar] [CrossRef] [PubMed]
- UNESCO. COVID-19 Impact on Education. Available online: https://en.unesco.org/covid19/educationresponse (accessed on 4 March 2021).
- Cabinet Office. Prime Minister Abe’s Press Conference on 29 February 2020. Available online: https://www.kantei.go.jp/jp/98_abe/statement/2020/0229kaiken.html (accessed on 21 March 2022).
- Liu, Y.; Morgenstern, C.; Kelly, J.; Lowe, R.; Jit, M. The impact of non-pharmaceutical interventions on SARS-CoV-2 transmission across 130 countries and territories. BMC Med. 2021, 19, 40. [Google Scholar] [CrossRef] [PubMed]
- Takaku, R.; Yokoyama, I. What the COVID-19 school closure left in its wake: Evidence from a regression discontinuity analysis in Japan. J. Public Econ. 2021, 195, 104364. [Google Scholar] [CrossRef] [PubMed]
- Ministry of Education Culture Sports Science and Technology. School and Community Activities after the Declaration of the Emergency State. 2020. Available online: https://www.mext.go.jp/content/20200409-mxt_kouhou01-000004520_1.pdf (accessed on 21 March 2022).
- Ministry of Education Culture Sports Science and Technology. The Guideline for School Closure Implementation in Response to the SARS-CoV2 Pandemic (Revision as of 7 April 2020). 2020. Available online: https://www.mext.go.jp/content/20200408-mxt_kouhou01-000006156_2.pdf (accessed on 21 March 2022).
- Hodges, C.; Moore, S.; Lockee, B.; Trust, T.; Bond, A. The Difference between Emergency Remote Teaching and Online Learning. EDUCASE Review. 2020. Available online: https://er.educause.edu/articles/2020/3/the-difference-between-emergency-remote-teaching-and-online-learning (accessed on 21 March 2022).
- Ministry of Education Culture Sports Science and Technology. Educational Measures among Public Schools Related to School Closure for the SARS-CoV2 Pandemic. 2020. Available online: https://www.mext.go.jp/content/20200421-mxt_kouhou01-000006590_1.pdf (accessed on 21 March 2022).
- Kato, T.; Takehara, K.; Suto, M.; Sampei, M.; Urayama, K.Y. Psychological distress and living conditions among Japanese single-mothers with preschool-age children: An analysis of 2016 Comprehensive Survey of Living Conditions. J. Affect. Disord. 2021, 286, 142–148. [Google Scholar] [CrossRef] [PubMed]
- Kachi, Y.; Abe, A.; Ando, E.; Kawada, T. Socioeconomic disparities in psychological distress in a nationally representative sample of Japanese adolescents: A time trend study. Aust. N. Z. J. Psychiatry 2016, 51, 278–286. [Google Scholar] [CrossRef] [PubMed]
- Bouye, K.; Truman, B.I.; Hutchins, S.; Richard, R.; Brown, C.; Guillory, J.A.; Rashid, J. Pandemic Influenza Preparedness and Response among Public-Housing Residents, Single-Parent Families, and Low-Income Populations. Am. J. Public Health 2009, 99, S287–S293. [Google Scholar] [CrossRef] [PubMed]
- Tso, W.W.Y.; Wong, R.S.; Tung, K.T.S.; Rao, N.; Fu, K.W.; Yam, J.C.S.; Chua, G.T.; Chen, E.Y.H.; Lee, T.M.C.; Chan, S.K.W.; et al. Vulnerability and resilience in children during the COVID-19 pandemic. Eur. Child Adolesc. Psychiatry 2020, 31, 161–176. [Google Scholar] [CrossRef] [PubMed]
- Miyawaki, A.; Tabuchi, T.; Tomata, Y.; Tsugawa, Y. Association between participation in the government subsidy programme for domestic travel and symptoms indicative of COVID-19 infection in Japan: Cross-sectional study. BMJ Open 2021, 11, e049069. [Google Scholar] [CrossRef] [PubMed]
- Naimi, A.I.; Whitcomb, B.W. Estimating Risk Ratios and Risk Differences Using Regression. Am. J. Epidemiol. 2020, 189, 508–510. [Google Scholar] [CrossRef] [PubMed]
- Chaabane, S.; Doraiswamy, S.; Chaabna, K.; Mamtani, R.; Cheema, S. The Impact of COVID-19 School Closure on Child and Adolescent Health: A Rapid Systematic Review. Children 2021, 8, 415. [Google Scholar] [CrossRef] [PubMed]
- Meherali, S.; Punjani, N.; Louie-Poon, S.; Abdul Rahim, K.; Das, J.K.; Salam, R.A.; Lassi, Z.S. Mental Health of Children and Adolescents Amidst COVID-19 and Past Pandemics: A Rapid Systematic Review. Int. J. Environ. Res. Public Health 2021, 18, 3432. [Google Scholar] [CrossRef] [PubMed]
- Di Giorgio, E.; Di Riso, D.; Mioni, G.; Cellini, N. The interplay between mothers’ and children behavioral and psychological factors during COVID-19: An Italian study. Eur. Child Adolesc. Psychiatry 2020, 30, 1401–1412. [Google Scholar] [CrossRef] [PubMed]
- Fegert, J.M.; Vitiello, B.; Plener, P.L.; Clemens, V. Challenges and burden of the Coronavirus 2019 (COVID-19) pandemic for child and adolescent mental health: A narrative review to highlight clinical and research needs in the acute phase and the long return to normality. Child Adolesc. Psychiatry Ment. Health 2020, 14, 20. [Google Scholar] [CrossRef] [PubMed]
- Awadalla, S.; Davies, E.B.; Glazebrook, C. A longitudinal cohort study to explore the relationship between depression, anxiety and academic performance among Emirati university students. BMC Psychiatry 2020, 20, 448. [Google Scholar] [CrossRef] [PubMed]
- Velasco, A.A.; Cruz, I.S.S.; Billings, J.; Jimenez, M.; Rowe, S. What are the barriers, facilitators and interventions targeting help-seeking behaviours for common mental health problems in adolescents? A systematic review. BMC Psychiatry 2020, 20, 293. [Google Scholar] [CrossRef]
- World Health Organization. Adolescent Mental Health. 2020. Available online: https://www.who.int/news-room/fact-sheets/detail/adolescent-mental-health (accessed on 4 March 2021).
- Acosta, D.; Fujii, Y.; Joyce-Beaulieu, D.; Jacobs, K.D.; Maurelli, A.T.; Nelson, E.J.; McKune, S.L. Psychosocial Health of K-12 Students Engaged in Emergency Remote Education and In-Person Schooling: A Cross-Sectional Study. Int. J. Environ. Res. Public Health 2021, 18, 8564. [Google Scholar] [CrossRef] [PubMed]
- Ministry of Education Culture Sports Science and Technology. SOS Contacts for Children. Available online: https://www.mext.go.jp/a_menu/shotou/seitoshidou/06112210.htm (accessed on 24 March 2022).
- Childline Support Center Japan. ChildLine for Child in Japan. Available online: https://childline.or.jp/en/ (accessed on 24 March 2022).
- Sharma, M.; Aggarwal, S.; Madaan, P.; Saini, L.; Bhutani, M. Impact of COVID-19 pandemic on sleep in children and adolescents: A systematic review and meta-analysis. Sleep Med. 2021, 84, 259–267. [Google Scholar] [CrossRef] [PubMed]
- Cerniglia, L.; Cimino, S.; Ammaniti, M. What are the effects of screen time on emotion regulation and academic achievements? A three-wave longitudinal study on children from 4 to 8 years of age. J. Early Child. Res. 2021, 19, 145–160. [Google Scholar] [CrossRef]
- Cartanyà-Hueso, À.; Lidón-Moyano, C.; González-Marrón, A.; Martín-Sánchez, J.C.; Amigo, F.; Martínez-Sánchez, J.M. Association between Leisure Screen Time and Emotional and Behavioral Problems in Spanish Children. J. Pediatr. 2021, 241, 188–195.e3. [Google Scholar] [CrossRef] [PubMed]
- Ministry of Health Labor and Welfare. Support Policies for Single Parent Households in 2017. Available online: https://www.mhlw.go.jp/content/11920000/000363014.pdf (accessed on 21 March 2022).
| Family Type | ||||
|---|---|---|---|---|
| Two-Parent | Single-Parent | Total | ||
| (n = 2603) | (n = 762) | (n = 3365) | p | |
| Response from mother, % | 49.2 | 90.0 | 58.5 | <0.01 3 |
| Age, mean (SD) | 40.7 (7.4) | 39.7 (6.7) | 40.5 (7.2) | <0.01 4 |
| Educational attainment, % | <0.01 3 | |||
| High school or lower | 19.5 | 32.0 | 22.3 | |
| College or higher | 80.4 | 67.6 | 77.5 | |
| Household income level, % 1 | <0.01 3 | |||
| Higher | 23.3 | 8.8 | 20.0 | |
| Intermediate | 43.9 | 17.2 | 37.8 | |
| Lower | 21.9 | 60.6 | 30.7 | |
| Not answered | 10.9 | 13.4 | 11.4 | |
| Number of children, mean (SD) | 1.85 (0.75) | 1.57 (0.75) | 1.79 (0.76) | <0.01 4 |
| Number of family member, % 2 | <0.01 3 | |||
| ≤3 persons | 32.3 | 65.4 | 39.8 | |
| 4 persons | 46.9 | 18.0 | 40.4 | |
| ≥5 persons | 20.7 | 16.7 | 19.8 | |
| Employment status, % | <0.01 3 | |||
| Employer | 3.6 | 2.9 | 3.5 | |
| Self-employed | 3.8 | 4.3 | 3.9 | |
| Regular employee | 54.4 | 52.2 | 53.9 | |
| Non-regular employee | 17.1 | 32.8 | 20.7 | |
| Unemployed | 21.1 | 7.7 | 18.1 | |
| Living with a grandparent, % | 7.7 | 32.4 | 13.3 | <0.01 3 |
| Children’s age group, % 5 | <0.01 3 | |||
| 0–5 years old | 30.7 | 18.2 | 27.9 | |
| 6–9 years old | 28.1 | 25.6 | 27.5 | |
| 10–12 years old | 30.5 | 36.6 | 31.9 | |
| 13–14 years old | 10.7 | 19.6 | 12.7 | |
| School/nursery closure, % | 0.07 3 | |||
| Open | 12.3 | 13.5 | 12.6 | |
| Closed | 76.0 | 77.7 | 76.3 | |
| Not answered | 11.7 | 8.8 | 11.1 | |
| Online education | 0.41 3 | |||
| No | 65.8 | 67.5 | 66.2 | |
| Yes | 31.8 | 30.8 | 31.6 | |
| Not answered | 2.4 | 1.7 | 2.3 | |
| Childcare by others, % | <0.01 3 | |||
| No | 20.2 | 27.2 | 21.8 | |
| Yes | 1.8 | 1.6 | 1.8 | |
| Not answered | 7.1 | 5.4 | 6.7 | |
| Extracurricular activity participation | ||||
| cram school, % | 0.56 3 | |||
| No | 17.6 | 17.5 | 17.6 | |
| Yes | 1.6 | 1.0 | 1.5 | |
| Not answered | 6.4 | 4.2 | 5.9 | |
| Sport/hobby lessons, % | 0.37 3 | |||
| No | 81.1 | 83.1 | 81.5 | |
| Yes | 17.9 | 16.3 | 17.6 | |
| Not answered | 1.0 | 0.7 | 0.9 | |
| Daily activities, % | ||||
| Sleep: ≥8 h | 81.9 | 79.7 | 81.4 | 0.32 3 |
| Study: ≥1 h | 49.5 | 50.9 | 49.8 | <0.01 3 |
| Physical activity: ≥30 min | 53.5 | 40.0 | 50.5 | <0.01 3 |
| Reading: ≥30 min | 39.3 | 33.3 | 37.9 | <0.01 3 |
| Watching TV/online entertainment: ≥2 h | 44.4 | 50.8 | 45.9 | <0.01 3 |
| Game: ≥1 h | 43.0 | 53.1 | 45.3 | <0.01 3 |
| Total Number | Prevalence | Crude PR (95%CI) | Adjusted PR (95% CI) 1 | ||
|---|---|---|---|---|---|
| Emotional instability | |||||
| Two-parent | 2603 | 17.8% | Reference | Reference | |
| Single-parent | 762 | 23.1% | 1.30 (1.11–1.51) | 1.26 (1.07–1.49) | |
| Violence towards others | |||||
| Two-parent | 2603 | 6.7% | Reference | Reference | |
| Single-parent | 762 | 7.1% | 1.06 (0.79–1.42) | 1.01 (0.74–1.38) | |
| Abusive language towards others | |||||
| Two-parent | 2603 | 14.3% | Reference | Reference | |
| Single-parent | 762 | 19.0% | 1.35 (1.13–1.60) | 1.23 (1.02–1.49) | |
| Demotivation to study | |||||
| Two-parent | 2603 | 26.2% | Reference | Reference | |
| Single-parent | 762 | 35.8% | 1.35 (1.21–1.51) | 1.37 (1.22–1.55) | |
| Absenteeism | |||||
| Two-parent | 2603 | 3.6% | Reference | Reference | |
| Single-parent | 762 | 6.8% | 1.83 (1.32–2.54) | 1.72 (1.17–2.53) | |
| Children’s Age Group | Total Number | Prevalence of Emotional Instability | Crude PR (95%CI) | Adjusted PR (95% CI) 1 | p-Interaction 2 | |
|---|---|---|---|---|---|---|
| 0–5 years old | Reference | |||||
| Two-parent | 1557 | 6.9% | Reference | Reference | ||
| Single-parent | 271 | 8.5% | 1.22 (0.81–1.85) | 1.13 (0.72–1.77) | ||
| 6–9 years old | 0.49 | |||||
| Two-parent | 1028 | 15.1% | Reference | Reference | ||
| Single-parent | 275 | 15.3% | 1.02 (0.75–1.37) | 0.93 (0.67–1.30) | ||
| 10–12 years old | 0.74 | |||||
| Two-parent | 1054 | 14.3% | Reference | Reference | ||
| Single-parent | 382 | 18.6% | 1.34 (1.04–1.71) | 1.20 (0.91–1.57) | ||
| 13–14 years old | 0.54 | |||||
| Two-parent | 377 | 13.5% | Reference | Reference | ||
| Single-parent | 213 | 18.8% | 1.47 (1.02–2.11) | 1.68 (1.13–2.49) | ||
| Total Number | Prevalence of Emotional Instability | Crude PR (95%CI) | Adjusted PR (95%CI) 1 | p-Interaction 2 | |||
|---|---|---|---|---|---|---|---|
| School/nursery | 0.87 | ||||||
| Open | |||||||
| Two-parent | 391 | 7.7% | Reference | Reference | |||
| Single-parent | 120 | 10.0% | 1.25 (0.66–2.35) | 1.03 (0.51–2.08) | |||
| Closed | |||||||
| Two-parent | 2518 | 15.6% | Reference | Reference | |||
| Single-parent | 781 | 19.5% | 1.29 (1.10–1.52) | 1.24 (1.04–1.48) | |||
| Online education | 0.83 | ||||||
| No | |||||||
| Two-parent | 2844 | 9.3% | Reference | Reference | |||
| Single-parent | 816 | 12.6% | 1.30 (1.06–1.59) | 1.25 (1.00–1.56) | |||
| Yes | |||||||
| Two-parent | 1027 | 18.2% | Reference | Reference | |||
| Single-parent | 295 | 24.4% | 1.36 (1.08–1.71) | 1.31 (1.02–1.69) | |||
| Childcare by others | 0.42 | ||||||
| No | |||||||
| Two-parent | 3194 | 9.9% | Reference | Reference | |||
| Single-parent | 833 | 13.1% | 1.29 (1.06–1.57) | 1.28 (1.04–1.58) | |||
| Yes | |||||||
| Two-parent | 676 | 20.7% | Reference | Reference | |||
| Single-parent | 273 | 23.1% | 1.14 (0.89–1.47) | 1.03 (0.78–1.37) | |||
| Cram school | 0.89 | ||||||
| No | |||||||
| Two-parent | 3303 | 10.6% | Reference | Reference | |||
| Single-parent | 940 | 13.9% | 1.27 (1.06–1.52) | 1.27 (1.04–1.55) | |||
| Yes | |||||||
| Two-parent | 584 | 19.2% | Reference | Reference | |||
| Single-parent | 172 | 25.0% | 1.32 (0.99–1.78) | 1.14 (0.83–1.56) | |||
| Sport/hobby lessons | 0.98 | ||||||
| No | |||||||
| Two-parent | 3338 | 10.4% | Reference | Reference | |||
| Single-parent | 972 | 13.9% | 1.30 (1.09–1.55) | 1.28 (1.05–1.55) | |||
| Yes | |||||||
| Two-parent | 576 | 20.0% | Reference | Reference | |||
| Single-parent | 144 | 27.1% | 1.28 (0.94–1.73) | 1.21 (0.87–1.67) | |||
| Emotional Instability | Total Number | Prevalence of Emotional Instability | Adjusted PR (95%CI) 1 | p-Interaction 2 | ||
|---|---|---|---|---|---|---|
| Sleep | 0.07 | |||||
| <8 h | ||||||
| Two-parent | 422 | 18.2% | Reference | |||
| Single-parent | 137 | 30.7% | 1.66 (1.15–2.40) | |||
| ≥8 h | ||||||
| Two-parent | 2133 | 17.9% | Reference | |||
| Single-parent | 607 | 21.4% | 1.16 (0.96–1.40) | |||
| Study | 0.47 | |||||
| <1 h | ||||||
| Two-parent | 803 | 19.2% | Reference | |||
| Single-parent | 288 | 25.7% | 1.38 (0.98–1.94) | |||
| ≥1 h | ||||||
| Two-parent | 1289 | 19.2% | Reference | |||
| Single-parent | 388 | 23.5% | 1.21 (0.90–1.62) | |||
| Physical activity | 0.80 | |||||
| <30 min | ||||||
| Two-parent | 1101 | 20.0% | Reference | |||
| Single-parent | 430 | 24.4% | 1.31 (0.98–1.74) | |||
| ≥30 min | ||||||
| Two-parent | 1393 | 16.8% | Reference | |||
| Single-parent | 305 | 21.6% | 1.27 (0.91–1.78) | |||
| Reading | 0.53 | |||||
| <30 min | ||||||
| Two-parent | 1486 | 17.7% | Reference | |||
| Single-parent | 482 | 22.2% | 1.36 (1.03–1.78) | |||
| ≥30 min | ||||||
| Two-parent | 1022 | 18.8% | Reference | |||
| Single-parent | 254 | 26.0% | 1.36 (0.96–1.92) | |||
| Watching TV/online entertainment | 0.15 | |||||
| <2 h | ||||||
| Two-parent | 1364 | 15.2% | Reference | |||
| Single-parent | 351 | 16.5% | 1.11 (0.79–1.57) | |||
| ≥2 h | ||||||
| Two-parent | 1156 | 21.4% | Reference | |||
| Single-parent | 387 | 28.9% | 1.43 (1.07–1.89) | |||
| Game | 0.18 | |||||
| <1 h | ||||||
| Two-parent | 1396 | 15.8% | Reference | |||
| Single-parent | 331 | 17.2% | 1.08 (0.77–1.52) | |||
| ≥1 h | ||||||
| Two-parent | 1120 | 20.8% | Reference | |||
| Single-parent | 405 | 27.9% | 1.42 (1.06–1.89) | |||
Publisher’s Note: MDPI stays neutral with regard to jurisdictional claims in published maps and institutional affiliations. |
© 2022 by the authors. Licensee MDPI, Basel, Switzerland. This article is an open access article distributed under the terms and conditions of the Creative Commons Attribution (CC BY) license (https://creativecommons.org/licenses/by/4.0/).
Share and Cite
Naito, T.; Tomata, Y.; Otsuka, T.; Tsuno, K.; Tabuchi, T. Did Children in Single-Parent Households Have a Higher Probability of Emotional Instability during the COVID-19 Pandemic? A Nationwide Cross-Sectional Study in Japan. Int. J. Environ. Res. Public Health 2022, 19, 4239. https://doi.org/10.3390/ijerph19074239
Naito T, Tomata Y, Otsuka T, Tsuno K, Tabuchi T. Did Children in Single-Parent Households Have a Higher Probability of Emotional Instability during the COVID-19 Pandemic? A Nationwide Cross-Sectional Study in Japan. International Journal of Environmental Research and Public Health. 2022; 19(7):4239. https://doi.org/10.3390/ijerph19074239
Chicago/Turabian StyleNaito, Takuto, Yasutake Tomata, Tatsui Otsuka, Kanami Tsuno, and Takahiro Tabuchi. 2022. "Did Children in Single-Parent Households Have a Higher Probability of Emotional Instability during the COVID-19 Pandemic? A Nationwide Cross-Sectional Study in Japan" International Journal of Environmental Research and Public Health 19, no. 7: 4239. https://doi.org/10.3390/ijerph19074239
APA StyleNaito, T., Tomata, Y., Otsuka, T., Tsuno, K., & Tabuchi, T. (2022). Did Children in Single-Parent Households Have a Higher Probability of Emotional Instability during the COVID-19 Pandemic? A Nationwide Cross-Sectional Study in Japan. International Journal of Environmental Research and Public Health, 19(7), 4239. https://doi.org/10.3390/ijerph19074239