
Physical Activity Patterns among Individuals with Prediabetes or Type 2 Diabetes across Two Years—A Longitudinal Latent Class Analysis

 , , ,
, , ,
Abstract
:1. Introduction
2. Materials and Methods
2.1. Physical Activity and Sedentary Behaviour
2.2. Demographic, Anthropometric, Disease and Medication Status
2.3. Data Analysis
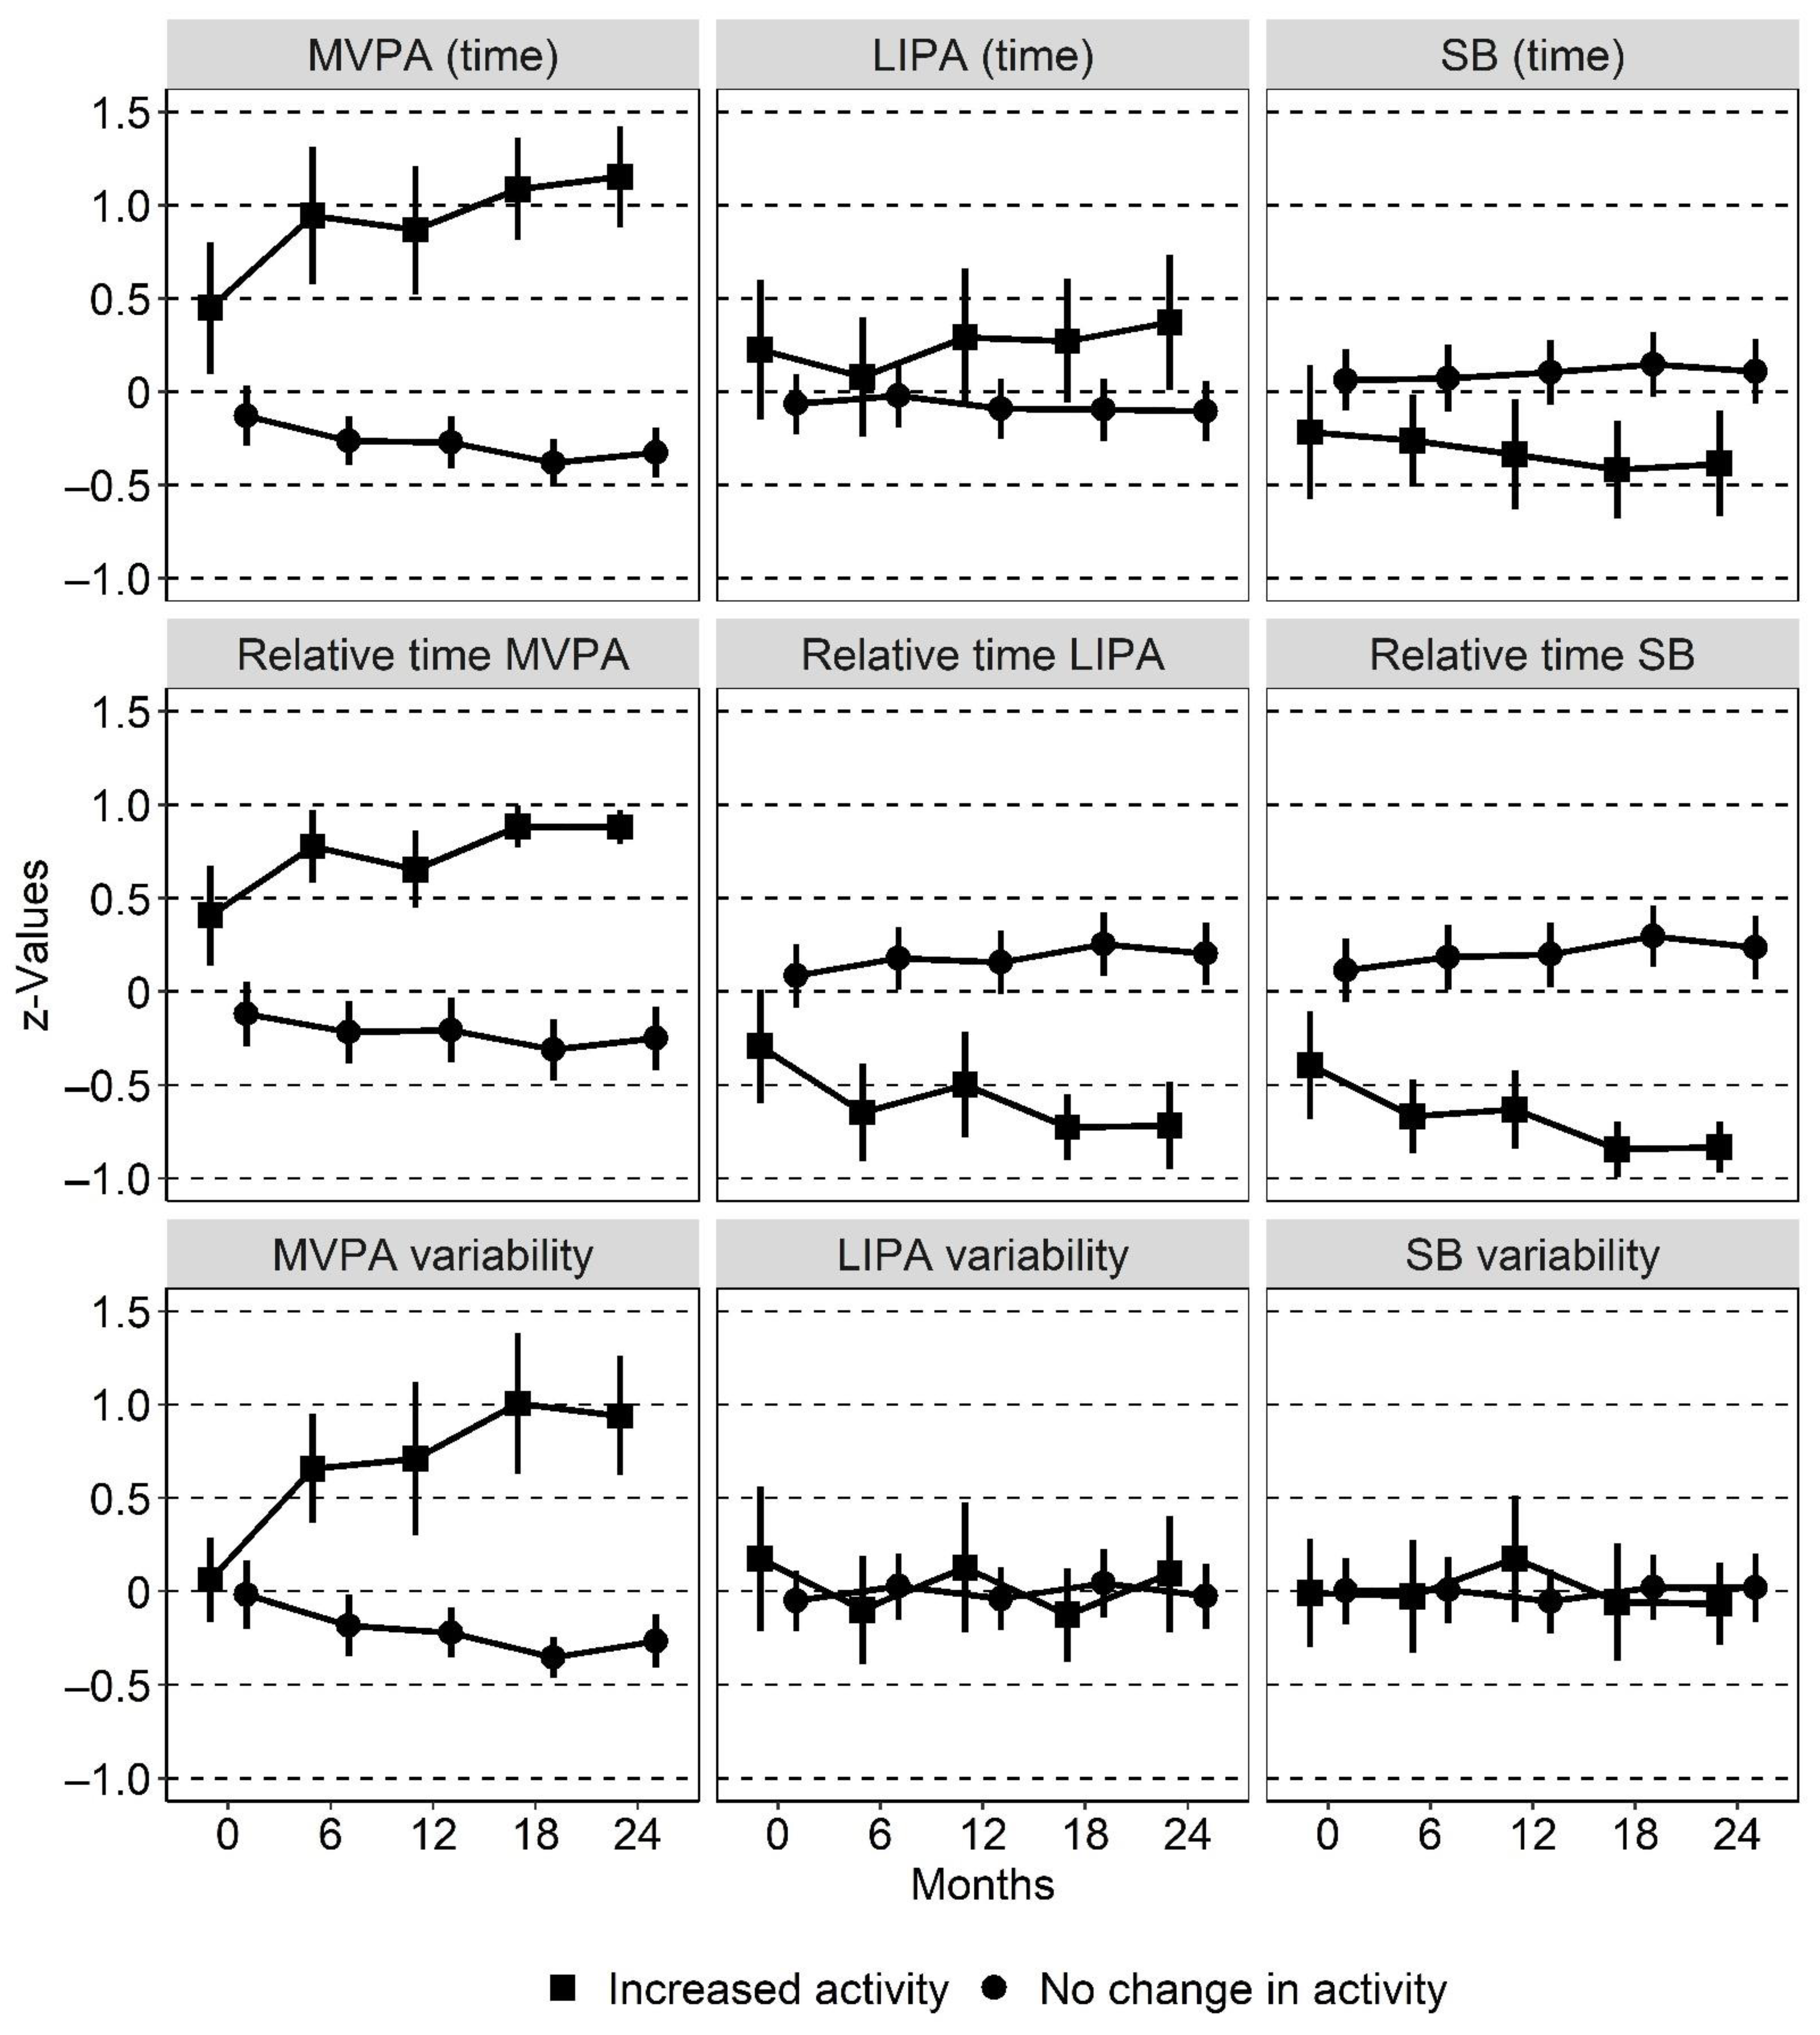
3. Results
4. Discussion
5. Conclusions
Supplementary Materials
Author Contributions
Funding
Institutional Review Board Statement
Informed Consent Statement
Data Availability Statement
Conflicts of Interest
References
- Professional Practice Committee. Standards of Medical Care in Diabetes—2020. Diabetes Care 2019, 43 (Suppl. 1), S1–S2. [Google Scholar] [CrossRef] [Green Version]
- Kanaley, J.A.; Colberg, S.R.; Corcoran, M.H.; Malin, S.K.; Rodriguez, N.R.; Crespo, C.J.; Kirwan, J.P.; Zierath, J.R. Exercise/Physical Activity in Individuals with Type 2 Diabetes: A Consensus Statement from the American College of Sports Medicine. Med. Sci. Sports 2022, 54, 353–368. [Google Scholar] [CrossRef] [PubMed]
- Liubaoerjijin, Y.; Terada, T.; Fletcher, K.; Boulé, N.G. Effect of aerobic exercise intensity on glycemic control in type 2 diabetes: A meta-analysis of head-to-head randomized trials. Acta Diabetol. 2016, 53, 769–781. [Google Scholar] [CrossRef] [PubMed]
- Pan, B.; Ge, L.; Xun, Y.Q.; Chen, Y.J.; Gao, C.Y.; Han, X.; Zuo, L.Q.; Shan, H.Q.; Yang, K.H.; Ding, G.W.; et al. Exercise training modalities in patients with type 2 diabetes mellitus: A systematic review and network meta-analysis. Int. J. Behav. Nutr. Phys. Act. 2018, 25, 72. [Google Scholar] [CrossRef] [PubMed]
- Palakodeti, S.; Uratsu, C.S.; Schmittdiel, J.A.; Grant, R.W. Changes in physical activity among adults with diabetes: A longitudinal cohort study of inactive patients with Type 2 diabetes who become physically active. Diabet. Med. 2015, 32, 1051–1057. [Google Scholar] [CrossRef] [PubMed]
- Lounassalo, I.; Salin, K.; Kankaanpää, A.; Hirvensalo, M.; Palomäki, S.; Tolvanen, A.; Yang, X.; Tammelin, T.H. Distinct trajectories of physical activity and related factors during the life course in the general population: A systematic review. BMC Public Health 2019, 19, 271. [Google Scholar] [CrossRef] [PubMed] [Green Version]
- Mooney, S.J.; Joshi, S.; Cerdá, M.; Kennedy, G.J.; Beard, J.R.; Rundle, A.G. Longitudinal Patterns of Physical Activity Among Older Adults: A Latent Transition Analysis. Am. J. Epidemiol. 2018, 187, 1549–1558. [Google Scholar] [CrossRef] [PubMed] [Green Version]
- Wilson, A.L.; Nguyen, C.; Bogomolova, S.; Sharp, B.; Olds, T. Analysing how physical activity competes: A cross-disciplinary application of the Duplication of Behaviour Law. Int. J. Behav. Nutr. Phys. Act. 2019, 16, 123. [Google Scholar] [CrossRef] [PubMed] [Green Version]
- Shaima, A.; Abdalghani, Y.; Jason, R.; Patricia, M.K. Effectiveness of Interventions for Promoting Objectively Measured Physical Activity of Adults with Type 2 Diabetes: A Systematic Review. J. Phys. Act. Health 2017, 14, 408–415. [Google Scholar]
- Compernolle, S.; DeSmet, A.; Poppe, L.; Crombez, G.; De Bourdeaudhuij, I.; Cardon, G.; van der Ploeg, H.P.; van Dyck, D. Effectiveness of interventions using self-monitoring to reduce sedentary behavior in adults: A systematic review and meta-analysis. Int. J. Behav. Nutr. Phys. Act. 2019, 16, 63. [Google Scholar] [CrossRef] [PubMed]
- Chaput, J.P.; Carson, V.; Gray, C.E.; Tremblay, M.S. Importance of all movement behaviors in a 24 hour period for overall health. Int. J. Environ. Res. Public Health 2014, 11, 12575–12581. [Google Scholar] [CrossRef] [PubMed]
- Skovgaard, E.L.; Obling, K.; Maindal, H.T.; Rasmussen, C.; Overgaard, K. Unprompted vigorous physical activity is associated with higher levels of subsequent sedentary behaviour in participants with low cardiorespiratory fitness: A cross-sectional study. Eur. J. Sport Sci. 2019, 19, 1004–1013. [Google Scholar] [CrossRef] [PubMed]
- Migueles, J.H.; Aadland, E.; Andersen, L.B.; Brønd, J.C.; Chastin, S.F.; Hansen, B.H.; Konstabel, K.; Kvalheim, O.M.; McGregor, D.E.; Rowlands, A.V.; et al. GRANADA consensus on analytical approaches to assess associations with accelerometer-determined physical behaviours (physical activity, sedentary behaviour and sleep) in epidemiological studies. Br. J. Sports Med. 2021, 56, 376–384. [Google Scholar] [CrossRef] [PubMed]
- Ekblom-Bak, E.; Stenling, A.; Salier Eriksson, J.; Hemmingsson, E.; Kallings, L.V.; Andersson, G.; Wallin, P.; Ekblom, Ö.; Ekblom, B.; Lindwall, M.; et al. Latent profile analysis patterns of exercise, sitting and fitness in adults—Associations with metabolic risk factors, perceived health, and perceived symptoms. PLoS ONE 2020, 15, e0232210. [Google Scholar] [CrossRef] [PubMed]
- Evenson, K.R.; Sotres-Alvarez, D.; Deng, Y.U.; Marshall, S.J.; Isasi, C.R.; Esliger, D.W.; Davis, S. Accelerometer adherence and performance in a cohort study of US Hispanic adults. Med. Sci. Sports 2015, 47, 725–734. [Google Scholar] [CrossRef] [Green Version]
- von Rosen, P.; Dohrn, I.M.; Hagströmer, M. Latent profile analysis of physical activity and sedentary behavior with mortality risk: A 15-year follow-up. Scand. J. Med. Sci. Sports. 2020, 30, 1949–1956. [Google Scholar] [CrossRef] [PubMed]
- Mooney, S.J.; Joshi, S.; Cerdá, M.; Quinn, J.W.; Beard, J.R.; Kennedy, G.J.; Benjamin, E.O.; Ompad, D.C.; Rundle, A.G. Patterns of Physical Activity Among Older Adults in New York City: A Latent Class Approach. Am. J. Prev. Med. 2015, 49, e13–e22. [Google Scholar] [CrossRef] [PubMed] [Green Version]
- Länsitie, M.; Niemelä, M.; Kangas, M.; Venojärvi, M.; Härkönen, P.; Keinänen-Kiukaanniemi, S.; Korpelainen, R. Physical activity profiles and glucose metabolism—A population-based cross-sectional study in older adults. Transl. Sports Med. 2021, 4, 439–446. [Google Scholar] [CrossRef]
- Bean, C.; Dineen, T.; Jung, M.E. “It’s a Life Thing, Not a Few Months Thing”: Profiling Patterns of the Physical Activity Change Process and Associated Strategies of Women With Prediabetes Over 1 Year. Can. J. Diabetes 2020, 44, 701–710. [Google Scholar] [CrossRef]
- Pedersen, C.; Halvari, H.; Solstad, B.E.; Bentzen, M. Longitudinal trajectories of physical activity among employees participating in a worksite health promotion intervention: A latent class growth approach. Psychol. Sport Exerc. 2019, 43, 311–320. [Google Scholar] [CrossRef]
- Rossen, J.H.M.; Yngve, A.; Brismar, K.; Ainsworth, B.; Johansson, U.-B. Process evaluation of the Sophia Step Study- a primary care based three-armed randomized controlled trial using self-monitoring of steps with and without counseling in prediabetes and type 2 diabetes. BMC Public Health 2021, 2, 191. [Google Scholar] [CrossRef] [PubMed]
- Rossen, J.; Larsson, K.; Hagströmer, M.; Yngve, A.; Brismar, K.; Ainsworth, B.; Åberg, L.; Johansson, U. Effects of a three-armed randomised controlled trial using self-monitoring of daily steps with and without counselling in prediabetes and type 2 diabetes—The Sophia Step Study. Int. J. Behav. Nutr. Phys. Act. 2021, 18, 121. [Google Scholar] [CrossRef] [PubMed]
- Rossen, J.; Yngve, A.; Hagstromer, M.; Brismar, K.; Ainsworth, B.E.; Iskull, C.; Möller, P.; Johansson, U. Physical activity promotion in the primary care setting in pre- and type 2 diabetes—The Sophia step study, an RCT. BMC Public Health 2015, 15, 647. [Google Scholar] [CrossRef] [PubMed] [Green Version]
- Taylor-Piliae, R.E.; Norton, L.C.; Haskell, W.L.; Mahbouda, M.H.; Fair, J.M.; Iribarren, C.; Hlatky, M.A.; Go, A.S.; Fortmann, S.P. Validation of a new brief physical activity survey among men and women aged 60–69 years. Am. J. Epidemiol. 2006, 164, 598–606. [Google Scholar] [CrossRef] [PubMed] [Green Version]
- Rossen, J.; Buman, M.P.; Johansson, U.-B.; Yngve, A.; Ainsworth, B.; Brismar, K.; Hagströmer, M. Reallocating bouted sedentary time to non-bouted sedentary time, light activity and moderate-vigorous physical activity in adults with prediabetes and type 2 diabetes. PLoS ONE 2017, 12, e0181053. [Google Scholar] [CrossRef] [PubMed] [Green Version]
- Hart, T.L.; Swartz, A.M.; Cashin, S.E.; Strath, S.J. How many days of monitoring predict physical activity and sedentary behaviour in older adults? Int. J. Behav. Nutr. Phys. Act. 2011, 8, 62. [Google Scholar] [CrossRef] [PubMed] [Green Version]
- Palarea-Albaladejo, J.; Martín-Fernández, J.A. zCompositions—R package for multivariate imputation of left-censored data under a compositional approach. Chemometr. Intell. Lab. Syst. 2015, 143, 85–96. [Google Scholar] [CrossRef]
- Choi, L.; Liu, Z.; Matthews, C.E.; Buchowski, M.S. Validation of accelerometer wear and nonwear time classification algorithm. Med. Sci. Sports Exerc. 2011, 43, 357–364. [Google Scholar] [CrossRef] [Green Version]
- Matthews, C.E.; Chen, K.Y.; Freedson, P.S.; Buchowski, M.S.; Beech, B.M.; Pate, R.R.; Troiano, R.P. Amount of time spent in sedentary behaviors in the United States, 2003–2004. Am. J. Epidemiol. 2008, 167, 875–881. [Google Scholar] [CrossRef] [PubMed] [Green Version]
- Freedson, P.S.; Melanson, E.; Sirard, J. Calibration of the Computer Science and Applications, Inc. accelerometer. Med. Sci. Sports Exerc. 1998, 30, 777–781. [Google Scholar] [CrossRef]
- Mesquita, R.; Spina, G.; Pitta, F.; Donaire-Gonzalez, D.; Deering, B.M.; Patel, M.S.; Mitchell, K.E.; Alison, J.; van Gestel, A., Jr.; Zogg, S.; et al. Physical activity patterns and clusters in 1001 patients with COPD. Chron. Respir. Dis. 2017, 14, 256–269. [Google Scholar] [CrossRef] [PubMed]
- Chastin, S.F.M.; Palarea-Albaladejo, J.; Dontje, M.L.; Skelton, D.A. Combined Effects of Time Spent in Physical Activity, Sedentary Behaviors and Sleep on Obesity and Cardio-Metabolic Health Markers: A Novel Compositional Data Analysis Approach. PLoS ONE 2015, 10, e0139984. [Google Scholar] [CrossRef] [PubMed] [Green Version]
- Proust-Lima, C.; Philipps, V.; Liquet, B. Estimation of Extended Mixed Models Using Latent Classes and Latent Processes: The R Package lcmm. J. Stat. Softw. 2017, 78, 56. [Google Scholar] [CrossRef] [Green Version]
- Nylund, K.L.; Asparouhov, T.; Muthén, B.O. Deciding on the Number of Classes in Latent Class Analysis and Growth Mixture Modeling: A Monte Carlo Simulation Study. Struct. Equ. Model. 2007, 14, 535–569. [Google Scholar] [CrossRef]
- Kim, Y.; Kang, M.; Tacón, A.M.; Morrow, J.R., Jr. Longitudinal trajectories of physical activity in women using latent class growth analysis: The WIN Study. J. Sport Health Sci. 2016, 5, 410–416. [Google Scholar] [CrossRef] [PubMed] [Green Version]
- Lundqvist, S.; Börjesson, M.; Larsson, M.E.H.; Cider, Å.; Hagberg, L. Which patients benefit from physical activity on prescription (PAP)? A prospective observational analysis of factors that predict increased physical activity. BMC Public Health 2019, 19, 482. [Google Scholar] [CrossRef]
- Hoare, E.; Stavreski, B.; Jennings, G.L.; Kingwell, B.A. Exploring Motivation and Barriers to Physical Activity among Active and Inactive Australian Adults. Sports 2017, 5, 47. [Google Scholar] [CrossRef] [PubMed]
- Costello, E.; Kafchinski, M.; Vrazel, J.; Sullivan, P. Motivators, barriers, and beliefs regarding physical activity in an older adult population. J. Geriatr. Phys. Ther. 2011, 34, 138–147. [Google Scholar] [CrossRef] [PubMed]
- Buchman, A.S.; Wilson, R.S.; Yu, L.; James, B.D.; Boyle, P.A.; Bennett, D.A. Total daily activity declines more rapidly with increasing age in older adults. Arch. Gerontol. Geriatr. 2014, 58, 74–79. [Google Scholar] [CrossRef] [PubMed] [Green Version]
- Compernolle, S.; De Cocker, K.; Cardon, G.; De Bourdeaudhuij, I.; Van Dyck, D. Older Adults’ Perceptions of Sedentary Behavior: A Systematic Review and Thematic Synthesis of Qualitative Studies. Gerontologist 2020, 60, 572–582. [Google Scholar] [CrossRef] [PubMed]
- McGowan, L.J.; Devereux-Fitzgerald, A.; Powell, R.; French, D.P. How acceptable do older adults find the concept of being physically active? A systematic review and meta-synthesis. Int. Rev. Sport Exerc. Psychol. 2018, 11, 1–24. [Google Scholar] [CrossRef]
- McIntosh, T.; Hunter, D.J.; Royce, S. Barriers to physical activity in obese adults: A rapid evidence assessment. J. Res. Nurs. 2016, 21, 271–287. [Google Scholar] [CrossRef]
- McLaughlin, S.J.; Connell, C.M.; Janevic, M.R. Gender Differences in Trajectories of Physical Activity Among Older Americans With Diabetes. J. Aging Health 2016, 28, 460–480. [Google Scholar] [CrossRef] [PubMed]
- Bauman, A.E.; Reis, R.S.; Sallis, J.F.; Wells, J.C.; Loos, R.J.F.; Martin, B.W. Correlates of physical activity: Why are some people physically active and others not? Lancet 2012, 380, 258–271. [Google Scholar] [CrossRef]
- Amireault, S.; Godin, G.; Vézina-Im, L.A. Determinants of physical activity maintenance: A systematic review and meta-analyses. Health Psychol. Rev. 2013, 7, 55–91. [Google Scholar] [CrossRef]

| Profiles | AIC | BIC | Lowest Mean Value of Posterior Probability in Each Profile | Entropy |
|---|---|---|---|---|
| 2 | 9071 | 9137 | 0.83 | 0.70 |
| 3 | 9058 | 9143 | 0.51 | 0.63 |
| 4 | 9057 | 9141 | 0.43 | 0.53 |
| 5 | 9125 | 9219 | 0.25 | 0.12 |
| All Participants (n = 168) | Increased Activity (n = 37) | No Change in Activity (n = 131) | |
|---|---|---|---|
| Female (%) | 66 (39) | 15 (41) | 51 (38) |
| Age (SD) | 64.3 (7.7) | 60.6 (8.4) | 65.3 (7.2) |
| BMI (SD) | 30.1 (4.7) | 29.5 (4.2) | 30.3 (4.8) |
| Randomisation (%) | |||
| Multicomponent intervention | 61 (36) | 14 (38) | 47 (36) |
| Single component intervention | 51 (30) | 15 (41) | 36 (27) |
| Control group | 56 (33) | 8 (22) | 48 (37) |
| Hypertension (%) | 127 (76) | 24 (65) | 103 (79) |
| Chronic obstructive pulmonary disease (%) | 16 (10) | 1 (3) | 15 (12) |
| Other disease * (%) | 31 (19) | 8 (22) | 23 (18) |
| Achieving ≥150 min of moderate to vigorous per week at baseline (%) | 92 (55) | 29 (78) | 63 (48) |
| Model * | OR (95% CI) | Standard Error | p-Value |
|---|---|---|---|
| Gender (reference female) | |||
| Male | 1.08 (0.48–2.47) | 0.41 | 0.853 |
| Age | 0.92 (0.87–0.97) | 0.03 | 0.003 |
| Randomisation group (reference Multicomponent intervention) Single component intervention Control group | 1.70 (0.69–4.30) 0.54 (0.18–1.51) | 0.47 0.54 | 0.254 0.253 |
| Achieving 150 min/week moderate to vigorous PA at baseline | 3.18 (1.34–8.24) | 0.46 | 0.011 |
Publisher’s Note: MDPI stays neutral with regard to jurisdictional claims in published maps and institutional affiliations. |
© 2022 by the authors. Licensee MDPI, Basel, Switzerland. This article is an open access article distributed under the terms and conditions of the Creative Commons Attribution (CC BY) license (https://creativecommons.org/licenses/by/4.0/).
Share and Cite
Rossen, J.; Hagströmer, M.; Larsson, K.; Johansson, U.-B.; von Rosen, P. Physical Activity Patterns among Individuals with Prediabetes or Type 2 Diabetes across Two Years—A Longitudinal Latent Class Analysis. Int. J. Environ. Res. Public Health 2022, 19, 3667. https://doi.org/10.3390/ijerph19063667
Rossen J, Hagströmer M, Larsson K, Johansson U-B, von Rosen P. Physical Activity Patterns among Individuals with Prediabetes or Type 2 Diabetes across Two Years—A Longitudinal Latent Class Analysis. International Journal of Environmental Research and Public Health. 2022; 19(6):3667. https://doi.org/10.3390/ijerph19063667
Chicago/Turabian StyleRossen, Jenny, Maria Hagströmer, Kristina Larsson, Unn-Britt Johansson, and Philip von Rosen. 2022. "Physical Activity Patterns among Individuals with Prediabetes or Type 2 Diabetes across Two Years—A Longitudinal Latent Class Analysis" International Journal of Environmental Research and Public Health 19, no. 6: 3667. https://doi.org/10.3390/ijerph19063667
APA StyleRossen, J., Hagströmer, M., Larsson, K., Johansson, U.-B., & von Rosen, P. (2022). Physical Activity Patterns among Individuals with Prediabetes or Type 2 Diabetes across Two Years—A Longitudinal Latent Class Analysis. International Journal of Environmental Research and Public Health, 19(6), 3667. https://doi.org/10.3390/ijerph19063667