
Precarious Work as Risk Factor for 5-Year Increase in Depressive Symptoms


Abstract
:1. Introduction
2. Materials and Methods
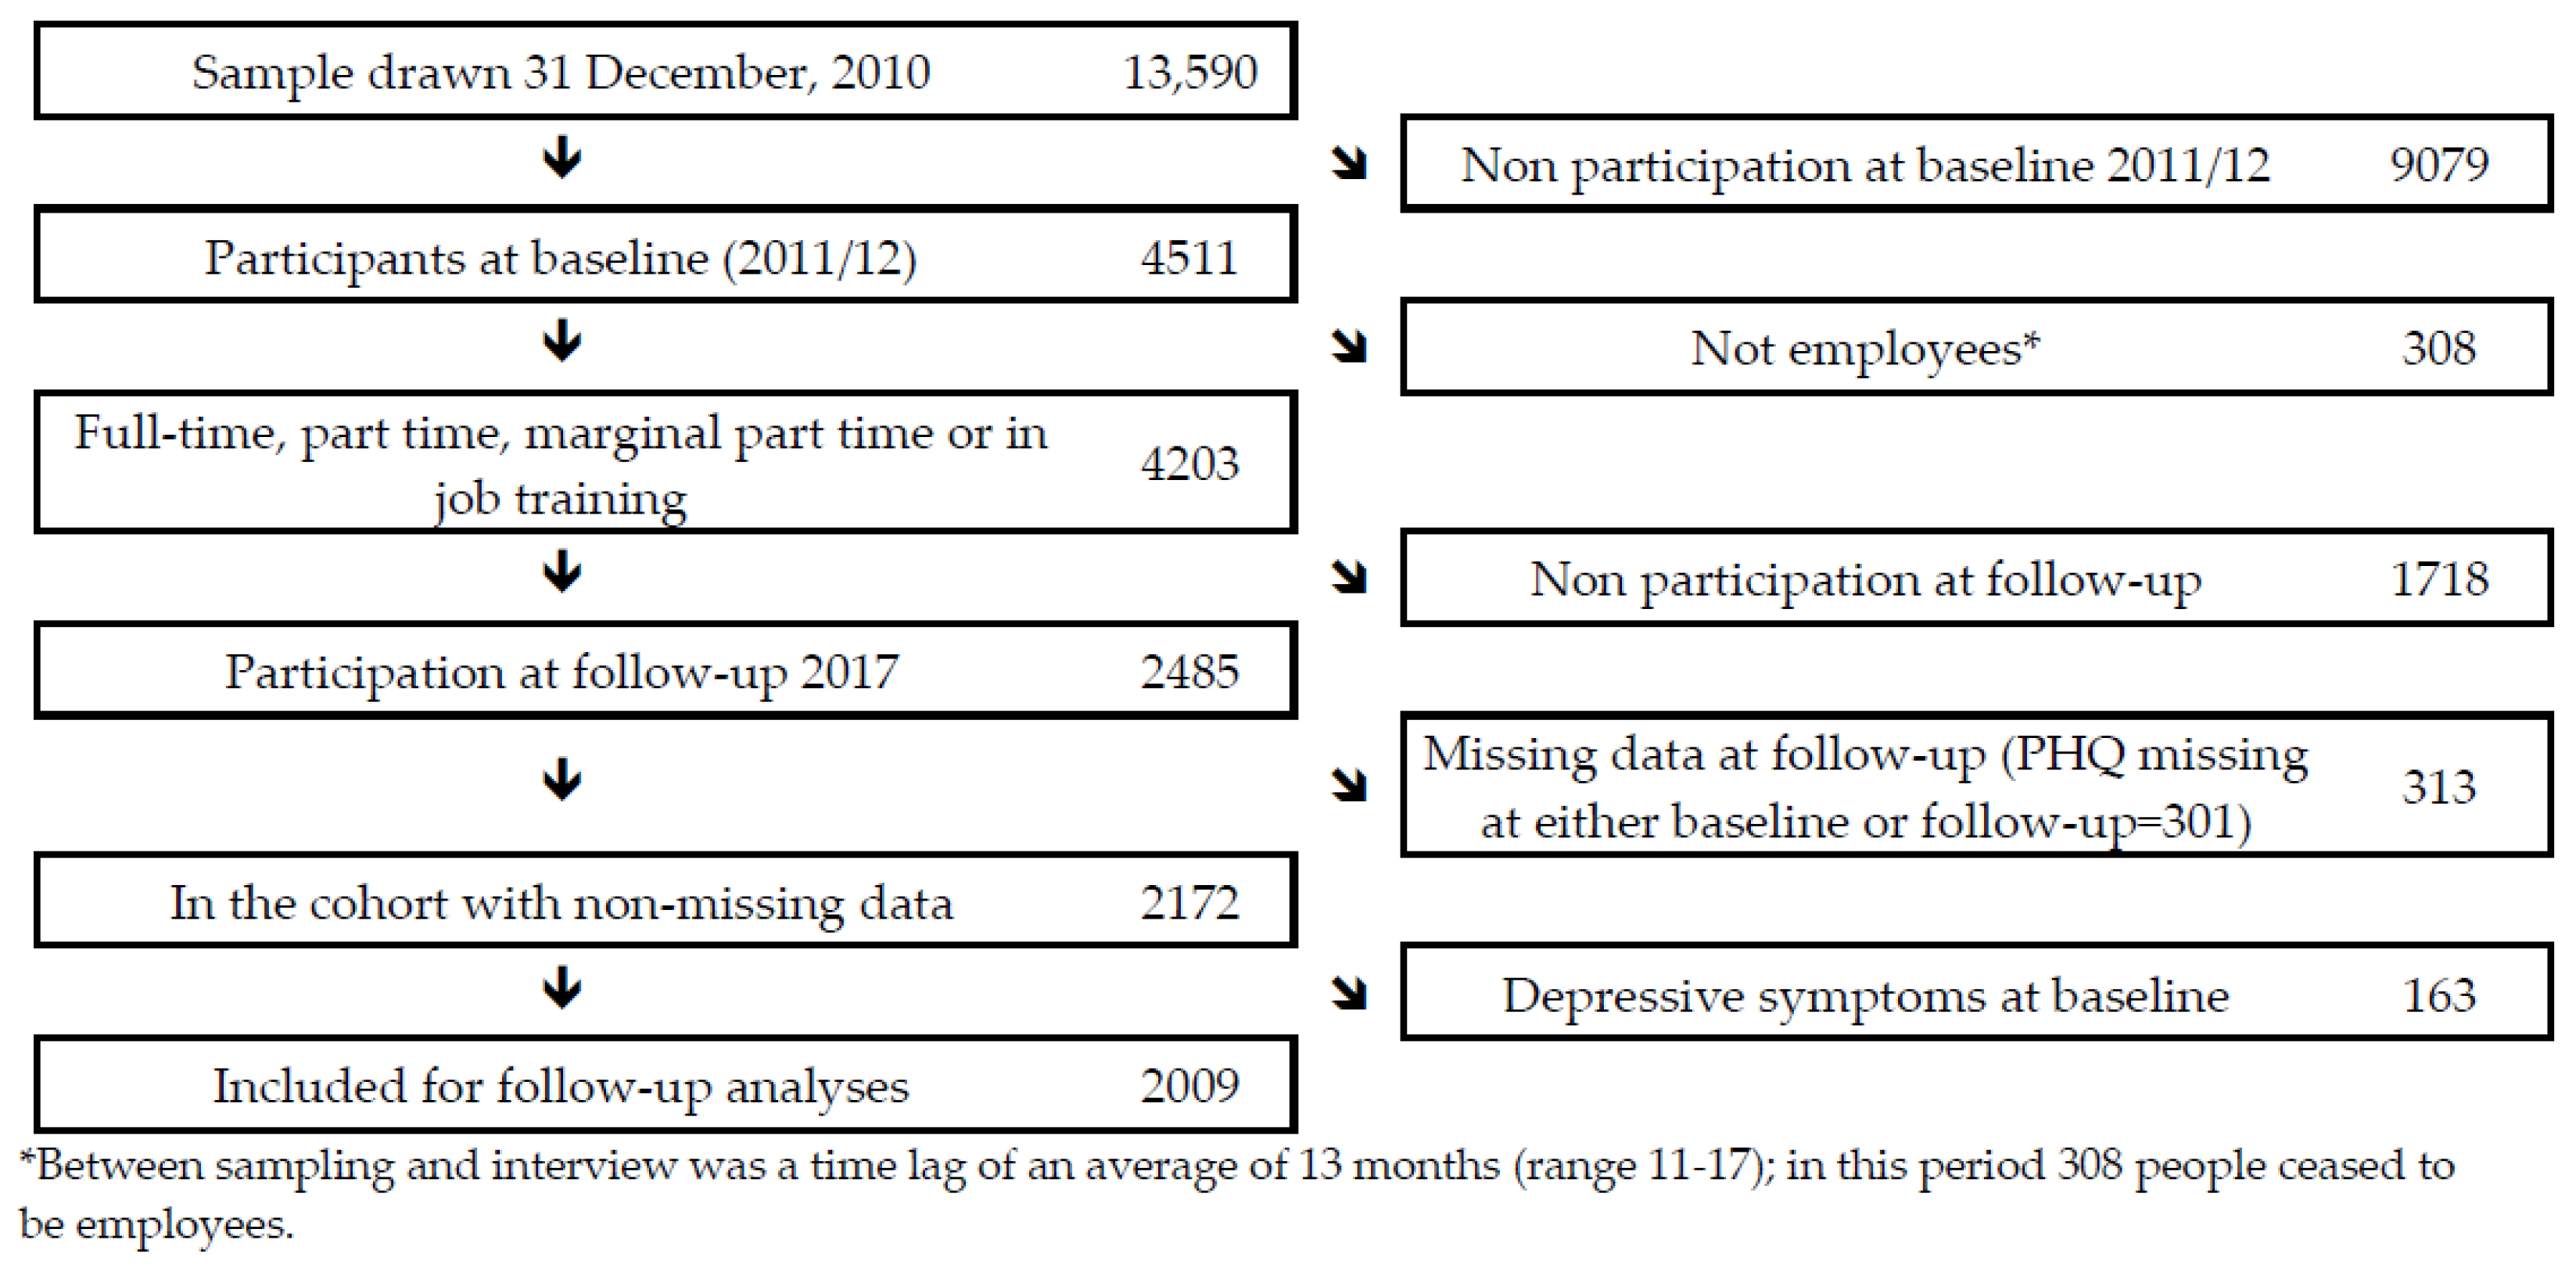
2.1. Sample
2.2. Measures
2.2.1. Outcome Measure: Depressive Symptoms
2.2.2. Precarious Work
2.2.3. Covariates
2.3. Analysis
3. Results
4. Discussion
4.1. Comparison with Previous Studies
4.1.1. Precarious Work as a Global Measure
4.1.2. Specific Indicators of Precarious Work
4.1.3. National Welfare State Context
4.1.4. Remarks on the Existing Literature
4.2. Strengths and Limitations
5. Conclusions
Author Contributions
Funding
Institutional Review Board Statement
Informed Consent Statement
Data Availability Statement
Acknowledgments
Conflicts of Interest
Appendix A

| (Virtanen et al., 2011) [1] | (Rugulies et al., 2010) [2] | (Sirviö et al., 2012) [3] | (Waenerlund et al., 2011) [4] | (Wege et al., 2017) [5] | (Canivet et al., 2016) [6] | |
|---|---|---|---|---|---|---|
| Country | Sweden | Denmark | Finland | Sweden | Germany | Sweden |
| N | 1005 | 5142 | 3449 | 985 | 7354 | 786 |
| Baseline year | 1995 | 2000 | 1997 | 1995 | 2009 | 1999/2000 |
| Population | Cohort of 30 year-old participants in Northern Sweden industrial city | Danish Longitudinal Study on Work, Unemployment and Health Adult workers | Northern Finland 1966 Birth Cohort (31 year old) | Northern Swedish Cohort (42 year old) | German Socioeconomic Panel Adult workers | Scania Public Health Cohort, Workers 18–34 years |
| Follow-up, years | 12 | 3.5 | See below | 12 | 2 | 5 |
| Precarious work measure | Baseline temporary employment and/or job insecurity | Baseline job insecurity and/or previous prolonged unemployment | Retrospective discontinuous work history, current fixed-term and/or part-time employment | Baseline and retrospective labour market program employment, on-call, seasonal, temporary agency worker, probationary, project employed and/or self-employed | Baseline insecure jobs or past long-term unemployment | 1999/2000–2005 trajectory of present or previous unemployment, temporary employment, and/or perceived job insecurity |
| Outcome | Poor mental health (GHQ) | Antidepressant medication | Poor mental health (HSCL-25) | Poor mental health | Self-reported physician diagnosed depression | Poor mental health (GHQ-12) |
| Analyses | Logistic regression | Logistic regression | Logistic regression | Logistic regression | Poisson regression | Poisson regression |
| Result | OR 2.33 (0.99 to 5.51) | OR 1.79 (1.15–2.79) | - | - | RR 2.30 (1.40; 3.79) | RR 1.5 (1.1–2.0) Attributable fraction 18% |
| Result, gender strata | - | - | M: OR 1.6 (1.1–2.3): W: OR1.4 (1.1–1.9) | M: OR 2.18 (1.14–4.20); W: OR 1.79 (0.98–3.29) | - | M: RR 2.5 (1.7–3.5) W: RR 1.8 (1.4–2.3) [7] 1 |
| Job Insecurity | Fixed Term Contract | Unemployment | |||||||
|---|---|---|---|---|---|---|---|---|---|
| (Rönnblad et al., 2019) [8] | (Kim et al., 2017) [9] | (Wege et al., 2017) [5] | (LaMontagne et al., 2020) [10] | (Ervasti et al., 2014) [11] | (Hammarström et al., 2011) [12] | (Quesnel-Vallée et al., 2010) [13] | (Wege et al., 2017) [5] | (Hollander et al., 2013) [14] | |
| Country | Sweden, Norway, Denmark, Netherlands, France, Canada, US [1,2,8,9,15,16,17,18,19,20,21,22,23] | South Korea | Germany | Australia | Finland | Sweden | US | Germany | Sweden |
| N | 59,443 | 2912 | 7354 | 19,169 | 107,828 | 660 | 3.577 | 7354 | 3,284,896 |
| Baseline year | Mean 2000 (range 1986–2008) | 2012 | 2009 | 2011–2014 | 2005 | 1995 | 1994 | 2009 | 2000 |
| Population | Meta-analysis of Norwegian Survey of Living Conditions, Danish Work Environment Cohort Study, Danish Longitudinal Study on Work, Unemployment and Health, Maastricht cohort Study, French Santé et Itinéraire Professionnel (SIP) survey, U.S. National Longitudinal Survey of Youth—10 cohorts on adult workers and one cohort on young workers | Korea Welfare Panel Study KOWEPS) Adult workers | German Socioeconomic Panel Adult workers | Househol, Income and Labour Dynamics (HILDA). Adult workers | Finnish Public Health Sector Study Adult workers | Northern Swedish Cohort Workers aged 30–42 | National Longitudinal Study of Youth Workers aged 27–35 | German Socioeconomic Panel Adult workers | Register of persons in the labour market Adult workers |
| Follow-up, years | Mean 3.5 (range 1–6) | 3 | 2 | 1 | 6 | 12 | 2 | 2 | 6 |
| Job insecurity measure | Perceived job insecurity | Perceived job insecurity | Baseline perceived job insecurity | Baseline perceived job insecurity | Baseline temporary employment | Baseline temporary employment | Baseline temporary employment | Lifetime biography of unemployment prior to baseline | Unemployment register information |
| Outcome | Depression (HAD-D; SCL-CD6; MINI, CIDI-SFMD) depressive symptoms/poor mental health (CES-D; MH-5), psychological distress (GHQ-12, other), drug use (self-report, register) | Depressive symptoms (CES-D-11) | Self-reported physician diagnosed depression | Good mental health (MH-5) | Sickness absence (>9 days) due to depression | Depressive symptoms (1-item) | Depressive symptoms (CES-D) | Self-reported physician diagnosed depression | Hospitalisation for depressive disorder |
| Analyses | Meta-analysis based on logistic regression, cox regression or correlation | Cox regression | Poisson regression | Linear regression (in internet appendix) | Logistic regression | Logistic regression | Propensity score analysis | Poisson regression | Cox regression |
| Result overall | Meta-analysis: OR 1.52 (1.35–1.70) | M: HR: 1.73 (1.16–2.59) F: HR: 1.05 (0.69–1.59) | RR 1.54 (1.18; 2.01) | - | OR 1.02 (0.97–1.08) | OR 1.79 (1.04–3.08) | ATT 1.803 (0.552–3.055) | RR 1.64 (1.16; 2.31) | - |
| Result gender strata | In the Danish Work Environment Cohort Study with poor mental health: M: 2.09 (1.04–4.20); W: 1.04 (0.62–1.74) [24]. In the Maastricht cohort study - psychological distress: M: OR 1.83 (1.33–2.51); W: 1.03 (0.62–1.71). [16]. In the French Santé et Itinéraire Professionnel (SIP) survey A - psychotropic drug use: job insecurity interacted with gender and was significant for men (RR=1.38, 95% CI:1.12;1.69), but not for women [21]. B- self-reported major depressive disorder (MINI): job insecurity did not interact with gender [25]. | - | M Beta: 0.34 (0.21–0.47) W: Beta: 0.09 −0.04–0.22 | - | M: RR 2.3 (2.19–2.49); W: 1.62 (1.53–1.73) | ||||
| Each Precarious Work Indicator Separately in the Model | Indicators of Precarious Work Mutually Adjusted | |||||
|---|---|---|---|---|---|---|
| Adjusted for Baseline Depressive Symptoms, Age, Partnership Status and Additionally for SEP 1 | Adjusted for Baseline Depressive Symptoms, Age, Partnership Status and Additionally for SEP 1 | |||||
| p | Beta | CI | p | Beta | CI | |
| Job insecurity (High vs. low to medium) | 0.014 | 0.08 | 0.02–0.14 | 0.019 | 0.07 | 0.01–0.13 |
| Marginal part-time (Yes vs. no) | 0.969 | −0.00 | −0.06–0.06 | 0.870 | −0.01 | −0.07–0.06 |
| Fixed-term (Yes vs. no) | 0.692 | 0.01 | −0.05–0.07 | 0.904 | −0.00 | −0.06–0.06 |
| Low wage (Yes vs. no) | 0.118 | 0.04 | −0.02–0.10 | 0.259 | 0.04 | 0.03–0.10 |
| Each Precarious Work Indicator Separately in the Model | Indicators of Precarious Work Mutually Adjusted | |||||
|---|---|---|---|---|---|---|
| Adjusted for Baseline Depressive Symptoms, Age, Partnership Status and Additionally for SEP 1 | Adjusted for Baseline Depressive Symptoms, Age, Partnership Status and Additionally for SEP 1 | |||||
| p | Beta | CI | p | Beta | CI | |
| Job insecurity (High vs. low to medium) | 0.137 | 0.05 | −0.01–0.11 | 0.190 | 0.04 | −0.02–0.10 |
| Marginal part-time (Yes vs. no) | 0.398 | −0.03 | −0.09–0.04 | 0.370 | −0.03 | −0.10–0.04 |
| Fixed-term (Yes vs. no) | 0.348 | 0.03 | −0.03–0.09 | 0.443 | 0.02 | −0.04–0.09 |
| Low wage (Yes vs. no) | 0.900 | 0.00 | −0.06–0.07 | 0.691 | 0.01 | −0.05–0.08 |
| Men | Women | |||||
|---|---|---|---|---|---|---|
| Adjusted for Baseline Depressive Symptoms, Age, Partnership Status and Additionally for SEP 1 | Adjusted for Baseline Depressive Symptoms, Age, Partnership Status and Additionally for SEP 1 | |||||
| p | Beta | CI | p | Beta1 | CI | |
| Unemployment 2 | 0.143 | 0.04 | −0.01–0.10 | 0.316 | 0.03 | −0.03–0.09 |
| _ | n | Depressive Symptoms at Follow-Up 1, % | Each Precarious Work Indicator Separately in the Model | Indicators of Precarious Work Mutually Adjusted | ||||
|---|---|---|---|---|---|---|---|---|
| Adjusted for Baseline Age, Partnership Status and SEP 2 | Adjusted for Baseline Age, Partnership Status and SEP 2 | |||||||
| p | OR | 95% CI | p | OR | 95% CI | |||
| Job insecurity | 0.010 | 0.024 | ||||||
| Low to medium | 833 | 5 | 1 | 1 | ||||
| High | 228 | 13 | 2.00 | 1.18–3.40 | 1.87 | 1.09–3.22 | ||
| Marginal part-time | 0.406 | 0.741 | ||||||
| No | 1050 | 7 | 1 | 1 | ||||
| Yes | 11 | 18 | 2.11 | 0.36–12.24 | 1.36 | 0.22–8.61 | ||
| Fixed-term | 0.296 | 0.694 | ||||||
| No | 1020 | 7 | 1 | 1 | ||||
| Yes | 41 | 12 | 1.73 | 0.62–4.81 | 1.24 | 0.42–3.64 | ||
| Low wage | 0.000 | 0.000 | ||||||
| No | 1007 | 6 | 1 | 1 | ||||
| Yes | 54 | 26 | 5.25 | 2.48–11.11 | 4.83 | 2.26–10.32 | ||
| _ | n | Depressive Symptoms at Follow-Up 1, % | Each Precarious Work Indicator Separately in the Model | Indicators of Precarious Work Mutually Adjusted | ||||
|---|---|---|---|---|---|---|---|---|
| Adjusted for Baseline Age, Partnership Status and SEP 2 | Adjusted for Baseline Age, Partnership Status and SEP 2 | |||||||
| p | OR | 95% CI | p | OR | 95% CI | |||
| Job insecurity | 0.138 | 0.156 | ||||||
| Low to medium | 860 | 11 | 1 | 1 | ||||
| High | 251 | 20 | 1.40 | 0.90–2.17 | 1.38 | 0.88–2.15 | ||
| Marginal part-time | 0.978 | 0.850 | ||||||
| No | 1009 | 13 | 1 | 1 | ||||
| Yes | 102 | 11 | 0.99 | 0.48–2.03 | 0.93 | 0.43–1.99 | ||
| Fixed-term | 0.463 | 0.605 | ||||||
| No | 1048 | 13 | 1 | 1 | ||||
| Yes | 63 | 18 | 1.33 | 0.62–2.83 | 1.22 | 0.57–2.63 | ||
| Low wage | 0.484 | 0.492 | ||||||
| No | 932 | 13 | 1 | 1 | ||||
| Yes | 179 | 13 | 1.21 | 0.71–2.08 | 1.22 | 0.69–2.17 | ||
| Male Employees | Female Employees | |||||||||
|---|---|---|---|---|---|---|---|---|---|---|
| N | Depressive Symptoms at Follow-Up 1, % | Adjusted for Baseline Age, Partnership Status and SEP 2 | N | Depressive Symptoms at Follow-Up 1, % | Adjusted for Baseline Age, Partnership Status and SEP 2 | |||||
| p | OR | 95% CI | p | OR | 95% CI | |||||
| UNEMPLOYMENT 2 | 0. 281 | 0. 219 | ||||||||
| No | 1001 | 6 | 1 | 1027 | 13 | 1 | ||||
| Yes | 60 | 15 | 1.58 | 0.69–3.62 | 84 | 16 | 1.53 | 0.78–2.99 | ||
| Male Employees | Female Employees | |||||||||
|---|---|---|---|---|---|---|---|---|---|---|
| N | Depressive Symptoms at Follow-Up 1, % | Adjusted for Baseline Age, Partnership Status and SEP 2 | N | Depressive Symptoms at Follow-Up 1, % | Adjusted for Baseline Age, Partnership Status and SEP 2 | |||||
| p | OR | 95% CI | p | OR | 95% CI | |||||
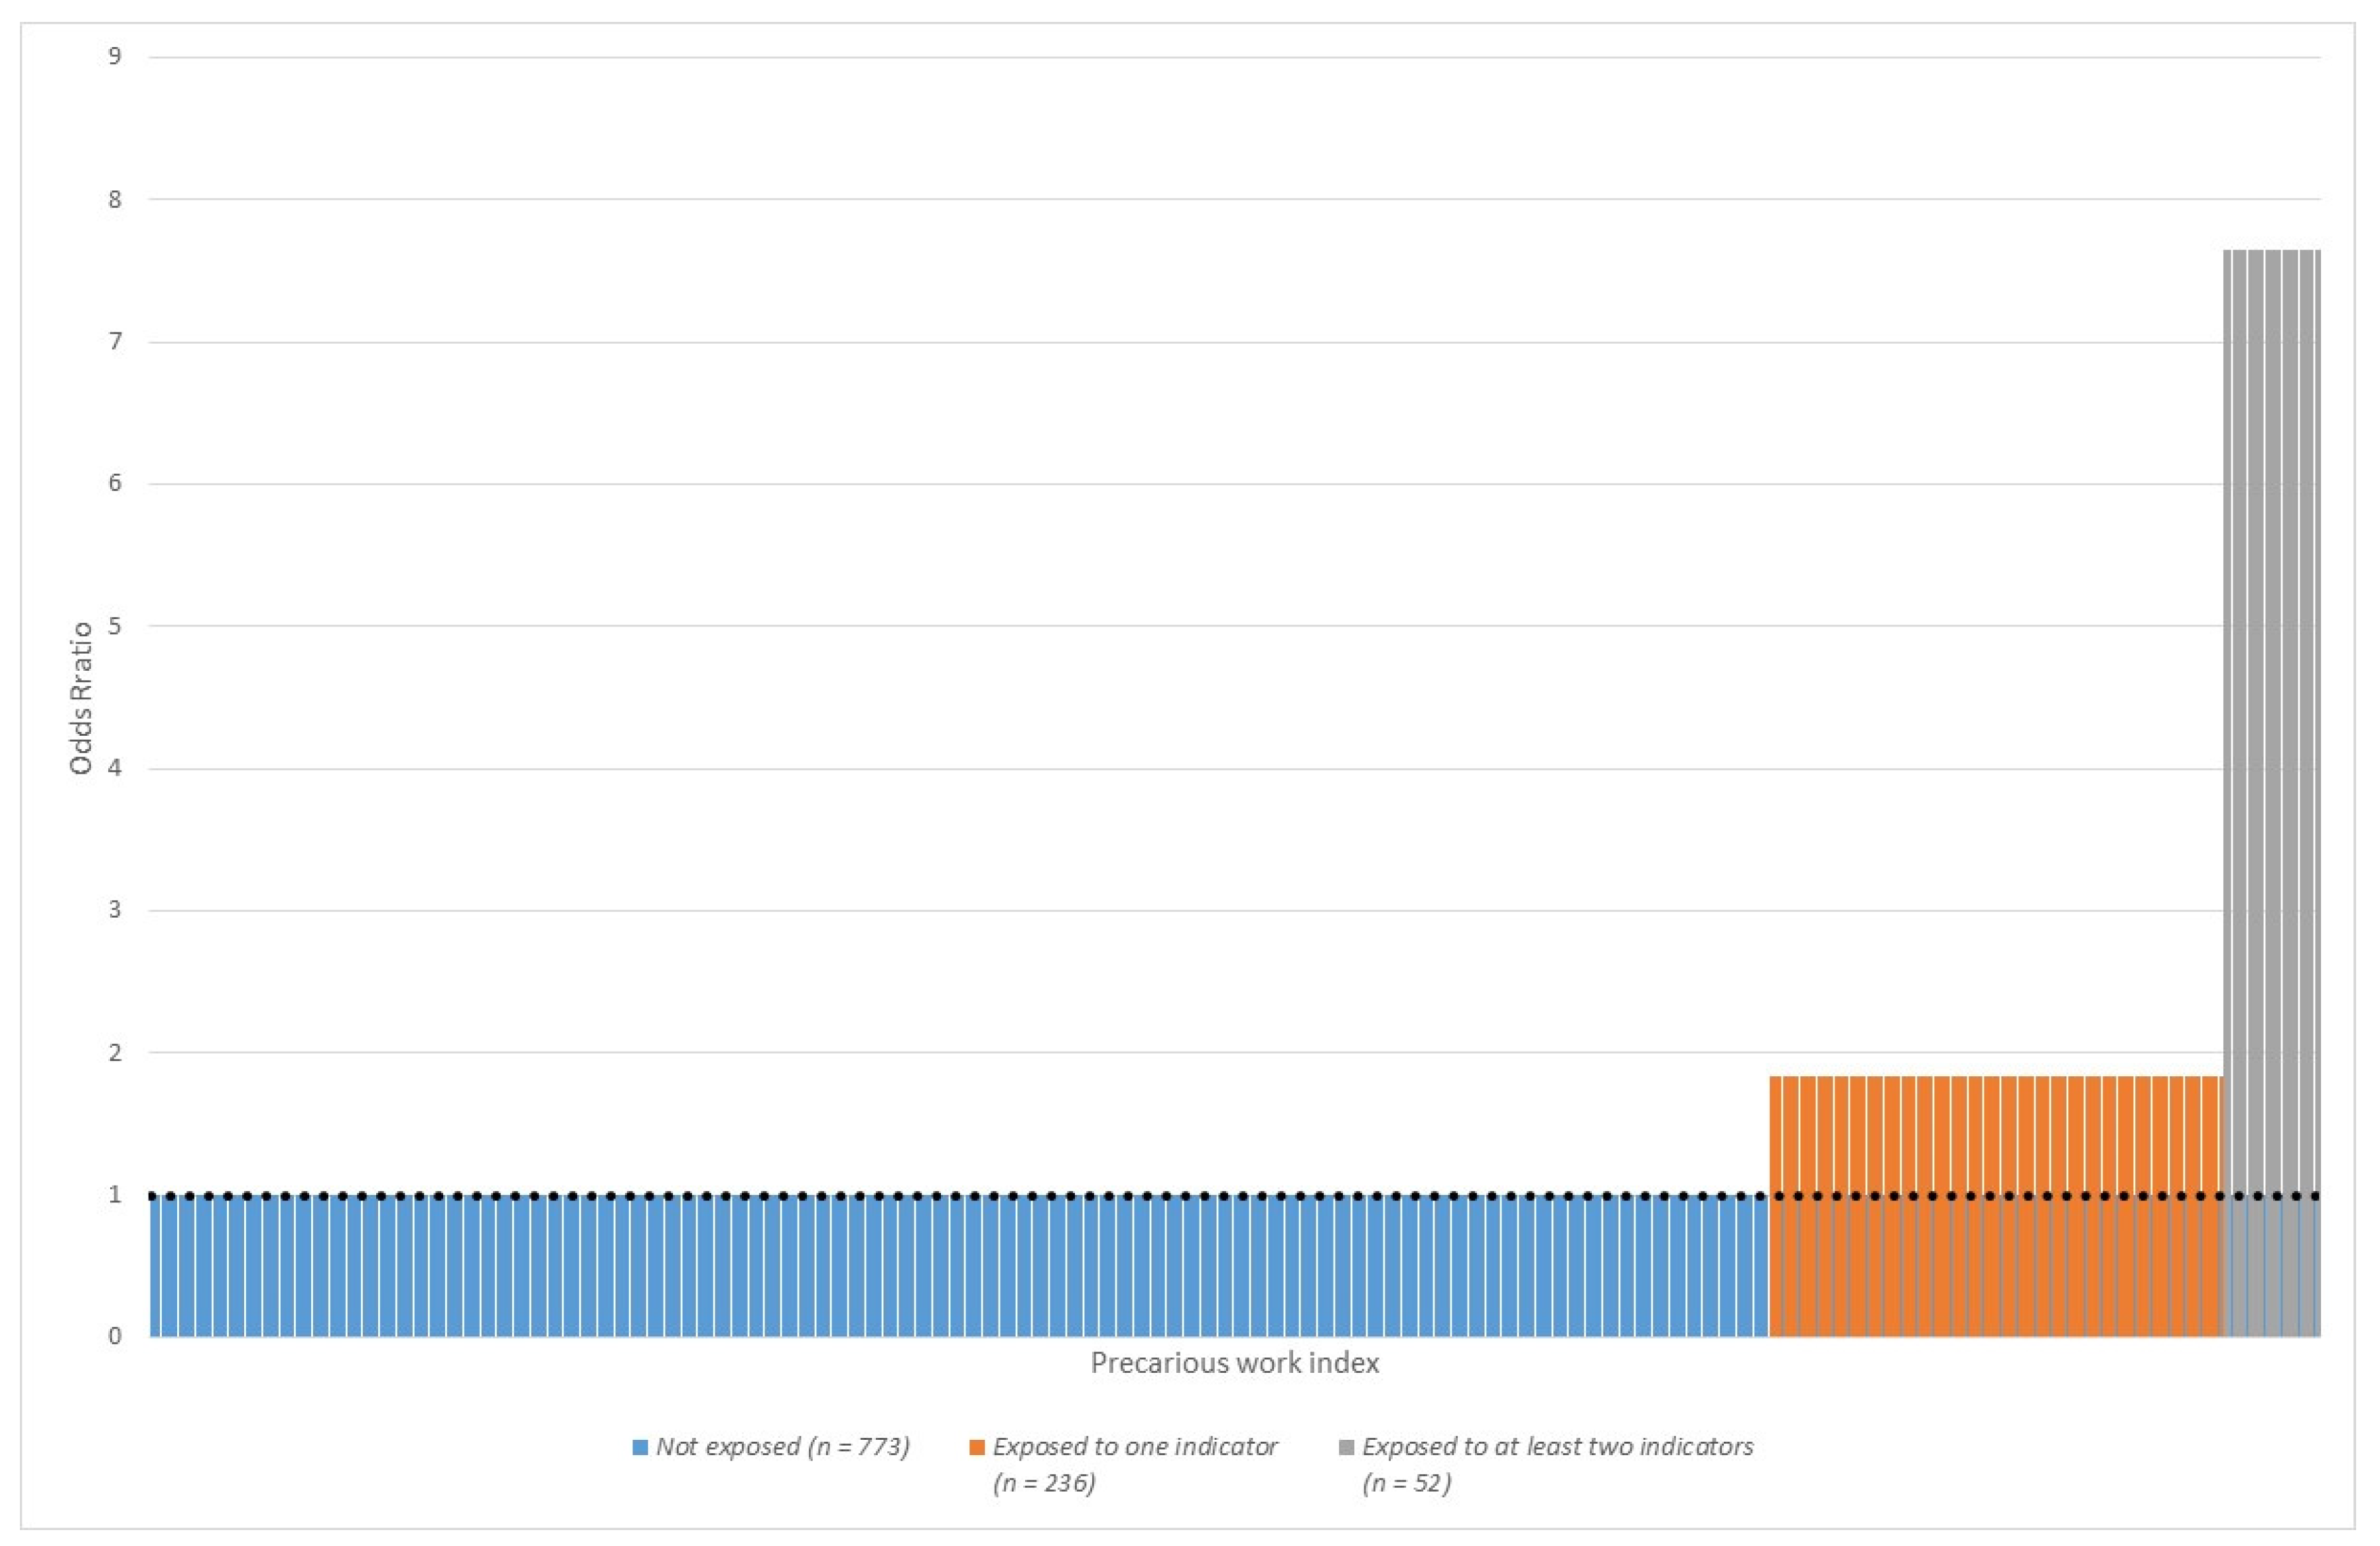
| PRECARIOUS WORK INDEX 3 | 0.000 | 0.162 | ||||||||
| 0 | 773 | 5 | 1 | 686 | 10 | 1 | ||||
| 1 | 236 | 10 | 1.74 | 0.98–3.11 | 343 | 17 | 1.40 | 0.91–2.14 | ||
| ≥2 | 52 | 27 | 5.27 | 2.42–11.46 | 82 | 16 | 1.74 | 0.84–3.58 | ||
References
- Benach, J.; Vives, A.; Amable, M.; Vanroelen, C.; Tarafa, G.; Muntaner, C. Precarious employment: Understanding an emerging social determinant of health. Annu. Rev. Public Health 2014, 35, 229–253. [Google Scholar] [CrossRef] [PubMed] [Green Version]
- Brady, D.; Biegert, T. The Rise of Precarious Employment in Germany. In Precarious Work; Arne, L.K., Steven, P.V., Eds.; Emerald Publishing Limited: Bingley, UK, 2017; Volume 31, pp. 245–271. [Google Scholar]
- Seeleib-Kaiser, M.; Fleckenstein, T.J.S.P. Discourse, learning and welfare state change: The case of German labour market reforms. Soc. Policy Adm. 2007, 41, 427–448. [Google Scholar] [CrossRef]
- Buchholz, S.; Rinklake, A.; Blossfeld, H.P. Reversing Early Retirement in Germany. A Longitudinal Analysis of the Effects of Recent Pension Reforms on the Timing of the Transition to Retirement and on Pension Incomes. Comp. Popul. Stud. Z. Bevölkerungswiss. 2013, 38, 881–906. [Google Scholar] [CrossRef]
- Eichhorst, W.; Marx, P. Reforming German labour market institutions: A dual path to flexibility. J. Eur. Soc. Policy 2011, 21, 73–87. [Google Scholar] [CrossRef]
- Bodin, T.; Çağlayan, Ç.; Garde, A.H.; Gnesi, M.; Jonsson, J.; Kiran, S.; Kreshpaj, B.; Leinonen, T.; Mehlum, I.S.; Nena, E.; et al. Precarious employment in occupational health—An OMEGA-NET working group position paper. Scand. J. Work. Environ. Health 2020, 46, 321–329. [Google Scholar] [CrossRef] [Green Version]
- Kreshpaj, B.; Orellana, C.; Burstrom, B.; Davis, L.; Hemmingsson, T.; Johansson, G.; Kjellberg, K.; Jonsson, J.; Wegman, D.H.; Bodin, T. What is precarious employment? A systematic review of definitions and operationalizations from quantitative and qualitative studies. Scand. J. Work. Environ. Health 2020, 46, 235–247. [Google Scholar] [CrossRef]
- Olsthoorn, M. Measuring precarious employment: A proposal for two indicators of precarious employment based on set-theory and tested with Dutch labor market-data. Soc. Indic. Res. 2014, 119, 421–441. [Google Scholar] [CrossRef]
- Quinlan, M.; Mayhew, C.; Bohle, P. The Global Expansion of Precarious Employment, Work Disorganization, and Consequences for Occupational Health: A Review of Recent Research. Int. J. Health Serv. 2001, 31, 335–414. [Google Scholar] [CrossRef]
- Benavides, F.G.; Benach, J.; Muntaner, C.; Delclos, G.L.; Catot, N.; Amable, M. Associations between temporary employment and occupational injury: What are the mechanisms? Occup. Environ. Med. 2006, 63, 416. [Google Scholar] [CrossRef]
- Rodgers, G. Precarious work in Western Europe: The state of the debate. In Precarious Jobs in Labour Market Regulation: The Growth of Atypical Employment in Western Europe; Rodgers, G., Rodgers, J., Eds.; International Institute for Labour Studies: Geneva, Switzerland, 1989; Volume 3, pp. 1–16. [Google Scholar]
- Standing, G. The Precariat The New Dangerous Class; Bloomsbury Publishing: London, UK, 2011. [Google Scholar]
- International Labour Organization (ILO). From Precarious Work to Decent Work: Outcome Document to the Workers’ Symposium on Policies and Regulations to Combat Precarious Employment; International Labour Office, Bureau for Workers’ Activities: Geneva, Switzerland, 2012. [Google Scholar]
- Vives, A.; Amable, M.; Ferrer, M.; Moncada, S.; Llorens, C.; Muntaner, C.; Benavides, F.G.; Benach, J. The Employment Precariousness Scale (EPRES): Psychometric properties of a new tool for epidemiological studies among waged and salaried workers. Occup. Environ. Med. 2010, 67, 548–555. [Google Scholar] [CrossRef] [Green Version]
- Tompa, E.; Scott-Marshall, H.; Dolinschi, R.; Trevithick, S.; Bhattacharyya, S. Precarious employment experiences and their health consequences: Towards a theoretical framework. Work 2007, 28, 209–224. [Google Scholar] [PubMed]
- de Witte, H. Job insecurity: Review of the international literature on definitions, prevalence, antecedents and consequences. SA J. Ind. Psychol. 2005, 31, 1–6. [Google Scholar] [CrossRef]
- Vives, A.; Amable, M.; Ferrer, M.; Moncada, S.; Llorens, C.; Muntaner, C.; Benavides, F.G.; Benach, J. Employment precariousness and poor mental health: Evidence from Spain on a new social determinant of health. J. Environ. Public Health 2013, 2013, 978656. [Google Scholar] [CrossRef]
- Vander Elst, T.; van den Broeck, A.; de Witte, H.; de Cuyper, N. The mediating role of frustration of psychological needs in the relationship between job insecurity and work-related well-being. Work Stress 2012, 26, 252–271. [Google Scholar] [CrossRef] [Green Version]
- Virtanen, P.; Janlert, U.; Hammarström, A. Exposure to temporary employment and job insecurity: A longitudinal study of the health effects. Occup. Environ. Med. 2011, 68, 570–574. [Google Scholar] [CrossRef] [PubMed] [Green Version]
- Waenerlund, A.K.; Gustafsson, P.E.; Virtanen, P.; Hammarström, A. Is the core-periphery labour market structure related to perceived health? findings of the Northern Swedish Cohort. BMC Public Health 2011, 11, 956. [Google Scholar] [CrossRef] [PubMed] [Green Version]
- Rugulies, R.; Thielen, K.; Nygaard, E.; Diderichsen, F. Job insecurity and the use of antidepressant medication among Danish employees with and without a history of prolonged unemployment: A 3.5-year follow-up study. J. Epidemiol. Community Health 2010, 64, 75–81. [Google Scholar] [CrossRef]
- Wege, N.; Angerer, P.; Li, J. Effects of Lifetime Unemployment Experience and Job Insecurity on Two-Year Risk of Physician-Diagnosed Incident Depression in the German Working Population. Int. J. Environ. Res. Public Health 2017, 14, 904. [Google Scholar] [CrossRef] [Green Version]
- Sirviö, A.; Ek, E.; Jokelainen, J.; Koiranen, M.; Järvikoski, T.; Taanila, A. Precariousness and discontinuous work history in association with health. Scand. J. Public Health 2012, 40, 360–367. [Google Scholar] [CrossRef]
- Canivet, C.; Bodin, T.; Emmelin, M.; Toivanen, S.; Moghaddassi, M.; Östergren, P.-O. Precarious employment is a risk factor for poor mental health in young individuals in Sweden: A cohort study with multiple follow-ups. J. BMC Public Health 2016, 16, 687. [Google Scholar] [CrossRef] [Green Version]
- Hollander, A.C.; Bruce, D.; Ekberg, J.; Burström, B.; Ekblad, S. Hospitalisation for depressive disorder following unemployment--differentials by gender and immigrant status: A population-based cohort study in Sweden. J. Epidemiol. Community Health 2013, 67, 875–881. [Google Scholar] [CrossRef] [PubMed]
- Rugulies, R.; Bultmann, U.; Aust, B.; Burr, H. Psychosocial work environment and incidence of severe depressive symptoms: Prospective findings from a 5-year follow-up of the Danish work environment cohort study. Am. J. Epidemiol. 2006, 163, 877–887. [Google Scholar] [CrossRef] [PubMed]
- Bultmann, U.; Kant, I.J.; Van den Brandt, P.A.; Kasl, S.V. Psychosocial work characteristics as risk factors for the onset of fatigue and psychological distress: Prospective results from the Maastricht Cohort Study. Psychol. Med. 2002, 32, 333–345. [Google Scholar] [CrossRef] [PubMed] [Green Version]
- LaMontagne, A.D.; Too, L.S.; Laura Punnett, L.; Milner, A.J. Changes in job security and mental health: An analysis of 14 annual waves of an Australian working population panel survey. Am. J. Epidemiol. 2020, 190, 207–215. [Google Scholar] [CrossRef] [PubMed]
- Lassalle, M.; Chastang, J.F.; Niedhammer, I. Working conditions and psychotropic drug use: Cross-sectional and prospective results from the French national SIP study. J. Psychiatr. Res. 2015, 63, 50–57. [Google Scholar] [CrossRef] [PubMed] [Green Version]
- Niedhammer, I.; Malard, L.; Chastang, J.F. Occupational factors and subsequent major depressive and generalized anxiety disorders in the prospective French national SIP study. BMC Public Health 2015, 15, 200. [Google Scholar] [CrossRef] [Green Version]
- Kim, M.S.; Hong, Y.C.; Yook, J.H.; Kang, M.Y. Effects of perceived job insecurity on depression, suicide ideation, and decline in self-rated health in Korea: A population-based panel study. Int. Arch. Occup. Environ. Health 2017, 90, 663–671. [Google Scholar] [CrossRef] [Green Version]
- Ervasti, J.; Vahtera, J.; Virtanen, P.; Pentti, J.; Oksanen, T.; Ahola, K.; Kivimäki, M.; Virtanen, M. Is temporary employment a risk factor for work disability due to depressive disorders and delayed return to work? The Finnish Public Sector Study. Scand. J. Work. Environ. Health 2014, 40, 343–352. [Google Scholar] [CrossRef] [Green Version]
- Hammarström, A.; Virtanen, P.; Janlert, U. Are the health consequences of temporary employment worse among low educated than among high educated? Eur. J. Public Health 2011, 21, 756–761. [Google Scholar] [CrossRef] [Green Version]
- Quesnel-Vallée, A.; DeHaney, S.; Ciampi, A. Temporary work and depressive symptoms: A propensity score analysis. Soc. Sci. Med. 2010, 70, 1982–1987. [Google Scholar] [CrossRef] [Green Version]
- Burgard, S.A.; Brand, J.E.; House, J.S. Perceived job insecurity and worker health in the United States. Soc. Sci. Med. 2009, 69, 777–785. [Google Scholar] [CrossRef] [PubMed] [Green Version]
- Andrea, H.; Bultmann, U.; van Amelsvoort, L.G.; Kant, Y. The incidence of anxiety and depression among employees--the role of psychosocial work characteristics. Depress. Anxiety 2009, 26, 1040–1048. [Google Scholar] [CrossRef] [PubMed]
- Magnusson Hanson, L.L.; Chungkham, H.S.; Ferrie, J.; Sverke, M. Threats of dismissal and symptoms of major depression: A study using repeat measures in the Swedish working population. J. Epidemiol. Community Health 2015, 69, 963–969. [Google Scholar] [CrossRef] [PubMed]
- Johannessen, H.A.; Tynes, T.; Sterud, T. Effects of occupational role conflict and emotional demands on subsequent psychological distress: A 3-year follow-up study of the general working population in Norway. J. Occup. Environ. Med. 2013, 55, 605–613. [Google Scholar] [CrossRef]
- Wang, J. Perceived work stress and major depressive episodes in a population of employed Canadians over 18 years old. J. Nerv. Ment. Dis. 2004, 192, 160–163. [Google Scholar] [CrossRef]
- Rönnblad, T.; Grönholm, E.; Jonsson, J.; Koranyi, I.; Orellana, C.; Kreshpaj, B.; Chen, L.; Stockfelt, L.; Bodin, T. Precarious employment and mental health: A systematic review and meta-analysis of longitudinal studies. Scand. J. Work. Environ. Health 2019, 45, 429–443. [Google Scholar] [CrossRef]
- Taris, T.W.; Kompier, M.A.J. Cause and effect: Optimizing the designs of longitudinal studies in occupational health psychology. Work Stress 2014, 28, 1–8. [Google Scholar] [CrossRef]
- Canivet, C.; Aronsson, G.; Bernhard-Oettel, C.; Leineweber, C.; Moghaddassi, M.; Stengård, J.; Westerlund, H.; Östergren, P.O. The negative effects on mental health of being in a non-desired occupation in an increasingly precarious labour market. SSM Popul. Health 2017, 3, 516–524. [Google Scholar] [CrossRef]
- Rose, U.; Schiel, S.; Schroder, H.; Kleudgen, M.; Tophoven, S.; Rauch, A.; Freude, G.; Muller, G. The Study on Mental Health at Work: Design and sampling. Scand. J. Public Health 2017, 45, 584–594. [Google Scholar] [CrossRef] [Green Version]
- Spitzer, R.L.; Kroenke, K.; Williams, J.B. Validation and utility of a self-report version of PRIME-MD: The PHQ primary care study. Primary Care Evaluation of Mental Disorders. Patient Health Questionnaire. JAMA 1999, 282, 1737–1744. [Google Scholar] [CrossRef] [Green Version]
- Gräfe, K.; Zipfel, S.; Herzog, W.; Löwe, B. Screening psychischer Störungen mit dem ‘’Gesundheitsfragebogen für Patienten (PHQ-D)’’. Ergebnisse der deutschen Validierungsstudie [Screening of mental disorders with the “Patient Health Questionnaire Germany (PHQ-D)”. Results of a German validation study]. Diagnostica 2004, 50, 10. [Google Scholar]
- Manea, L.; Gilbody, S.; McMillan, D. A diagnostic meta-analysis of the Patient Health Questionnaire-9 (PHQ-9) algorithm scoring method as a screen for depression. Gen. Hosp. Psychiatry 2015, 37, 67–75. [Google Scholar] [CrossRef] [PubMed]
- Pejtersen, J.H.; Kristensen, T.S.; Borg, V.; Bjorner, J.B. The second version of the Copenhagen Psychosocial Questionnaire. Scand. J. Public Health 2010, 38 (Suppl. S3), 8–24. [Google Scholar] [CrossRef] [PubMed]
- Nübling, M.; Stößel, U.; Hasselhorn, H.M.; Michaelis, M. Measuring psychological stress and strain at work—Evaluation of the COPSOQ Questionnaire in Germany. GMS Psychol. Social. Med. 2006, 18, Doc05. [Google Scholar]
- Broughton, A.; Green, M.; Rickard, C.; Swift, S.; Eichhorst, W.; Tobsch, V.; Magda, I.; Lewandowski, P.; Keister, R.; Jonaviciene, D. Precarious Employment in Europe; European Parliament: Strasbourg, France, 2016. [Google Scholar]
- Börsch-Supan, A.; Brandt, M.; Hunkler, C.; Kneip, T.; Korbmacher, J.; Malter, F.; Schaan, B.; Stuck, S.; Zuber, S. Data Resource Profile: The Survey of Health, Ageing and Retirement in Europe (SHARE). Int. J. Epidemiol. 2013, 42, 992–1001. [Google Scholar] [CrossRef] [PubMed]
- Busch, M.A.; Maske, U.E.; Ryl, L.; Schlack, R.; Hapke, U. Prevalence of depressive symptoms and diagnosed depression among adults in Germany: Results of the German Health Interview and Examination Survey for Adults (DEGS1). Bundesgesundheitsblatt Gesundh. Gesundh. 2013, 56, 733–739. [Google Scholar] [CrossRef] [PubMed]
- Schmitt, M.; Altstötter-Gleich, C.; Hinz, A.; Maes, J.; Brähler, E. Normwerte für das Vereinfachte Beck-Depressions-Inventar (BDI-V) in der Allgemeinbevölkerung [Norm values for the simplified Beck Depression Inventory (BDI-V) in the general population]. Diagnostica 2006, 52, 8. [Google Scholar] [CrossRef]
- International Labor Office Staff. International Standard Classification of Occupations 2008 (ISCO-08): Structure, Group Definitions and Correspondence Tables; International Labour Office: Geneva, Switzerland, 2012. [Google Scholar]
- Wirth, H.; Gresch, C.; Müller, W.; Pollak, R.; Weiss, F. Validating the ESeC-Scheme as Operationalization of Social Class the Case of Germany; Mannheimer Zentrum für Europ. Sozialforschung: Mannheim, Germany, 2009. [Google Scholar]
- Miettinen, O.S. Proportion of disease caused or prevented by a given exposure, trait or intervention. Am. J. Epidemiol. 1974, 99, 325–332. [Google Scholar] [CrossRef]
- Rothman, K. Epidemiology. An Introduction; Oxford University Press: New York, NY, USA, 2002. [Google Scholar]
- De Vogli, R. Change, Psychosocial Stress and Health in an Era of Globalization. In Paper Prepared for the Project ‘Health and Social Upheaval’ Supported by the John and Catherine Mac Arthur Foundation; UCLA: Los Angeles, CA, USA, 2004. [Google Scholar]
- Lewchuk, W.; Clarke, M.; de Wolff, A. Working without commitments: Precarious employment and health. Work Employ. Soc. 2008, 22, 387–406. [Google Scholar] [CrossRef]
- Bisello, M.; Mascherini, M. The gender employment gap: Costs and policy responses. Intereconomics 2017, 52, 24–27. [Google Scholar] [CrossRef] [Green Version]
- Wiley, M.G. Gender, Work, and Stress: The Potential Impact of Role-Identity Salience And Commitment. Sociol. Q. 1991, 32, 495–510. [Google Scholar] [CrossRef]
- Kauhanen, M.; Nätti, J. Involuntary Temporary and Part-Time Work, Job Quality and Well-Being at Work. Soc. Indic. Res. 2015, 120, 783–799. [Google Scholar] [CrossRef]
- Eurostat Temporary Employees by Sex, Age and Main Reason. Available online: https://ec.europa.eu/eurostat/databrowser/view/LFSA_ETGAR/default/table?lang=en (accessed on 14 February 2022).
- Zapf, D.; Dormann, C.; Frese, M. Longitudinal studies in organizational stress research: A review of the literature with reference to methodological issues. J. Occup. Health Psychol. 1996, 1, 145–169. [Google Scholar] [CrossRef] [PubMed]
- Kim, I.H.; Muntaner, C.; Vahid Shahidi, F.; Vives, A.; Vanroelen, C.; Benach, J. Welfare states, flexible employment, and health: A critical review. Health Policy 2012, 104, 99–127. [Google Scholar] [CrossRef] [PubMed]
- Lie, S.A.; Tveito, T.H.; Reme, S.E.; Eriksen, H.R. IQ and mental health are vital predictors of work drop out and early mortality. Multi-state analyses of Norwegian male conscripts. PLoS ONE 2017, 12, e0180737. [Google Scholar] [CrossRef] [Green Version]
- de Groot, S.; Veldman, K.; Amick Iii, B.C.; Oldehinkel, T.A.J.; Arends, I.; Bültmann, U. Does the timing and duration of mental health problems during childhood and adolescence matter for labour market participation of young adults? J. Epidemiol. Community Health 2021, 75, 896–902. [Google Scholar] [CrossRef]
- Giver, H.; Faber, A.; Strøyer, J.; Hannerz, H.; Albertsen, K. Do lifestyle factors and general health predict dropout among recently qualified eldercare workers? A two-year follow-up study. Scand. J. Public Health 2011, 39, 280–286. [Google Scholar] [CrossRef]
- Veldman, K.; Reijneveld, S.A.; Verhulst, F.C.; Ortiz, J.A.; Bültmann, U. A life course perspective on mental health problems, employment, and work outcomes. Scand. J. Work. Environ. Health 2017, 43, 316–325. [Google Scholar] [CrossRef] [Green Version]
- de Lange, A.; Taris, T.W.; Kompier, M.A.J.; Houtman, I.; Bongers, P.M. The relationships between work characteristics and mental health: Examining normal, reversed and reciprocal relationships in a 4-wave study. Work Stress 2004, 18, 149–166. [Google Scholar] [CrossRef] [Green Version]
- Lang, J.; Bliese, P.D.; Lang, J.W.; Adler, A.B. Work gets unfair for the depressed: Cross-lagged relations between organizational justice perceptions and depressive symptoms. J. Appl. Psychol. 2011, 96, 602–618. [Google Scholar] [CrossRef]
- Ybema, J.F.; van den Bos, K. Effects of organizational justice on depressive symptoms and sickness absence: A longitudinal perspective. Soc. Sci. Med. 2010, 70, 1609–1617. [Google Scholar] [CrossRef] [PubMed]
- Elovainio, M.; Heponiemi, T.; Jokela, M.; Hakulinen, C.; Presseau, J.; Aalto, A.M.; Kivimäki, M. Stressful work environment and wellbeing: What comes first? J. Occup. Health Psychol. 2015, 20, 289–300. [Google Scholar] [CrossRef] [PubMed]
- Åhlin, J.K.; LaMontagne, A.D.; Magnusson Hanson, L.L. Are there bidirectional relationships between psychosocial work characteristics and depressive symptoms? A fixed effects analysis of Swedish national panel survey data. Occup. Environ. Med. 2019, 76, 455. [Google Scholar] [CrossRef] [PubMed] [Green Version]
- Eisinga, R.; Grotenhuis, M.; Pelzer, B. The reliability of a two-item scale: Pearson, Cronbach, or Spearman-Brown? Int. J. Public Health 2013, 58, 637–642. [Google Scholar] [CrossRef] [PubMed]
- Gutiérrez-Barbarrusa, T. The growth of precarious employment in Europe: Concepts, indicators and the effects of the global economic crisis. Int. Labour Rev. 2016, 155, 477–508. [Google Scholar] [CrossRef]
| Authors | Country | Baseline Year | n (Population) | Precarious Work Indicator | Outcome | Results, Overall | Results, Gender Strata |
|---|---|---|---|---|---|---|---|
| (Virtanen 2011) [19] | Sweden | 1995 | 1005 (30 years old and over) | Temporary employment and/or job insecurity | Poor mental health (GHQ) | OR 2.33 (0.99 to 5.51) | - |
| (Rugulies 2010) [21] | Denmark | 2000 | 5142 (Adult workers) | Job insecurity and/or previous prolonged unemployment | Antidepressant medication | OR 1.79 (1.15–2.79) | - |
| (Sirviö 2012) [23] | Finland | 1997 | 3449 (31 year olds) | Discontinuous work history, current fixed-term and/or part-time employment | Poor mental health (HSCL–25) | M: OR 1.6 (1.1–2.3): W: OR1.4 (1.1.–1.9) | |
| (Waenerlund 2011) [20] | Sweden | 1995 | 985 (42 year olds) | Labour market program, on-call, seasonal, temporary agency, probationary, project employed and/or self-employed | Poor mental health | - | M: OR 2.18 (1.14–4.20); W: OR 1.79 (0.98–3.29) |
| (Wege 2017) [22] | Germany | 2009 | 7354 (Adult workers) | Insecure job or long-term unemployment | Self-reported physician diagnosed depression | RR 2.30 (1.40; 3.79) | - |
| (Canivet 2016) [24] | Sweden | 1999/2000 | 786 (Workers 18–34 years) | Unemployment, temporary employment, and/or perceived job insecurity | Poor mental health (GHQ–12) | RR 1.5 (1.1–2.0) Attributable fraction 18% | M: RR 2.5 (1.7–3.5) F: RR 1.8 (1.4–2.3) [42] 1 |
| Authors | Country | n (Population) | Baseline Year | Precarious Work Indicator | Outcome | Results, Overall | Results, Gender Strata |
|---|---|---|---|---|---|---|---|
| Rönnblad (2019) [40] | Sweden, Norway, Denmark, Netherlands, France, Canada, US [19,21,26,27,29,30,31,35,36,37,38,39,40] | 59,443 10 cohorts on adult workers and one cohort on young workers | 1986–2008 | Perceived job insecurity | Depression (HAD-D; SCL-CD6; MINI, CIDI-SFMD) depressive symptoms/poor mental health (CES-D; MH–5), psychological distress (GHQ–12, other), drug use (self-report, register) | Meta-analysis: OR 1.52 (1.35–1.70) | Danish Work Environment Cohort Study-poor mental health: M: 2.09 (1.04–4.20); F: 1.04 (0.62–1.74) [26]. Maastricht Cohort Study-psychological distress: M: OR 1.83 (1.33–2.51); F: 1.03 (0.62–1.71) [27]. French Santé et Itinéraire Professionnel (SIP) survey A: psychotropic drug use: job insecurity interacted with gender and was significant for men (RR = 1.38, 95% CI:1.12;1.69), but not for women [29]. B: self-reported major depressive disorder (MINI): job insecurity did not interact with gender [43]. |
| Kim et al. (2017) [31] | South Korea | 2.912 Adult workers | 2012 | Perceived job insecurity | Depressive symptoms (CES-D–11) | - | M: HR: 1.73 (1.16–2.59) F: HR: 1.05 (0.69–1.59) |
| Wege 2017 [22] | Germany | 7.354 Adult workers | 2009 | Perceived job insecurity | Diagnosed depression | RR 1.54 (1.18; 2.01) | - |
| LaMontagne (2020) [28] | Australia | 19,169 Adult workers | 2011–2014 | Job insecurity | Good mental health (MH–5) | - | M Beta: 0.34 (0.21–0.47) F: Beta: 0.09 –0.04–0.22 1 |
| Ervasti (2014) [32] | Finland | 107,828 | 2005 | Fixed-term contract Temporary employment | Sickness absence: depression | OR 1.02 (0.97–1.08) | - |
| Hammarström (2011) [33] | Sweden | 660 | 1995 | Fixed-term contract Temporary employment | Depressive symptoms (1-item) | OR 1.79 (1.04–3.08) | - |
| Quesnel-Vallée (2010) [34] | US | 3.577 | 1994 | Fixed-term contract Temporary employment | Depressive symptoms (CES-D) | ATT 1.803 (0.552–3.055) | - |
| Wege (2017) [22] | Germany | 7.354 | 2009 | Unemployment | Diagnosed depression | RR 1.64 (1.16; 2.31) | - |
| Hollander (2013) [25] | Sweden | 3,284,896 (register study) | 2000 | Unemployment | Hospitalisation: depression | - | M: RR 2.3 (2.19–2.49); F: 1.62 (1.53–1.73) |
| Baseline (2012) Participation of the Drawn Sample a; % | Follow-up (2017) Participation Among Baseline (2012) Employees b, % | Cohort Participation 2017 of the Drawn Sample c, % | ||||
|---|---|---|---|---|---|---|
| p Value d | % | p Value d | % | p Value d | % | |
| GENDER | 0.746 | 0.081 | 0.141 | |||
| Men | 33 | 58 | 19 | |||
| Women | 33 | 60 | 20 | |||
| AGE | 0.000 | 0.055 | 0.000 | |||
| 55–60 | 39 | 59 | 23 | |||
| 49–54 | 35 | 62 | 22 | |||
| 43–48 | 33 | 60 | 20 | |||
| 37–42 | 32 | 59 | 19 | |||
| 31–36 | 27 | 54 | 15 | |||
| SEP e | 0.000 | 0.000 | 0.000 | |||
| Professionals, managers | 38 | 66 | 25 | |||
| Semi-professionals | 38 | 62 | 24 | |||
| Skilled workers | 32 | 55 | 17 | |||
| Unskilled workers | 29 | 51 | 15 | |||
| TOTAL | 33 | 59 | 20 | |||
| Variable | n | % | Job Insecurity 2012, % | Marginal Part–Time 1 2012, % | Fixed- Term Contract 2012, % | Low Wage 2012, % | Unemployed 2012 to 2017, % |
|---|---|---|---|---|---|---|---|
| Gender 2012 | 0.008 | <0.001 | 0.080 | <0.001 | 0.007 | ||
| Women | 1008 | 50 | 20 | 10 | 6 | 16 | 8 |
| Men | 1001 | 50 | 20 | 1 | 4 | 5 | 5 |
| Partner 2012 | 0.138 | 0.404 | 0.014 | 0.920 | 0.207 | ||
| Yes | 1768 | 87 | 20 | 5 | 4 | 11 | 6 |
| No | 241 | 13 | 24 | 4 | 8 | 11 | 8 |
| Age group 2012 | <0.001 | 0.160 | 0.613 | 0.705 | 0.271 | ||
| 31–40 years | 455 | 22 | 11 | 4 | 5 | 10 | 7 |
| 41–55 years | 1251 | 63 | 22 | 6 | 5 | 11 | 6 |
| 56–60 years | 303 | 15 | 23 | 6 | 4 | 10 | 8 |
| SEP 2012 | <0.001 | <0.001 | <0.001 | <0.001 | 0.053 | ||
| Unskilled workers | 109 | 5 | 34 | 24 | 11 | 33 | 8 |
| Skilled workers | 817 | 41 | 26 | 7 | 5 | 16 | 8 |
| Semi-professionals | 572 | 28 | 16 | 3 | 2 | 5 | 5 |
| Professionals, managers | 511 | 25 | 12 | 1 | 5 | 3 | 5 |
| Job insecurity 2012 | 0.753 | <0.001 | 0.003 | <0.001 | |||
| High | 403 | 20 | 5 | 9 | 15 | 12 | |
| Low to medium | 1606 | 80 | 5 | 4 | 10 | 5 | |
| Marginal part-time 2012 | 0.753 | <0.001 | <0.001 | <0.001 | |||
| Yes | 106 | 5 | 19 | 12 | 59 | 15 | |
| No | 1903 | 95 | 20 | 4 | 8 | 6 | |
| Fixed-term contract 2012 | <0.001 | <0.001 | <0.001 | <0.001 | |||
| Yes | 95 | 5 | 40 | 14 | 23 | 17 | |
| No | 1914 | 95 | 19 | 5 | 10 | 6 | |
| Low wage 2012 | 0.003 | <0.001 | <0.001 | <0.001 | |||
| Yes | 213 | 11 | 28 | 30 | 10 | 13 | |
| No | 1796 | 89 | 19 | 2 | 4 | 5 | |
| Unemployed 2012 to 2017 | <0.001 | <0.001 | <0.001 | <0.001 | |||
| Yes | 126 | 6 | 37 | 13 | 13 | 22 | |
| No | 1883 | 94 | 19 | 5 | 4 | 10 |
| n | Depressive Symptoms at Follow-Up 2017 1, % | Each Precarious Work Indicator Separately in the Model | Indicators of Precarious Work Mutually Adjusted | |||||
|---|---|---|---|---|---|---|---|---|
| Adjusted for Baseline (2012) Age, Partnership Status and SEP 2 | Adjusted for Baseline (2012) Age, Partnership Status and SEP 2 | |||||||
| p | OR | 95% CI | p | OR | 95% CI | |||
| JOB INSECURITY 2012 | 0.003 | 0.015 | ||||||
| Low to medium | 801 | 4 | 1 | 1 | ||||
| High | 200 | 10 | 2.47 | 1.37; 4.48 | 2.13 | 1.16; 3.92 | ||
| MARGINAL PART-TIME 3 2012 | 0.565 | 0.915 | ||||||
| No | 992 | 5 | 1 | 1 | ||||
| Yes | 9 | 11 | 1.9 | 0.22;16.53 | 1.13 | 0.11; 11.45 | ||
| FIXED-TERM 2012 | 0.128 | 0.435 | ||||||
| No | 962 | 5 | 1 | 1 | ||||
| Yes | 39 | 13 | 2.2 | 0.80; 6.06 | 1.55 | 0.52; 4.66 | ||
| LOW WAGE 2012 | 0.002 | 0.008 | ||||||
| No | 952 | 5 | 1 | 1 | ||||
| Yes | 49 | 18 | 3.79 | 1.64; 8.72 | 3.22 | 1.36; 7.63 | ||
| n | Depressive Symptoms at Follow-Up 2017 1, % | Each Precarious Work Indicator Separately in the Model | Indicators of Precarious Work Mutually Adjusted | |||||
|---|---|---|---|---|---|---|---|---|
| Adjusted for Baseline (2012) Age, Partnership Status and SEP 2 | Adjusted for Baseline (2012) Age, Partnership Status and SEP 2 | |||||||
| p | OR | 95% CI | p | OR | 95% CI | |||
| JOB INSECURITY 2012 | 0.142 | 0.209 | ||||||
| Low to medium | 805 | 8 | 1 | 1 | ||||
| High | 203 | 11 | 1.48 | 0.88; 2.50 | 1.41 | 0.83; 2.40 | ||
| MARGINAL PART-TIME 3 2012 | 0.497 | 0.412 | ||||||
| No | 911 | 9 | 1 | 1 | ||||
| Yes | 97 | 7 | 0.74 | 0.31; 1.75 | 0.69 | 0.28; 1.68 | ||
| FIXED-TERM 2012 | 0.413 | 0.551 | ||||||
| No | 952 | 9 | 1 | 1 | ||||
| Yes | 56 | 13 | 1.42 | 0.61; 3.32 | 1.30 | 0.55; 3.08 | ||
| LOW WAGE 2012 | 0.595 | 0.478 | ||||||
| No | 844 | 9 | 1 | 1 | ||||
| Yes | 164 | 9 | 1.19 | 0.63; 2.22 | 1.27 | 0.66; 2.47 | ||
| Male Employees | Female Employees | |||||||||
|---|---|---|---|---|---|---|---|---|---|---|
| n | Depressive Symptoms at Follow-Up 2017 1, % | Adjusted for Baseline (2012) Age, Partnership Status and SEP 3 | n | Depressive Symptoms at Follow-up 2017 1, % | Adjusted for Baseline (2012) Age, Partnership Status and SEP 3 | |||||
| p | OR | 95% CI | p | OR | 95% CI | |||||
| UNEMPLOYMENT 2012–2017 2 | 0.012 | 0.142 | ||||||||
| No | 953 | 5 | 1 | 930 | 8 | 1 | ||||
| Yes | 48 | 15 | 3.07 | 1.28; 7.37 | 78 | 13 | 1.71 | 0.84; 3.49 | ||
| Male Employees | Female Employees | |||||||||
|---|---|---|---|---|---|---|---|---|---|---|
| n | Depressive Symptoms at Follow-up 2017 1, % | Adjusted for Baseline Age, Partnership Status and SEP 3 | n | Depressive Symptoms at Follow-up 2017 1, % | Adjusted for Baseline Age, Partnership Status and SEP 3 | |||||
| p | OR | 95% CI | p | OR | 95% CI | |||||
| PRECARIOUS WORK INDEX 2012–2017 2 | 0.000 | 0.166 | ||||||||
| 0 | 748 | 4 | 1 | 645 | 8 | 1 | ||||
| 1 | 210 | 7 | 1.84 | 0.94; 3.60 | 288 | 10 | 1.52 | 0.93; 2.49 | ||
| ≥2 | 43 | 26 | 7.65 | 3.30; 17.73 | 75 | 11 | 1.74 | 0.76; 3.98 | ||
Publisher’s Note: MDPI stays neutral with regard to jurisdictional claims in published maps and institutional affiliations. |
© 2022 by the authors. Licensee MDPI, Basel, Switzerland. This article is an open access article distributed under the terms and conditions of the Creative Commons Attribution (CC BY) license (https://creativecommons.org/licenses/by/4.0/).
Share and Cite
Demiral, Y.; Ihle, T.; Rose, U.; Conway, P.M.; Burr, H. Precarious Work as Risk Factor for 5-Year Increase in Depressive Symptoms. Int. J. Environ. Res. Public Health 2022, 19, 3175. https://doi.org/10.3390/ijerph19063175
Demiral Y, Ihle T, Rose U, Conway PM, Burr H. Precarious Work as Risk Factor for 5-Year Increase in Depressive Symptoms. International Journal of Environmental Research and Public Health. 2022; 19(6):3175. https://doi.org/10.3390/ijerph19063175
Chicago/Turabian StyleDemiral, Yucel, Tobias Ihle, Uwe Rose, Paul Maurice Conway, and Hermann Burr. 2022. "Precarious Work as Risk Factor for 5-Year Increase in Depressive Symptoms" International Journal of Environmental Research and Public Health 19, no. 6: 3175. https://doi.org/10.3390/ijerph19063175
APA StyleDemiral, Y., Ihle, T., Rose, U., Conway, P. M., & Burr, H. (2022). Precarious Work as Risk Factor for 5-Year Increase in Depressive Symptoms. International Journal of Environmental Research and Public Health, 19(6), 3175. https://doi.org/10.3390/ijerph19063175