Abstract
Phenanthrene (PHE) is a typical compound biomagnified in the food chain which endangers human health and generally accumulates from marine life. It has been listed as one of the 16 priority PAHs evaluated in toxicology. In order to evaluate the changes of CYP1A GST mRNA expression and EROD GST enzyme activity in carp exposed to lower than safe concentrations of PHE. Long-term exposure of carp to PHE at lower than safe concentrations for up to 25 days. The mRNA expression level and cytochrome P450 (CYP1A/EROD (7-Ethoxylesorufin O-deethylase)) and glutathione S-transferase (GST) activity were measured in carp liver and brain tissue. The results showed that PHE stress induced low-concentration induction and high-concentration inhibition of CYP1A expression and EROD enzyme activity in the liver and brain of carp. In both two organs, GST enzyme activity was also induced. However, the expression of GST mRNA was first induced and then inhibited, after the 15th day. These results indicate that long-term exposure to PHE at lower than safe concentrations still poses a potential threat to carp’s oxidase system and gene expression.
1. Introduction
Polycyclic aromatic hydrocarbons (PAHs) are a widespread pollutant which derived from the incomplete combustion of various fossil fuels and hydrocarbons, such as coal and petroleum. Due to the stable chemical properties and harmful effects, PAHs have become persistent organic pollutants (POPs) and threaten environment and even human beings. Especially, PAHs are known to induce stress and affect marine organisms health [1]. According to the combined structure of benzene rings, PAHs can be divided into two categories: fused ring type and non-fused ring type. Phenanthrene (PHE, C14H10) is a representative of the fused ring PAHs [2]. It is a low-molecular-weight PAH-composed of three fused benzene rings with bay-area and K-area, and its carcinogenicity is closely related to K-area [3]. Due to the small molecular weight of PHE, it is more easily bio-amplified than other PAHs and produces toxic effects [4] like acute lethal effect on aquatic organisms at individual level [5] which further limits individual development [6], reproduction and other behaviors [7,8]. At the levels of cells, tissues, and organs, PHE can cause histopathological changes in organisms [9,10]. Carp (Cyprinus carpio), as a traditional freshwater economic fish in China, has been widely used in the ecotoxicity tests of environmental pollutants [11,12]. However, the study of carp genes expressions and enzymes activities after low dose PHE exposure were seldom reported. Therefore, it is necessary to explore the molecular response of carp-specific genes and characteristic metabolic enzymes in PHE pollution stress.
Current studies on low-molecular-weight PAHs in China have mainly focused on their sources and distributions in rivers and lakes [13,14]. Concentrations of PAHs in the waters of Hangzhou, Qiantang River, and Daya Bay reached 989~9663 ng/L, 70.3~1844.4 ng/L and 10984~19445 ng/L, respectively. The effects of high concentrations of PAHs on aquatic organisms were extensively explored [15,16], but the effects of pollutants below safe concentrations on aquatic organisms were still elusive. In the study, the acute toxicity of PHE to carp was tested and the 96-h lethal concentration and safe concentration of PHE to carp were determined. In the experiment, carp were exposed to the PHE at concentrations below safe levels to explore the changes in the activities of characteristic enzymes and characteristic genes expression involved in carp metabolism.
Cytochrome P450 (CYP) enzymes were reported as the biomarkers to estimate the influences of persistent organic pollutants (POPs) on various aquatic organisms [17,18,19]. PAHs, which are known agonists for controlling aromatic hydrocarbon receptors [20,21], could induce the expressions of Phase I and Phase II metabolism enzymes including cytochrome P4501A (CYP1A) and glutathione S-transferase (GST).
Although there have been toxicological studies on PHE stress on aquatic organisms, most of the tested organisms are zebrafish, medaka, tilapia, etc. Moreover, most of the exposure concentrations of phenanthrene are concentrated in high or low concentrations. There are not many articles about carp characteristic gene expression and characteristic enzyme activity changes in the environment of carp long-term exposure to lower than safe concentration of PHE [22,23,24]. Carp is a common freshwater fish in China that can be eaten by humans. It is very important to explore the mechanism of carp being enriched at a safe concentration. This study provides a more complete explanation of the mechanism of action of PHE in carp at lower than safe concentrations.
In this study, the acute toxicity test of PHE was firstly performed on carp, and the PHE concentration group was set for subacute toxicity test according to the measured 96h-LC50, and the safe concentration was calculated to be 1.12 mg/L. Although the toxicity test of PHE to aquatic organisms in natural water has been studied [25], this experiment is higher than that of PHE in natural water but lower than the safe concentration of carp. Long-term exposures were conducted to explore the chronic effects of PHE on carp. The study aimed to explore the activity changes of Phase I and Phase II metabolic characteristic enzymes (cytochrome P450 enzyme (EROD) and glutathione S-transferase (GST) in carp under the exposure to PHE below safe concentration in different organs and determine the changes in the expression levels of characteristic genes of CYP1A and GST, which controlled the activities of EROD and GST. In addition, the correlations between the expressions of characteristic enzymes (EROD, GST) from metabolic process and the expressions of characteristic genes (CYP1A, GST) under the exposure to PHE at or below safe concentration were further discussed. We illustrated the responses of carp metabolizing characteristic genes and characteristic enzymes to low concentrations of PHE.
2. Materials and Methods
2.1. Main Reagents
Phenanthrene (PHE, 95%) was bought from Beijing Braun Technology Ltd. Diethy pyrocarbonate (DEPC), Spin Column Animal Total RNA Purification Kit, and M-MuLV First Strand cDNA Synthesis Kit were obtained from Sangon Biotech (Shanghai, China). Taq Plus PCR MasterMix was bought from Tiangen Biotech (Beijing, China). Agarose was bought from Aladdin. TAE loading buffer and DNA loading buffer were configured according to general methods [26]. Fish 7-ethoxyresorufin-o-deethylase (EROD) kit and fish glutathione S transferase (GST) kit came from Jianglai Biotechnology (Shanghai, China). Fish ELISA kits of the enzymes of EROD and GST were bought from Jianglai Biotechnology (Shanghai, China). Albumin from bovine serum (BSA) was bought from Jiancheng Bioengineering (Nanjing, China).
2.2. Fish and Treatment
Carp (Cyprinus carpio, body weight (9.0~11.0 g) and body length (8.0 ± 10.0 cm)) were obtained from a fish farm in Songjiang, Shanghai, China. The experimental carp were domesticated in seven groups of 10-L glass tanks under natural conditions for 2 weeks, each group for 10 fish. All tanks were supplied with continuous aeration to maintain nearly saturated dissolved oxygen. Dechlorinated tap water was used at a temperature of 20 ± 2 °C, pH 6.8~7.3, with light intensity of 100 Lux for 10 h/d for 25 d and fed twice a day and clean up metabolites on time to ensure that the mortality rate during domestication is less than 1%, and 4 d before the start of the experiment, ensure that there was no fish death. Three treatment groups were exposed to waterborne PHE in acetone under the concentrations of 0.1, 0.5, and 1.0 mg/L (the final content of acetone was less than 0.5%) In addition, the 0 mg/L PHE as the negative control (dechlorinated water) was established. The parallel groups of each concentration were set in other three 10-L tanks at 20.0 ± 2 °C. After the exposure for 1 days, 5 days, 15 days and 25 days (We define 1–5 days as “early period”), the brain and liver of fish were dissected, placed in 1.5-mL microcentrifuge tubes, frozen in liquid nitrogen immediately, and then stored at −80 °C until further analysis. A part of one sample was ground fully in a vessel with liquid nitrogen to analyze the expressions of relevant genes. Another part of the sample was ground fully with a glass homogenate device with PBS to detect the activities of related enzymes. All samples are homogenized before separation.
2.3. Acute Toxicity Test
The PHE dose was set to 5, 10, 20, 30, 40, 50 mg/L (the final content of acetone was less than 0.5%) using the aquatic toxicity test method, and each group was 10 pieces of fish. The pre-test first showed that the carp did not die in 96 h. The highest dose and the lowest dose for all deaths in 24 h. During the test, no feed was fed, semi-static exposure was performed, and the water was changed 50% every day. The activity status of the carp was observed over time and the number of dead fish was counted in time.
The acute toxicity experiment was conducted according to the SECP-Part 12: Fish Acute Toxicity Test (GB/T 31270.12-2014). PHE in eight tanks was set according to equidistant logarithmic concentrations at 5.01, 6.31, 7.94, 10.00, 12.59, 15.85, 19.95, and 25.12 mg/L and there were 10 fish in each tank. Three replicates were arranged for each concentration. In the acute test, after 96 h, the mortality was recorded. The carp were not fed during the test period and water was replaced once a day.
Dead fish were identified according to the following method. Carp were transferred to clear water for 30 s and the fishtail was touched with a glass rod. If there was no visible response, carp were considered to be dead.
The safe concentration (SC) is expressed as follows:
2.4. RNA Extraction and Analysis
All samples from the experimental fish were firstly ground into fine powder under liquid nitrogen. Total RNA was extracted with Trizol Reagent (Sangon, China) according to the manufacturer’s instructions. Then the OD (Optical density) values of samples at 260 nm and 280 nm were measured. The RNA sample purity was calculated with Equation (2). Finally, based on the calculation results, the integrity of RNA was detected by 1.5% agarose gel electrophoresis (Figure S1).
The purity of RNA is expressed as:
If ω is between 1.8 and 2.0, the RNA sample is qualified; if ω is less than 1.8, the sample is contaminated; if ω is larger than 2.0, the RNA sample is degraded.
2.5. Gene Primer Design and Semi-Quantitative RT-PCR (Sq-RT-PCR) Analysis
After RNA extraction, the RNA was reversely transcribed with the cDNA Synthesis Kit (Sangon, China) according to the manufacturer’s protocol (Figures S2 and S3). Then, the mRNA levels were expressed as the ratios relative to the transcription level of the β-action. Primer Premier 5.0 was used to design the primers according to two ends of the target gene based on the sequence of carp CYP1A (accession: AB048939.1) and GST (accession: LC071505.1) (Table 1).

Table 1.
Semi-quantitative RT-PCR (Sq-RT-PCR)primers of Cyprinus carpio genes.
We performed Sq-RT-PCR to check the changes in GST and CYP1A mRNA levels in the carp liver and your brain. For Sq-RT-PCR amplification, each reaction included 10 μL Taq Plus PCR MasterMix, 0.4 μL 10 μmol·L−1 specific primer F, 0.4 μL 10 μmol·L−1 specific primer R and 1 μL cDNA. (all are the configuration in the kit instructions). The reaction conditions are as follows: 94 °C/5 min; 35 cycles of 94 °C/30 s, 55 °C/30 s, 72 °C/30 s; and 72 °C/10 min. We used the β-actin gene as a reference sample for the relative expression levels between normalizations. The product was subject to agarose gel electrophoresis to detect the amplified product, using the UVitec Cambridge scanning system and the software ImageQuant TL (GE Healthcare). All mRNA data represent normalization for any difference in reverse transcriptase efficiency relative to β-actin.
2.6. EROD and GST Activities
The total protein content was determined with the method of Bradford protein assay [27]. EROD activity was determined with the EROD Synthesis Kit (Jianglai, China) according to the manufacturer’s protocol. The samples of the brain and liver were homogenized in an ice-cold homogenization buffer (0.125 M Na2HPO4∙12H2O, 0.125 M KH2PO4, 0.05 mM Na2EDTA, pH = 7.7) and the supernatant was prepared by centrifugation (10,000 rpm, 10 min). The sample mixture (50 μL) was firstly placed in an enzyme-labeled plate and then 100 μL of HRP-labeled enzyme-labeled antibody was added for the reaction at 37 °C for 10 min. After the supernatant was poured, the PBS solution was added and products were washed five times. Reactions were stopped by adding 50 μL of 2 M H2SO4 into each tube and the supernatant was determined at OD450. The GST activities were determined with GST Synthesis Kit (Jianglaibio, China) according to the manufacturer’s protocol. Other steps were similar to those of the EROD kit.
2.7. Statistical Analysis
In the statistical analysis, the data were expressed as mean value ± standard deviation (SD). In SPSS 20.0 software (IBM software, Inc., Chicago, IL, USA), one-way ANOVA was carried out. Duncan’s method was used to make the multiple comparisons of the means and p < 0.05 indicates a significant difference. All figures were drawn by Excel. A correlation analysis was performed to evaluate the relationship between EROD activity and CYP1A mRNA expression, as well as the correlation between GST activity and GST mRNA expression.
The Gel imaging analysis system (GIS) can quantify the optical density of DNA bands into a spectrum, and automatically integrate it to calculate the response value. The size of the response value can indirectly reflect the content of DNA. Therefore, the amount of mRNA expression from DNA can be obtained by the inverse calculation.
3. Results and Discussion
3.1. Median Lethal Concentration (LC50) and Safe Concentration of Carp
According to the experimental procedure of Section 2.3, the acute toxicity dose gradient pre-experiment was first carried out, and the lowest and highest doses of carp death at 24 h and 96 h were recorded: the highest dose of PHE that did not cause death in 96 h was 5 mg/L, the lowest dose of all death in 24 h was 40 mg/L, and when the dose was 20 mg/L, the 96-h mortality rate of carp was about 90%. At 30 mg/L, all carps died within 96 h (Data not shown). Therefore, the acute toxicity dose gradient exposure is set in the range of 5–25 mg/L.
The lethal concentration of PHE for carp are shown in Table 2. With the increase in the concentration of PHE, the mortality of carp also increased, displaying a significant dose-toxicity effect. Furthermore, the regression equations between the probability unit of carp mortality and the logarithmic concentration of PHE after 24-h (Equation (3)) and 96-h (Equation (4)) cultivation were respectively obtained as follows:
(Y: Probability unit of mortality; X: logarithmic concentration).
Y = 3.970 2X + 0.2275, r2 = 0.9388
Y = 0.479 8X + 0.30, r2 = 0.9229
Table 2.
LC50 of Cyprinus carpio after 24-h and 96-h exposure to PHE.
The carp’s LC50 value of PHE after 24 h and 96 h were respectively determined as 15.926 mg/L (95% confidence interval: 14.675–17.282 mg/L) and 11.198 mg/L (95% confidence interval: 9.950–12.604 mg/L). According to the classification standard for acute toxicity of fish [8], PHE is highly toxic to carp. According to Equation (1), the safe concentration of PHE to carp was calculated to be 1.12 mg/L.
3.2. Gene Extraction Efficiency
DNA amplification samples were subjected to preset denaturation temperature, cycle parameters, and final repair extension on a gradient PCR instrument. The agarose gel electrophoresis result of 5 μL of samples is shown in Figure S4. The three genes were loaded and electrophoresed simultaneously. From left to right, they were respectively CYP1A, GST, and β-ACTIN, a commonly used internal reference gene. According to the mobility of each DNA and the indication of the marker, the length of DNA fragments in the PCR sample was between 500 bp and 550 bp. Compared with the β-ACTIN gene, the GST gene fragment was shorter and had a higher electrophoretic mobility, followed by CYP1A. The target genes were specifically amplified and showed good integrity. Therefore, the samples could be used for the semi-quantitative analysis, recovery, and sequencing for further gene comparison.
The sequencing and splicing results of CYP1A and GST genes and alignment results obtained from the gene bank (NCBI, National Center for Biotechnology Information) are shown in Table 3. The lengths of the two amplified genes (CYP1A and GST) were respectively 503 bp and 541 bp. Similarly, the amplified gene had a high similarity of greater than 99% to the target gene in the gene bank. Therefore, the entire RNA extraction, reverse transcription and PCR operations could be qualified.
Table 3.
Alignment results of sequenced results of amplified target genes a.
3.3. CYP1A mRNA Expression and EROD Activity after the Exposure to PHE
The CYP1A mRNA expression in carp tissues are showed in Figure 1. We examined the effect of 0 mg/L PHE in the brain and liver as negative control. Pearson correlation indicated the significant correlation between CYP1A mRNA concentration and time in both brain and liver. CYP1A mRNA expression levels in the liver showed a significant increase compared with those in the control group during 25-day exposure to PHE (Figure 1a) and the induction trend gradually became more significant during the exposure. CYP1A mRNA levels were induced significantly by 0.50 mg/L PHE during the 25-day exposure. In the brain, CYP1A mRNA levels were significant induced compared with those in the control, but the induction effect was not significantly enhanced with the increase in exposure time or doping concentration (Figure 1b).
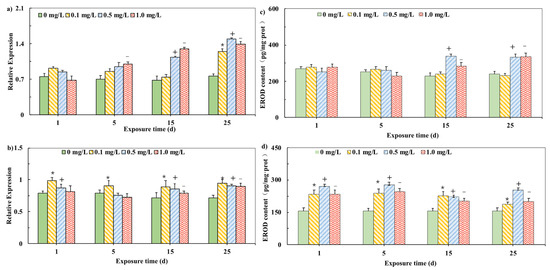
Figure 1.
Relative mRNA expression of CYP1A in liver (a) and brain (b) of carp exposed to PHE. Effects of different PHE concentrations on EROD activities in carp (c) in the liver. (d) in the brain (The final expression results are based on the content of characteristic proteins in the mass of each tissue unit of the carp.). Expression was quantified by Sq-RT-PCR. Values are mean ± SD of three replicates. Significant differences, p < 0.05. (*) are under 0.1 mg/L versus negative control of 1 d; (+) are under 0.5 mg/L versus negative control of 1 d; (−) are under 1.0 mg/L versus negative control of 1 d, which is based on Duncan’s method.
To detect whether the change in CYP1A mRNA brought about the change of related metabolic characteristic enzymes, the enzyme activity of EROD was tested (Figure 1) We examined the effect of 0 mg/L PHE in the brain and liver as negative control. In the liver, the EROD activity did not change significantly in the initial stage, but all experimental groups resulted in a significant EROD induction in the liver in the 15th day and 25th day (Figure 1c). In the brain, the activity of EROD in the early period of PHE exposure (Day 1, 5 and 15) was significantly induced compared with the control assays, (p < 0.05). However, on Day 25, the induction was not significant (Figure 1d). The activity induction trend of the EROD enzyme in the liver and brain is consistent with the mRNA expression trend of CYP1A. It shows that long-term exposure of carp to a safe concentration of PHE will stimulate the expression of CYP1A mRNA in the liver of carp and the increase in mRNA expression of CYP1A reflects an increase in protein functionality [28].
It widely reported that when an organism is exposed to pollutants such as heavy metals and persistent organic pollutants (POPs), the activity of antioxidant enzymes will be affected [29]. Cytochrome P450 enzyme (CYP450) is widely present in organisms and is an important metabolic enzyme involved in the conversion of many heterologous compounds [30]. CYP1A is a member of the cytochrome P450 family. CYP1A enzyme activity is considered to be an indicator of fish resistance to PAH.
Previous studies have shown that mild oxidative stress can induce the activity of antioxidant enzymes such as SOD and GST [31]. However, when oxidative stress reaches a certain level, the activity of antioxidant enzymes will be inhibited [32]. In this study, the expression of CYP1A mRNA and the activity of EROD enzyme in the liver and brain increased with time and concentration. Moreover, the level of induction in the liver is more pronounced than in the brain. The liver is a key site of detoxification and an important target organ of PAHs [33]. EROD is the important enzyme assisting in the metabolism of toxic compounds. If pollutants enter the body, the organism starts stress reactions. The differential responses of transcription and expression of characteristic genes can be used as early warning parameters to measure the degree of environmental pollution. The change in CYP1A mRNA expression in the liver and brain of carp was the consequence of the stimulation of the signaling pathway. If the concentration of PHE was too high, it might cause damage and inhibit the gene expression and enzyme activity [20]. Similar to previous reports, after intraperitoneal injection of TCDD in goldfish, it was also found that the expression of CYP1A mRNA was induced in various tissues, and the induction effect was most significant in liver tissues. It was reported that after the exposure of medaka to pentachlorobiphenyl, CYP1B1 and CYP1C1 mRNA expressions were induced due to the acceleration of Phase I metabolic response [34]. If a pollutant entered the carp body, the organism could defend itself by stimulating the production of Phase I- and Phase II-related enzymes degrading external compounds. However, if excessive external substances existed, the body defense mechanism became destroyed.
A similar phenomenon was observed in the liver of tilapia (Oreochromis niloticus). The short-term exposure to a low concentration of PHE induced EROD activities in the liver of tilapia (Oreochromis niloticus), whereas the long-term exposure to a high concentration of PHE inhibited EROD activities [35]. It was also found that several PAHs with lower molecular weights caused the differential expressions of P450 enzymes [36]. It was also reported that a low concentration of PHE activated EROD in young Sparus aurata, but inhibited it under high concentration [37]. In the brain and liver of carp, the activity of EROD showed an obvious correlation with the expression level of CYP1A. Many compounds could induce EROD activity of fishes and the induction of EROD activity might be impeded as chemicals were competitively bound to the structure of AhR or CYP1A [38].
3.4. GST mRNA Expression and GST Activity after the Exposure to PHE
The GST mRNA expressions in carp tissues are shown in Figure 2. In the liver, the expression of GST mRNA was always induced when carp was exposed to 0.1 mg/L PHE and the induction effect was weakened in the 25th day. However, the exposure to 0.5 and 1.0 mg/L PHE showed a significant inhibition effect on GST mRNA expression from the first day to the 25th day (Figure 2a). In the brain, the experimental groups of different concentrations showed the significant induction in the first day and the induction effect was reduced in the 5th day. During the PHE exposure period, the expression of GST mRNA showed a significant inhibitory effect in the 15th day and the 25th day (Figure 2b).
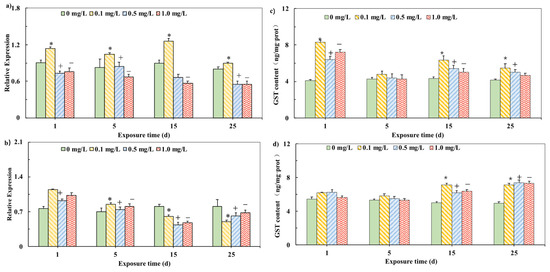
Figure 2.
Relative mRNA expression of GST in liver (a) and brain (b) of carp exposed to PHE. Effects of different PHE concentrations on GST activities in the liver (c). and the brains (d) of carp (The final expression results are based on the content of characteristic proteins in the mass of each tissue unit of the carp.) Expression was quantified by Sq-RT-PCR. Values are mean ± SD of three replicates. Significant differences, p < 0.05 [26]. (*) are under 0.1 mg/L versus negative control of 1 d; (+) are under 0.5 mg/L versus negative control of 1 d; (−) are under 1.0 mg/L versus negative control of 1 d, which is based on Duncan’s method.
In order to detect whether the change in GST mRNA level brought about the change in related characteristic metabolic enzymes, the enzyme activity of GST was tested (Figure 2). In the liver, the GST activities of all experimental groups were significantly stimulated after induction (p < 0.05), but the induction effect was gradually weakened (Figure 2c). There was no obvious change in the GST activity at the beginning of the experiment (from the first day to the 5th day) in the brain. However, during the PHE exposure period, the GST activities in the 15th and 25th days had a significant induction effect (p < 0.05) (Figure 2d).
GST can catalyze the binding of exogenous compounds such as insecticides, herbicides, and antibiotics to glutathione, and avoids damaging other cell biomolecules, thus playing an important role in combating oxidative stress [39]. In this study, the GST enzyme activity of the liver and brain were both induced by exposure to lower than safe concentrations of phenanthrene. This is similar to the previous report: The reports found that five kinds of PAHs induced the GST activity in the carp liver [40]. Yin et al. also reported that the GST activity in the tissues of catfish was significantly increased after the exposure to PHE [41]. Nahrgang et al. reported that benzo (a) pyrene induced the GST activity in cod liver [20]. However, Olinga et al. found that the short-term exposure to PHE inhibited GST activity in the kidney of Liza aurata [42].
However, the expression of mRNA in the liver and brain of carp is not synchronized with the changes in GST enzyme activity. mRNA expression in the liver was inhibited at concentrations of 0.5 and 1.0 mg/L. mRNA expression in the brain is first induced and then suppressed over time. This phenomenon of asynchrony between enzyme activity and gene expression also exists in previous reports: Sun et al. reported that after yellow catfish was exposed to Hg+, the related SOD and GPX1 mRNA expression levels increased significantly, but the SOD enzyme and GPX1 enzyme activities did not change much [43]. The analysis of the cause of this phenomenon may be due to the fact that antioxidant enzymes such as GST are encoded by multiple subtype genes. However, semi-quantitative genetic testing only analyzes one subtype gene, so changes in mRNA levels do not necessarily occur at the enzyme level. On the other hand, there is a time lag effect in the process of gene transcription, translation and protein modification, so the enzyme activity cannot reflect the mRNA level in time [44]. In the study, the expression of GST mRNA in carp liver and brain showed the early induction and subsequent inhibition effects, indicating that after the Phase I metabolic reactions, the biological activity of GST in the tissues of carp gradually became unbalanced during the exposure.
3.5. Correlation Analysis
The correlation analysis was carried out to test the expression levels of characteristic enzymes and characteristic mRNA (Figure 3). The correlation coefficient indicates that EROD activity in the liver showed a positive correlation with CYP1A mRNA level (r = 0.602, p < 0.01) (Figure 3a). In the brain, the correlation between EROD activity and CYP1A mRNA level was less significant than that in the liver (r = 0.508, p < 0.01) (Figure 3b). However, in the liver or brain, the correlation between GST activity and GST mRNA expression was relatively poor (liver, r = 0.395, p < 0.05; brain, r = 0.293, p < 0.05) (Figure 3c,d).
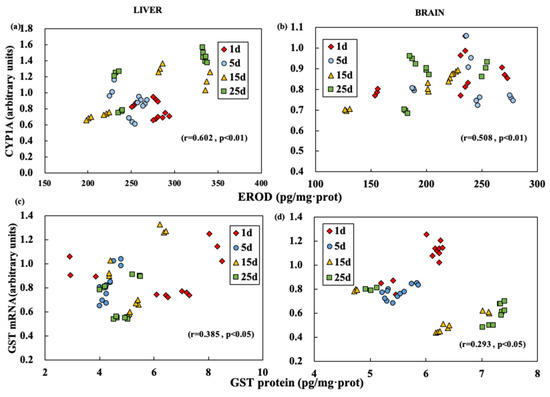
Figure 3.
Correlation of EROD and CYP1A mRNA (a,b), GST and GST mRNA (c,d) values in brain (b,d) and liver (a,c) at different exposure time.
In the study, the activity of EROD in the liver was more highly correlated with the activity of CYP1A mRNA expression. The liver is an important metabolism organ of heterogeneous organisms and the blood mediates the relationship between the brain and other target organs and accelerates the reaction between the characteristic liver enzymes and its mRNA expression. Similar experimental results had been reported in previous studies [7,45]. After the brain and muscle were exposed to soluble components of crude oil, the changes in AchE activity were not obvious compared to other organs [46]. In addition, the toxicity induced by CYP1A indicated the chemical exposure and preferential effects in various biological tissues [38].
The cytochrome P450 system showed a highly correlation than the GST system in both the liver and brain. The cytochrome P450 enzyme system played an important role in the heterogeneous biotransformation in Phase I metabolism of fish and other aquatic animals. The activity of ethoxysalolin O-deethylase (EROD) and the CYP1A mRNA level seemed to be the most sensitive catalytic probe. The induction response of the cytochrome P450 system had been determined in many studies [47,48]. The GST is a representative enzyme in Phase II metabolism and play an important role of catalyzing or reducing oxidative substances in the metabolic body. In most cases, only the modest changes in total GST activity were reported [49]. Similar studies reported that GSTα mRNA expression in all tissues showed no significant difference compared with CYP1A and ABC efflux transporters after the exposure to benzo(a)pyrene [45].
In addition, there was a significant decrease in GST mRNA in the brain after 15 days of PHE exposure. The higher GST activity and the lower GST mRNA expression in the 15th day might be interpreted as follows. From the first day to the 5th day, the activity of GST increased, thus increasing the clearance rate of PHE and reducing the overall mRNA response and GST synthesis. As a result, the mRNA expression level was reduced (Figure 2). However, the same phenomenon was not observed in the liver, indicating the differences in the heterogeneous metabolism and PHE-induced enzymes between the brain and liver [20].
3.6. Mechanism
The possible mechanism of PHE exposed to carp is shown in Figure 4. When PHE entered the carp body, the characteristic enzymes of the I-phase reaction were activated to remove pollutants, which resulted in an increase in the expression of CYP1A gene. As the body’s defense oxidation system proceeds to the II-phase reaction, the expression of GST and GST genes is stimulated.
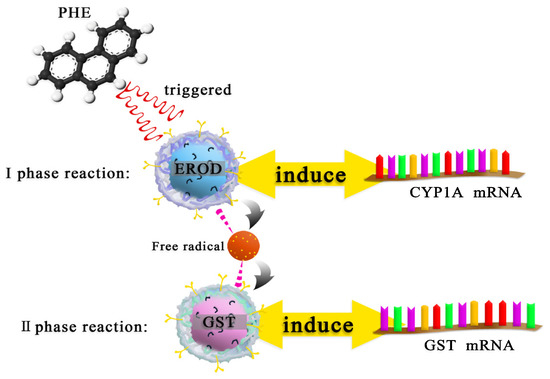
Figure 4.
The metabolic mechanism of PHE exposed to carp.
4. Conclusions
In conclusion, our study used carp as the test organism to perform acute toxicity tests and calculate safe concentrations. Exposure of carp to sub-safe concentrations of PHE for 25 days resulted in changes in oxidative stress. The expression of EROD and GST enzymes in the liver was stimulated from day 1 of exposure to induce the expression of CYP1A and GST genes. The expression activities of EROD and GST enzymes in the brain were stimulated, but the expression of GST gene was delayed. Correlation analysis also illustrates this phenomenon. These results suggest that long-term exposure of carp to sub-safe concentrations still affects its oxidase system and gene expression. The regulation of carp’s own molecular level under the stress of exogenous pollutants was revealed.
Supplementary Materials
The following supporting information can be downloaded at: https://www.mdpi.com/article/10.3390/ijerph19042129/s1, Figure S1: Electrophoresis diagram of RNA sample (Lanes 1 and 2 indicate the electrophoresis of liver and brain RNA of carp domesticated in clean water, and lanes 3 and 4 are the extraction of total RNA from tissues after PHE stress. Figure S2: GST amplified gene sequencing stitching results. Figure S3: CYP1A amplified gene sequencing stitching results. Figure S4: Electrophoresis diagram of each gene sample. The expression levels of target genes CYP1A and GST were detected by genomic PCR analysis, and β-ACTIN was used as a template control. From top to bottom are the cDNA gel electrophoresis diagrams of PHE stress concentrations of 0, 0.1, 0.5, 1.0 mg/L.
Author Contributions
X.K. developed the methodology and conducted a research and investigation process. X.K. and X.C. (Xin Cao) wrote the first draft of the article. Y.L. and D.L. carried out experiments and had helped the experiment testing and data collection. X.Z. had oversight and leadership responsibility for the research activity planning. X.S. gave a contribution to conceptualization. X.C. (Xin Cao) and X.C. (Xi Chen) revised and edited the draft. X.L. and C.C. reviewed the manuscript. All authors have read and agreed to the published version of the manuscript.
Funding
This research was funded by the National Natural Science Foundation of China grant number No. 51909034 and 52170152; the National Key Research and Development Project grant number No. 2019YFC0408603 and 2019YFC0408604; the Research Project of Shanghai Science and Technology Commission grant number No. 21DZ1202402; the Shanghai Sailing Program grant number No. 19YF1401900. And The APC was funded by the National Natural Science Foundation of China grant number No. 51909034.
Institutional Review Board Statement
This is to certify that the fish that were used in this experiment are in accordance with ‘REGULATIONS FOR THE ADMINISTRATION OF AFFAIRS CONCERNING EXPERIMENTAL ANIMALS’ which is approved by the State Council on October 31, 1988 and promulgated by Decree No. 2 of the State Science and Technology Commission on November 14, 1988. The fish were caught by permission of the Shanghai Ministry of Environmental Protection. They were handled in such a way to minimize stress and discomfort.
Informed Consent Statement
Not applicable.
Data Availability Statement
Data available on request due to restrictions eg privacy or ethical The data presented in this study are available on request from the corresponding author. The data are not publicly available due to confidentiality agreement.
Acknowledgments
The authors acknowledge the financial support from the National Natural Science Foundation of China (Grant No. 51909034 and 52170152); the National Key Research and Development Project (Grant No. 2019YFC0408603 and 2019YFC0408604); the Research Project of Shanghai Science and Technology Commission (Grant No. 21DZ1202402); and the Shanghai Sailing Program (Grant No. 19YF1401900).
Conflicts of Interest
The authors declare that they have no known competing financial interest or personal relationships that could have appeared to influence the work reported in this paper.
Abbreviations
| AhR | aromatic hydrocarbon receptors |
| BSA | Albumin from bovine serum |
| CYP1A | cytochrome P4501A |
| DEPC | Diethy pyrocarbonate |
| EROD | 7-Ethoxylesorufin O-deethylase |
| GST | glutathione S-transferase |
| PAHs | polycyclic aromatic hydrocarbons |
| PBS | Phosphate buffer solution |
| PHE | Phenanthrene |
| POPs | persistent organic pollutants |
| Sq-RT-PCR | semi-quantitative reverse transcription and polymerase Chain reaction |
References
- Carmen, S.; Helmut, S. Cytochrome P4501A (CYP1A) in teleostean fishes. A review of immunohistochemical studies. Sci. Total Environ. 2000, 247, 313–332. [Google Scholar] [CrossRef]
- Wda, B.; Min, L.; Ye, L.; Jza, B.; Xwa, B.; Jing, Y.; Yha, B.; Dza, B.; Dga, B.; Aqa, B. Cross-interface transfer of polycyclic aromatic hydrocarbons (PAHs) in a shallow urban lake in Shanghai, China based on the fugacity model—ScienceDirect. Sci. Total Environ. 2020, 736, 139369. [Google Scholar] [CrossRef]
- Harvey, R.G.; Harvey, R.G. Polycyclic Aromatic Hydrocarbons: Chemistry and Carcinogenicity; Cambridge University Press: Cambridge, UK, 1991. [Google Scholar] [CrossRef]
- Maskaoui, K.; Zhou, J.L.; Hong, H.S.; Zhang, Z.L. Contamination by polycyclic aromatic hydrocarbons in the Jiulong River Estuary and Western Xiamen Sea, China. Environ. Pollut. 2002, 118, 109–122. [Google Scholar] [CrossRef]
- Zheng, Y.; Li, Y.; Yue, Z.; Samreen; Wang, J. Teratogenic effects of environmentally relevant concentrations of phenanthrene on the early development of marine medaka (Oryzia melastigma). Chemosphere 2020, 254, 126900. [Google Scholar] [CrossRef]
- Lotufo, G.R.; Fleeger, J.W. Effects of sediment-associated phenanthrene on survival, development and reproduction of two species of meiobenthic copepods. Mar. Ecol.-Prog. Ser. 1997, 151, 91–102. [Google Scholar] [CrossRef]
- Nam, T.H.; Kim, L.; Jeon, H.J.; Kim, K.; Ok, Y.S.; Choi, S.D.; Lee, S.E. Biomarkers indicate mixture toxicities of fluorene and phenanthrene with endosulfan toward earthworm (Eisenia fetida). Environ. Geochem. Health 2017, 39, 307–317. [Google Scholar] [CrossRef]
- Sobanska, M.; Scholz, S.; Nyman, A.M.; Cesnaitis, R.; Alonso, S.G.; Kluever, N.; Kuehne, R.; Tyle, H.; De, K.J.; Dang, Z. Applicability of the fish embryo acute toxicity (FET) test (OECD 236) in the regulatory context of Registration, Evaluation, Authorisation, and Restriction of Chemicals (REACH). Environ. Toxicol. Chem. 2018, 37, 657–670. [Google Scholar] [CrossRef]
- Horng, C.Y.; Lin, H.C.; Lee, W. A Reproductive Toxicology Study of Phenanthrene in Medaka (Oryzias latipes). Arch. Environ. Contam. Toxicol. 2010, 58, 131–139. [Google Scholar] [CrossRef]
- Sun, S.; Wang, H.; Fu, B.; Zhang, H.; Xu, J. Non-bioavailability of extracellular 1-hydroxy-2-naphthoic acid restricts the mineralization of phenanthrene by Rhodococcus sp. WB9. Sci. Total Environ. 2019, 704, 135331. [Google Scholar] [CrossRef]
- Woo, S.J.; Kim, N.Y.; Kim, S.H.; Ahn, S.J.; Seo, J.S.; Jung, S.H.; Cho, M.Y.; Chung, J.K. Toxicological effects of trichlorfon on hematological and biochemical parameters in Cyprinus carpio L. following thermal stress. Comp. Biochem. Physiol. C-Toxicol. Pharmacol 2018, 209, 18–27. [Google Scholar] [CrossRef]
- Sidika, S.; Giang, P.T.; Burkina, V.; Zamaratskaia, G. The effects of sewage treatment plant effluents on hepatic and intestinal biomarkers in common carp (Cyprinus carpio). Sci. Total Environ. 2018, 635, 1160–1169. [Google Scholar] [CrossRef]
- Huang, Y.; Sui, Q.; Lyu, S.; Wang, J.; Yu, G. Tracking emission sources of PAHs in a region with pollution-intensive industries, Taihu Basin: From potential pollution sources to surface water. Environ. Pollut. 2020, 264, 114674. [Google Scholar] [CrossRef] [PubMed]
- Yang, T.; Diao, X.; Cheng, H.; Wang, H.; Chen, C.M. Comparative study of polycyclic aromatic hydrocarbons (PAHs) and heavy metals (HMs) in corals, sediments and seawater from coral reefs of Hainan, China. Environ. Pollut. 2020, 264, 114719. [Google Scholar] [CrossRef] [PubMed]
- Mager, E.M.; Pasparakis, C.; Stieglitz, J.D.; Hoenig, R.; Morris, J.M.; Benetti, D.D.; Grosell, M. Combined effects of hypoxia or elevated temperature and Deepwater Horizon crude oil exposure on juvenile mahi-mahi swimming performance. Mar. Environ. Res. 2018, 139, 129–135. [Google Scholar] [CrossRef]
- Wilson, H.K.; Buckeridge, S.A.; Yau, W.; Howerth, E.W.; Gato, W.E. Investigating the toxic effects of 2-aminoanthracene ingestion in pregnant Sprague Dawley dams. J. Environ. Sci. Health Part. B-Pestic. Contam. Agric. Wastes 2018, 53, 283–289. [Google Scholar] [CrossRef]
- Mortensen, A.S.; Tolfsen, C.C.; Arukwe, A. Gene Expression Patterns in Estrogen (Nonylphenol) and Aryl Hydrocarbon Receptor Agonists (PCB-77) Interaction Using Rainbow Trout (Oncorhynchus mykiss) Primary Hepatocyte Culture. J. Toxicol. Env. Health Part. A 2006, 69, 1–19. [Google Scholar] [CrossRef]
- Kais, B.; Ottermanns, R.; Scheller, F.; Braunbeck, T. Modification and quantification of in vivo EROD live-imaging with zebrafish (Danio rerio) embryos to detect both induction and inhibition of CYP1A. Sci. Total Environ. 2017, 615, 330–347. [Google Scholar] [CrossRef]
- Roy, M.A.; Sant, K.E.; Venezia, O.L.; Shipman, A.B.; Timme-Laragy, A.R. The emerging contaminant 3,3′-dichlorobiphenyl (PCB-11) impedes Ahr activation and Cyp1a activity to modify embryotoxicity of Ahr ligands in the zebrafish embryo model (Danio rerio). Environ. Pollut. 2019, 254, 113027. [Google Scholar] [CrossRef]
- Nahrgang, J.; Camus, L.; Gonzalez, P.; Goksoyr, A.; Christiansen, J.S.; Hop, H. PAH biomarker responses in polar cod (Boreogadus saida) exposed to benzo(a)pyrene. Aquat. Toxicol. 2009, 94, 309–319. [Google Scholar] [CrossRef]
- Van der Oost, R.; Beyer, J.; Vermeulen, N.P.E. Fish bioaccumulation and biomarkers in environmental risk assessment: A review. Environ. Toxicol. Pharmacol 2003, 13, 57–149. [Google Scholar] [CrossRef]
- Mai, Y.; Peng, S.; Li, H.; Lai, Z. Histological, biochemical and transcriptomic analyses reveal liver damage in zebrafish (Danio rerio) exposed to phenanthrene. Comp. Biochem. Physiol. C-Toxicol. Pharmacol. 2019, 225, 108582. [Google Scholar] [CrossRef] [PubMed]
- Mu, J.; Jin, F.; Wang, J.; Wang, Y.; Cong, Y. The effects of CYP1A inhibition on alkyl-phenanthrene metabolism and embryotoxicity in marine medaka (Oryzias melastigma). Environ. Sci. Pollut. Res. 2016, 23, 11289–11297. [Google Scholar] [CrossRef] [PubMed]
- Shirmohammadi, M.; Chupani, L.; Salamat, N. Responses of immune organs after single-dose exposure to phenanthrene in yellowfin seabream (Acanthopagrus latus): CYP1A induction and oxidative stress. Chemosphere 2017, 186, 686–694. [Google Scholar] [CrossRef] [PubMed]
- Wu, J.Y.; Yan, Z.G.; Liu, Z.T.; Liu, J.D.; Wang, W.L. Development of water quality criteria for phenanthrene and comparison of the sensitivity between native and non-native species. Environ. Pollut. 2015, 196, 141–146. [Google Scholar] [CrossRef] [PubMed]
- Fontana, R.J.; Lown, K.S.; Paine, M.F. Effects of a chargrilled meat diet on expression of CYP3A, CYP1A, and P-glycoprotein levels in healthy volunteers. Gastroenterology 1999, 117, 89–98. [Google Scholar] [CrossRef]
- Abel, L. Chemical Neurobiology: An Introduction to Neurochemistry: H. F. Bradford. Freeman, New York, 1976. Neurochem. Int. 1987, 10, 594–595. [Google Scholar] [CrossRef]
- Costa, J.; Ferreira, M.; Rey-Salgueiro, L.; Reis-Henriques, M.A. Comparision of the waterborne and dietary routes of exposure on the effects of Benzo(a)pyrene on biotransformation pathways in Nile tilapia (Oreochromis niloticus). Chemosphere 2011, 84, 1452–1460. [Google Scholar] [CrossRef]
- Sun, H.J.; Zhang, J.Y.; Wang, Q.; Zhu, E.; Chen, W.; Lin, H.; Chen, J.; Hong, H. Environmentally relevant concentrations of arsenite induces developmental toxicity and oxidative responses in the early life stage of zebrafish. Environ. Pollut. 2019, 254, 113022. [Google Scholar] [CrossRef]
- Burkina, V.; Zlabek, V.; Zamaratskaia, G. Effects of pharmaceuticals present in aquatic environment on Phase I metabolism in fish. Environ. Toxicol. Pharmacol. 2015, 40, 430–444. [Google Scholar] [CrossRef]
- Zhang, J.; Shen, H.; Wang, X.; Wu, J.; Xue, Y. Effects of chronic exposure of 2,4-dichlorophenol on the antioxidant system in liver of freshwater fish Carassius auratus. Chemosphere 2004, 55, 167–174. [Google Scholar] [CrossRef]
- Niu, Z.; Xu, W.; Na, J.; Lv, Z.; Zhang, Y. How long-term exposure of environmentally relevant antibiotics may stimulate the growth of Prorocentrum lima: A probable positive factor for red tides. Environ. Pollut. 2019, 255, 113149. [Google Scholar] [CrossRef] [PubMed]
- Triebskorn, R.; KHler, H.R.; Honnen, W.; Schramm, M.; Adams, S.M.; Müller, E.F. Induction of heat shock proteins, changes in liver ultrastructure, and alterations of fish behavior: Are these biomarkers related and are they useful to reflect the state of pollution in the field. J. Aquat. Ecosyst. Stress Recovery 1997, 6, 57–73. [Google Scholar] [CrossRef]
- Zanette, J.; Jenny, M.J.; Goldstone, J.V.; Woodin, B.R.; Watka, L.A.; Bainy, A.C.D.; Stegeman, J.J. New cytochrome P450 1B1, 1C2 and 1D1 genes in the killifish Fundulus heteroclitus: Basal expression and response of five killifish CYP1s to the AHR agonist PCB126. Aquat. Toxicol. 2009, 93, 234–243. [Google Scholar] [CrossRef] [Green Version]
- Wenju, X.U.; Yuanyou, L.I.; Qingyang, W.U.; Wang, S.; Zheng, H.; Liu, W. Effects of phenanthrene on hepatic enzymatic activities in tilapia(Oreochromis niloticus × O. aureus male). J. Environ. Sci. 2009, 21, 854–857. [Google Scholar] [CrossRef]
- Mu, J.L.; Wang, X.H.; Jin, F.; Wang, J.Y.; Hong, H.S. The role of cytochrome P4501A activity inhibition in three- to five-ringed polycyclic aromatic hydrocarbons embryotoxicity of marine medaka (Oryzias melastigma). Mar. Pollut. Bull. 2012, 64, 1445–1451. [Google Scholar] [CrossRef]
- Correia, A.D.; Goncalves, R.; Scholze, M.; Ferreira, M.; Henriques, A.R. Biochemical and behavioral responses in gilthead seabream (Sparus aurata) to phenanthrene. J. Exp. Mar. Biol. Ecol. 2007, 347, 109–122. [Google Scholar] [CrossRef]
- Whyte, J.J.; Jung, R.E.; Schmitt, C.J.; Tillitt, D.E. Ethoxyresorufin-O-deethylase (EROD) Activity in Fish as a Biomarker of Chemical Exposure. CRC Crit. Rev. Toxicol. 2000, 30, 347–570. [Google Scholar] [CrossRef]
- Hayes, J.D.; Pulford, D.J. The Glut athione S-Transferase Supergene Family: Regulation of GST and the Contribution of the lsoenzymes to Cancer Chemoprotection and Drug Resistance Part I. CRC Crit. Rev. Biochem. 1995, 30, 521–600. [Google Scholar] [CrossRef]
- Lu, G.H.; Wang, C.; Zhu, Z. The Dose–Response Relationships for EROD and GST Induced by Polyaromatic Hydrocarbons in Carassius auratus. Bull. Environ. Contam. Toxicol. 2009, 82, 194–199. [Google Scholar] [CrossRef]
- Yin, Y.; Jia, H.; Sun, Y.; Yu, H.; Wang, X.; Wu, J.; Xue, Y. Bioaccumulation and ROS generation in liver of Carassius auratus, exposed to phenanthrene. Comp. Biochem. Physiol. C-Toxicol. Pharmacol. 2007, 145, 288–293. [Google Scholar] [CrossRef]
- Olinga, P.; Elferink, M.G.L.; Draaisma, A.L.; Merema, M.; Castell, J.V.; Pérez, G.; Groothuis, G.M.M. Coordinated induction of drug transporters and phase I and II metabolism in human liver slices. Eur. J. Pharm. Sci. 2008, 33, 380–389. [Google Scholar] [CrossRef] [PubMed]
- Sun, Y.; Li, Y.; Rao, J.; Liu, Z.; Chen, Q. Effects of inorganic mercury exposure on histological structure, antioxidant status and immune response of immune organs in yellow catfish (Pelteobagrus fulvidraco). J. Appl. Toxicol. 2018, 6, 843–854. [Google Scholar] [CrossRef] [PubMed]
- Zheng, J.L.; Yuan, S.S.; Wu, C.W.; Li, W.Y. Chronic waterborne zinc and cadmium exposures induced different responses towards oxidative stress in the liver of zebrafish. Aquat. Toxicol. 2016, 177, 261–268. [Google Scholar] [CrossRef] [PubMed]
- Costa, J.; Reis-Henriques, M.A.; Castro, L.F.C.; Ferreira, M. Gene expression analysis of ABC efflux transporters, CYP1A and GSTα in Nile tilapia after exposure to benzo(a)pyrene. Comp. Biochem. Physiol., Part. C Toxicol. Pharmacol. 2012, 155, 469–482. [Google Scholar] [CrossRef] [PubMed]
- Bettim, F.L.; Galvan, G.L.; Cestari, M.M.; Yarnamoto, C.I.; de Assis, H.C.S. Biochemical responses in freshwater fish after exposure to water-soluble fraction of gasoline. Chemosphere 2016, 144, 1467–1474. [Google Scholar] [CrossRef]
- Anna, L.; Malin, C.C.; Lars, F. Effects of medetomidine on hepatic EROD activity in three species of fish. Ecotoxicol. Environ. Saf. 2008, 69, 74–79. [Google Scholar] [CrossRef] [Green Version]
- Goksoyr, A.F. The cytochrome P-450 system in fish, aquatic toxicology and environmental monitoring. Aquat. Toxicol. 1992, 22, 287–311. [Google Scholar] [CrossRef]
- Henson, K.L.; Gallagher, E.P. Glutathione S-Transferase Expression in Pollution-Associated Hepatic Lesions of Brown Bullheads (Ameiurus nebulosus) from the Cuyahoga River, Cleveland, Ohio. Toxicol. Sci. 2004, 80, 26–33. [Google Scholar] [CrossRef]
Publisher’s Note: MDPI stays neutral with regard to jurisdictional claims in published maps and institutional affiliations. |
© 2022 by the authors. Licensee MDPI, Basel, Switzerland. This article is an open access article distributed under the terms and conditions of the Creative Commons Attribution (CC BY) license (https://creativecommons.org/licenses/by/4.0/).