Abstract
The aim was to identify whether 16 weeks of combined training (Training) reduces blood pressure of hypertensive older adults and what the key fitness, hemodynamic, autonomic, inflammatory, oxidative, glucose and/or lipid mediators of this intervention would be. Fifty-two individuals were randomized to either 16 weeks of Training or control group who remained physically inactive (Control). Training included walking/running at 63% of O2max, three times per week, and strength training, consisting of one set of fifteen repetitions (seven exercises) at moderate intensity, twice per week. Both groups underwent a comprehensive health assessment at baseline (W0) and every four weeks, for 16 weeks total. p-value ≤ 0.05 was set as significant. Training did not reduce blood pressure. It increased O2max after eight weeks and again after 16 weeks (~18%), differently from the Control group. At 16 weeks, Training increased strength (~8%), slightly reduced body mass (~1%), and reduced the number of individuals with metabolic syndrome (~7%). No other changes were observed (heart rate, carotid compliance, body composition, glycemic and lipid profile, inflammatory markers and oxidative profile, vasoactive substances, heart rate variability indices). Although Training increased cardiorespiratory fitness and strength, Training was able to reduce neither blood pressure nor a wide range of mediators in hypertensive older adults, suggesting other exercise interventions might be necessary to improve overall health in this population. The novelty of this study was the time-course characterization of Training effects, surprisingly demonstrating stability among a comprehensive number of health outcomes in hypertensive older adults, including blood pressure.
1. Introduction
Aging increases the chance of become hypertensive and, in Brazil for example, 64.2% of individuals above 60 years old were hypertensive in the last assessment in 2016 [1]. Despite, some reports of hypotension, syncope, and medication overload in high-risk patients when the treatment target for systolic blood pressure (BP) is under 120 mmHg; the maintenance of systolic BP ≤ 120 mmHg [2,3].
Although the antihypertensive effects of different types of exercise training in the general population are well known [4], the ability of exercise to reduce BP in older adults is still unclear [5]. Understanding how exercise affects this heterogeneous population is fundamental, not just as most older adults are taking medication that impair the isolation of exercise effects on the controlled BP [6,7], but also as treatment of hypertension in this population is expected to be more complex (hypertension in older adults could be a combination of different aging-related changes), and training-mediated BP alterations differ between younger and older adults [8].
Aerobic training is recommended for treatment of hypertension, but emerging research suggests dynamic strength training can also be beneficial [5]. A recent meta-analysis showed just one study which tested the combination of aerobic training and strength training (i.e., combined training) effects on hypertensive women 65 years or older [9]. In the same meta-analysis, within the larger sample of hypertensive older adults ≥ 50 yrs, combined training was not able to reduce systolic BP [9] (which agreed with another meta-analysis in the general population [4]). Furthermore, the overall exercise effects that included other types of training were more dependent on baseline BP levels than age.
The mechanism mediating the BP reduction with exercise training is still unclear. However, inflammation and autonomic modulation are suggested to be mediators of exercise training effects on BP [10]. In spontaneously hypertensive rats, two weeks of aerobic training reduced inflammation in the hypothalamic nuclei of cardiovascular control and increased baroreflex sensitivity [11]. After four weeks, parasympathetic modulation of the heart increased and sympathetic modulation of the arteries decreased; finally, after eight weeks, BP was significantly reduced [11]. Although animal results shed lights on the possible mechanism mediating the BP reduction following exercise training, they are not representative of hypertensive older adults developing hypertension along their life span [12]. Thus, the time-course of all these adaptations triggered by combined training remains unknown in humans.
The present study aims to investigate the effect of 16 weeks of combined training (Training) primarily on BP in hypertensive older adults who were maintained on their medication. Second, we investigated potential key fitness, hemodynamic, autonomic, inflammatory, oxidative, glucose and/or lipid mediators of these adaptations across time (month by month). We hypothesized that reduction in inflammatory markers would be followed by autonomic modulation improvements, which in turn would precede a blood pressure reduction in this population similar to that observed in rats [11]. However, since hypertensive older adults, unlike spontaneously hypertensive rats, develop hypertension in association with many other health issues, we did not discard the possible impact of other factors [10].
2. Materials and Methods
2.1. Experimental Approach to the Problem
This study was part of a prospective interventional randomized controlled trial, with a parallel control group, executed in Campinas (São Paulo, Brazil) registered on the Brazilian registry of clinical trials ([https://ensaiosclinicos.gov.br/rg/RBR-3yxds4], identifier [U1111-1181-4455]). The sample size calculation (G*Power 3.2.1 software), based on mean blood pressure changes with Training, ensured the number of participants (n = 46) analyzed at the end were above that necessary for 95% power, as estimated previously [10].
2.2. Participants
The 52 subjects were listed from high to lower values of their pre intervention assessments for the five primary variables (age, sex, systolic BP (SBP), body mass index (BMI) and RR interval (RRi)); then they were pair matched to be drawn to group 1 (Training) or 2 (Control), using a computerized random function with participants blinded and aware that they could be assigned to any group, which would receive Training during the study or after the study (Control). To ensure proper balance, we continuously inverted a few participants’ matched pairs until the baseline difference between groups reached an effect size smaller than 0.2 (Cohen’s d) for each of the five primary variables.
Eligible participants were men and women over 60 years old recruited from the community. Table 1 describes the baseline characteristics of the 46 participants that completed the study, and the balance achieved at baseline assessments between groups was not maintained (ES < 0.2) for BMI and RRi. None of the subjects were physically active (<150 min of exercise/week), however we did report their specific Physical activity level (PAL) at baseline [10]. All subjects were diagnosed with hypertension by their physician and were currently taking antihypertensive medication (Table 1). Beta-blockers were considered an exclusion criterion due to the direct influence on heart rate, and due to participants having acute anti-inflammatory medication administered, their tests were delayed until one week after medication cessation. Participants were invited by radio, television, websites, delivering flyers around the University area and by phone calls to the laboratory database. After initial screening, pre-approved participants underwent a clinical evaluation by a physician, who cleared them for participating in physical activity (general physical examination, cardiological and clinical exercise testing). Exclusion criteria were BMI > 35 kg/m2, resting SBP > 170 mmHg or diastolic BP (DBP) > 110 mmHg, coronary artery disease, insulin-dependent diabetes mellitus, chronic obstructive pulmonary disease, osteoarticular disease that could limit participation in the exercise training program, and cigarette smoking. All selected individuals signed the informed consent approved by Ethics Committee from the University.

Table 1.
Baseline characteristics.
2.3. Intervention
The 16-week Training protocol was based on the American College of Sports Medicine recommendations for older adults [13] using an aerobic training intensity proposed for hypertension treatment [5]. Considering aerobic training is the most common exercise for cardiovascular improvements, including blood pressure reduction in hypertensive older adults [5,9,14], a greater portion of the training volume was composed of aerobic training rather than strength training. All exercise sessions were individually prescribed and supervised. Twice a week, on Mondays and Thursdays, strength training (15 min duration) was followed by the aerobic training (50 min duration) and once per week, on Fridays, aerobic training was performed alone (50 min duration), with the protocol consisting of continuous walking and/or running on a treadmill. Strength training consisted of one set of 15 repetitions for each of seven strength exercises for the major muscle groups (leg extension and flexion, leg press, heel lift, bench press, pulley, and abdominal). To avoid the exposure of the participants to repetition maximum tests [15], the strength training load was adjusted according to an individual’s perception of every training session to achieve a moderate intensity using the Borg scale (5–6 on a 10-point scale) [13]. The participants were familiarized with the 10-point scale in the first week of training. Aerobic training was prescribed at 63% of the O2max recommended for hypertensive individuals, and adjusted after 8 weeks, based on the new test. Participants in the control group (Control) did not receive any treatment. All participants, including the Control, were advised to maintain their normal diet and all their prescribed medications during the 16 weeks of intervention. In addition, the monthly assessments facilitated the engagement of the Control on the research, since they were frequently followed by the researchers.
2.4. Outcomes
The main outcomes were assessed in both groups at baseline, 4, 8, 12 and 16 weeks of control or training intervention, for primary (BP) and secondary variables (all other variables) as described in the protocol registration [10] and in the methods section. Each participant was tested at the same time of day and with the same evaluator at each of the 5 testing time points. At least 48 h rest between the prior training session and the assessments was maintained, and the participants were asked to fast for 12 h before the cardiovascular function assessments and the blood draw. The participants were monitored for current infections and medication usage every month by questionnaires [10]. When there was risk of infection or the participants forgot to take their standard medication, the monthly assessments were rescheduled for the next week. Although participants, training instructors, and evaluators were not blinded during data collection, the overall data exported for further computational (e.g., ultrasound images or BP time interval data) and statistical analysis were blinded.
Physical fitness (Maximum oxygen consumption (O2max), maximum strength and functionality): The maximal exercise test was performed on a treadmill, with breath-by-breath gas analysis (CPX, Medical Graphics, Saint Paul, MN, USA). The protocol began with a 1% incline, starting at 4 km/h (2 min), followed by increases of 0.3 km/h every 30 s until volitional exhaustion. Attainment of two of the following criteria were used to ensure only tests with peak effort were used in the analysis: (1) Respiratory exchange ratio > 1.15, (2) at least 10 bpm below the maximum heart rate predicted by age (220 minus age), (3) plateau in the oxygen consumption (increase < 100 mL/min) even with an increase in intensity. With or without plateau, the highest 30 s average was registered for analysis. A re-test after 48 h was performed to avoid bias.
Peak torque for isometric strength at 60° of flexion (0° = complete extension) of leg extension exercise and isokinetic strength (60°/s) of concentric contractions of leg extension and flexion exercise, were assessed using the Biodex System 4 isokinetic dynamometer (Biomedical Systems, Newark, CA, USA). Participants were seated with their preferred leg knee rotation center (middle intercondylar line) aligned with the center of rotation of the device arm, which was set at an angle of 60° from the horizontal plane. The support point of the lever arm of the device was located one centimeter proximal to the medial malleolus of the participant, and trunk and hips were tied with straps to avoid auxiliary movement. The warm-up was composed of 10 submaximal isometric leg extension and leg flexion contractions, with 3 s duration and 10 s intervals between them. After warm-up, participants performed 3 sets of isometric leg extensions and flexion with 30 s intervals between the movements (extension and flexion) and 2 min between sets.
Data collected in the third attempt of isometric leg flexion and extensions were used for force development rate analysis. The time taken from the beginning of the test to the point of maximum contraction was entered into the equation (TDF = Δ Strength/Δ time). The test start time was considered when there was a variation greater than 7.5 N from baseline.
The isokinetic warm-up was composed of 5–6 passive repetitions and 3 submaximal contractions. Participants performed 5 isokinetic contractions with maximum knee extension/flexion contractions, at a speed of 60°/s. In all assessments, volunteers were instructed to produce the maximum amount of force, as quickly as possible, and received verbal encouragement. The highest torque value (torque peak) in each test was recorded. Handgrip strength was quantified through the best of three trials, with the dominant hand using a Jamar dynamometer (Lafayette Instruments, Lafayette, IN, USA). For all tests, participants were asked to use maximal effort, as fast as possible, and they received verbal encouragement [10]. The best of three trials was registered.
Functionality was assessed with a stand and sit test (30 s chair standing), timed up and go, sit and reach test, gait speed along 4.6 m and Balance, according to classical assessments described in the research protocol [10].
Body composition: The weight will be measured by a calibrated scale (digital scale Filizola®, São Paulo, Brazil, model ID1500) to the nearest 100 g. Height will be measured to the nearest 0.5 cm using a stadiometer (Digital Filizola®). BMI will be calculated from these values (weight/height2). The waist, hips and neck circumference will be measured by tape, as reliable markers of cardiometabolic risk. Body volume was assessed through a densitometric technique at a plethysmograph chamber. The evaluation instrument is the chamber plethysmography (BOD POD®) connected to a software that determines the air volume variation and interior pressure from when it was empty to when the participant was there, and variables necessary for estimating body volume. From the body volume the lean and fat mass were estimated using Siri’s equation [16]. A 10 to 5 MHz linear transducer coupled with ultrasound (Nanomaxxtm, SonoSite, Bothell, WA, USA) were used for assessment of rectus femoris and vastus lateralis thickness [10]. The distance from the femoral trochanter and the lateral condyle of the tibia serves as a guide for latero-lateral location, while the distance from the distal second third of the trochanter serves as a basis for locating the anterosuperior point, composing the desired point for image capture of the vastus lateralis. This point is transferred to the anterior part of the thigh and a new measurement is taken from the distance from this point to the base of the patella where the image of the rectus femoris was captured. The acquired images were analyzed on the ImageJ software, and the pixels were converted into centimeters.
Cardiovascular assessments (Hemodynamics, Ankle brachial index, Heart rate variability, Carotid compliance, Intima Media Thickness): Following 15 min supine rest, the BP was assessed in supine position using an aneroid sphygmomanometer in the right arm, three times (5 min interval between each assessment) and the mean was used for analysis, and the assessment of systolic upper and lower limbs BP were used for ankle brachial index (ABI) calculation following standardized recommendations, as previously described [10]. Beat-to-beat SBP and DBP were obtained using finger photoplethysmography by Finometer Pro®. The average of 300 beats at a stationary period in supine rest was used to estimate stroke volume, heart rate, total peripheral resistance, cardiac output, and baroreflex sensitivity.
Furthermore, in the supine position, the resting range of the respiratory rate was confirmed (9–22 breaths/min) and continuous R-R intervals were acquired by a heart rate monitor. Heart rate variability (HRV) was analyzed in both time and frequency domains, for five minutes stationary R-R intervals, in Kubios HRV analysis software.
Using a linear transducer of 10–5 MHz and the ultrasound M mode, a sequence of images of the left carotid common artery diameter (2 cm proximal to the carotid bifurcation) was acquired for 5 s. These images were used for Carotid compliance (CC) calculation and the intima media thickness of the far wall was evaluated as the distance between the lumen-intima interface and the media-adventitia interface [10].
Blood markers: Samples of serum, heparin- and EDTA-plasma were obtained after 12 h fasting, drawn from an antecubital vein and stored at −80 °C. Glucose tests were conducted immediately. Glucose and lipid analyses were performed by standard method in Clinical Laboratory, in which triglycerides (TG) and total cholesterol (TC) were obtained by enzyme-trinder method, HDL by selective detergent method and LDL by using the Friedewald equation (LDL = (TC − HDL) − (TG/5)). Insulin, C-reactive protein (CRP), adiponectin and leptin, and the vasoconstrictor endothelin-1 (ET-1) were assessed by multiple analytics magnetic assay, while ultrasensitive Interleukin 6 (IL-6), tumor necrosis factor alpha (TNF-α) and the vasodilator nitrite were assessed using ELISAs (enzyme-linked immunosorbent assay) with a plate reader, and both methods using kits (R&D Systems). Insulin resistance was calculated according to the equation HOMA-IR = fasting insulin (µU/mL) fasting glucose (mmol/L)/22.5 [17]. We quantified hydrogen peroxide, due to its high oxidative potential, as well as carbonyls, as markers of protein peroxidation, and thiobarbituric acid reactive substances (TBARS) as a marker of lipid peroxidation. For this, the total proteins of the sample were determined using bovine serum albumin as a standard. Approximately 8 mg/mL of protein was analyzed for oxidative stress assessments. Furthermore, to assess the antioxidant potential of the sample, we quantified the activity of NADPH oxidase and superoxide dismutase (SOD) enzymes, and the ferric reduction ability power (FRAP), as a marker of global antioxidant capacity. These analyses followed methods previously described [18]. In summary, the method to quantify carbonyls uses the reaction of carbonyl groups with 2,4-dinitrophenylhydrazine (DNPH) to form, 2,4-dinitrophenylhydrazine, and was measured spectrophotometrically at 360 nm.
For the TBRAS reaction we added 150 μL of Dodecyl Sulfate of Sodium (SDS) at 8.1% (w/v), 300 μL of Trichloroacetic Acid (TCA) (Vetec Quimica Fine Ltd., Xerem Duque De Caxias, RJ, Brazil) at 20% (w/v) and 500 μL of Thiobarbituric Acid (Sigma-Aldrich Corporation, Gillingham, UK). This mixture was incubated for 20–30 min at 95 °C, forming a pinkish compound, and then was cooled on ice. After this procedure the tubes were centrifuged at a speed of 4000 rpm for 5 min (Eppendorf AG, Germany) and 200 μL of supernatant was added to an Elisa plate well. The reading was taken at 535 nm using an Elisa Plate reader. Hydrogen peroxide was measured by red oxidation of phenol, catalyzed by radish peroxidase (PRS), at 630 nm. A volume of 70 μL of plasma together with 180 μL PRS were incubated for 25 min at room temperature. After this period, 5 μL of NaOH was added and the reading was performed using an Elisa’s plate reader. The quantification of hydrogen peroxide was estimated based on a standard curve. The activity of the NADPH oxidase enzyme was determined in blood plasma and was evaluated by the production of superoxide determined by ELISA. For performance of the assay, a 50 mM phosphate buffer containing 2 mM EDTA and sucrose 150 mM, 1.3 mM NADPH and 10 μL sample was used. Regarding FRAP, insofar as any sock reaction having a lower redox potential under reaction conditions than a half ferric/ferrous reaction, this would convert the ferric (FeIII) reaction to a ferrous (FeII) reaction. Therefore, the change in absorbance is directly related to the power of total donation reduction in antioxidant electrons present in the reaction. After incubating 10 μL of the sample and 290 μL of the FRAP reagent (Acetate Buffer sodium and acetic acid pH 3.6; 10 mM Tripiridil 2,4,6-S-Thiazine Solution; Solution of ferric chloride hexahydrate) for 5 min with a shake at 37 °C. The reading was performed at 593 nm. The analysis of SOD is based on the inhibition of the reaction of the superoxide radical with pyrogallol. A unit of SOD is defined as the quantity of enzyme that is inhibited by 50% of the oxidation rate of the detector. The oxidation of pyrogallol leads to the formation of a colored product, detected spectrophotometrically at 420 nm for 2 min, and the SOD activity was determined by measuring the velocity of formation of oxidized pyrogallol.
Metabolic syndrome: According to the United States national cholesterol education program [19], participants were considered positive for metabolic syndrome (MetS) if they were positive for three or more of these five criteria: High waist circumference: women > 88 cm and men > 102 cm; Hypertension: SBP > 130 mmHg, or DBP > 85 mmHg, or using anti-hypertensive medication; Fasting blood glucose > 110 mg/dL or anti-hyperglycemic medication; High triglycerides: >150 mg/dL; low HDL: women < 50 mg/dL and men < 40 mg/dL.
2.5. Statistical Analysis
Analyses were performed using SPSS version 24. Between-group baseline characteristics were compared by independent t-test. First, the Shapiro–Wilk test was used to assess the normality of the distribution for each variable. The non-normally distributed data were transformed by logarithm ([Log]), or square root ([SqR]) transformations, or the whole Box–Cox family ([Box–Cox]). All data were described in the text and tables in raw format as mean ± standard deviation; additionally, we tagged the variables as [Log], [SqR] or no tag (when raw data was already normally distributed), according to their required transformation to become normally distributed for analysis. When none of the transformations led to normal distribution, we analyzed the raw format and target it as [NN] (non-normally distributed).
Mixed-model analyses were conducted for all variables with groups (Training and Control) and time points (W0, W4, W8, W12 and W16) as fixed factors and participants as random factors (intercept and curves). The first order autoregressive covariance model was used, considering a progressive change was expected along in participants with time. When there was significant group*time interaction (p < 0.1), Bonferroni post-hoc was applied and p < 0.1 was also accepted as significant.
Following the identification of outliers (score z > 2.58 or <−2.58 and out of physiological variability) the analyses were performed with and without outliers. The results based on analyses with outliers removed ([OR]) were presented only when there were significant differences between or within groups that were not found through analyses with outliers (TBARS and CC).
3. Results
Twenty-three individuals were analyzed in each group (Figure 1), representing 88.46% of the randomized subjects. Participants’ eating habits were not altered in each group [20]. There were a few alterations in participants’ medication used: while physicians of four Training participants required them to stop their medication (one diuretic, one herbal medicine and two antidepressant), two Control participants had to increase their doses of metformin and statin. No adverse events were reported during the study and the exercise training prescriptions were well tolerated. When the participants would miss a session, they were asked to participate in an extra session before the next monthly assessments, thus all included participants completed at least 10 training sessions per month.
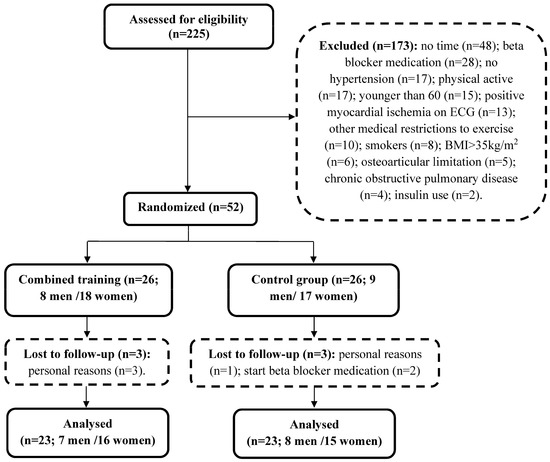
Figure 1.
Assessment of eligibility, randomization, and follow-up.
Training exhibited reduced body mass and BMI at W16 compared to W0, W4 and W8, but this lower value (at W16) was not significantly different from Control. Control exhibited an increase in waist circumference at W12 compared to W0, but this was not different from Training (Table 2). No interaction effect was observed for our primary outcome (i.e., BP), and only significant time effects for SBP and ABI, with a reduction in SBP and an increase in ABI from W0 to W12 were observed (Table 2). There was a significantly lower number of individuals with Metabolic Syndrome (MetS) in Training compared to Control only at W16, according to Chi squared test (Table 2).
Table 2.
Cardiometabolic assessments.
The Training group showed higher isometric and isokinetic knee extension than Control at W16 (Table 3). While there was no significant increase within Training, there was a reduction in isometric and isokinetic knee extension, and in the rate of force development within Control at W16. O2max and maximal speed increased within Training from W0 to W8 and again from W8 to W16, which was significantly different from Control at W16. No group*time interaction was observed for the functionality tests, but significant time effects were observed from W0 to W16; showing improvements for stand and sit, time up and go, and gait speed for both groups.
Table 3.
Physical fitness.
No change occurred for any of the blood markers such as glycemic, lipidic, inflammatory, oxidative stress markers or vasoactive substances over the course of the intervention (Table 4).
Table 4.
Blood markers.
There were no significant effects for any of the time domain, frequency domain or even the non-linear HRV indexes (Table 5).
Table 5.
Heart rate variability indexes.
4. Discussion
There is a strong body of evidence favoring aerobic training for blood pressure reduction in hypertensive individuals compared to combined aerobic and strength training [9]. However, combined training is fundamental to improve comprehensive health needs of older adults with hypertension [21]. Here, Training led to important benefits such as the considerable increase in cardiorespiratory fitness (~18% O2max), reduction in the number of individuals with MetS compared to Control (24% lower) and modest improvements in strength (~8%) and body mass (~1%).
We attribute the considerable increase in cardiorespiratory fitness primarily to the higher volume of aerobic training proportional to strength training within the Training program (nearly 85% of the time); but also, to the supervision of the training sessions ensuring adherence to the prescribed training intensity. Although, there was a continuous increase in strength load in all exercises throughout the 16 weeks of exercise program [22], the maximum strength tests detected only small strength improvements. The small increase might be due to the low volume and frequency of strength training used in this study compared to others [23,24]. It is doubtful that the exercise prescription method per se, using the rate of perceived exertion (RPE [0 to 10]), influenced our findings considering other studies have shown improvements with RPE prescription. However, since those studies also prescribed strength training with higher volumes and frequencies [25,26], it is not possible to directly compare those results to our findings. Importantly, a meta-analysis of our group [27] showed combined training produces lower increments in muscle strength in hypertensive older adults compared to strength training alone (standardized mean increase of 0.46 [95%CI 0.21; 0.71] and 1.69 [95%CI:1.30; 2.08] for combined training and strength training, respectively). Thus, it is possible that aerobic exercise training, as applied in our study, may partially interfere with strength gains which have also been shown for healthy young adults [28].
Previous studies have shown improvements in the other functional tests such as balance, gait speed, gait quality, and stand and sit with exercise training, including hypertensive older adults; however, the individuals tested in these studies had lower baseline performance than the individuals of the present study [29,30]. It is possible that our subjects exhibited a ceiling effect due to their relatively high functional status at baseline. Thus, the improvements in muscle strength, although of lower magnitude, may have contributed to the functional gains to increase cardiorespiratory fitness.
It is possible the unexpected lack of significance for any of the blood markers and cardiometabolic effects may be explained by the Wilder’s principle, that, applied to our study, would explain the lower effect of Training in individuals with well-controlled clinical markers. Wilder’s principle states that the direction of response of a body function to any agent depends largely on the initial level of that function. Wilder’s principle has also been proposed to explain the notable influence of baseline BP values in other anti-hypertensive therapies and has been confirmed in an older hypertensive population [9]. BP was very well controlled in the population in the present study, compared to studies finding a reduction in SBP and DBP, and this behavior was observed not only for BP but for many other health markers [31]. For instance, the individuals tested in this study had healthier values of TNFα, IL-6, CRP, IL-1ra, adiponectin and leptin compared to individuals from a similar population and the studies showing significant improvements with exercise training were found in individuals with altered baseline values of these markers [32,33,34,35]. Furthermore, it is possible the high level of education (Training:10.18 ± 4.6 and Control:11.17 ± 4.28 years of study) and socioeconomic status of our sample (individuals aging in a well-developed location around the University) contributed to good control of their comorbidities.
There were a few changes in patients’ medication over the course of the study. Since there were only reductions in doses of medication for the Training group, and increase was observed for Control, the contribution of medications to lower BP would be expected to be more persistent in Control and may have contributed to in the lack of an observed training effect. However, considering this population exhibited complex medication regimens and a high likelihood of fragmented care, the reduction in the medication burden observed in Training would be valuable.
It was not possible to confirm our initial hypothesis that immune system and autonomic modulation influences BP reduction, as none of these variables were altered by Training. Thus, this is a limitation of the study and it is not clear if this population may need a different training prescription or other associated interventions to achieve benefits [25]. Regarding the applicability of the trial, the heterogeneity of participants’ responses reinforces the need for individualized prescription that goes beyond the intensity of exercise, as conducted here, but should also be extended to the training components such as variations in volume, frequency and duration of intervention. New clinical trials are already ongoing to test the effectiveness of combined training to reduce BP and other health-related outcomes in hypertensive older adults. One of them is going to test a protocol that is similar to the one tested here [36] and the other one will manipulate different weekly frequencies of combined training for 12 weeks [37].
In addition, it is noteworthy that our sample size calculation was estimated for comparison between two times and two groups, while we analyzed five time points leading to considerably lower power in our analysis. On the other hand, there is no previous controlled trial reporting such detailed time-course of exercise training effects on hypertensive older adults, and this information might add important value to the exercise physiology literature. Specifically, these data highlight the natural effect of time (independent of exercise) that might be considered in future studies.
5. Conclusions
Although Training led to important benefits in cardiorespiratory fitness, strength and body mass, specific cardiometabolic variables and blood markers were not improved in hypertensive older adults. Since the within-subject data for most variables were stable throughout in both Training and Control (individual data can be assessed in the Supplementary Material), and there was high variability between subjects, we suggest studies assessing such adaptations at only one time point, using simpler statistical models, can report random changes caused by type 1 error. Thus, future studies should investigate the effects of different exercise protocols in hypertensive older adults, with robust statistical methods.
Supplementary Materials
The following supporting information can be downloaded at: https://www.mdpi.com/article/10.3390/ijerph191711042/s1, Figure S1a: Individual data, median and interquartile range for Physical fitness: Muscle strength and maximum oxygen consumption; Figure S1b: Individual data, median and interquartile range for Physical fitness: Functionality; Figure S2a: Individual data, median and interquartile range for Blood markers: Glycemic and Lipidic profile; Figure S2b: Individual data, median and interquartile range for Blood markers: Inflammatory profile; Figure S2c: Individual data, median and interquartile range for Blood markers: Oxidative stress profile. Figure S2d: Individual data, median and interquartile range for Blood markers: vasoactive substances; Figure S3a: Individual data, median and interquartile range for Cardiometabolic profile: Body composition; Figure S3b: Individual data, median and interquartile range for Cardiometabolic profile: Cardiovascular function; Table S1: ANOVA 2 way for repeated measures at W0 and at W16.
Author Contributions
A.V.S.: Conceptualization, Methodology, Validation, Formal analysis, Investigation, Data Curation, Writing (Original Draft), Visualization; A.F.G.: Conceptualization, Methodology, Validation, Investigation, Writing (Review and Editing); W.M.d.S.: Validation, Investigation; A.A.d.A.: Methodology, Investigation; K.d.A.: Methodology, Resources; L.O.M.: Writing (Review and Editing); C.R.C.: Methodology, Writing (Review and Editing); B.F.: Conceptualization, Writing (Review and Editing); M.P.T.C.-M.: Conceptualization, Resources, Project administration, Funding acquisition, Supervision. All authors have read and agreed to the published version of the manuscript.
Funding
This research received funding from FAEPEX (Fundo de apoio ao ensino, pesquisa e extensão da Pró-Reitoria Pesquisa da UNICAMP, Preac 384/16). AVS and MPTCM were supported, respectively, by CAPES (Coordenação de Aperfeiçoamento de Pessoal de Ensino superior (01P 04352/2015 and 02-P-4588/2018) and the by CNPq (Conselho Nacional de Desenvolvimento Científico e Tecnológico, 305604/2018).
Institutional Review Board Statement
The study was conducted in accordance with the Declaration of Helsinki, and approved by the Institutional Review Board of COMITÊ DE ÉTICA EM PESQUISA DA UNICAMP-CAMPUS CAMPINAS (protocol code 54943216.7.0000.5404).
Informed Consent Statement
Informed consent was obtained from all subjects involved in the study.
Data Availability Statement
The data presented in this study are available on request from the corresponding author.
Acknowledgments
We acknowledge all the students who worked on this research: Daisa Fabiele G. Moraes, Victor B. Gadelha, Lucas do C. Santos, Marina Lívia V. Ferreira and Simara Maria de J. Prudêncio. At last, we thank the English language review of Kimberly A. Skokin.
Conflicts of Interest
The authors declare no conflict of interest.
References
- Ministério da Saúde. Secretaria de Vigilância em Saúde (SVS): Vigilância de Fatores de Risco e Proteção para Doenças Crônicas por Inquérito Telefônico (VIGITEL). 2016. Available online: https://www.endocrino.org.br/minsterio-da-saude-divulga-dados-do-vigitel-2016/ (accessed on 6 April 2019).
- Weiss, J.; Freeman, M.; Low, A.; Fu, R.; Kerfoot, A.; Paynter, R.; Motu’apuaka, M.; Kondo, K.; Kansagara, D. Benefits and Harms of Intensive Blood Pressure Treatment in Adults Aged 60 Years or Older. Ann. Intern. Med. 2017, 166, 419. [Google Scholar] [CrossRef]
- Williamson, J.D.; Supiano, M.A.; Applegate, W.B.; Berlowitz, D.R.; Campbell, R.C.; Chertow, G.M.; Fine, L.J.; Haley, W.E.; Hawfield, A.T.; Ix, J.H.; et al. Intensive vs Standard Blood Pressure Control and Cardiovascular Disease Outcomes in Adults Aged ≥ 75 Years. JAMA 2016, 315, 2673. [Google Scholar] [CrossRef] [PubMed]
- Cornelissen, V.A.; Smart, N.A. Exercise training for blood pressure: A systematic review and meta-analysis. J. Am. Heart Assoc. 2013, 2, e004473. [Google Scholar] [CrossRef] [PubMed]
- Pescatello, L.S.; MacDonald, H.V.; Lamberti, L.; Johnson, B.T. Exercise for Hypertension: A Prescription Update Integrating Existing Recommendations with Emerging Research. Curr. Hypertens. Rep. 2015, 17, 87. [Google Scholar] [CrossRef] [PubMed]
- Shehab, A.; Elnour, A.A.; Struthers, A.D. A randomised, controlled, double-blind, cross-over pilot study assessing the effects of spironolactone, losartan and their combination on heart rate variability and QT dispersion in patients with chronic heart failure. Cardiovasc. J. Afr. 2008, 19, 292–296. [Google Scholar] [PubMed]
- Brito, L.; Peçanha, T.; Fecchio, R.; Rezende, R.; Sousa, P.; Silva-Júnior, N.; Abreu, A.; Silva, G.; Mion-Junior, D.; Halliwill, J.; et al. Morning versus Evening Aerobic Training Effects on Blood Pressure in Treated Hypertension. Med. Sci. Sports Exerc. 2019, 51, 653–662. [Google Scholar] [CrossRef]
- Pescatello, L.S.; Franklin, B.A.; Fagard, R.; Farquhar, W.B.; Kelley, G.A.; Ray, C.A. Exercise and hypertension. Med. Sci. Sports Exerc. 2004, 36, 533–553. [Google Scholar] [CrossRef]
- Sardeli, A.V.; Griffith, G.J.; Dos Santos, M.V.M.A.; Ito, M.S.R.; Nadruz, W.; Chacon-Mikahil, M.P.T. Do baseline blood pressure and type of exercise influence level of reduction induced by training in hypertensive older adults? A meta-analysis of controlled trials. Exp. Gerontol. 2020, 140, 111052. [Google Scholar] [CrossRef]
- Sardeli, A.V.; Gáspari, A.F.; dos Santos, W.M.; Moraes, D.F.G.; Gadelha, V.B.; Santos, L.D.C.; Ferreira, M.L.V.; Prudêncio, S.M.D.J.; Bonfante, I.L.P.; Rodrigues, B.; et al. Time-course of health-related adaptations in response to combined training in hypertensive elderly: Immune and autonomic modulation interactions. Mot. Rev. Educ. Física 2018, 24, e101866. [Google Scholar] [CrossRef]
- Masson, G.S.; Costa, T.S.R.; Yshii, L.; Fernandes, D.C.; Soares, P.P.S.; Laurindo, F.R.; Scavone, C.; Michelini, L.C. Time-Dependent Effects of Training on Cardiovascular Control in Spontaneously Hypertensive Rats: Role for Brain Oxidative Stress and Inflammation and Baroreflex Sensitivity. PLoS ONE 2014, 9, e94927. [Google Scholar] [CrossRef]
- Page, I.H. Theories concerning causes of hypertension. In Hypertens Res a Memoi 1920–1960, 1st ed.; Pergamon Press: New York, NY, USA, 1989; pp. 56–61. [Google Scholar]
- Chodzko-Zajko, W.J.; Proctor, D.N.; Fiatarone Singh, M.A.; Minson, C.T.; Nigg, C.R.; Salem, G.J.; Skinner, J.S. American College of Sports Medicine position stand. Exercise and physical activity for older adults. Med. Sci. Sports Exerc. 2009, 41, 1510–1530. [Google Scholar] [CrossRef] [PubMed]
- Sardeli, A.V.; Gáspari, A.F.; Chacon-Mikahil, M.P. Acute, short-, and long-term effects of different types of exercise in central arterial stiffness: A systematic review and meta-analysis. J. Sports Med. Phys. Fit. 2018, 58, 923–932. [Google Scholar] [CrossRef] [PubMed]
- MacDougall, J.D.; Tuxen, D.; Sale, D.G.; Moroz, J.R.; Sutton, J.R. Arterial blood pressure response to heavy resistance exercise. J. Appl. Physiol. 1985, 58, 785–790. [Google Scholar] [CrossRef] [PubMed]
- Siri, W. Body composition from fluid spaces and density: Analysis of methods. 1961. Nutrition 1993, 9, 480–491. [Google Scholar]
- Matthews, D.R.; Hosker, J.P.; Rudenski, A.S.; Naylor, B.A.; Treacher, D.F.; Turner, R.C. Homeostasis model assessment: Insulin resistance and beta-cell function from fasting plasma glucose and insulin concentrations in man. Diabetologia 1985, 28, 412–419. [Google Scholar] [CrossRef]
- Teixeira, K.R.C.; dos Santos, C.P.; de Medeiros, L.A.; Mendes, J.A.; Cunha, T.M.; De Angelis, K.; Penha-Silva, N.; de Oliveira, E.P.; Crispim, C.A. Night workers have lower levels of antioxidant defenses and higher levels of oxidative stress damage when compared to day workers. Sci. Rep. 2019, 9, 4455. [Google Scholar] [CrossRef]
- Expert Panel on Detection, Evaluation, and Treatment of High Blood Cholesterol in Adults. Executive Summary of the Third Report of the National Cholesterol Education Program (NCEP) Expert Panel on Detection, Evaluation, and Treatment of High Blood Cholesterol in Adults (Adult Treatment Panel III). JAMA 2001, 285, 2486–2497. [Google Scholar] [CrossRef]
- Sardeli, A.V.; Bellotto, M.L.; Fabiele De Godoi Moraes, D.; Martins, W.; Santos, D.; Bueno Gadelha, V.; Lívia, M.; Ferreira, V.; Patrícia, M.; Chacon-Mikahil, T. Influence of physical training on the food choices of elderly individuals. O Mundo Saúde 2020, 44, 300–310. [Google Scholar] [CrossRef]
- Miura, H.; Takahashi, Y.; Maki, Y.; Sugino, M. Effects of exercise training on arterial stiffness in older hypertensive females. Eur. J. Appl. Physiol. 2015, 115, 1847–1854. [Google Scholar] [CrossRef]
- Gadelha, V.B.; Mikahil, M.P.T.C.; Sardeli, A.V.; Santos, W.M.; Moraes, D.F.G.; Prudêncio, S.M.; Cavaglieri, C.R. Load progression in strength exercises through a physical combined training program for elderly people. Rev. Trab. Iniciaç. Cient. UNICAMP 2019. [Google Scholar] [CrossRef]
- Kneffel, Z.; Murlasits, Z.; Reed, J.; Krieger, J. A meta-regression of the effects of resistance training frequency on muscular strength and hypertrophy in adults over 60 years of age. J. Sports Sci. 2020, 39, 351–358. [Google Scholar] [CrossRef] [PubMed]
- Borde, R.; Hortobágyi, T.; Granacher, U. Dose–Response Relationships of Resistance Training in Healthy Old Adults: A Systematic Review and Meta-Analysis. Sport Med. 2015, 45, 1693–1720. [Google Scholar] [CrossRef] [PubMed]
- American College of Sports Medicine. ACSM’s Guideline for Exercise Testing and Prescription; Wolters Kluwer: Philadelphia, PA, USA, 2017. [Google Scholar]
- Tiggemann, C.L.; Dias, C.P.; Radaelli, R.; Massa, J.C.; Bortoluzzi, R.; Schoenell, M.C.W.; Noll, M.; Alberton, C.L.; Kruel, L.F.M. Effect of traditional resistance and power training using rated perceived exertion for enhancement of muscle strength, power, and functional performance. Age 2016, 38, 42. [Google Scholar] [CrossRef] [PubMed]
- Sardeli, A.V.; Griffth, G.J.; dos Santos, M.V.M.A.; Ito, M.S.R.; Chacon-Mikahil, M.P.T. The effects of exercise training on hypertensive older adults: An umbrella meta-analysis. Hypertens. Res. 2021, 44, 1434–1443. [Google Scholar] [CrossRef]
- Sabag, A.; Najafi, A.; Michael, S.; Esgin, T.; Halaki, M.; Hackett, D. The compatibility of concurrent high intensity interval training and resistance training for muscular strength and hypertrophy: A systematic review and meta-analysis. J. Sports Sci. 2018, 36, 2472–2483. [Google Scholar] [CrossRef] [PubMed]
- Kolbe-Alexander, T.L.; Lambert, E.V.; Charlton, K.E. Effectiveness of a community based low intensity exercise program for older adults. J. Nutr. Health Aging 2006, 10, 21–29. [Google Scholar]
- Gudlaugsson, J.; Gudnason, V.; Aspelund, T.; Siggeirsdottir, K.; Olafsdottir, A.S.; Jonsson, P.V.; Arngrimsson, S.A.; Harris, T.B.; Johannsson, E. Effects of a 6-month multimodal training intervention on retention of functional fitness in older adults: A randomized-controlled cross-over design. Int. J. Behav. Nutr. Phys. Act. 2012, 9, 107. [Google Scholar] [CrossRef]
- Ruangthai, R.; Phoemsapthawee, J. Combined exercise training improves blood pressure and antioxidant capacity in elderly individuals with hypertension. J. Exerc. Sci. Fit. 2019, 17, 67–76. [Google Scholar] [CrossRef]
- Gleeson, M.; Bishop, N.; Walsh, N. Exercise Immunology; Routledge/Taylor & Francis Group: New York, NY, USA, 2013. [Google Scholar]
- Brunelli, D.T.; Chacon-Mikahil, M.P.T.; Gáspari, A.F.; Lopes, W.A.; Bonganha, V.; Bonfante, I.L.P.; Belloto, M.L.; Libardi, C.A.; Cavaglieri, C.R. Combined Training Reduces Subclinical Inflammation in Obese Middle-Age Men. Med. Sci. Sport Exerc. 2015, 47, 2207–2215. [Google Scholar] [CrossRef]
- Herlofson, K.; Heijnen, C.J.; Lange, J.; Alves, G.; Tysnes, O.-B.; Friedman, J.H.; Fagundes, C.P. Inflammation and fatigue in early, untreated Parkinson’s Disease. Acta Neurol. Scand. 2018, 138, 394–399. [Google Scholar] [CrossRef]
- Sardeli, A.V.; Tomeleri, C.M.; Cyrino, E.S.; Fernhall, B.; Cavaglieri, C.R.; Chacon-Mikahil, M.P.T. Effect of resistance training on inflammatory markers of older adults: A meta-analysis. Exp. Gerontol. 2018, 111, 188–196. [Google Scholar] [CrossRef] [PubMed]
- Umpierre, D.; Santos, L.P.; Botton, C.E.; Wilhelm, E.N.; Helal, L.; Schaun, G.Z.; Ferreira, G.D.; De Nardi, A.T.; Pfeifer, L.O.; da Silveira, A.D.; et al. The “hypertension Approaches in the Elderly: A Lifestyle study” multicenter, randomized trial (HAEL Study): Rationale and methodological protocol. BMC Public Health 2019, 19, 657. [Google Scholar] [CrossRef] [PubMed] [Green Version]
- Ferrari, R.; Domingues, L.B.; De Oliveira Carpes, L.; Frank, P.D.A.; Schneider, V.M.; Fuchs, S.C. Effects of combined training performed two or four times per week on 24-h blood pressure, glycosylated hemoglobin and other health-related outcomes in aging individuals with hypertension: Rationale and study protocol of a randomized clinical trial. PLoS ONE 2021, 16, e0251654. [Google Scholar] [CrossRef] [PubMed]
Publisher’s Note: MDPI stays neutral with regard to jurisdictional claims in published maps and institutional affiliations. |
© 2022 by the authors. Licensee MDPI, Basel, Switzerland. This article is an open access article distributed under the terms and conditions of the Creative Commons Attribution (CC BY) license (https://creativecommons.org/licenses/by/4.0/).