
Physical, Psychological, and Body Composition Differences between Active and Sedentary Adolescents According to the “Fat but Fit” Paradigm

 ,
,  ,
,  and
and
Abstract
1. Introduction
2. Materials and Methods
2.1. Design
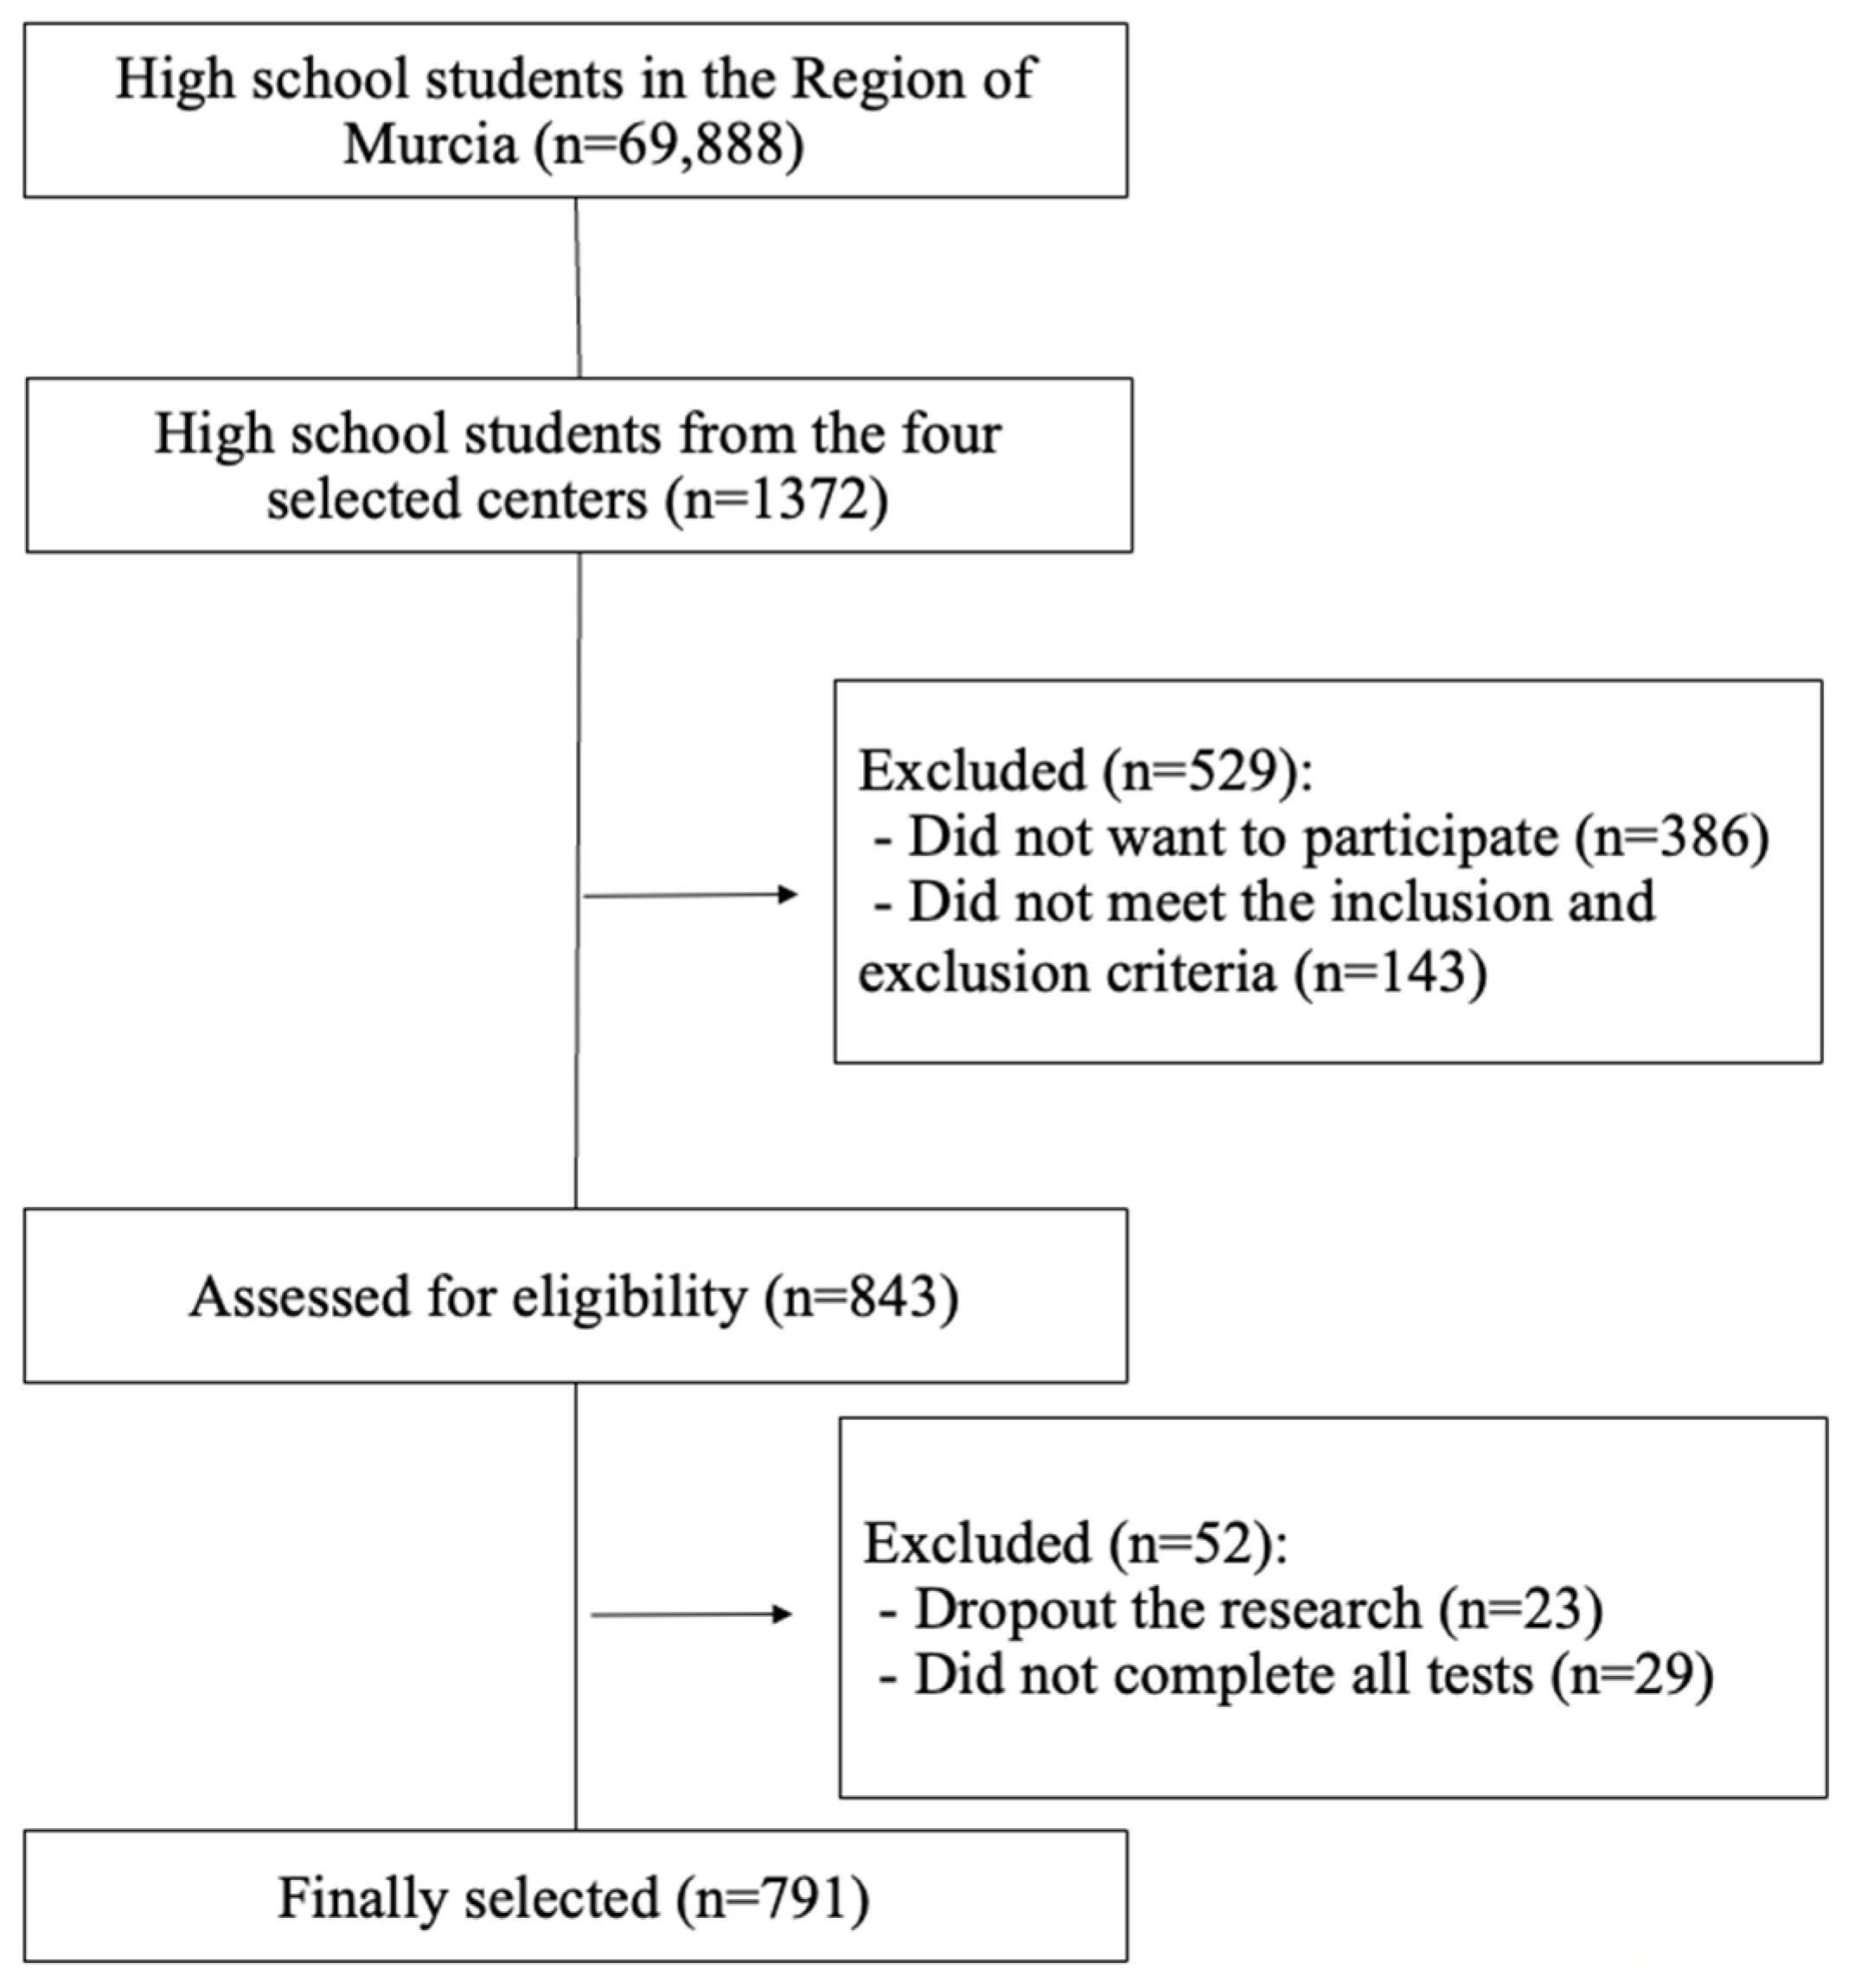
2.2. Participants
2.3. Instrumentation
2.3.1. Questionnaire Measures
2.3.2. Body Composition Measurement
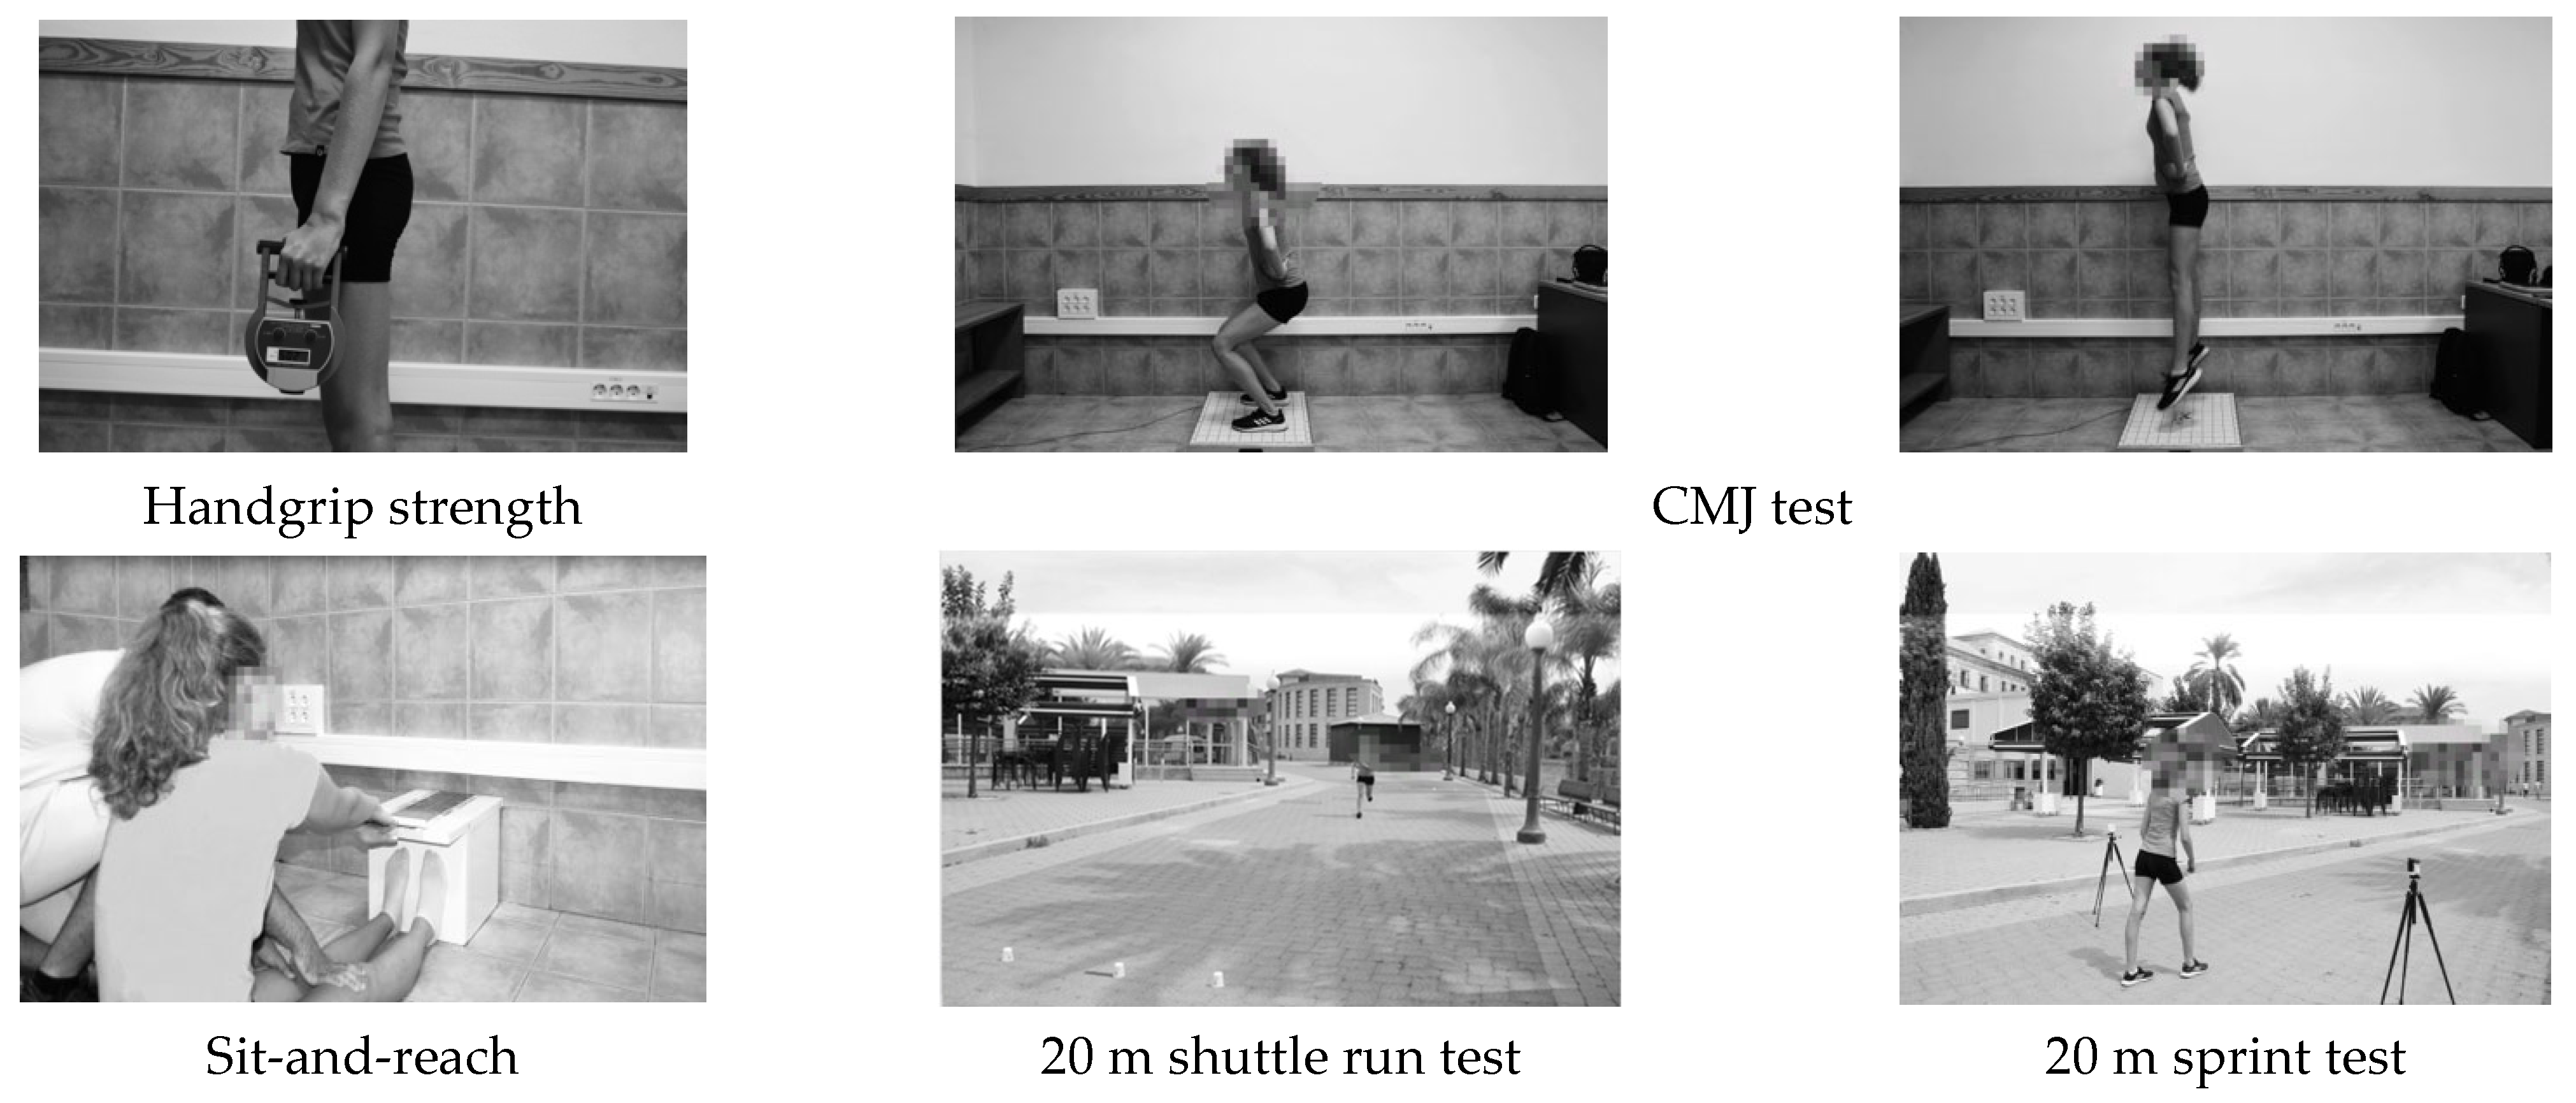
2.3.3. Physical Fitness Test
2.4. Procedure
2.5. Data Analysis
3. Results
3.1. Intraclass Correlation Coefficients (ICC) and Coefficient of Variation (CV) in Fitness Tests
3.2. Differences between Active and Sedentary Adolescents
3.3. Binary Logistic Regression Analysis to Determine the Primary Outcome among the Significant Variables to Distinguish Active and Sedentary Groups
3.4. Differences between Sedentary Adolescents According to Weight Status
3.5. Differences between Active Adolescents According to Weight Status
3.6. Differences between Active and Sedentary Adolescents with the Same Weight Status
4. Discussion
5. Conclusions
Author Contributions
Funding
Institutional Review Board Statement
Informed Consent Statement
Data Availability Statement
Acknowledgments
Conflicts of Interest
References
- Anderson, E.; Durstine, J.L. Physical activity, exercise, and chronic diseases: A brief review. Sports Med. Health Sci. 2019, 1, 3–10. [Google Scholar] [CrossRef] [PubMed]
- Lee, E.Y.; Yoon, K.H. Epidemic obesity in children and adolescents: Risk factors and prevention. Front. Med. 2018, 12, 658–666. [Google Scholar] [CrossRef] [PubMed]
- Wellman, R.J.; Sylvestre, M.; Nader, P.A.; Chiolero, A.; Mesidor, M.; Dugas, E.N.; Tougri, G.; O’Loughlin, J. Intensity and frequency of physical activity and high blood pressure in adolescents: A longitudinal study. J. Clin. Hypertens. 2020, 22, 283–290. [Google Scholar] [CrossRef]
- Fernandes, R.A.; Zanesco, A. Early physical activity promotes lower prevalence of chronic diseases in adulthood. Hypertens. Res. 2010, 33, 926–931. [Google Scholar] [CrossRef]
- Neto, A.; Sasaki, J.; Mascarenhas, L. Physical activity, cardiorespiratory fitness and metabolic syndrome in adolescents. BMC Public Health 2011, 11, 674. [Google Scholar] [CrossRef]
- Farooq, A.; Martin, A.; Janssen, X.; Wilson, M.G.; Gibson, A.; Hughes, A.; Reilly, J.J. Longitudinal changes in moderate-to-vigorous-intensity physical activity in children and adolescents: A systematic review and meta-analysis. Obes. Rev. 2020, 21, e12953. [Google Scholar] [CrossRef]
- García-Hermoso, A.; Ezzatvar, Y.; López-Gil, J.F.; Ramírez-Vélez, R.; Olloquequi, J.; Izquierdo, M. Is adherence to the Mediterranean Diet associated with healthy habits and physical fitness? A systematic review and meta-analysis including 565,421 youths. Br. J. Nutr. 2020, 9, 1–12. [Google Scholar] [CrossRef]
- Bravo-Sánchez, A.; Morán-García, J.; Abián, P.; Abián-Vicén, J. Association of the use of the mobile phone with physical fitness and academic performance: A cross-sectional study. Int. J. Environ. Res. Public Health 2021, 18, 1042. [Google Scholar] [CrossRef]
- Agata, K.; Monyeki, M.A. Association between sport participation, body composition, physical fitness, and social correlates among adolescents: The PAHL study. Int. J. Environ. Res. Public Health 2018, 15, 2793. [Google Scholar] [CrossRef]
- Ferrari, G.L.D.M.; Matsudo, V.K.R.; Fisberg, M. Changes in physical fitness and nutritional status of schoolchildren in a period of 30 years (1980–2010). Rev. Paul. Pediatr. 2015, 33, 415–422. [Google Scholar] [CrossRef][Green Version]
- Arboix-Alió, J.; Buscà, B.; Sebastiani, E.M.; Aguilera-Castells, J.; Marcaida, S.; Garcia Eroles, L.; Sánchez López, M.J. Temporal trend of cardiorespiratory endurance in urban Catalan high school students over a 20 year period. PeerJ 2020, 8, e10365. [Google Scholar] [CrossRef] [PubMed]
- Tomkinson, G.R.; Lang, J.J.; Tremblay, M.S. Temporal trends in the cardiorespiratory fitness of children and adolescents representing 19 high-income and upper middle-income countries between 1981 and 2014. Br. J. Sports Med. 2019, 53, 478–486. [Google Scholar] [CrossRef] [PubMed]
- Roura, E.; Mila-Villarroel, R.; Pareja, S.L.; Caballero, A.A. Assessment of eating habits and physical activity among Spanish adolescents. the “Cooking and Active Leisure” TAS program. PLoS ONE 2016, 11, e0159962. [Google Scholar] [CrossRef]
- Yan, Y.; Liu, J.; Zhao, X.; Cheng, H.; Huang, G.; Mi, J.; Dong, H.; Hou, D.; Chen, F.; Meng, L.; et al. Regional Adipose Compartments Confer Different Cardiometabolic Risk in Children and Adolescents: The China Child and Adolescent Cardiovascular Health Study. Mayo Clin. Proc. 2019, 94, 1974–1982. [Google Scholar] [CrossRef] [PubMed]
- Castedo, A.; Alonso, J.; Portela-Pino, I. Barreras percibidas para la práctica del ejercicio físico en adolescentes: Diferencias según sexo, edad y práctica deportiva. Revista de Psicología del Deporte 2020, 29, 84–90. [Google Scholar]
- Castañeda-Babarro, A.; Arbillaga-Etxarri, A.; Gutiérrez-Santamaría, B.; Coca, A. Physical Activity Change during COVID-19 Confinement. Int. J. Environ. Res. Public Health 2020, 17, 6878. [Google Scholar] [CrossRef]
- Reche-García, C.; Hernández Morante, J.J.; Trujillo Santana, J.T.; Cisneros, C.A.G.; Romero, J.R.; Montero, F.J.O. Bienestar psicológico de deportistas adolescentes mexicanos confinados por la pandemia del COVID-19. Cultura Ciencia Deporte 2022, 17, 7–14. [Google Scholar] [CrossRef]
- Auhuber, L.; Vogel, M.; Grafe, N.; Kiess, W.; Poulain, T. Leisure Activities of Healthy Children and Adolescents. Int. J. Environ. Res. Public Health 2019, 16, 2078. [Google Scholar] [CrossRef]
- Dewi, R.C.; Rimawati, N.; Purbodjati. Body mass index, physical activity, and physical fitness of adolescence. J. Public Health Res. 2021, 10. [Google Scholar] [CrossRef]
- Yu, H.; Mao, L. Adolescent Fitness Tests as Predictors of Adult Fitness in China. In Proceedings of the 2010 International Symposium on Children and Youth Fitness and Health, Nanjing, China, 28–31 October 2010; Volume 4, pp. 237–240. [Google Scholar]
- Marques, A.; Henriques-Neto, D.; Peralta, M.; Martins, J.; Gomes, F.; Popovic, S.; Masanovic, B.; Demetriou, Y.; Schlund, A.; Ihle, A. Field-Based Health-Related Physical Fitness Tests in Children and Adolescents: A Systematic Review. Front. Pediatrics 2021, 9, 640028. [Google Scholar] [CrossRef]
- Torres-Costoso, A.; Garrido-Miguel, M.; Gracia-Marco, L.; López-Muñoz, P.; Reina-Gutiérrez, S.; de Arenas-Arroyo, S.N.; Martínez-Vizcaíno, V. The “Fat but Fit” Paradigm and Bone Health in Young Adults: A Cluster Analysis. Nutrients 2021, 13, 518. [Google Scholar] [PubMed]
- Ortega, F.B.; Ruiz, J.R.; Labayen, I.; Lavie, C.J.; Blair, S.N. The Fat but Fit paradox: What we know and don’t know about it. Br. J. Sports Med. 2018, 52, 151–153. [Google Scholar] [CrossRef] [PubMed]
- Mateo-Orcajada, A.; González-Gálvez, N.; Abenza-Cano, L.; Vaquero-Cristóbal, R. Differences in Physical Fitness and Body Composition Between Active and Sedentary Adolescents: A Systematic Review and Meta-Analysis. J. Youth Adolesc. 2022, 51, 177–192. [Google Scholar] [CrossRef] [PubMed]
- Andersen, L. Changes in physical-activity are reflected in changes in fitness during late adolescence—A 2 year follow up study. J. Sports Med. Phys. Fit. 1994, 34, 390–397. [Google Scholar]
- Saevarsson, E.; Rognvaldsdottir, V.; Stefansdottir, R.; Johannsson, E. Organized sport participation, physical activity, sleep and screen time in 16-year-old adolescents. Int. J. Environ. Res. Public Health 2021, 18, 3162. [Google Scholar] [CrossRef] [PubMed]
- Ara, I.; Aparicio-Ugarriza, R.; Morales-Barco, D.; de Souza, W.N.; Mata, E.; González-Gross, M. Estimación de la actividad física en población general; cuestionarios validados. Nutr. Hosp. 2015, 31, 211–218. [Google Scholar] [CrossRef]
- Martínez-Gómez, D.; Martínez-de-Haro, V.; Pozo, T.; Welk, G.J.; Villagra, A.; Calle, M.E.; Marcos, A.; Veiga, O.L. Fiabilidad y validez del cuestionario de actividad física PAQ-A en adolescentes españoles. Revista Española Salud Pública 2009, 83, 427–439. [Google Scholar] [CrossRef]
- Benítez-Porres, J.; Alvero-Cruz, J.R.; Sardinha, L.B.; López-Fernández, I.; Carnero, E.A. Cut-off values for classifying children and adolescents using the Physical Activity Questionnaire: PAQ-C and PAQ-A. Nutr. Hosp. 2016, 33, 1036–1044. [Google Scholar] [CrossRef]
- Vandenbroucke, J.P.; von Elm, E.; Altman, D.G.; Gøtzsche, P.C.; Mulrow, C.D.; Pocock, S.J.; Poole, C.; Schlesselman, J.J.; Egger, M.; STROBE Initiative. Strengthening the Reporting of Observational Studies in Epidemiology (STROBE): Explanation and elaboration. Int. J. Surg. 2014, 12, 1500–1524. [Google Scholar] [CrossRef]
- Palacios-Cartagena, R.P.; Parraca, J.A.; Mendoza-Muñoz, M.; Pastor-Cisneros, R.; Muñoz-Bermejo, L.; Adsuar, J.C. Level of Physical Activity and Its Relationship to Self-Perceived Physical Fitness in Peruvian Adolescents. Int. J. Environ. Res. Public Health 2022, 19, 1182. [Google Scholar] [CrossRef]
- Centro Regional de Estadística de Murcia (CREM). Padrón Municipal de Habitantes de la Región de Murcia. 2021. Available online: https://econet.carm.es/inicio/-/crem/sicrem/PU_padron/sec0.html (accessed on 1 February 2021).
- Consejería de Educación. Comunidad Autónoma de la Región de Murcia. Educación. Centros Educativos. 2022. Available online: https://www.carm.es/web/pagina?IDCONTENIDO=792&IDTIPO=140&RASTRO=c77$m (accessed on 1 February 2021).
- Serra-Majem, L.; Ribas, L.; Ngo, J.; Ortega, R.M.; García, A.; Pérez-Rodrigo, C.; Aranceta, J. Food, youth and the Mediterranean diet in Spain. Development of KIDMED, Mediterranean Diet Quality Index in children and adolescents. Public Health Nutr. 2004, 7, 931–935. [Google Scholar] [CrossRef] [PubMed]
- Štefan, L.; Čule, M.; Milinović, I.; Sporiš, G.; Juranko, D. The relationship between adherence to the Mediterranean diet and body composition in Croatian university students. Eur. J. Integr. Med. 2017, 13, 41–46. [Google Scholar] [CrossRef]
- Esparza-Ros, F.; Vaquero-Cristóbal, R.; Marfell-Jones, M. International Standards for Anthropometric Assessment; International Society for Advancement in Kinanthropometry: Murcia, Spain, 2019. [Google Scholar]
- Slaughter, M.H.; Lohman, T.G.; Boileau, R.A.; Horswill, C.A.; Stillman, R.J.; Van Loan, M.D.; Bemben, D.A. Skinfold equations for estimation of body fatness in children and youth. Hum. Biol. 1988, 60, 709–723. [Google Scholar] [PubMed]
- Poortmans, J.R.; Boisseau, N.; Moraine, J.-J.; Moreno-Reyes, R.; Goldman, S. Estimation of total-body skeletal muscle mass in children and adolescents. Med. Sci. Sports Exerc. 2005, 37, 316–322. [Google Scholar] [CrossRef] [PubMed]
- NHLBI Obesity Education Initiative Expert Panel on the Identification, Evaluation and Treatment of Overweight and Obesity in Adults (US). Clinical Guidelines on the Identification, Evaluation, and Treatment of Overweight and Obesity in Adults; University of Michigan: Ann Arbor, MI, USA, 1998. [Google Scholar]
- Yan, W.; He, B.; Hua, Y.; Dai, J.; Cui, J.; Ge, D.; Zheng, Y.; Li, L.; Guo, Y.; Xiao, K.; et al. Waist-to-height ratio is an accurate and easier index for evaluating obesity in children and adolescents. Obesity 2007, 15, 748–752. [Google Scholar] [CrossRef]
- Jelliffe, E.; Jelliffe, D. The arm circumference as a public health index of protein-calorie malnutrition of early childhood. J. Trop. Pediatrics 1969, 15, 177–260. [Google Scholar]
- Spenst, L.F.; Martin, A.D.; Drinkwater, D.T. Muscle mass of competitive male athletes. J. Sports Sci. 1993, 11, 3–8. [Google Scholar] [CrossRef]
- Mirwald, R.L.; Baxter-jones, A.D.G.; Bailey, D.A.; Beunen, G.P. Physical Fitness and Performance. Med. Sci. Sports Exerc. 2002, 34, 689–694. [Google Scholar] [PubMed]
- Albaladejo-Saura, M.; Vaquero-Cristóbal, R.; García-Roca, J.A.; Esparza-Ros, F. The Effect of Age, Biological Maturation and Birth Quartile in the Kinanthropometric and Physical Fitness Differences between Male and Female Adolescent Volleyball Players. Children 2022, 9, 58. [Google Scholar] [CrossRef]
- Albaladejo-Saura, M.; Vaquero-Cristóbal, R.; Esparza-Ros, F. Methods for estimating biological maturation in developing and growing athletes: A literature review. Cult. Cienc. Y Deporte 2022, 17, 55–64. [Google Scholar]
- Mayorga-Vega, D.; Merino-Marban, R.; Viciana, J. Criterion-Related Validity of Sit-and-Reach Tests for Estimating Hamstring and Lumbar Extensibility: A Meta-Analysis. J. Sports Sci. Med. 2014, 13, 1–14. [Google Scholar] [PubMed]
- López-Miñarro, P.Á.; Vaquero-Cristóbal, R.; Muyor, J.M.; Espejo-Antunez, L. Criterion-related validity of sit-and-reach test as a measure of hamstring extensibility in older women. Nutr. Hosp. 2015, 32, 312–317. [Google Scholar] [CrossRef] [PubMed]
- Matsudo, V.K.R.; Matsudo, S.M.; De Rezende, L.F.M.; Raso, V. Handgrip strength as a predictor of physical fitness in children and adolescents. Revista Brasileira Cineantropometria Desempenho Humano 2014, 17, 1–10. [Google Scholar] [CrossRef]
- España-Romero, V.; Ortega, F.B.; Vicente-Rodríguez, G.; Artero, E.G.; Rey, J.P.; Ruiz, J.R. Elbow position affects handgrip strength in adolescents: Validity and reliability of Jamar, Dynex, and TKK dynamometers. J. Strength Cond. Res. 2010, 24, 272–277. [Google Scholar] [CrossRef] [PubMed]
- García-Manso, J.; Navarro, M.; Ruíz-Caballero, J. Pruebas para la valoración de la capacidad motriz en el deporte. In Evaluación de la Condición Física; Gymnos: Madrid, Spain, 1996. [Google Scholar]
- Altmann, S.; Spielmann, M.; Engel, F.A.; Neumann, R.; Ringhof, S.; Oriwol, D.; Haertel, S. Validity of Single-Beam Timing Lights at Different Heights. J. Strength Cond. Res. 2017, 31, 1994–1999. [Google Scholar] [CrossRef] [PubMed]
- Cronin, J.; Templeton, R. Timing light height affects sprint times. J. Strength Cond. Res. 2008, 22, 318–320. [Google Scholar] [CrossRef]
- Barker, L.A.; Harry, J.R.; Mercer, J.A. Relationships between countermovement jump groud reaction forces and jump height, reactive strength index, and jump time. J. Strength Cond. Res. 2018, 32, 248–254. [Google Scholar] [CrossRef]
- Léger, L.A.; Mercier, D.; Gadoury, C.; Lambert, J. The multistage 20 metre shuttle run test for aerobic fitness. J. Sports Sci. 1988, 6, 93–101. [Google Scholar] [CrossRef]
- Tomkinson, G.R.; Lang, J.J.; Blanchard, J.; Léger, L.A.; Tremblay, M.S. The 20-m shuttle run: Assessment and interpretation of data in relation to youth aerobic fitness and health. Pediatric Exerc. Sci. 2019, 31, 152–163. [Google Scholar] [CrossRef]
- Díaz-Soler, M.A.; Vaquero-Cristóbal, R.; Espejo-Antúnez, L. Efecto de un protocolo de calentamiento en la distancia alcanzada en el test sit-and-reach en alumnos adolescents. Nutr. Hosp. 2015, 31, 2618–2623. [Google Scholar] [CrossRef]
- Coburn, J.; Malek, M. Manual NSCA: Fundamentos del Entrenamiento Personal, 2nd ed.; Paidotribo: Barcelona, Spain, 2014. [Google Scholar]
- Hopkins, W.G.; Marshall, S.W.; Batterham, A.M.; Hanin, J. Progressive statistics for studies in sports medicine and exercise science. Med. Sci. Sports Exerc. 2009, 41, 3–12. [Google Scholar] [CrossRef] [PubMed]
- Bogataj, Š.; Trajković, N.; Cadenas-Sanchez, C.; Sember, V. Effects of school-based exercise and nutrition intervention on body composition and physical fitness in overweight adolescent girls. Nutrients 2021, 13, 238. [Google Scholar] [CrossRef] [PubMed]
- García, G.M.G.; Gálvez, N.G.; García, A.E.; Pardo, P.J.M.; Fernández, F.T.G.; Aranda, L.M.M. Relationship Between the Practice of Physical Activity and Physical Fitness in Physical Education Students: The Integrated Regulation As a Mediating Variable. Front. Psychol. 2020, 11, 1910. [Google Scholar] [CrossRef]
- Albaladejo-Saura, M.; Vaquero-Cristóbal, R.; García-Roca, J.A.; Esparza-Ros, F. Influence of biological maturation status on selected anthropometric and physical fitness variables in adolescent male volleyball players. PeerJ 2022, 10, e13216. [Google Scholar] [CrossRef] [PubMed]
- Baxter-Jones, A.D.G.; Barbour-Tuck, E.N.; Dale, D.; Sherar, L.B.; Knight, C.J.; Cumming, S.P.; Ferguson, L.J.; Kowalski, K.C.; Humbert, M.L. The role of growth and maturation during adolescence on team-selection and short-term sports participation. Ann. Hum. Biol. 2020, 47, 316–323. [Google Scholar] [CrossRef]
- Nevill, A.M.; Negra, Y.; Myers, T.D.; Duncan, M.J.; Chaabene, H.; Granacher, U. Are Early or Late Maturers Likely to Be Fitter in the General Population? Int. J. Environ. Res. Public Health 2021, 18, 497. [Google Scholar] [CrossRef]
- Mateo-Orcajada, A.; Abenza-Cano, L.; Vaquero-Cristóbal, R.; Martínez-Castro, S.M.; Leiva-Arcas, A.; Gallardo-Guerrero, A.M.; Sánchez-Pato, A. Influence of Gender Stereotypes, Type of Sport Watched and Close Environment on Adolescent Sport Practice According to Gender. Sustainability 2021, 13, 11863. [Google Scholar] [CrossRef]
- Albaladejo-Saura, M.; Vaquero-Cristóbal, R.; González-Gálvez, N.; Esparza-Ros, F. Relationship between biological maturation, physical fitness, and kinanthropometric variables of young athletes: A systematic review and meta-analysis. Int. J. Environ. Res. Public Health 2021, 18, 328. [Google Scholar] [CrossRef]
- Robles Rodríguez, J.; Giménez Fuentes-Guerra, F.J.; Abad Robles, M.T. Motivos que llevan a los profesores de Educación Física a elegir los contenidos deportivos en la E.S.O. (Reasons to take physical education teachers choose the content that in sport in secondary education). Retos 2015, 18, 5–8. [Google Scholar] [CrossRef]
- Williams, A.M.; Ford, P.R.; Drust, B. Talent identification and development in soccer since the millennium. J. Sports Sci. 2020, 38, 1199–1210. [Google Scholar] [CrossRef]
- Teixeira, P.J.; Carraça, E.V.; Markland, D.; Silva, M.N.; Ryan, R.M. Exercise, physical activity, and self-determination theory: A systematic review. Int. J. Behav. Nutr. Phys. Act. 2012, 9, 78. [Google Scholar] [CrossRef]
- Purcell, L. Sport readiness in children and youth. Paediatr. Child Health 2005, 10, 343–344. [Google Scholar] [CrossRef]
- Figueiredo, A.J.; Gonçalves, C.E.; Coelho-E-Silva, M.; Malina, R.M. Characteristics of youth soccer players who drop out, persist or move up. J. Sports Sci. 2009, 27, 883–891. [Google Scholar] [CrossRef] [PubMed]
- Zurita-Ortega, F.; Román-Mata, S.S.; Chacón-Cuberos, R.; Castro-Sánchez, M.; Muros, J.J. Adherence to the mediterranean diet is associated with physical activity, self-concept and sociodemographic factors in university student. Nutrients 2018, 10, 966. [Google Scholar] [CrossRef] [PubMed]
- Couture-Wilhelmy, L.; Chaubet, P.; Gadais, T. Winning conditions for the adoption and maintenance of long-term healthy lifestyles according to physical activity students. Int. J. Environ. Res. Public Health 2021, 18, 11057. [Google Scholar] [CrossRef]
- Schutte, N.M.; Nederend, I.; Hudziak, J.J.; De Geus, E.J.C.; Bartels, M. Differences in Adolescent Physical Fitness: A Multivariate Approach and Meta-analysis. Behav. Genet. 2016, 46, 217–227. [Google Scholar] [CrossRef]
- Rauner, A.; Mess, F.; Woll, A. The relationship between physical activity, physical fitness and overweight in adolescents: A systematic review of studies published in or after 2000. BMC Pediatrics 2013, 13, 19. [Google Scholar] [CrossRef]
- Jaakkola, T.; Yli-Piipari, S.; Huotari, P.; Watt, A.; Liukkonen, J. Fundamental movement skills and physical fitness as predictors of physical activity: A 6-year follow-up study. Scand. J. Med. Sci. Sports 2016, 26, 74–81. [Google Scholar] [CrossRef]
- Aires, L.; Pratt, M.; Lobelo, F.; Santos, R.M.; Santos, M.P.; Mota, J. Associations of cardiorespiratory fitness in children and adolescents with physical activity, active commuting to school, and screen time. J. Phys. Act. Health 2011, 8 (Suppl. 2), 198–205. [Google Scholar] [CrossRef]
- Smith, J.J.; Eather, N.; Weaver, R.G.; Riley, N.; Beets, M.W.; Lubans, D.R. Behavioral Correlates of Muscular Fitness in Children and Adolescents: A Systematic Review. Sports Med. 2019, 49, 887–904. [Google Scholar] [CrossRef]
- Vaquero-Cristóbal, R.; Molina-Castillo, P.; López-Miñarro, P.A.; Albaladejo-Saura, M.; Esparza-Ros, F. Hamstring extensibility differences among elite adolescent and young dancers of different dance styles and non-dancers. PeerJ 2020, 2020, e9237. [Google Scholar] [CrossRef] [PubMed]
- Lang, J.J.; Tremblay, M.S.; Ortega, F.B.; Ruiz, J.R.; Tomkinson, G.R. Review of criterion-referenced standards for cardiorespiratory fitness: What percentage of 1 142 026 international children and youth are apparently healthy? Br. J. Sports Med. 2019, 53, 953–958. [Google Scholar] [CrossRef] [PubMed]
- Gilsanz, V.; Wren, T.A.L.; Ponrartana, S.; Mora, S.; Rosen, C.J. Sexual Dimorphism and the Origins of Human Spinal Health. Endocr. Rev. 2018, 39, 221–239. [Google Scholar] [CrossRef] [PubMed]
- Steene-Johannessen, J.; Hansen, B.H.; Dalene, K.E.; Kolle, E.; Northstone, K.; Møller, N.C.; Grøntved, A.; Wedderkopp, N.; Kriemler, S.; Page, A.S.; et al. Variations in accelerometry measured physical activity and sedentary time across Europe—Harmonized analyses of 47,497 children and adolescents. Int. J. Behav. Nutr. Phys. Act. 2020, 17, 38. [Google Scholar] [CrossRef] [PubMed]
- De Santi, M.; Callari, F.; Brandi, G.; Toscano, R.V.; Scarlata, L.; Amagliani, G.; Schiavano, G.F. Mediterranean diet adherence and weight status among Sicilian Middle school adolescents. Int. J. Food Sci. Nutr. 2020, 71, 1010–1018. [Google Scholar] [CrossRef] [PubMed]
- Rosi, A.; Giopp, F.; Milioli, G.; Melegari, G.; Goldoni, M.; Parrino, L.; Scazzina, F. Weight Status, Adherence to the Mediterranean Diet, Physical Activity Level, and Sleep Behavior of Italian Junior High School Adolescents. Nutrients 2020, 12, 478. [Google Scholar] [CrossRef]
- de Pinho, L.; Silveira, M.F.; de Carvalho Botelho, A.C.; Caldeira, A.P. Identification of dietary patterns of adolescents attending public schools. J. Pediatr. 2014, 90, 267–272. [Google Scholar] [CrossRef]
- Handelsman, D. Sex differences in athletic performance emerge coinciding with the onset of male puberty. Clin. Endocrinol. 2017, 87, 68–72. [Google Scholar] [CrossRef]
- Gerber, B.P.; Pienaar, A.E.; Kruger, A. A longitudinal study of growth patterns in stature, mass, arm span, sitting height and sitting height ratio of boys during the mid-adolescence phase. S. Afr. J. Res. Sport Phys. Educ. Recreat. 2015, 37, 13–30. [Google Scholar]
- Clark, P.A.; Rogol, A.D. Growth hormones and sex steroid interactions at puberty. Endocrinol. Metab. Clin. N. Am. 1996, 25, 665–681. [Google Scholar] [CrossRef]
- Kryst, Ł.; Żegleń, M.; Woronkowicz, A.; Kowal, M. Skeletal and muscular robustness and physical fitness of Polish children and adolescents (3–18 years) with normal weight and overweight/obesity. Anthropol. Anz. 2022, 79, 277–287. [Google Scholar] [CrossRef] [PubMed]
- Zhang, Y.; Liu, S.; Li, Y.; Li, X.; Ren, P.; Luo, F. The Relationships Between Weight Status and Physical Fitness Among Chinese Children and Youth. Res. Q. Exerc. Sport 2019, 90, 113–122. [Google Scholar] [CrossRef] [PubMed]
- Bacchini, D.; Licenziati, M.R.; Affuso, G.; Garrasi, A.; Corciulo, N.; Driul, D.; Tanas, R.; Fiumani, P.M.; Di Pietro, E.; Pesce, S.; et al. The Interplay among BMI z-Score, Peer Victmization, and Self-Concept in Outpatient Children and Adolescents with Overweight or Obesity. Child. Obes. 2017, 13, 242–249. [Google Scholar] [CrossRef]
- Lovecchio, N.; Zago, M. Fitness differences according to BMI categories: A new point of view. J. Sports Med. Phys. Fit. 2019, 59, 298–303. [Google Scholar] [CrossRef] [PubMed]
- Fitts, R.H.; McDonald, K.S.; Schluter, J.M. The determinants of skeletal muscle force and power: Their adaptability with changes in activity pattern. J. Biomech. 1991, 24, 111–122. [Google Scholar] [CrossRef]
- Handelsman, D.J.; Hirschberg, A.L.; Bermon, S. Circulating Testosterone as the Hormonal Basis of Sex Differences in Athletic Performance. Endocr. Rev. 2018, 39, 803–829. [Google Scholar] [CrossRef]
- Mendoza-Muñoz, M.; Adsuar, J.; Pérez-Gómez, J.; Muñoz-Bermejo, L.; Garcia-Gordillo, M.; Carlos-Vivas, J. Influence of body composition on physical fitness in adolescents. Medicina 2020, 56, 328. [Google Scholar] [CrossRef]
- Manzano-Carrasco, S.; Felipe, J.L.; Sanchez-Sanchez, J.; Hernandez-Martin, A.; Gallardo, L.; Garcia-Unanue, J. Weight status, adherence to the mediterranean diet, and physical fitness in spanish children and adolescents: The active health study. Nutrients 2020, 12, 1680. [Google Scholar] [CrossRef]
- Vandewalle, S.; Taes, Y.; Van Helvoirt, M.; Debode, P.; Herregods, N.; Ernst, C.; Roef, G.; Van Caenegem, E.; Roggen, I.; Verhelle, F.; et al. Bone size and bone strength are increased in obese male adolescents. J. Clin. Endocrinol. Metab. 2013, 98, 3019–3028. [Google Scholar] [CrossRef]
- Xu, Y.; Mei, M.; Wang, H.; Yan, Q.; He, G. Association between weight status and physical fitness in chinese mainland children and adolescents: A cross-sectional study. Int. J. Environ. Res. Public Health 2020, 17, 2468. [Google Scholar] [CrossRef]
- García-Hermoso, A.; Correa-Bautista, J.E.; Olloquequi, J.; Ramírez-Vélez, R. Health-related physical fitness and weight status in 13- to 15-year-old Latino adolescents. A pooled analysis. J. Pediatr. 2019, 95, 435–442. [Google Scholar] [CrossRef] [PubMed]
- Esparza-Ros, F.; Moreira, A.C.; Vaquero-Cristóbal, R.; Barrigas, C.; Albaladejo-Saura, M.; Vieira, F. Differences between Four Skinfold Calipers in the Assessment of Adipose Tissue in Young Adult Healthy Population. Nutrients 2022, 14, 2085. [Google Scholar] [CrossRef] [PubMed]


| Descriptive Statistics (M ± SD) | Active vs. Sedentary | Active vs. Sedentary * Gender | Active vs. Sedentary * Age | Active vs. Sedentary * BMI | Active vs. Sedentary * Biological Maturation | |||||||||||||
|---|---|---|---|---|---|---|---|---|---|---|---|---|---|---|---|---|---|---|
| Active (n = 348) | Sedentary (n = 443) | F; p | Mean Diff. | 95% CI | Effect Size (η2) | F | p | Effect Size (η2) | F | p | Effect Size (η2) | F | p | Effect Size (η2) | F | p | Effect Size (η2) | |
| Body mass (Kg) | 57.70 ± 13.04 | 56.77 ± 13.32 | 0.967; p = 0.326 | 0.956 | −0.953; 2.864 | 0.001 | 26.954 | <0.001 | 0.068 | 73.228 | <0.001 | 0.165 | 1133.628 | <0.001 | 0.754 | 1.461 | 0.233 | 0.004 |
| Height (cm) | 164.33 ± 9.18 | 162.76 ± 8.73 | 5.547; p = 0.019 | 1.545 | 0.257; 2.832 | 0.007 | 76.630 | <0.001 | 0.165 | 109.171 | <0.001 | 0.228 | 11.684 | <0.001 | 0.031 | 2.702 | 0.068 | 0.007 |
| Sitting height (cm) | 85.52 ± 4.91 | 84.80 ± 5.21 | 3.786; p = 0.052 | 0.734 | −0.007; 1.474 | 0.005 | 18.754 | <0.001 | 0.048 | 105.134 | <0.001 | 0.222 | 23.915 | <0.001 | 0.061 | 31.681 | <0.001 | 0.078 |
| BMI (kg/m2) | 21.30 ± 3.70 | 21.33 ± 4.06 | 0.001; p = 0.980 | −0.007 | −0.574; 0.559 | 0.001 | 1.566 | 0.210 | 0.004 | 24.320 | <0.001 | 0.059 | - | - | - | 2.299 | 0.101 | 0.006 |
| Fat mass (%) | 21.22 ± 9.96 | 24.14 ± 10.39 | 13.519; p < 0.001 | −2.768 | −4.246; −1.290 | 0.018 | 27.233 | <0.001 | 0.068 | 7.180 | 0.001 | 0.019 | 420.481 | <0.001 | 0.532 | 27.853 | <0.001 | 0.070 |
| Muscle mass (kg) | 20.11 ± 5.22 | 18.06 ± 4.80 | 29.505; p < 0.001 | 2.010 | 1.284; 2.737 | 0.038 | 245.187 | <0.001 | 0.397 | 98.176 | <0.001 | 0.210 | 179.129 | <0.001 | 0.327 | 40.475 | <0.001 | 0.098 |
| Sum 3 skinfolds | 47.67 ± 23.80 | 55.03 ± 25.81 | 14.400; p < 0.001 | −6.969 | −10.574; −3.364 | 0.019 | 35.162 | <0.001 | 0.086 | 7.823 | <0.001 | 0.021 | 390.044 | <0.001 | 0.514 | 29.562 | <0.001 | 0.074 |
| Corrected arm girth (cm) | 21.79 ± 3.05 | 20.96 ± 2.89 | 13.850; p < 0.001 | 0.819 | 0.387; 1.250 | 0.018 | 81.292 | <0.001 | 0.179 | 80.181 | <0.001 | 0.178 | 272.147 | <0.001 | 0.424 | 13.971 | <0.001 | 0.036 |
| Corrected thigh girth (cm) | 41.12 ± 5.21 | 39.52 ± 4.56 | 19.682; p < 0.001 | 1.598 | 0.891; 2.305 | 0.026 | 61.327 | <0.001 | 0.142 | 72.638 | <0.001 | 0.164 | 249.192 | <0.001 | 0.403 | 11.850 | <0.001 | 0.031 |
| Corrected calf girth (cm) | 29.87 ± 3.30 | 28.97 ± 3.13 | 12.340; p < 0.001 | 0.835 | 0.369; 1.302 | 0.016 | 47.761 | <0.001 | 0.114 | 69.306 | <0.001 | 0.158 | 82.276 | <0.001 | 0.182 | 9.412 | <0.001 | 0.025 |
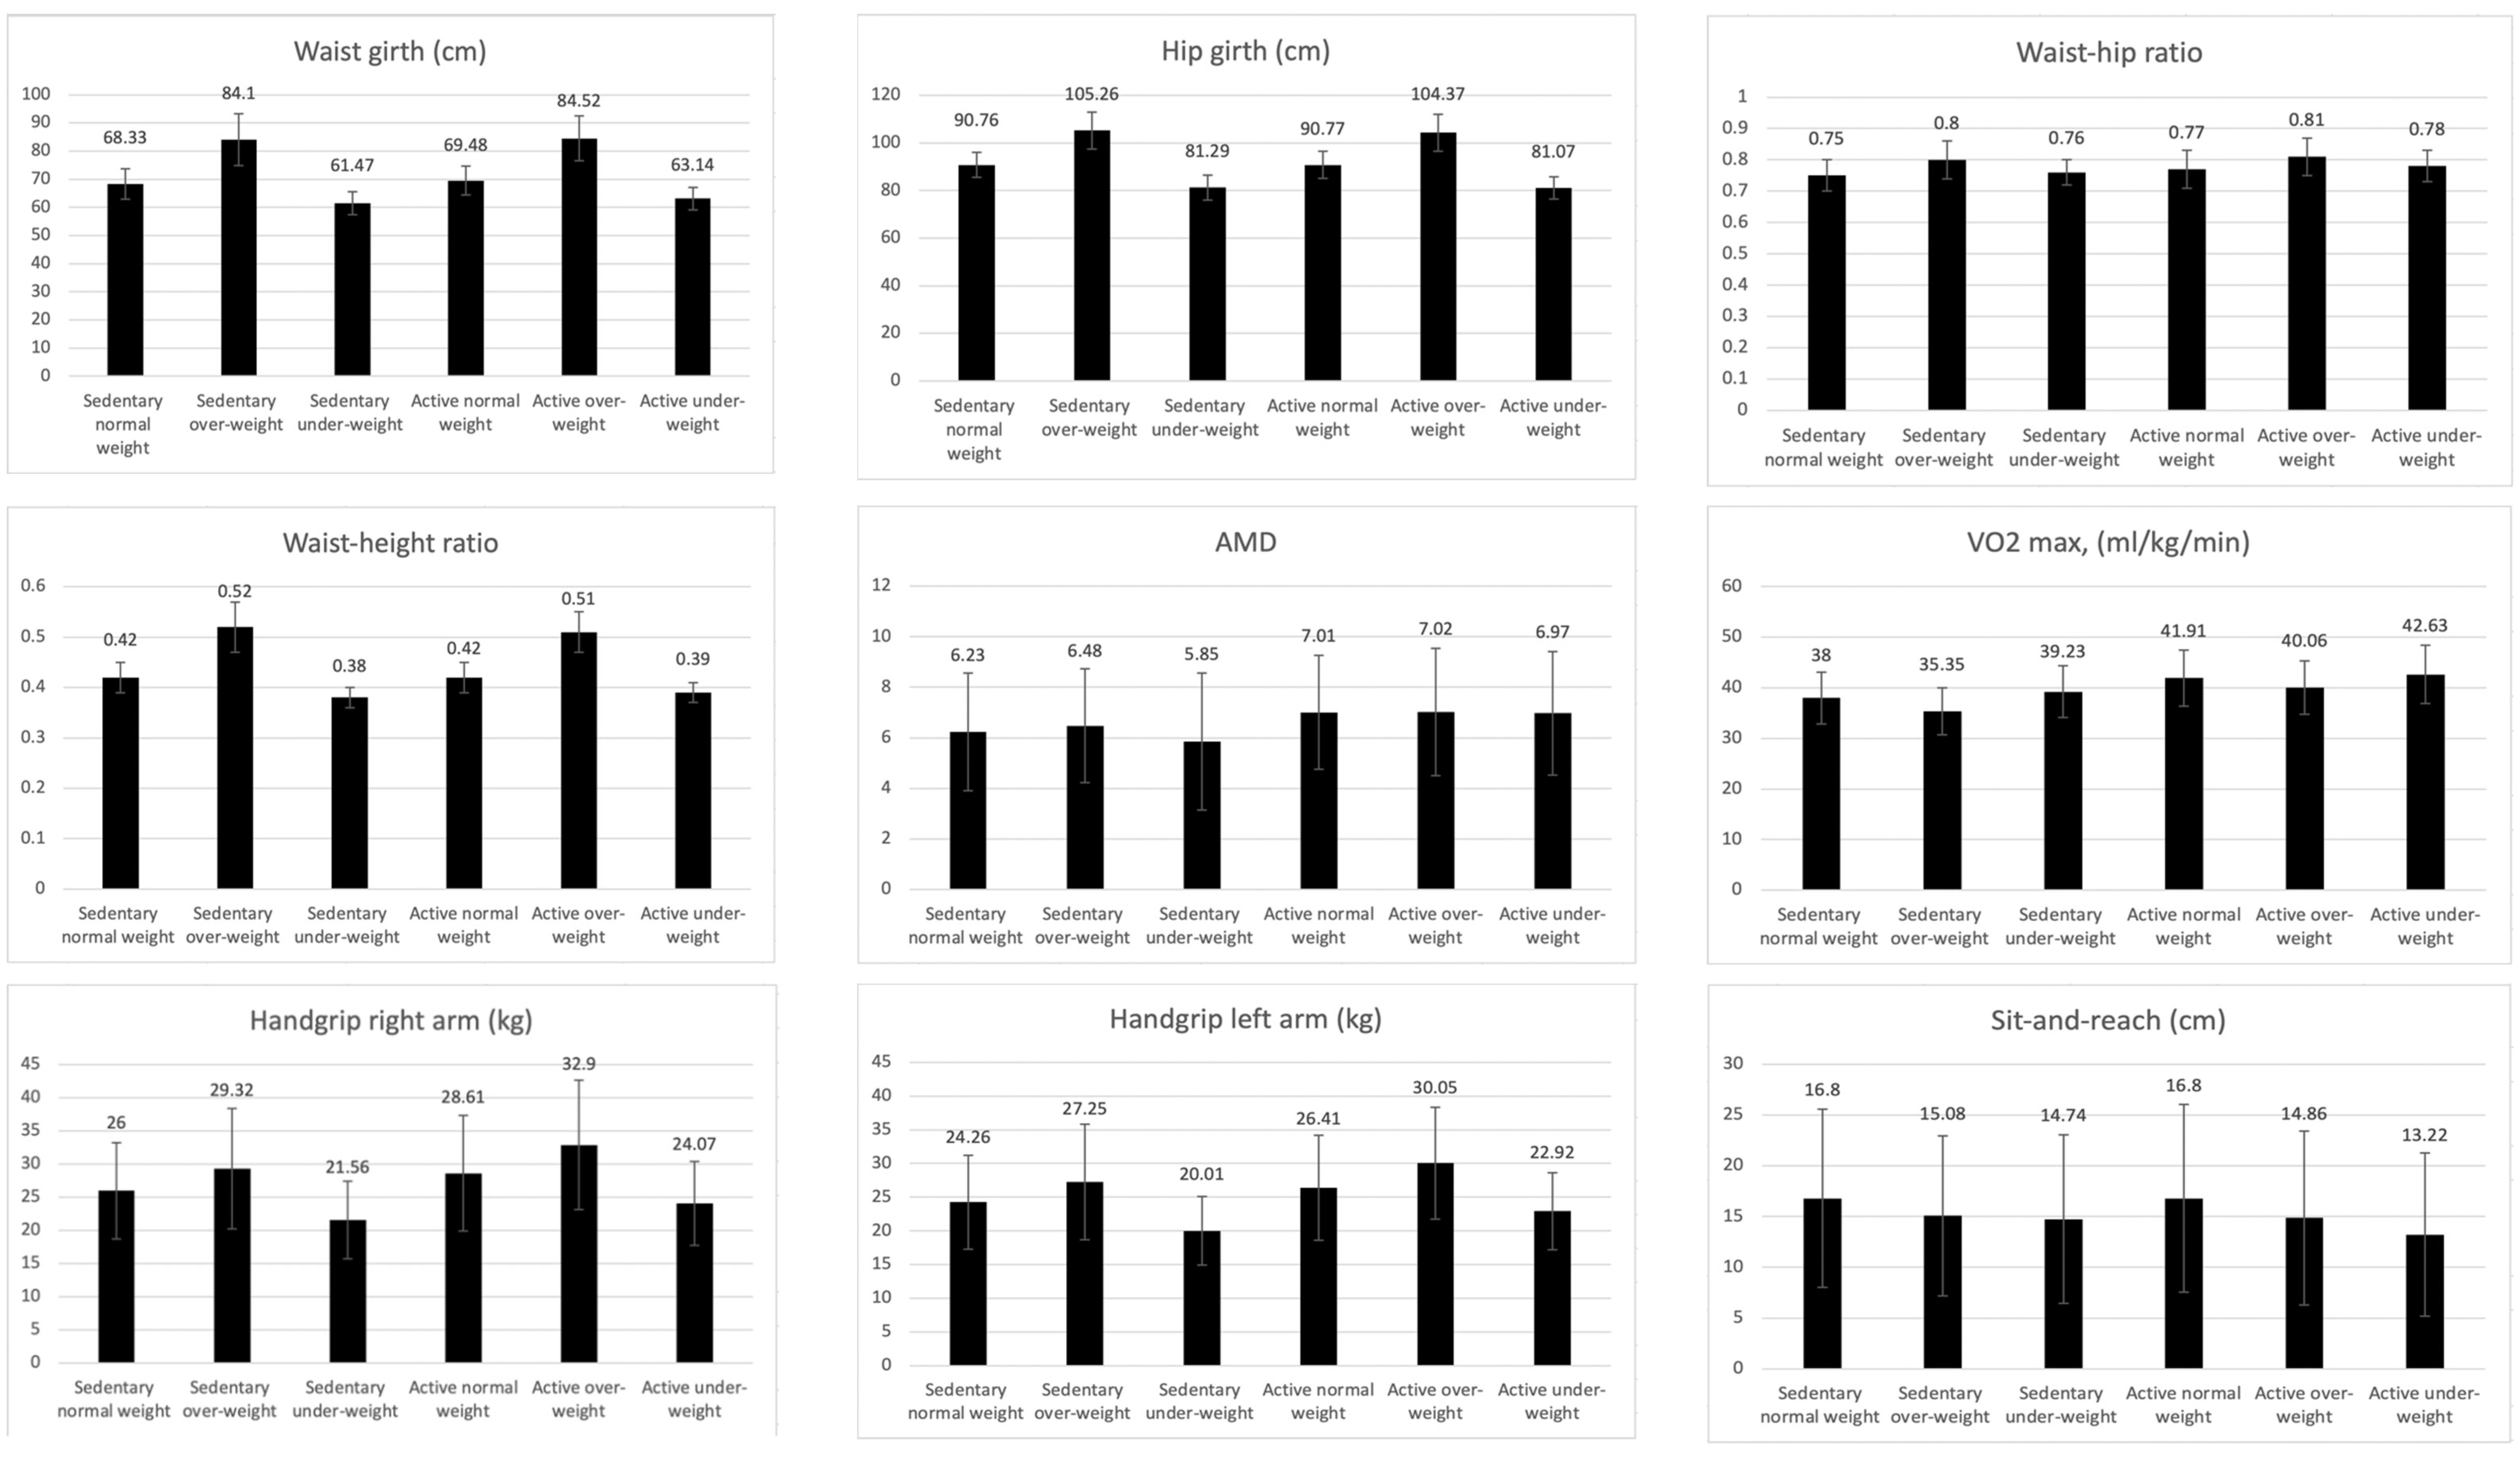
| Waist girth (cm) | 70.19 ± 8.40 | 69.38 ± 9.06 | 1.534; p = 0.216 | 0.803 | −0.470; 2.076 | 0.002 | 49.803 | <0.001 | 0.118 | 27.476 | <0.001 | 0.069 | 1258.918 | <0.001 | 0.773 | 3.721 | 0.025 | 0.010 |
| Hip girth (cm) | 90.50 ± 9.05 | 91.12 ± 9.26 | 0.685; p = 0.408 | −0.558 | −1.881; 0.765 | 0.001 | 0.370 | 0.691 | 0.001 | 73.275 | <0.001 | 0.165 | 1459.358 | <0.001 | 0.798 | 11.716 | <0.001 | 0.031 |
| Waist–hip ratio | 0.78 ± 0.60 | 0.76 ± 0.51 | 13.239; p < 0.001 | 0.015 | 0.007; 0.023 | 0.018 | 227.949 | <0.001 | 0.380 | 11.213 | <0.001 | 0.029 | 29.043 | <0.001 | 0.073 | 87.132 | <0.001 | 0.190 |
| Waist–height ratio | 0.43 ± 0.46 | 0.43 ± 0.53 | 0.060; p = 0.807 | 0.001 | −0.006; 0.008 | 0.001 | 12.746 | <0.001 | 0.033 | 1.401 | 0.247 | 0.004 | 1204.244 | <0.001 | 0.765 | 3.250 | 0.039 | 0.009 |
| AMD | 6.97 ± 2.37 | 6.15 ± 2.46 | 21.885; p < 0.001 | 0.818 | 0.475; 1.161 | 0.029 | 12.177 | <0.001 | 0.032 | 12.546 | <0.001 | 0.033 | 11.292 | <0.001 | 0.030 | 14.621 | <0.001 | 0.038 |
| VO2 max. (mL/kg/min) | 41.81 ± 5.59 | 37.86 ± 5.19 | 100.51; p < 0.001 | 3.967 | 3.190; 4.744 | 0.120 | 138.648 | <0.001 | 0.272 | 59.119 | <0.001 | 0.138 | 70.858 | <0.001 | 0.161 | 69.683 | <0.001 | 0.158 |
| Handgrip right arm (kg) | 28.15 ± 8.78 | 25.64 ± 7.70 | 18.554; p < 0.001 | 2.603 | 1.417; 3.789 | 0.024 | 105.525 | <0.001 | 0.221 | 127.609 | <0.001 | 0.257 | 53.076 | <0.001 | 0.126 | 24.235 | <0.001 | 0.061 |
| Handgrip left arm (kg) | 26.09 ± 7.73 | 23.85 ± 7.27 | 17.497; p < 0.001 | 2.303 | 1.222; 3.383 | 0.023 | 119.805 | <0.001 | 0.244 | 111.783 | <0.001 | 0.232 | 48.736 | <0.001 | 0.117 | 26.244 | <0.001 | 0.066 |
| Sit-and-reach (cm) | 15.69 ± 8.98 | 16.03 ± 8.56 | 0.350; p = 0.554 | −0.382 | −1.650; 0.886 | 0.001 | 60.494 | <0.001 | 0.140 | 23.031 | <0.001 | 0.059 | 0.929 | 0.395 | 0.003 | 10.127 | <0.001 | 0.027 |
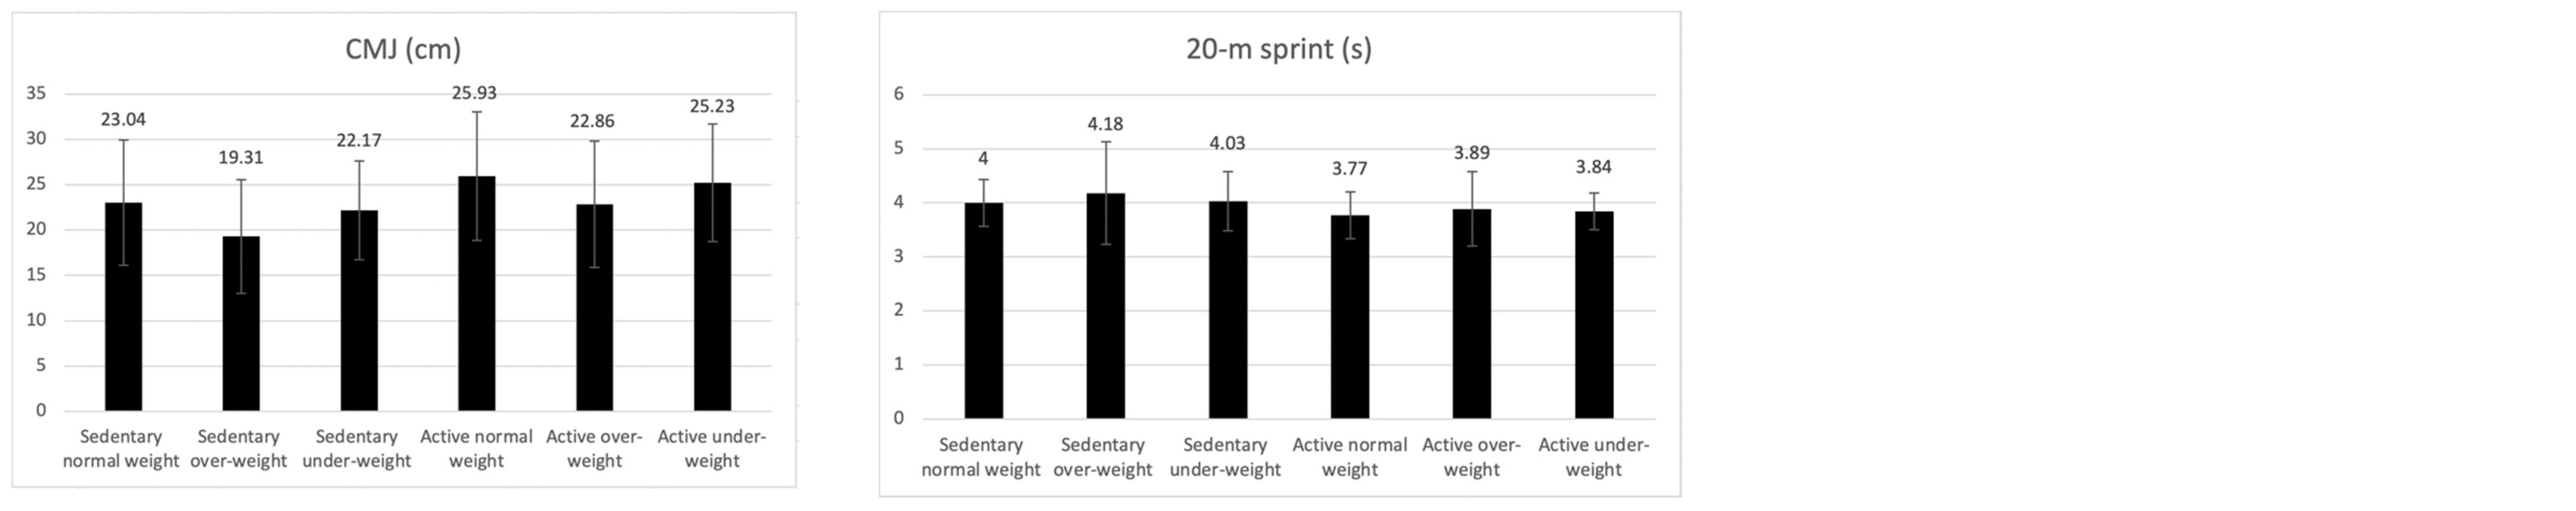
| CMJ (cm) | 25.26 ± 7.12 | 22.20 ± 6.74 | 37.472; p < 0.001 | 3.073 | 2.088; 4.059 | 0.048 | 78.278 | <0.001 | 0.174 | 51.549 | <0.001 | 0.122 | 28.046 | <0.001 | 0.071 | 53.184 | <0.001 | 0.125 |
| 20 m sprint (s) | 3.80 ± 0.46 | 4.03 ± 0.57 | 35.442; p < 0.001 | −0.230 | −0.305; −0.154 | 0.046 | 78.655 | <0.001 | 0.175 | 57.034 | <0.001 | 0.134 | 20.885 | <0.001 | 0.053 | 55.954 | <0.001 | 0.131 |
| Variable | B | Standard Error | Sig. | Exp (B) Odds Ratios | 95% CI |
|---|---|---|---|---|---|
| Body mass (Kg) | −0.194 | 0.081 | 0.017 | 0.823 | 0.702; 0.966 |
| Height (cm) | −0.146 | 0.085 | 0.085 | 0.864 | 0.732; 1.020 |
| Sitting height (cm) | 0.056 | 0.039 | 0.151 | 1.057 | 0.980; 1.140 |
| BMI (kg/m2) | 0.533 | 0.228 | 0.019 | 1.704 | 1.090; 2.664 |
| Fat mass (%) | 0.014 | 0.050 | 0.785 | 1.014 | 0.919; 1.118 |
| Muscle mass (kg) | 0.242 | 0.103 | 0.018 | 1.274 | 1.042; 1.558 |
| Sum 3 skinfolds | −0.003 | 0.021 | 0.903 | 0.997 | 0.958; 1.039 |
| Corrected arm girth (cm) | −0.048 | 0.081 | 0.551 | 0.953 | 0.814; 1.116 |
| Corrected thigh girth (cm) | −0.075 | 0.059 | 0.207 | 0.928 | 0.826; 1.042 |
| Corrected calf girth (cm) | −0.049 | 0.049 | 0.317 | 0.952 | 0.866; 1.048 |
| Waist girth (cm) | 0.054 | 0.283 | 0.848 | 1.056 | 0.606; 1.839 |
| Hip girth (cm) | 0.342 | 0.152 | 0.024 | 1.407 | 1.046; 1.895 |
| Waist–hip ratio | 41.361 | 17.368 | 0.017 | 0.001 | 0.002; 0.765 |
| Waist–height ratio | −83.247 | 42.382 | 0.050 | 0.001 | 0.001; 0.836 |
| AMD | 0.148 | 0.036 | <0.001 | 1.160 | 1.081; 1.244 |
| VO2 max. (mL/kg/min) | 0.113 | 0.020 | <0.001 | 1.120 | 1.078; 1.164 |
| Handgrip right arm (kg) | 0.002 | 0.026 | 0.935 | 1.002 | 0.952; 1.055 |
| Handgrip left arm (kg) | −0.030 | 0.028 | 0.286 | 0.970 | 0.918; 1.026 |
| Sit-and-reach (cm) | 0.008 | 0.011 | 0.469 | 1.008 | 0.987; 1.029 |
| CMJ (cm) | 0.019 | 0.016 | 0.236 | 1.019 | 0.988; 1.052 |
| 20 m sprint (s) | −0.157 | 0.218 | 0.470 | 0.854 | 0.558; 1.309 |
| Variable | Comparison Groups | Mean Differences | 95% CI | p | Effect Size (η2) |
|---|---|---|---|---|---|
| Body mass (Kg) | Sedentary normal weight–sedentary overweight | −20.873 | −23.858; −17.889 | <0.001 | 0.402 |
| Sedentary normal weight–sedentary underweight | 11.533 | 8.882; 14.185 | <0.001 | 0.402 | |
| Sedentary overweight–sedentary underweight | 32.407 | 28.894; 35.920 | <0.001 | 0.402 | |
| Active normal weight–active overweight | −20.620 | −24.029; −17.210 | <0.001 | 0.350 | |
| Active normal weight–active underweight | 11.834 | 9.009; 14.659 | <0.001 | 0.350 | |
| Active overweight–active underweight | 32.454 | 28.540; 36.367 | <0.001 | 0.350 | |
| Height (cm) | Active overweight–sedentary overweight | 3.488 | 0.172; 6.804 | 0.039 | 0.001 |
| Active overweight–active underweight | 4.541 | 0.647; 8.435 | 0.016 | 0.011 | |
| Sitting height (cm) | Active normal weight–sedentary normal weight | 1.043 | 0.126; 1.960 | 0.026 | 0.007 |
| Sedentary overweight–sedentary underweight | 2.668 | 0.685; 4.651 | 0.004 | 0.014 | |
| Active normal weight–active underweight | 2.609 | 1.015; 4.204 | <0.001 | 0.030 | |
| Active overweight–active underweight | 3.974 | 1.765; 6.183 | <0.001 | 0.030 | |
| Fat mass (%) | Active normal weight–sedentary normal weight | −1.786 | 3.243; −0.328 | 0.016 | 0.008 |
| Active overweight–sedentary overweight | −4.909 | −7.898; −1.920 | 0.001 | 0.014 | |
| Active underweight–sedentary underweight | −2.582 | −5.023; −0.141 | 0.038 | 0.006 | |
| Sedentary normal weight–sedentary overweight | −16.021 | −18.698; −13.344 | <0.001 | 0.287 | |
| Sedentary normal weight–sedentary underweight | 5.953 | 3.575; 8.330 | <0.001 | 0.287 | |
| Sedentary overweight–sedentary underweight | 21.973 | 18.823; 25.124 | <0.001 | 0.287 | |
| Active normal weight–active overweight | −12.898 | −15.956; −9.840 | <0.001 | 0.197 | |
| Active normal weight–active underweight | 6.749 | 4.215; 9.282 | <0.001 | 0.197 | |
| Active overweight–active underweight | 19.647 | 16.137; 23.156 | <0.001 | 0.197 | |
| Muscle mass (kg) | Active normal weight–sedentary normal weight | 2.251 | 1.441; 3.060 | <0.001 | 0.039 |
| Active overweight–sedentary overweight | 2.662 | 1.002; 4.321 | 0.002 | 0.013 | |
| Active underweight–sedentary underweight | 1.465 | 0.109; 2.820 | 0.034 | 0.006 | |
| Sedentary normal weight–sedentary overweight | −4.166 | −5.653; −2.680 | <0.001 | 0.122 | |
| Sedentary normal weight–sedentary underweight | 3.199 | 1.879; 4.520 | <0.001 | 0.122 | |
| Sedentary overweight–sedentary underweight | 7.365 | 5.616; 9.115 | <0.001 | 0.122 | |
| Active normal weight–active overweight | −4.577 | −6.275; −2.879 | <0.001 | 0.133 | |
| Active normal weight–active underweight | 3.986 | 2.579; 5.393 | <0.001 | 0.133 | |
| Active overweight–active underweight | 8.563 | 6.614; 10.511 | <0.001 | 0.133 | |
| Sum 3 skinfolds | Active normal weight–sedentary normal weight | −4.189 | −7.784; −0.594 | 0.022 | 0.007 |
| Active overweight–sedentary overweight | −14.808 | −22.180; −7.436 | <0.001 | 0.021 | |
| Sedentary normal weight–sedentary overweight | −39.596 | −46.198; −32.993 | <0.001 | 0.286 | |
| Sedentary normal weight–sedentary underweight | 14.361 | 8.496; 20.226 | <0.001 | 0.286 | |
| Sedentary overweight–sedentary underweight | 53.957 | 46.186; 61.728 | <0.001 | 0.286 | |
| Active normal weight–active overweight | −28.977 | −36.519; −21.434 | <0.001 | 0.175 | |
| Active normal weight–active underweight | 16.099 | 9.850; 22.349 | <0.001 | 0.175 | |
| Active overweight–active underweight | 45.076 | 36.419; 53.733 | <0.001 | 0.175 | |
| Corrected arm girth (cm) | Active normal weight–sedentary normal weight | 1.044 | 0.594; 1.495 | <0.001 | 0.027 |
| Sedentary normal weight–sedentary overweight | −3.142 | −3.969; −2.315 | <0.001 | 0.204 | |
| Sedentary normal weight–sedentary underweight | 2.434 | 1.699; 3.169 | <0.001 | 0.204 | |
| Sedentary overweight–sedentary underweight | 5.576 | 4.602; 6.550 | <0.001 | 0.204 | |
| Active normal weight–active overweight | −2.799 | −3.744; −1.854 | <0.001 | 0.179 | |
| Active normal weight–active underweight | 2.814 | 2.031; 3.597 | <0.001 | 0.179 | |
| Active overweight–active underweight | 5.613 | 4.528; 6.698 | <0.001 | 0.179 | |
| Corrected thigh girth (cm) | Active normal weight–sedentary normal weight | 1.920 | 1.180; 2.659 | <0.001 | 0.034 |
| Active overweight–sedentary overweight | 1.878 | 0.361; 3.394 | 0.015 | 0.008 | |
| Sedentary normal weight–sedentary overweight | −4.292 | −5.650; −2.933 | <0.001 | 0.189 | |
| Sedentary normal weight—sedentary underweight | 4.366 | 3.160; 5.573 | <0.001 | 0.189 | |
| Sedentary overweight—sedentary underweight | 8.658 | 7.060; 10.257 | <0.001 | 0.189 | |
| Active normal weight–active overweight | −4.249 | −5.801; −2.698 | <0.001 | 0.189 | |
| Active normal weight–active underweight | 5.138 | 3.853; 6.424 | <0.001 | 0.189 | |
| Active overweight–active underweight | 9.388 | 7.607; 11.169 | <0.001 | 0.189 | |
| Corrected calf girth (cm) | Active normal weight–sedentary normal weight | 0.899 | 0.352; 1.446 | 0.001 | 0.014 |
| Active overweight–sedentary overweight | 1.213 | 0.091; 2.334 | 0.034 | 0.006 | |
| Sedentary normal weight–sedentary overweight | −1.757 | −2.762; −0.753 | <0.001 | 0.076 | |
| Sedentary normal weight–sedentary underweight | 2.014 | 1–122; 2.907 | <0.001 | 0.076 | |
| Sedentary overweight–sedentary underweight | 3.772 | 2.590; 4.954 | <0.001 | 0.076 | |
| Active normal weight–active overweight | −2.072 | −3.219; −0.924 | <0.001 | 0.080 | |
| Active normal weight–active underweight | 2.223 | 1.272; 3.173 | <0.001 | 0.080 | |
| Active overweight–active underweight | 4.294 | 2.977; 5.611 | <0.001 | 0.080 | |
| Waist girth (cm) | Active normal weight–sedentary normal weight | 1.153 | 0.113; 2.193 | 0.030 | 0.006 |
| Sedentary normal weight–sedentary overweight | −15.773 | −17.683; −13.863 | <0.001 | 0.451 | |
| Sedentary normal weight–sedentary underweight | 6.860 | 5.163; 8.557 | <0.001 | 0.451 | |
| Sedentary overweight–sedentary underweight | 22.633 | 20.385; 24.881 | <0.001 | 0.451 | |
| Active normal weight–active overweight | −15.033 | −17.215; −12.851 | <0.001 | 0.367 | |
| Active normal weight–active underweight | 6.341 | 4.533; 8.148 | <0.001 | 0.367 | |
| Active overweight–active underweight | 21.374 | 18.869; 23.878 | <0.001 | 0.367 | |
| Hip girth (cm) | Sedentary normal weight–sedentary overweight | −14.500 | −16.435; −12.566 | <0.001 | 0.465 |
| Sedentary normal weight–sedentary underweight | 9.476 | 7.758; 11.194 | <0.001 | 0.465 | |
| Sedentary overweight–sedentary underweight | 23.976 | 21.700; 26.253 | <0.001 | 0.465 | |
| Active normal weight–active overweight | −13.601 | −15.811; −11.391 | <0.001 | 0.399 | |
| Active normal weight–active underweight | 9.700 | 7.870; 11.531 | <0.001 | 0.399 | |
| Active overweight–active underweight | 23.301 | 20.765; 25.837 | <0.001 | 0.399 | |
| Waist–hip ratio | Active normal weight–sedentary normal weight | 0.014 | 0.004; 0.024 | 0.005 | 0.010 |
| Active underweight–sedentary underweight | 0.023 | 0.007; 0.039 | 0.006 | 0.010 | |
| Sedentary normal weight–sedentary overweight | −0.046 | −0.064; −0.028 | <0.001 | 0.049 | |
| Sedentary overweight–sedentary underweight | 0.041 | 0.020; 0.063 | <0.001 | 0.049 | |
| Active normal weight–active overweight | −0.043 | −0.064; −0.023 | <0.001 | 0.034 | |
| Active overweight–active underweight | 0.030 | 0.006; 0.053 | 0.007 | 0.034 | |
| Waist–height ratio | Sedentary normal weight–sedentary overweight | −0.097 | −0.107; −0.086 | <0.001 | 0.486 |
| Sedentary normal weight–sedentary underweight | 0.037 | 0.027; 0.046 | <0.001 | 0.486 | |
| Sedentary overweight–sedentary underweight | 0.133 | 0.121; 0.146 | <0.001 | 0.486 | |
| Active normal weight–active overweight | −0.084 | −0.096; −0.072 | <0.001 | 0.365 | |
| Active normal weight–active underweight | 0.033 | 0.023; 0.043 | <0.001 | 0.365 | |
| Active overweight–active underweight | 0.118 | 0.104; 0.131 | <0.001 | 0.365 | |
| AMD | Active normal weight–sedentary normal weight | 0.785 | 0.351; 1.219 | <0.001 | 0.017 |
| Active underweight–sedentary underweight | 1.124 | 0.397; 1.850 | 0.002 | 0.012 | |
| VO2 max. (mL/kg/min) | Active normal weight–sedentary normal weight | 3.906 | 2.941; 4.872 | <0.001 | 0.079 |
| Active overweight–sedentary overweight | 4.713 | 2.733; 6.694 | <0.001 | 0.029 | |
| Active underweight–sedentary underweight | 3.401 | 1.784; 5.018 | <0.001 | 0.023 | |
| Sedentary normal weight–sedentary overweight | 2.656 | 0.882; 4.430 | 0.001 | 0.027 | |
| Sedentary overweight–sedentary underweight | −3.888 | −5.976; −1.800 | <0.001 | 0.027 | |
| Active overweight–active underweight | −2.575 | −4.901; −0.250 | 0.024 | 0.010 | |
| Handgrip right arm (kg) | Active normal weight–sedentary normal weight | 2.609 | 1.180; 4.038 | <0.001 | 0.017 |
| Active overweight–sedentary overweight | 3.587 | 0.657; 6.517 | 0.016 | 0.008 | |
| Active underweight–sedentary underweight | 2.515 | 0.122; 4.907 | 0.039 | 0.006 | |
| Sedentary normal weight–sedentary overweight | −3.315 | −5.939; −0.690 | 0.008 | 0.050 | |
| Sedentary normal weight–sedentary underweight | 4.443 | 2.112; 6.774 | <0.001 | 0.050 | |
| Sedentary overweight–sedentary underweight | 7.757 | 4.669; 10.846 | <0.001 | 0.050 | |
| Active normal weight–active overweight | −4.293 | −7.291; −1.295 | 0.002 | 0.051 | |
| Active normal weight–active underweight | 4.537 | 2.053; 7.021 | <0.001 | 0.051 | |
| Active overweight–active underweight | 8.830 | 5.389; 12.270 | <0.001 | 0.051 | |
| Handgrip left arm (kg) | Active normal weight–sedentary normal weight | 2.149 | 0.842; 3.456 | 0.001 | 0.014 |
| Active overweight–sedentary overweight | 2.802 | 0.121; 5.483 | 0.041 | 0.006 | |
| Active underweight–sedentary underweight | 2.909 | 0.720; 5.099 | 0.009 | 0.009 | |
| Sedentary normal weight–sedentary overweight | −2.988 | −5.390; −0.587 | 0.009 | 0.052 | |
| Sedentary normal weight–sedentary underweight | 4.245 | 2.112; 6.378 | <0.001 | 0.052 | |
| Sedentary overweight–sedentary underweight | 7.233 | 4.407; 10.060 | <0.001 | 0.052 | |
| Active normal weight–active overweight | −3.641 | −6.384; −0.898 | 0.005 | 0.040 | |
| Active normal weight–active underweight | 3.485 | 1.212; 5.757 | 0.001 | 0.040 | |
| Active overweight–active underweight | 7.126 | 3.977; 10.274 | <0.001 | 0.040 | |
| Sit-and-reach (cm) | Active normal weight–active underweight | 3.584 | 0.821; 6.348 | 0.006 | 0.014 |
| CMJ (cm) | Active normal weight–sedentary normal weight | 2.892 | 1.663; 4.120 | <0.001 | 0.028 |
| Active overweight–sedentary overweight | 3.548 | 1.028; 6.067 | 0.006 | 0.010 | |
| Active underweight–sedentary underweight | 3.068 | 1.011; 5.126 | 0.004 | 0.012 | |
| Sedentary normal weight–sedentary overweight | 3.726 | 1.469; 5.982 | <0.001 | 0.021 | |
| Sedentary overweight–sedentary underweight | −2.853 | −5.509; −0.197 | 0.030 | 0.021 | |
| Active normal weight–active overweight | 3.070 | 0.492; 5.648 | 0.013 | 0.011 | |
| 20 m sprint (s) | Active normal weight–sedentary normal weight | −0.227 | −0.323; −0.132 | <0.001 | 0.029 |
| Active overweight–sedentary overweight | −0.287 | −0.482; −0.091 | 0.004 | 0.011 | |
| Active underweight–sedentary underweight | −0.191 | −0.350; −0.031 | 0.019 | 0.007 | |
| Sedentary normal weight–sedentary overweight | −0.182 | −0.357; −0.007 | 0.038 | 0.008 |
Publisher’s Note: MDPI stays neutral with regard to jurisdictional claims in published maps and institutional affiliations. |
© 2022 by the authors. Licensee MDPI, Basel, Switzerland. This article is an open access article distributed under the terms and conditions of the Creative Commons Attribution (CC BY) license (https://creativecommons.org/licenses/by/4.0/).
Share and Cite
Mateo-Orcajada, A.; Vaquero-Cristóbal, R.; Esparza-Ros, F.; Abenza-Cano, L. Physical, Psychological, and Body Composition Differences between Active and Sedentary Adolescents According to the “Fat but Fit” Paradigm. Int. J. Environ. Res. Public Health 2022, 19, 10797. https://doi.org/10.3390/ijerph191710797
Mateo-Orcajada A, Vaquero-Cristóbal R, Esparza-Ros F, Abenza-Cano L. Physical, Psychological, and Body Composition Differences between Active and Sedentary Adolescents According to the “Fat but Fit” Paradigm. International Journal of Environmental Research and Public Health. 2022; 19(17):10797. https://doi.org/10.3390/ijerph191710797
Chicago/Turabian StyleMateo-Orcajada, Adrián, Raquel Vaquero-Cristóbal, Francisco Esparza-Ros, and Lucía Abenza-Cano. 2022. "Physical, Psychological, and Body Composition Differences between Active and Sedentary Adolescents According to the “Fat but Fit” Paradigm" International Journal of Environmental Research and Public Health 19, no. 17: 10797. https://doi.org/10.3390/ijerph191710797
APA StyleMateo-Orcajada, A., Vaquero-Cristóbal, R., Esparza-Ros, F., & Abenza-Cano, L. (2022). Physical, Psychological, and Body Composition Differences between Active and Sedentary Adolescents According to the “Fat but Fit” Paradigm. International Journal of Environmental Research and Public Health, 19(17), 10797. https://doi.org/10.3390/ijerph191710797