Using the DEMATEL-VIKOR Method in Dam Failure Path Identification


Abstract
1. Introduction
1.1. Dam Risk Management
1.2. Dam Failure Path Identification
2. The Statistics of Dam Failure
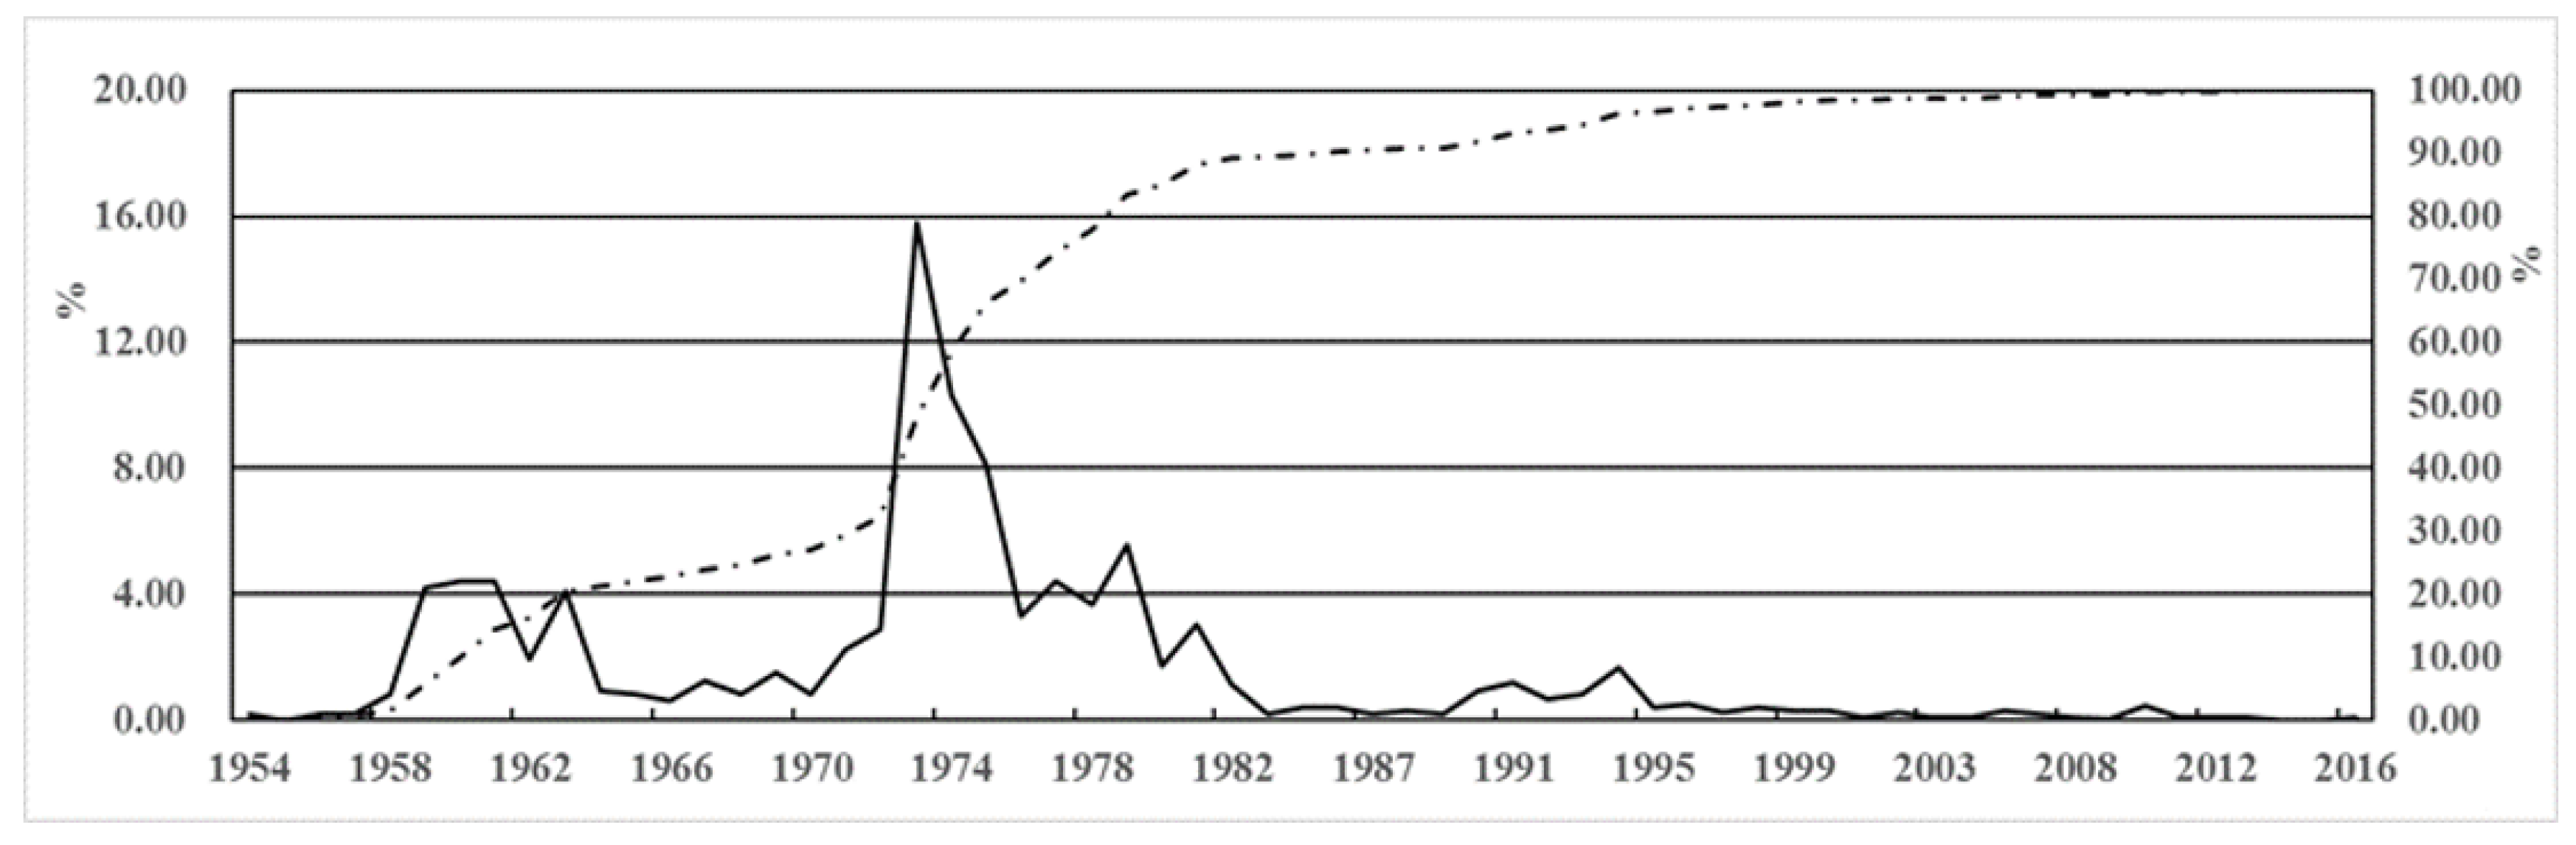
2.1. Statistics of Dam Break According to the Dam Failure Age
- (1)
- Two prominent peaks have occurred: a small one between 1959 and 1961, with a total of 507 failures, compared with a large around 1973, with 554 failed dams. After 1998, the cumulative curve of the number of failures tended to flat.
- (2)
- Classified by time, 2914 dams failed between 1954 and 1979, giving an average annual rate of 112. By contrast, 543 dams failed from 1980 to 1999, resulting in an annual rate of 27, as opposed to 4 annually over the period of 2000 to 2016 (67 dam failures)
- (3)
- From the perspective of engineering scale, the number of dam failure of small (2) type reservoirs is relatively high from 1954 to 2016, up to 2710, accounting for about 77% of the total dam break; especially in the 1970s, the dam failures of small (2) type reservoirs are more than half of all. In contrast, 127 dam failures were due medium-sized reservoirs, compared with 2 for large reservoir, accounting both for 36.7% of the total.
2.2. The Statistics of Dam Break According to Engineering Status
- a)
- Low management level in the early stage leading to high dam break rate under normal operation;
- b)
- Low construction level leading to high dam break rate during construction period.
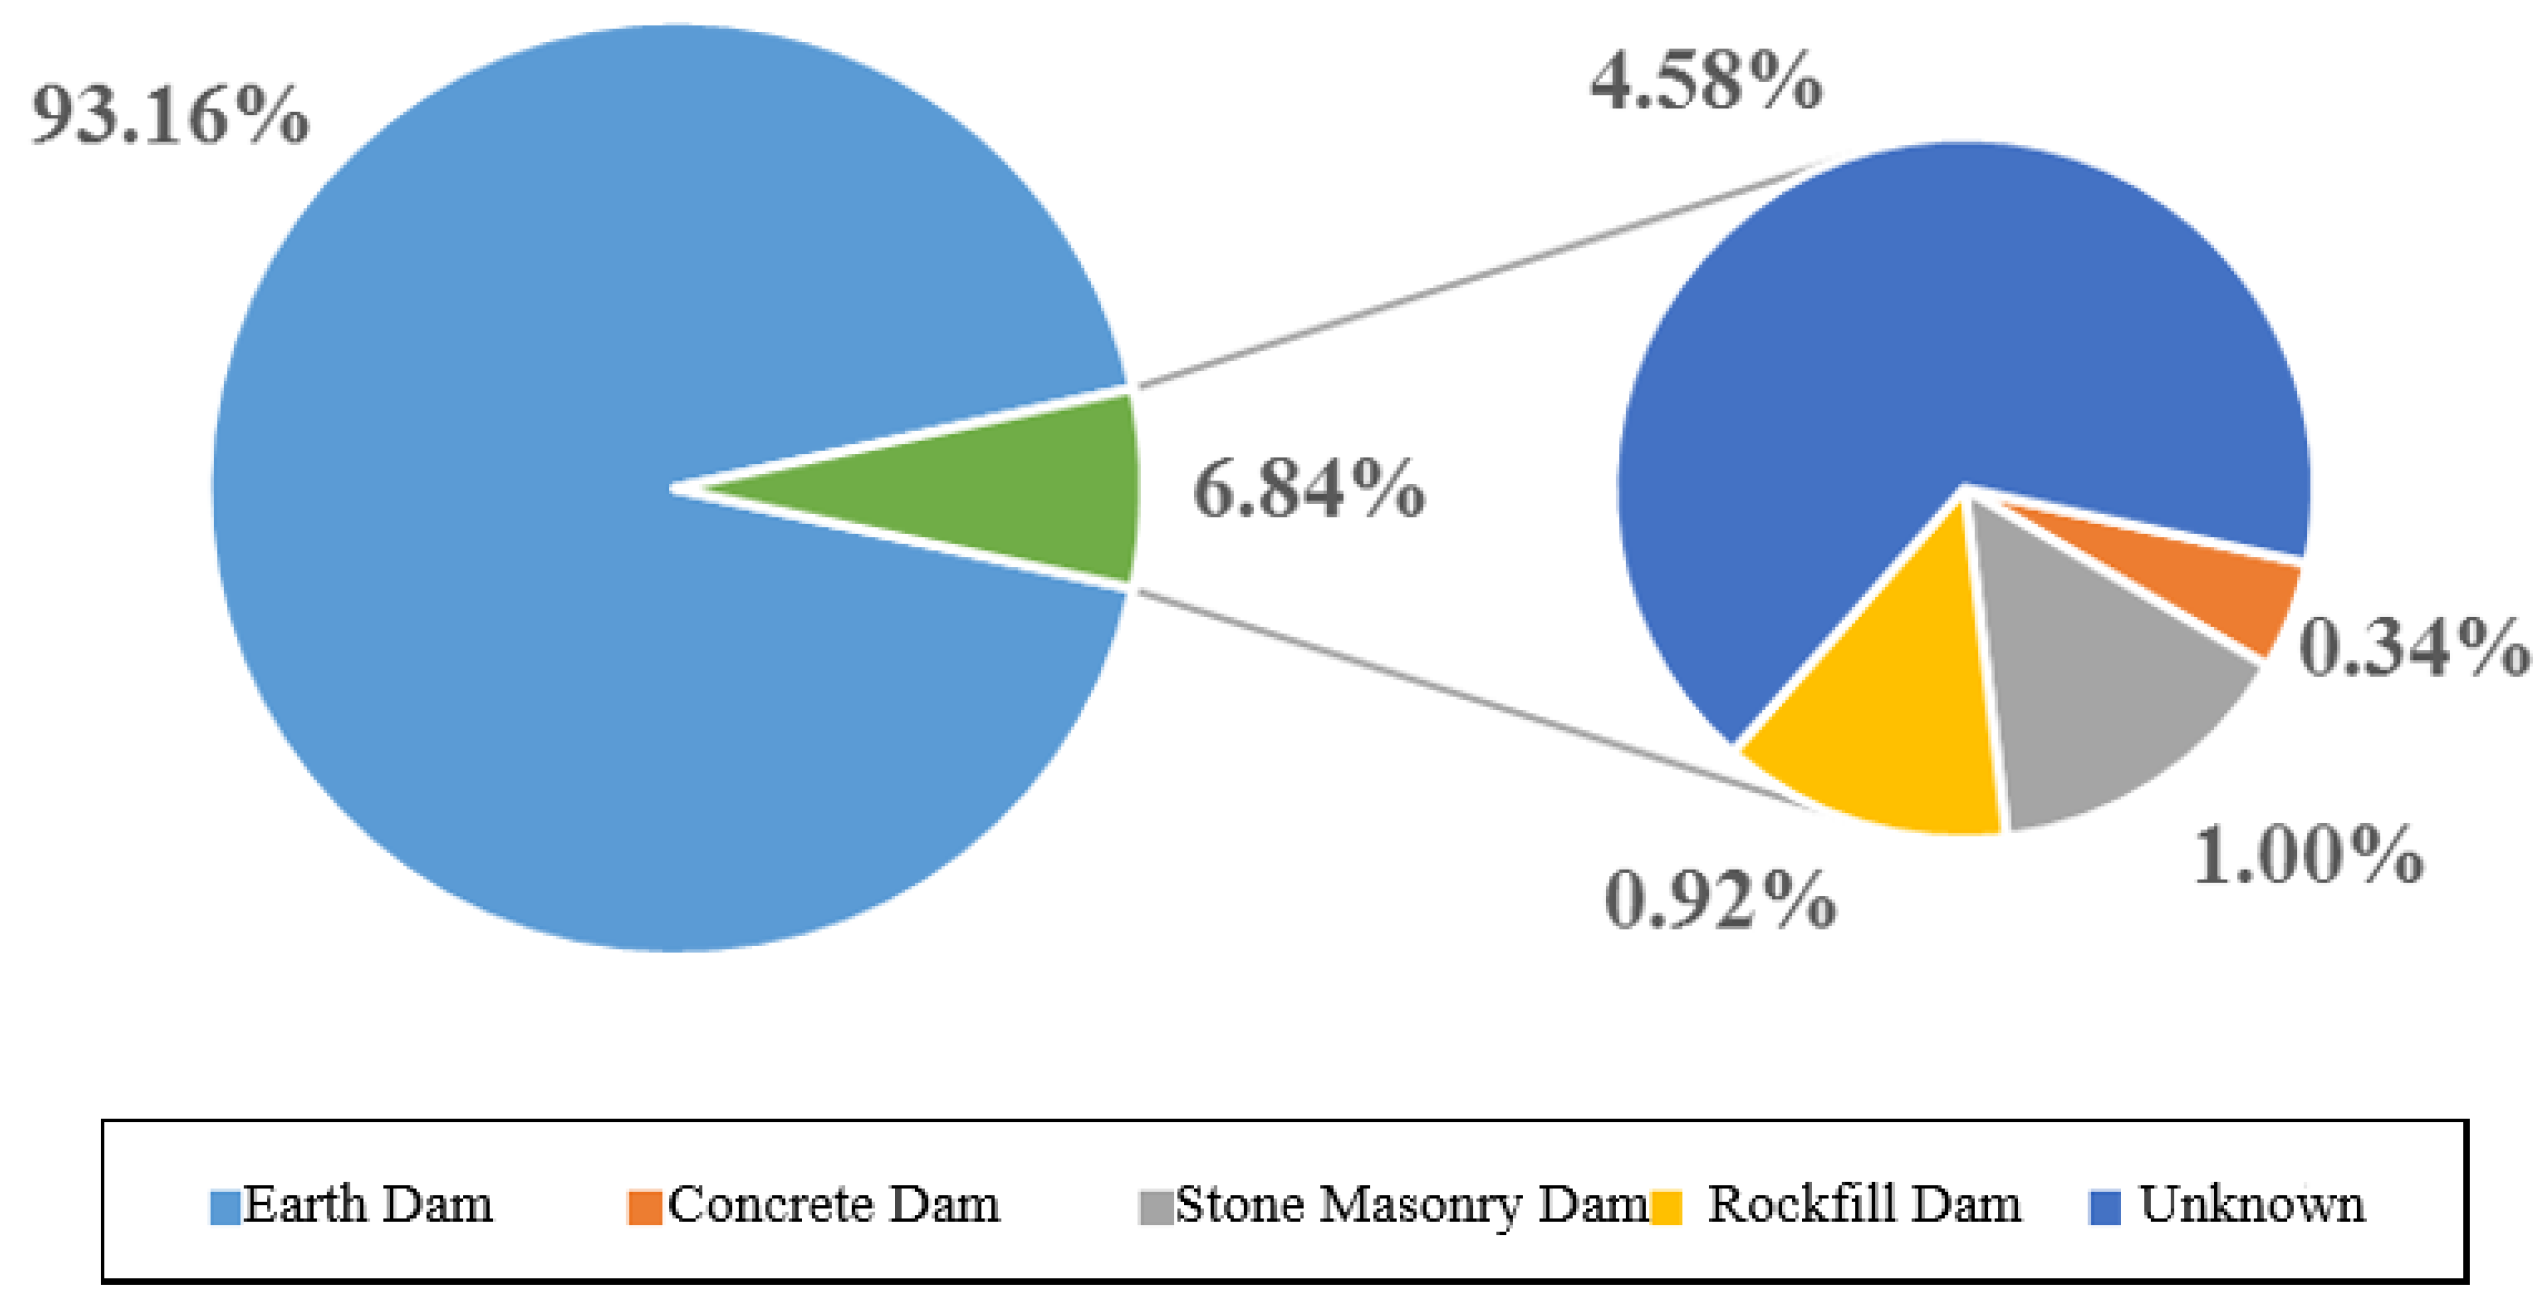
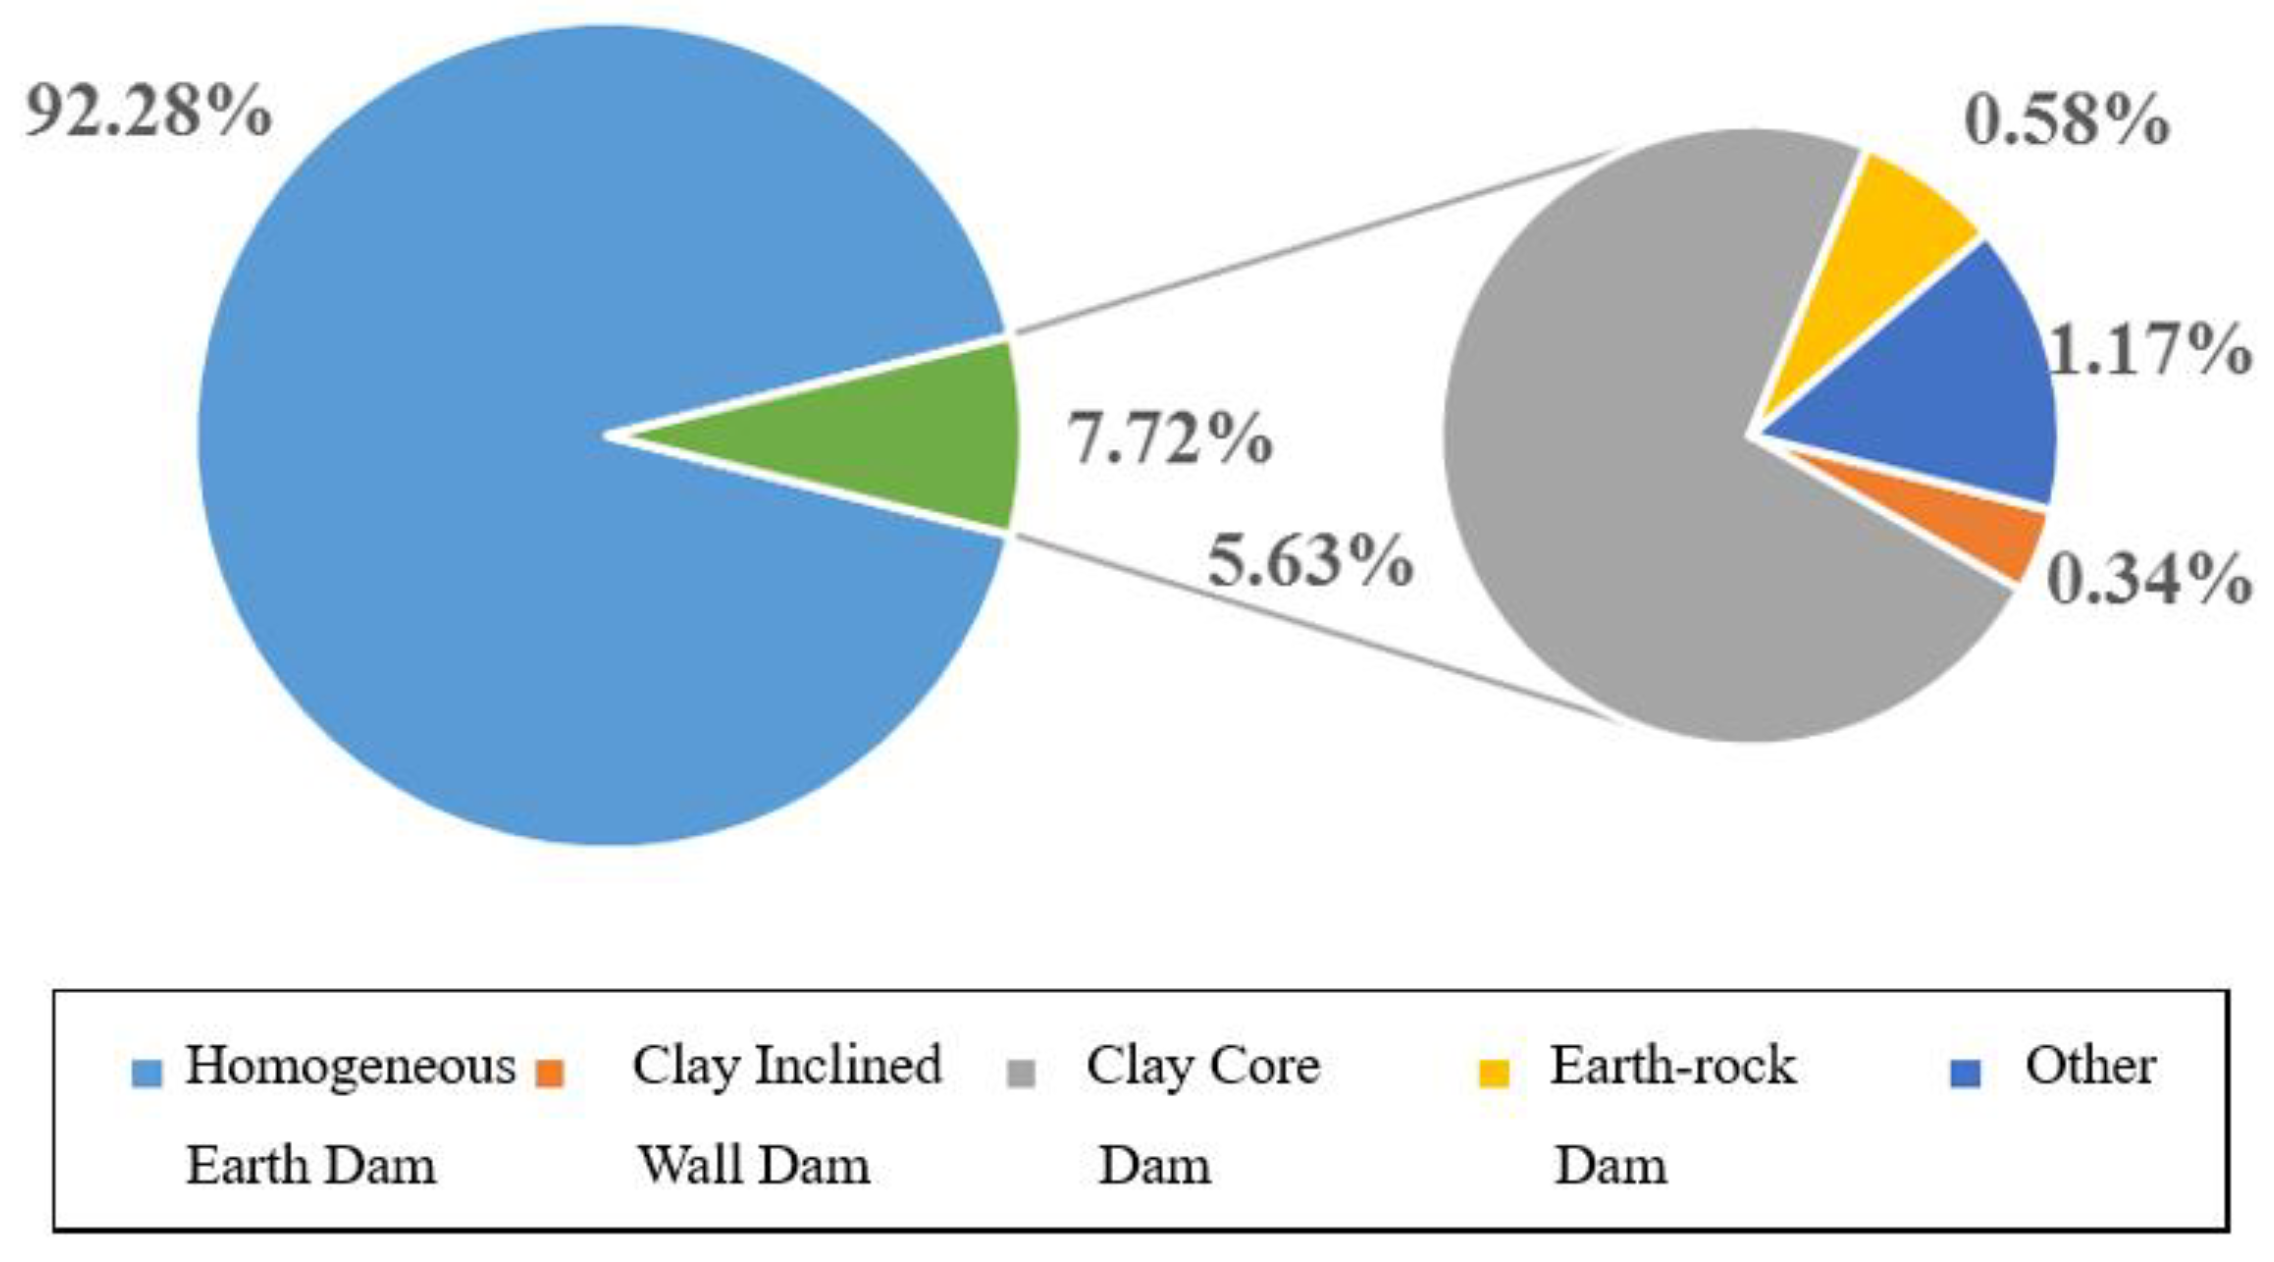
2.3. Statistics of Dam Break According to the Dam Type Distribution
2.4. Statistics of Dam Breaks According to the Dam Break Cause
3. Dam Failure Modes and Paths
3.1. The Failure Path of Earth-Rock Dam
3.2. The Failure Path of Gravity Dam
3.3. The Failure Path of Arch Dam
4. The Method of Dam Failure Path Identification
4.1. Modification of Assessment Matrix of Dam Failure Path
4.1.1. Establish the Total Correlation Matrix of Dam Failure Path
4.1.2. Modified Failure Path Assessment Matrix for Dam Failure
4.2. The Draft Of Comprehensive Index of Dam Failure Path Identification
4.2.1. The Calculation of Group Benefits and Individual Regrets
4.2.2. The Draft Comprehensive Index of Dam Failure Path Identification
4.3. Discussion on Application of the Method
5. Case Study
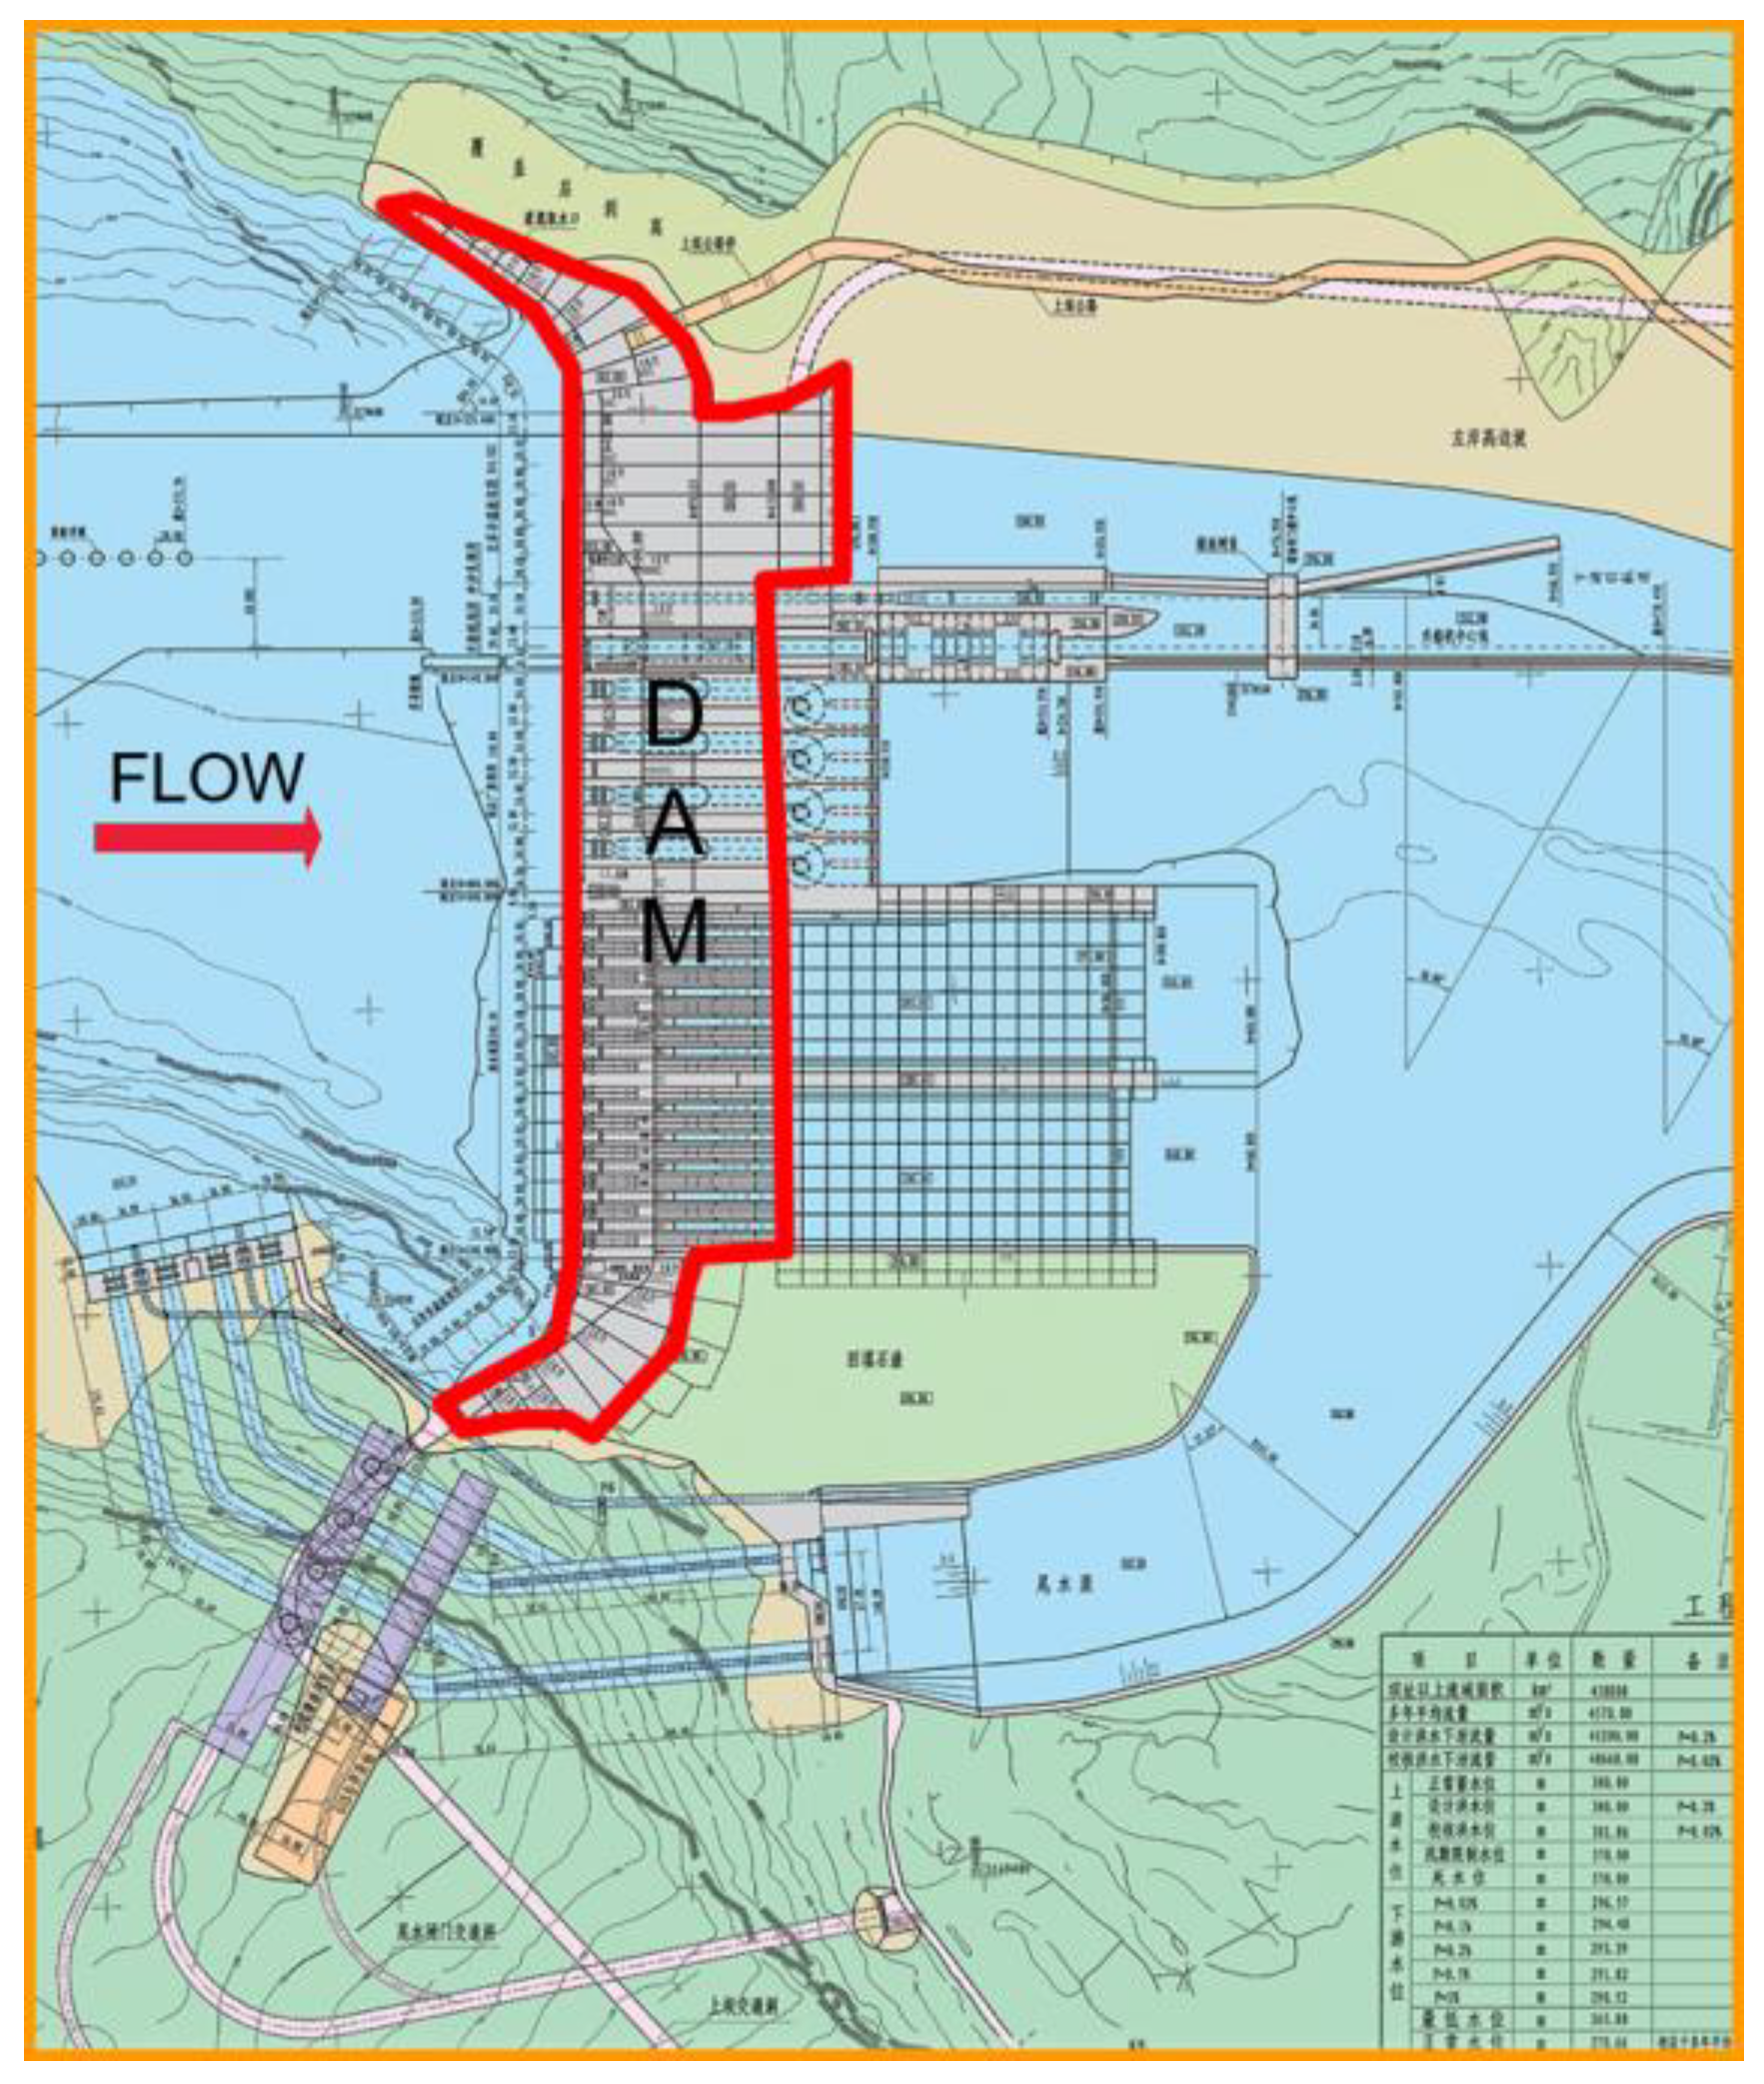
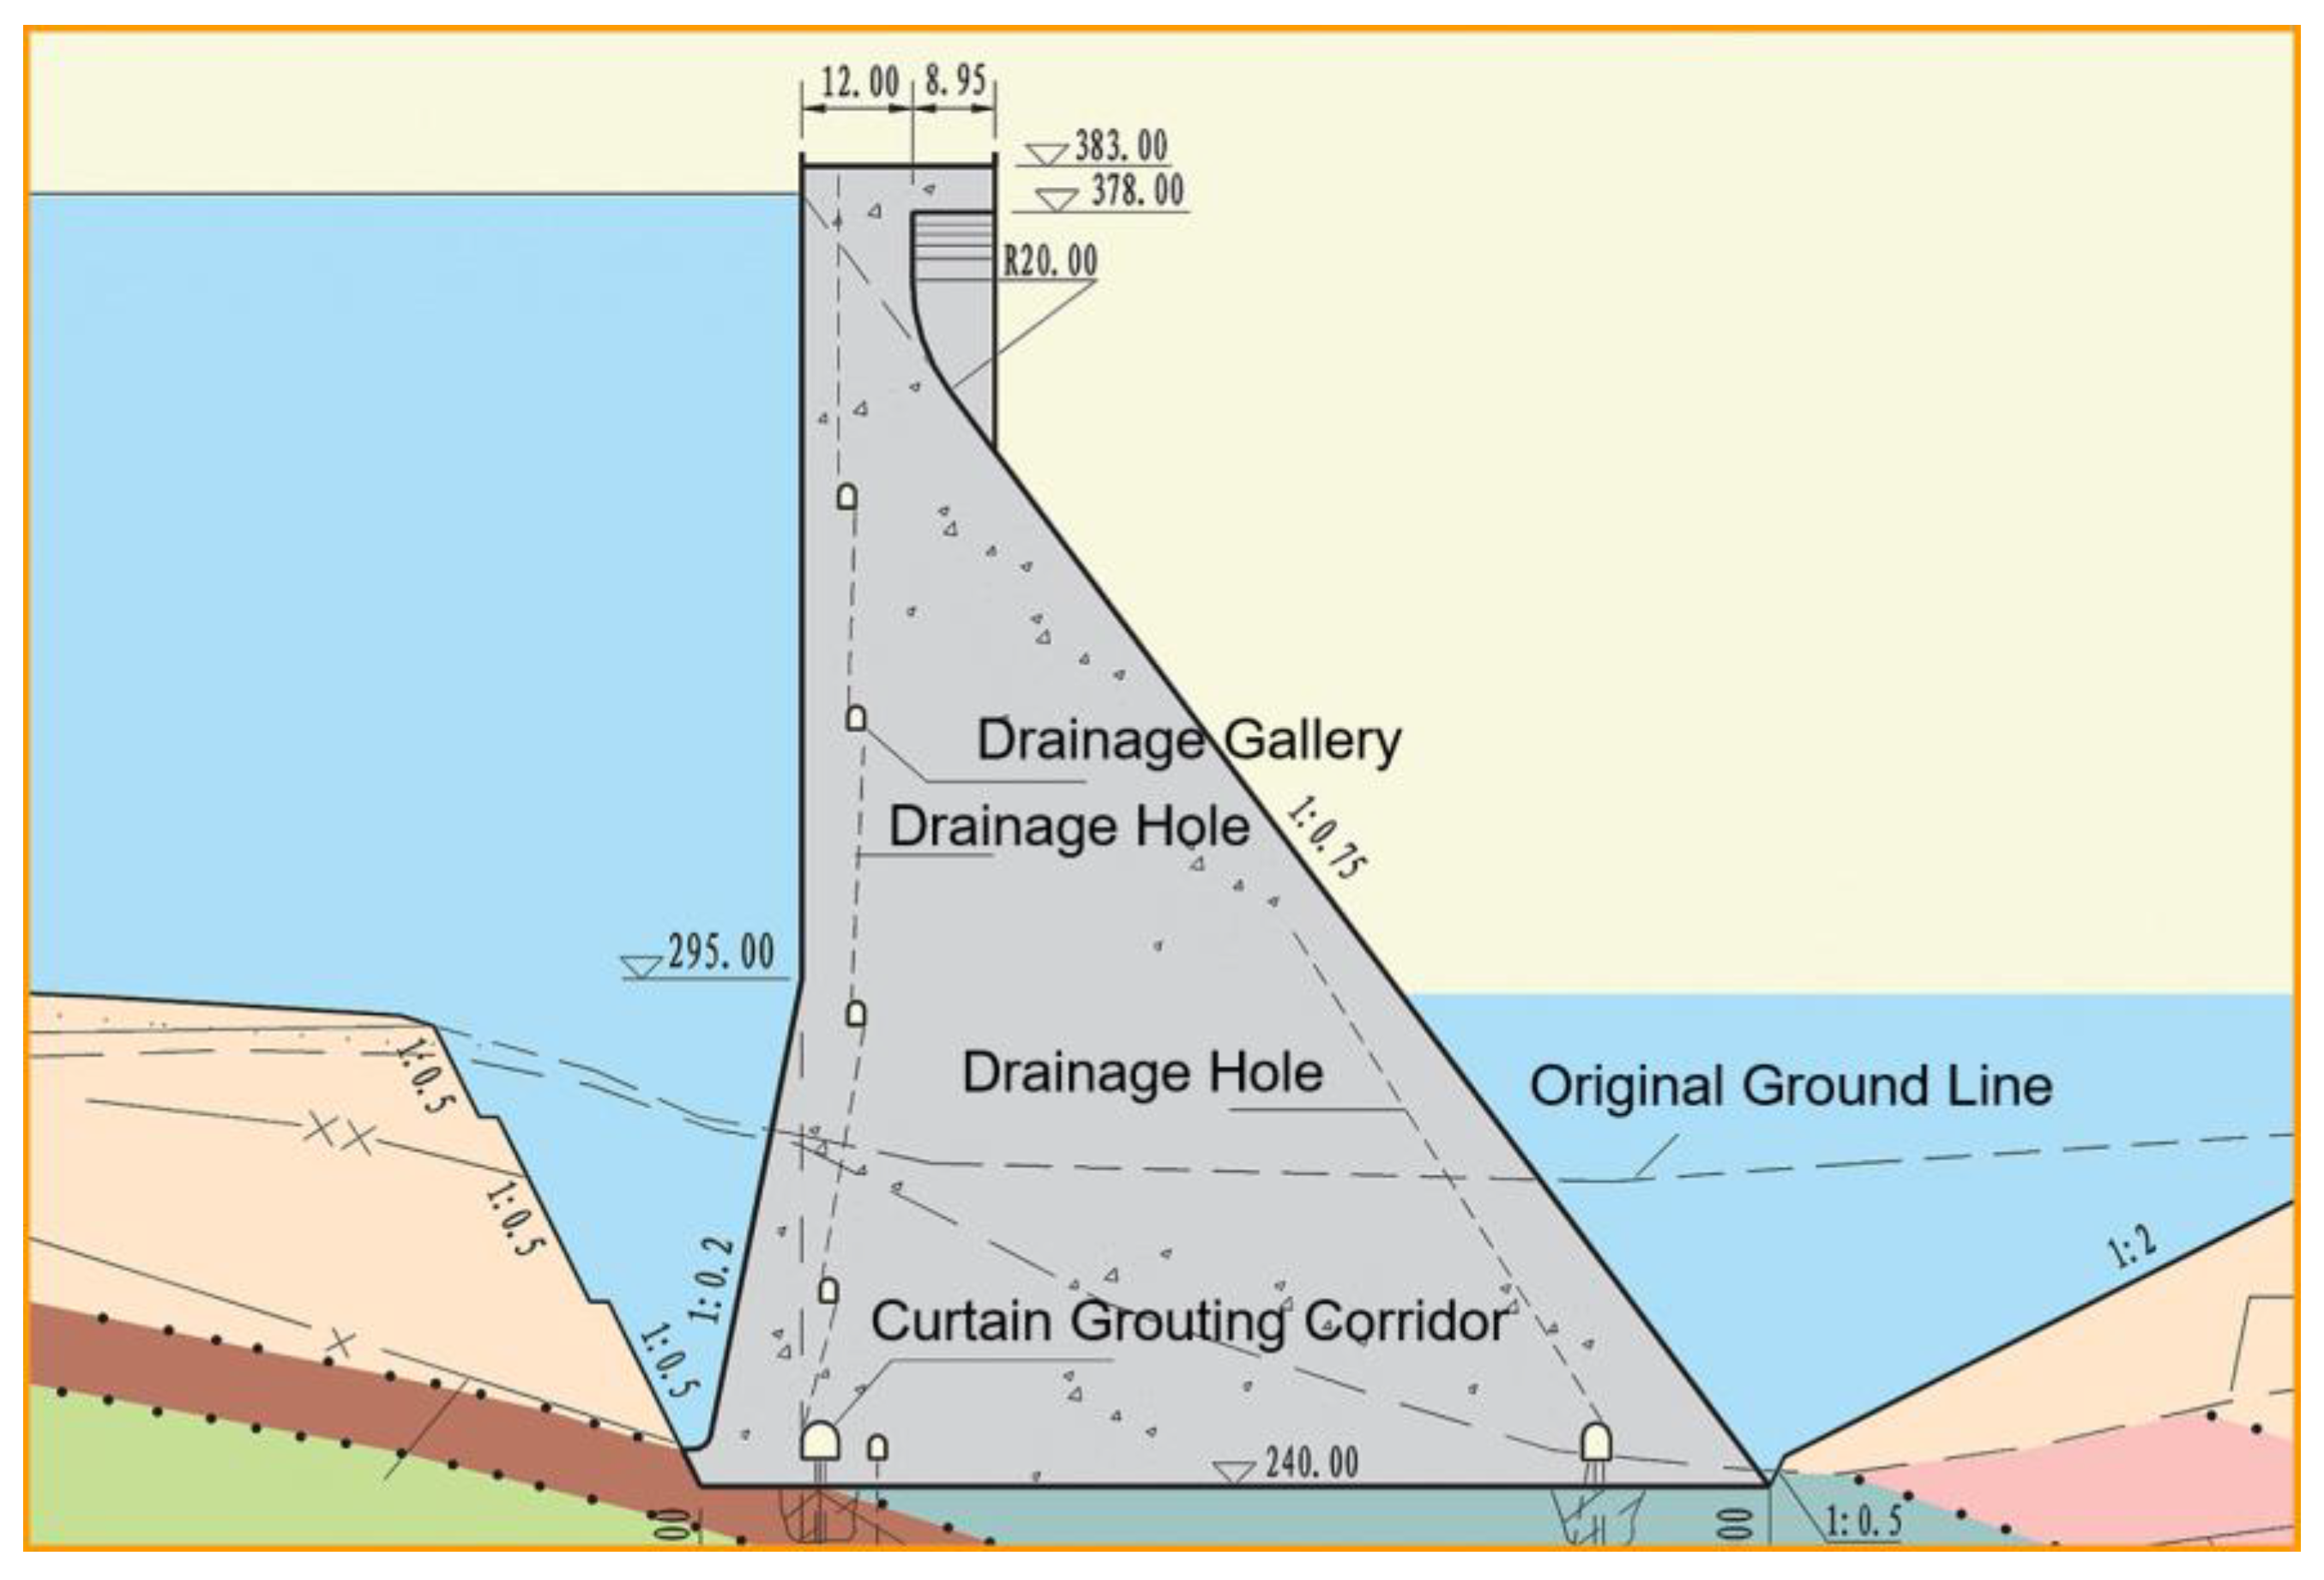
5.1. Project Profile
5.2. The Failure Path of the Dam
5.3. The Assessment of Failure Path
5.4. The Influence Relationship between Failure Paths
5.5. The Assessment of Failure Path
6. Summary and Conclusions
- (1)
- Using data of age of dam failure, engineering status, dam type and failure time, etc. the temporal and spatial variation characteristics of dam failure in China are analyzed. The main causes of dam failure are discussed, and the main failure paths of gravity dam, arch dam and earth-rock dam are summarized.
- (2)
- The method of the decision-making trial and evaluation laboratory method is used, and the relationship among the dam failure paths were analyzed. The influence of the coupling relationship of the dam failure paths on the evaluation results of the severity of the failure consequences were determined.
- (3)
- The optimal compromise method of multi-criteria was obtained by considering the effect of group effect and individual regret and the relative preference relationship of expert evaluation. Then a comprehensive index model based on occurrence rate, severity and detection of dam failure path identification was established.
- (4)
- A method for dam failure path identification was obtained for a gravity dam located at the junction of Yibin County, Sichuan Province and Shuifu County, in Yunnan Province. From results, the two major risks determined, regardless of user preferences, included an insufficient design of upstream anti-seepage (R6) or defective water-tight screen, and corrosion (R7). It is proved that this method can be effective in dam.
- (5)
- To develop a full picture of dam risk assessment, additional studies of other type of dams will be needed to improve understanding of the failure paths association.
Author Contributions
Funding
Conflicts of Interest
Data Availability
References
- Laginhaserafim, J.; Zhu, Z. A review of the dam disaster. Large Dam Saf. 1991, 4, 74–76. [Google Scholar]
- Guo, J. Introduction of status of dam safety management in USA. J. China Ins. Water Resour. Hydropower Res. 2007, 5, 247–254. [Google Scholar]
- Hariri-Ardebili, M.A. Risk, Reliability, Resilience (R3) and beyond in dam engineering: A state-of-the-art review. Int. J. Disaster Risk Reduct. 2018, 31, 806–831. [Google Scholar] [CrossRef]
- Stewart, R.A. Dam Risk Management; International Society for Rock Mechanics: Melbourne, Australia, 2000. [Google Scholar]
- Hartford, D.N.; Baecher, G.B. Risk and Uncertainty in Dam Safety; Thomas Telford Publishing: London, UK, 2004. [Google Scholar]
- Ge, W.; Jiao, Y.; Sun, H.; Li, Z.; Zhang, H.; Zheng, Y.; Guo, X.; Zhang, Z.; van Gelder, P.A. A method for fast evaluation of potential consequences of dam breach. Water 2019, 11, 2224. [Google Scholar] [CrossRef]
- Wu, M.; Ge, W.; Li, Z.; Wu, Z.; Zhang, H.; Li, J.; Pan, Y. Improved set pair analysis and its application to environmental impact evaluation of dam break. Water 2019, 11, 821. [Google Scholar] [CrossRef]
- Wu, Z. Overview on Safety and Management of Dams in China. Eng. Sci. 2000, 2, 36–39. [Google Scholar]
- Hagen, V. Re-evaluation of Design Floods and Dam Safety. In Proceedings of the 14th International Congress on Large Dams, Rio de Janeiro, Brazil, 3–7 May 1982. [Google Scholar]
- USBR. Dams and Public Safety; Water Resources Technical Publication: Washington, DC, USA, 1983.
- Guo, J. Summary of dam construction and safety management in the United States. Water Power 2013, 11, 107–108. [Google Scholar]
- Reclamation USDotIBO. Safety Evaluation of Existing Dams; Water Resources Technical Publication: Washington, DC, USA, 1995. [Google Scholar]
- Tan, J. Lessons learned from dam safety accidents in the United States and post-disaster recovery. Express Water Resour. Hydropower Inf. 2017, 1, 20–21. [Google Scholar] [CrossRef]
- David, A.M.; Qian, Z.Z. Assessment and management of levee hydrologic risk in the U.S. army corps of engineers. Express Water Resour. Hydropower Inf. 2016, 4, 17–21. [Google Scholar] [CrossRef]
- Dobson, I.; Carreras, B.A.; Newman, D.E. A Loading-Dependent Model of Probabilistic Cascading Failure. Probab. Eng. Inf. Sci. 2004, 19, 15–32. [Google Scholar] [CrossRef]
- Yuan, P.; Zhou, J. Dam risk management in hydro-quebec, Canada. Express Water Resour. Hydropower Inf. 2004, 6, 31–33. [Google Scholar] [CrossRef]
- O’Neil, E.; Latour, V.; Cui, H. Prioritization of dam safety remedial works using risk Informed decision making. Dam Saf. 2015, 4, 79–84. [Google Scholar]
- Qi, J. Application of Krystol technology in dam construction and seepage prevention repair and reinforcement. Constr. Tech. 2010, 5, 16–17. [Google Scholar]
- Oswell, T.; Cui, H. Dam safety review process in Canada: Considerations for improvement. Dam Saf. 2015, 6, 69–74. [Google Scholar]
- McGrath, S.; Stewart, D.; Cui, H. Integrated dam safety management systems. Dam Saf. 2015, 3, 72–76. [Google Scholar]
- Jia, J.; Xu, Y.; Zheng, C. Introduction of Overseas Hydropower Development and Suggestions for Hydropower Development in China—Dam Safety Management in Australia. China Waterpower Electrif. 2010, 10, 25–28. [Google Scholar]
- Markevich, N.J.; Cecilio, C.B. Through-Flow Analysis for Rockfill Dam Stability Evaluations. Am. Soc. Civ. Eng. 1991. [Google Scholar] [CrossRef]
- Fiordelisi, F.; Marqués-Ibañez, D. Is bank default risk systematic. J. Bank. Financ. 2013, 37, 2000–2010. [Google Scholar] [CrossRef]
- Zhou, R. Review of dam performance during flood season in Queensland, Australia. Express Water Resour. Hydropower Inf. 2013, 7, 19–20. [Google Scholar] [CrossRef]
- Australian National Connnittee on Large Dams. Guidelines on Assessment of the Consequences of Dam Failure; Australian National Connnittee on Large Dams: Hobart, Australia, 2000. [Google Scholar]
- Australian National Connnittee on Large Dams. Guidelines on Risk Assessment; Australian National Connnittee on Large Dams: Hobart, Australia, 2001. [Google Scholar]
- Australian National Connnittee on Large Dams. Guidelines on Risk Assessment; Australian National Connnittee on Large Dams: Hobart, Australia, 2003. [Google Scholar]
- Australian National Connnittee on Large Dams. Draft guidelines for design of dams for earthquake; Australian National Connnittee on Large Dams: Hobart, Australia, 1996. [Google Scholar]
- Li, M.; Fang, L. Dam safety inspection and failure mode assessment. Large Dam Saf. 2005, 4, 11–17. [Google Scholar]
- Peyras, L.; Royet, P.; Boissier, D. Dam ageing diagnosis and risk analysis: Development of methods to support expert judgment. Can. Geotech. J. 2006, 43, 169–186. [Google Scholar] [CrossRef]
- Xu, Q. Research on Risk Analysis Method for Dam. Master’s Thesis, Dalian University of Technology, Dalian, China, 2008. [Google Scholar]
- Li, X.; Li, C.; Li, D.; Wang, H. Evaluation of dam safety based on AHP combining with Fuzzy Math. Yangtze River 2010, 41, 92–95. [Google Scholar]
- Zhang, S.R.; Sun, B.; Yan, L.; Wang, C. Risk identification on hydropower project using the IAHP and extension of TOPSIS methods under interval-valued fuzzy environment. Nat. Hazards 2013, 65, 359–373. [Google Scholar] [CrossRef]
- Li, H. Study on calculating methods of dam risk analysis. Ph.D. Thesis, Dalian University of Technology, Dalian, China, 2012. [Google Scholar]
- Zhang, L.; Offre, P.R.; He, J.; Verhamme, D.T.; Nicol, G.W.; Prosser, J.I. Autotrophic ammonia oxidation by soil thaumarchaea. Proc. Natl. Acad. Sci. USA 2010, 107, 17240–17245. [Google Scholar] [CrossRef]
- Yan, L. Study on operation safety risk analysis method of dam. Ph.D. Thesis, Tianjin University, Tianjin, China, 2011. [Google Scholar]
- Zhou, Q.; Zhou, J.; Yang, X.; Zhang, Y. A Comprehensive Assessment Model for Severity Degree of Dam Failure Impact Based on Attribute Interval Recognition Theory. Available online: http://en.cnki.com.cn/Article_en/CJFDTOTAL-SCLH201102009.htm (accessed on 13 February 2020).
- Liao, J. Risk assessment of earth-rock dam based on event tree and bayesian network method. Ph.D. Thesis, China Institute of Water Resources and Hydropower Research, Beijing, China, 2013. [Google Scholar]
- Goodarzi, E.; Shui, L.T.; Ziaei, M. Risk and uncertainty analysis for dam overtopping-Case study: The Doroudzan Dam, Iran. J. Hydro-Environ. Res. 2014, 8, 50–61. [Google Scholar] [CrossRef]
- Zhang, Z.; Xiao, S.; Peng, G. Risk Analysis of Earth-Rock Dam Failure Base on an Improved FMEA Using Grey Confidence Structure and Its Application. Water Power 2014, 6, 61–64. [Google Scholar]
- Huang, H. Study on Risk and safety Evaluation Method of Earth-Rock Dam. Master’s Thesis, Nanchang University, Nanchang, China, 2015. [Google Scholar]
- Ge, W. Comprehensive Evaluation on Construction and Operation Risk of Earth-rock Dam. Ph.D. Thesis, Zhengzhou University, Zhengzhou, China, 2016. [Google Scholar]
- Zheng, X.Q.; Gu, C.S.; Qin, D. Dam’s risk identification under interval-valued intuitionistic fuzzy environment. Civ. Eng. Environ. Syst. 2016, 32, 351–363. [Google Scholar] [CrossRef]
- Zhang, X. Collection of Typical Cases of Dam Failures and Accidents at Hydropower Stations. Available online: https://www.semanticscholar.org/paper/Collection-of-typical-cases-of-dam-failures-and-at-Xiu-l/fc967005b2d58bf84b2a1c2ea4a9a6f04a49fc08 (accessed on 13 February 2020).
- Huang, M. Research on Risk Analysis Methods for Dam Group System. Master’s Thesis, Hohai University, Nanjing, China, 2017. [Google Scholar]
- Zheng, X. Research on Risk Rate Analysis Model of Dam Operation. Ph.D. Thesis, Hohai University, Nanjing, China, 2016. [Google Scholar]
- Zhang, Z. Research of Identification and Action Characteristic for Dam Risk Factor. Ph.D. Thesis, Hohai University, Nanjing, China, 2011. [Google Scholar]
- Wu, W.W.; Lee, Y.T. Developing Global Managers’ Competencies Using the Fuzzy DEMATEL Method. Expert Syst. Appl. 2007, 32. [Google Scholar] [CrossRef]
- Xu, B.; Pang, R.; Zhou, Y. Verification of stochastic seismic analysis method and seismic performance evaluation based on multi-indices for high CFRDs. Eng. Geol. 2020, 105412. [Google Scholar] [CrossRef]
- Zhang, Y.; Xu, Y.; Zheng, Y.; Fernandez-Rodriguez, E.; Sun, A.; Yang, C.; Wang, J. Multiobjective Optimization Design and Experimental Investigation on the Axial Flow Pump with Orthogonal Test Approach. Complexity 2019, 1467565. [Google Scholar] [CrossRef]
- Lin, C.J.; Wu, W.W. A causal analytical method for group decision-making under fuzzy environment. Expert Syst. Appl. 2008, 34, 205–213. [Google Scholar] [CrossRef]
- Liu, H.C.; Liu, L.; Liu, N.; Mao, L.X. Risk evaluation in failure mode and effects analysis with extended VIKOR method under fuzzy environment. Expert Syst. Appl. 2012, 39, 12926–12934. [Google Scholar] [CrossRef]


| Failure Mode | The Failure Path of Earth-Rock Dam |
|---|---|
| Overtopping | Flood→no spillway or small spillway cross section→inadequate flood carrying capacity→overtopping→invalid intervention→dam failure |
| Continual rainstorm→over Flood protection standards→overtopping→invalid intervention→dam failure | |
| Earthquake→longitudinal cracks in the dam→dam sliding→lowering crest elevation→overtopping→invalid intervention→dam failure | |
| Seepage failure | Flood→dam body or dam base concentrated seepage→piping→invalid intervention→dam failure |
| Flood→buried pipe is damaged by contact erosion→invalid intervention→dam failure | |
| Dam body and mountain joint surface or mountain crack rock is not strictly treated→seepage around the dam→piping→invalid intervention→dam failure | |
| Poor dam filling quality, having cracks→reservoir water level rising during the flood season→leakage of dam body→piping→invalid intervention→dam failure | |
| Earthquake→transverse cracks in the dam→Leaking channels→piping→invalid intervention→dam failure | |
| Instability of dam slope | Continual rainfall→the upper part of the dam is saturation→longitudinal crack→instability of partial dam→lowering crest elevation→invalid intervention→dam failure |
| Earthquake→the liquefaction of sandy gravel stratum→landslide of dam body→invalid intervention→dam failure | |
| Poor dam filling quality→water storage→landslide of dam body→invalid intervention→dam failure | |
| Others | Misgovernment→surcharge→flood→overtopping→invalid intervention→dam failure |
| Failure Mode | Failure Path of Gravity Dam |
|---|---|
| Dam body break | Flood→bank understrength→the saturation of dam slope→invalid intervention→dam failure |
| Earthquake→the weak joints of the dam cracking→crack propagation→invalid intervention→dam failure | |
| Earthquake→parting dislocation + watertight seal break →leakage of dam body→invalid intervention→dam failure | |
| Corrosion→causticity cracking of concrete construction→crack propagating→invalid intervention→dam failure | |
| Reservoir water level falling too fast→bank pore water pressure increasing→effective stress lowering→the saturation of dam slope→invalid intervention→dam failure | |
| Dam foundation break | High water level→faults expanding or weak intercalation failure in deep dam foundation→instability of dam→invalid intervention→dam failure |
| The design of upstream anti-seepage is insufficient or the water-tight screen is defective→uplift pressure at dam foundation rising→the vertical useful load decreasing→sliding along the foundation surface of the dam→invalid intervention→dam failure | |
| The design of upstream anti-seepage is insufficient or the water-tight screen is defective→uplift at dam foundation rising→sliding along the foundation surface of the dam→shear strength of bed rock decreasing→invalid intervention→dam failure | |
| Earthquake→faults expanding or weak intercalation failure→Upstream and downstream landslide→the saturation of dam abutment→invalid intervention→dam failure | |
| Others | Mismanagement→surcharge→the design of bank slope anti-seepage is improper or the construction quality is poor→the saturation of dam slope→invalid intervention→dam failure |
| Failure Mode | Failure Path of Arch Dam |
|---|---|
| Dam body break | Low water level + sustained low temperature→the temperature stress of the dam overruns during the operation period→upper and lower surface horizontal joint cracking→invalid intervention→dam failure |
| Sealing temperature of arch dam too high or low→the temperature stress of the dam overruns during the operation period→dam cracking→invalid intervention→dam failure | |
| Flood→water-level rising→the design of bank slope anti-seepage is improper or the construction quality is poor→insufficient strength→washing out dam toe→invalid intervention→dam failure | |
| The quality of layered casting surface is poor→joint face cracking and seepage→Damage to dam integrity→invalid intervention→dam failure | |
| Improper material of dam section→the rigidity of dam body is different from that of foundation rock→dam body cracking under stress→invalid intervention→dam failure | |
| Dam abutment weak intercalation misconducted→Water stress→Weak surface cracking→invalid intervention→dam failure | |
| Dam foundation break | High water level→water-tight screen losing efficacy or drain hole is blocked→uplift at dam foundation rising→shear strength of bed rock decreasing→invalid intervention→dam failure |
| The dam is repeatedly stressed→rock fatigue failure→dam foundation cracking→invalid intervention→dam failure | |
| High slope near dam break | Flood→water-level rising→bank slope rock caving under pressure→invalid intervention→dam failure |
| High water level + water-tight screen losing efficacy or drain hole is blocked→uplift at dam foundation rising→shear strength of bank slope decreasing→invalid intervention→dam failure | |
| Earthquake→arch abutment rock weak surface break→arch abutment bank slope break→invalid intervention→dam failure | |
| Others | Mismanagement→surcharge+ the design of bank slope anti-seepage is improper or the construction quality is poor→uplift at dam foundation rising→shear strength of bed rock or bank slope decreasing→invalid intervention→dam failure |
| Failure Modes | Serial Number | The Path of Dam Failure Risk |
|---|---|---|
| Instability of dam body and dam slope | R1 | Reservoir water level falling too fast→bank pore water pressure increasing→effective stress lowering→the saturation of dam slope→invalid intervention→dam failure |
| R2 | High water level→faults expanding or weak intercalation failure in deep dam foundation→instability of dam→invalid intervention→dam failure | |
| R3 | Mismanagement→surcharge→the design of bank slope anti-seepage is improper or the construction quality is poor→the saturation of dam slope→invalid intervention→dam failure | |
| Instability of dam foundation | R4 | Scour the contact surface of dam foundation→dam foundation seepage→seepage damage→invalid intervention→dam failure |
| R5 | Mismanagement→surcharge→the design of bank slope anti-seepage is improper or the construction quality is poor→the saturation of dam slope→invalid intervention→dam failure | |
| R6 | The design of upstream anti-seepage is insufficient or the water-tight screen is defective→uplift pressure at dam foundation rising→the vertical useful load decreasing→sliding along the foundation surface of the dam→invalid intervention→dam failure | |
| Others | R7 | Corrosion→causticity cracking of concrete construction→crack propagating→invalid intervention→dam failure |
| E1 | E2 | E3 | E4 | E5 | E1 | E2 | E3 | E4 | E5 | E1 | E2 | E3 | E4 | E5 | |
|---|---|---|---|---|---|---|---|---|---|---|---|---|---|---|---|
| R1 | ML | ML | ML | L | ML | MH | H | M | MH | MH | M | MH | ML | M | M |
| R2 | L | L | ML | ML | L | MH | MH | H | MH | MH | VH | H | H | MH | VH |
| R3 | VL | L | VL | L | VL | H | MH | MH | H | MH | H | VH | MH | H | MH |
| R4 | H | MH | H | H | MH | M | MH | H | MH | ML | VL | VL | L | ML | L |
| R5 | L | ML | L | ML | ML | M | MH | H | MH | M | VH | H | VH | MH | H |
| R6 | VL | L | L | ML | L | MH | MH | VH | MH | MH | H | VH | VH | H | VH |
| R7 | VL | VL | VL | L | L | VH | H | VH | H | VH | VL | L | M | L | L |
| R1 | (0.144,0.292,0.464) | (0.5,0.672,0.828) | (0.328,0.5,0.672) |
| R2 | (0.072,0.236,0.392) | (0.536,0.708,0.856) | (0.7,0.864,0.964) |
| R3 | (0,0.072,0.236) | (0.572,0.736,0.892) | (0.636,0.8,0.928) |
| R4 | (0.608,0.764,0.928) | (0.436,0.6,0.764) | (0.036,0.136,0.3) |
| R5 | (0.108,0.264,0.428) | (0.664,0.836,0.928) | (0.7,0.864,0.964) |
| R6 | (0.036,0.172,0.328) | (0.664,0.744,0.856) | (0.764,0.928,1) |
| R7 | (0,0.072,0.236) | (0.764,0.928,1) | (0.036,0.172,0.328) |
| E | R1 | R2 | R3 | ||||||
|---|---|---|---|---|---|---|---|---|---|
| R1 | 0.0000 | 0.0000 | 0.0000 | 0.0627 | 0.0996 | 0.1382 | 0.0294 | 0.0644 | 0.0996 |
| R2 | 0.0421 | 0.0789 | 0.1123 | 0.0000 | 0.0000 | 0.0000 | 0.1220 | 0.1555 | 0.1923 |
| R3 | 0.0299 | 0.0650 | 0.1002 | 0.0841 | 0.1226 | 0.1577 | 0.0000 | 0.0000 | 0.0000 |
| R4 | 0.0351 | 0.0720 | 0.1071 | 0.0984 | 0.1353 | 0.1705 | 0.0340 | 0.0709 | 0.1059 |
| R5 | 0.0506 | 0.0857 | 0.1210 | 0.0363 | 0.0697 | 0.1065 | 0.0558 | 0.0927 | 0.1278 |
| R6 | 0.0236 | 0.0494 | 0.0789 | 0.0789 | 0.1140 | 0.1525 | 0.1152 | 0.1503 | 0.1853 |
| R7 | 0.0000 | 0.0230 | 0.0564 | 0.0000 | 0.0230 | 0.0564 | 0.0000 | 0.0155 | 0.0506 |
| R4 | R5 | R6 | |||||||
|---|---|---|---|---|---|---|---|---|---|
| R1 | 0.1220 | 0.1573 | 0.1906 | 0.0075 | 0.0369 | 0.0627 | 0.0161 | 0.0511 | 0.0847 |
| R2 | 0.0351 | 0.0720 | 0.1071 | 0.0720 | 0.1071 | 0.1422 | 0.1013 | 0.1365 | 0.1698 |
| R3 | 0.0835 | 0.1220 | 0.1573 | 0.0351 | 0.0720 | 0.1071 | 0.0438 | 0.0772 | 0.1123 |
| R4 | 0.0000 | 0.0000 | 0.0000 | 0.0133 | 0.0444 | 0.0702 | 0.0207 | 0.0512 | 0.0749 |
| R5 | 0.0149 | 0.0427 | 0.0702 | 0.0000 | 0.0000 | 0.0000 | 0.1382 | 0.1698 | 0.2067 |
| R6 | 0.0207 | 0.0593 | 0.0893 | 0.1146 | 0.1514 | 0.1831 | 0.0000 | 0.0000 | 0.0000 |
| R7 | 0.0000 | 0.0155 | 0.0506 | 0.0000 | 0.0000 | 0.0386 | 0.0000 | 0.0311 | 0.0627 |
| R7 | |||
|---|---|---|---|
| R1 | 0.0000 | 0.0311 | 0.0627 |
| R2 | 0.0000 | 0.0000 | 0.0386 |
| R3 | 0.0000 | 0.0155 | 0.0506 |
| R4 | 0.0000 | 0.0386 | 0.0685 |
| R5 | 0.0000 | 0.0155 | 0.0506 |
| R6 | 0.0000 | 0.0230 | 0.0564 |
| R7 | 0.0000 | 0.0000 | 0.0000 |
| (0.1440, 0.2920, 0.4640) | (0.5942, 0.3367, 0.9348) | (0.3280, 0.5000, 0.6720) |
| (0.0720, 0.2360, 0.3920) | (0.5559, 0.6819, 0.8508) | (0.7000, 0.8640, 0.9640) |
| (0.0000, 0.0720, 0.2360) | (0.4525, 0.5071, 0.7462) | (0.6360, 0.8000, 0.9280) |
| (0.6080, 0.7640, 0.9280) | (0.3471, 0.4149, 0.6628) | (0.0360, 0.1360, 0.3000) |
| (0.1080, 0.2640, 0.4280) | (0.5356, 0.8359, 0.9028) | (0.7000, 0.8640, 0.9640) |
| (0.0360, 0.1720, 0.3280) | (0.7113, 0.8562, 0.9201) | (0.7640, 0.9280, 1.0000) |
| (0.0000, 0.0720, 0.2360) | (0.764, 0.9029, 0.9785) | (0.0360, 0.1720, 0.3280) |
| Rank | Rank | Rank | ||||
|---|---|---|---|---|---|---|
| R1 | 0.9156 | 7 | 0.3408 | 3 | 0.6282 | 3 |
| R2 | 0.8058 | 3 | 0.4666 | 4 | 0.6362 | 4 |
| R3 | 0.9115 | 6 | 0.5000 | 5 | 0.7058 | 7 |
| R4 | 0.9000 | 5 | 0.5000 | 5 | 0.7000 | 6 |
| R5 | 0.8833 | 4 | 0.5000 | 5 | 0.6916 | 5 |
| R6 | 0.6605 | 1 | 0.2853 | 1 | 0.4729 | 1 |
| R7 | 0.7485 | 2 | 0.3000 | 2 | 0.5242 | 2 |
© 2020 by the authors. Licensee MDPI, Basel, Switzerland. This article is an open access article distributed under the terms and conditions of the Creative Commons Attribution (CC BY) license (http://creativecommons.org/licenses/by/4.0/).
Share and Cite
Zhu, Y.; Niu, X.; Gu, C.; Yang, D.; Sun, Q.; Rodriguez, E.F. Using the DEMATEL-VIKOR Method in Dam Failure Path Identification. Int. J. Environ. Res. Public Health 2020, 17, 1480. https://doi.org/10.3390/ijerph17051480
Zhu Y, Niu X, Gu C, Yang D, Sun Q, Rodriguez EF. Using the DEMATEL-VIKOR Method in Dam Failure Path Identification. International Journal of Environmental Research and Public Health. 2020; 17(5):1480. https://doi.org/10.3390/ijerph17051480
Chicago/Turabian StyleZhu, Yantao, Xinqiang Niu, Chongshi Gu, Dashan Yang, Qiang Sun, and E. Fernandez Rodriguez. 2020. "Using the DEMATEL-VIKOR Method in Dam Failure Path Identification" International Journal of Environmental Research and Public Health 17, no. 5: 1480. https://doi.org/10.3390/ijerph17051480
APA StyleZhu, Y., Niu, X., Gu, C., Yang, D., Sun, Q., & Rodriguez, E. F. (2020). Using the DEMATEL-VIKOR Method in Dam Failure Path Identification. International Journal of Environmental Research and Public Health, 17(5), 1480. https://doi.org/10.3390/ijerph17051480