Differences in Body Composition across Police Occupations and Moderation Effects of Leisure Time Physical Activity

 ,
,  ,
,  ,
, 
 ,
, 
 and
and 
Abstract
1. Introduction
2. Materials and Methods
2.1. Participants
2.2. Occupational Characteristics
2.3. Body Composition Assessment
2.4. Frequency and Volume of Leisure Time Physical Activity
2.5. Statistical Analysis
3. Results
4. Discussion
5. Study limitations
6. Conclusions
Author Contributions
Funding
Conflicts of Interest
References
- Garbarino, S.; Magnavita, N. Work stress and metabolic syndrome in police officers. A prospective study. PLoS ONE 2015, 10, e0144318. [Google Scholar] [CrossRef]
- Hauschild, V.D.; DeGroot, D.W.; Hall, S.M.; Grier, T.L.; Deaver, K.D.; Hauret, K.G.; Jones, B.H. Fitness tests and occupational tasks of military interest: A systematic review of correlations. Occup. Environ. Med. 2017, 74, 144–153. [Google Scholar] [CrossRef]
- Maupin, D.; Wills, T.; Orr, R.; Schram, B. Fitness profiles in elite tactical units: A critical review. Int. J. Exerc. Sci. 2018, 11, 1041–1062. [Google Scholar]
- Riebe, D.; Ehrman, J.K.; Liguori, G.; Megal, M. ACSM’s Guidelines for Exercise Testing and Prescription, 10th ed.; Wolters Kluwer: Philadelphia, PA, USA, 2018. [Google Scholar]
- Kukic, F.; Dopsaj, M.; Dawes, J.; Orr, R.; Cvorovic, A. Use of human body morphology as an indicator of physical fitness: Implications for police officers. Int. J. Morphol. 2018, 36, 1407–1412. [Google Scholar] [CrossRef]
- Kukić, F.; Čvorović, A. The strategic approach to an improvement of health-related physical fitness of police officers: An 8-week exercise intervention: Pilot study. Bezb. Beogr. 2019, 61, 28–45. [Google Scholar] [CrossRef]
- Guffey, J.E.; Larson, J.G.; Lasley, J. Police officer fitness, diet, lifestyle and its relationship to duty performance and injury. J. Legal Issues Cases Bus. 2015, 3, 17. [Google Scholar]
- Dawes, J.J.; Lindsay, K.; Bero, J.; Elder, C.; Kornhauser, C.; Holmes, R. Physical fitness characteristics of high vs. low performers on an occupationally specific physical agility test for patrol officers. J. Strength Cond. Res. 2017, 31, 2808–2815. [Google Scholar] [CrossRef] [PubMed]
- Mona, G.G.; Chimbari, M.J.; Hongoro, C. A systematic review on occupational hazards, injuries and diseases among police officers worldwide: Policy implications for the South African Police Service. J. Occup. Med. Toxicol. 2019, 14, 2. [Google Scholar] [CrossRef] [PubMed]
- Orr, R.; Pope, R.; Stierli, M.; Hinton, B. Grip strength and its relationship to police recruit task performance and injury risk: A retrospective cohort study. Int. J. Environ. Res. Public Health 2017, 14, 941. [Google Scholar] [CrossRef] [PubMed]
- Dawes, J.J.; Orr, R.M.; Siekaniec, C.L.; Vanderwoude, A.A.; Pope, R. Associations between anthropometric characteristics and physical performance in male law enforcement officers: A retrospective cohort study. Ann. Occup. Environ. Med. 2016, 28. [Google Scholar] [CrossRef] [PubMed]
- Sorensen, L.; Smolander, J.; Louhevaara, V.; Korhonen, O.; Oja, P. Physical activity, fitness and body composition of Finnish police officers: A 15-year follow-up study. Occup. Med. 2000, 50, 3–10. [Google Scholar] [CrossRef] [PubMed]
- Charles, L.E.; Burchfiel, C.M.; Violanti, J.M.; Fekedulegn, D.; Slaven, J.E.; Browne, R.W.; Hartley, T.A.; Andrew, M.E. Adiposity measures and oxidative stress among police officers. Obesity 2008, 16, 2489–2497. [Google Scholar] [CrossRef] [PubMed]
- Gu, J.K.; Charles, L.E.; Burchfiel, C.M.; Fekedulegn, D.; Sarkisian, K.; Andrew, M.E.; Ma, C.; Violanti, J.M. Long work hours and adiposity among police officers in a US Northeast City. J. Occup. Environ. Med. 2012, 54, 1374–1381. [Google Scholar] [CrossRef]
- Ćopić, N.; Kukić, F.; Tomić, I.; Parčin, I.; Dopsaj, M. The impact of shift-work on nutritional status of police officers. J. Crim. Law 2020, 25. [Google Scholar]
- Vuković, M.; Kukić, F.; Čvorović, A.; Janković, D.; Prćić, I.; Dopsaj, M. Relations between frequency and volume of leisure-time physical activity and body composition in police officers. Res. Q. Exerc. Sport 2020, 91, 47–54. [Google Scholar] [CrossRef]
- Čvorović, A.; Kukić, F.; Orr, R.M.; Dawes, J.J.; Jeknić, V.; Stojković, M. Impact of a 12-week postgraduate training course on the body composition and physical abilities of police trainees. J. Strength Cond. Res. 2018. [Google Scholar] [CrossRef]
- Demling, R.H.; DeSanti, L. Effect of a hypocaloric diet, increased protein intake and resistance training on lean mass gains and fat mass loss in overweight police officers. Ann. Nutr. Metab. 2000, 44, 21–29. [Google Scholar] [CrossRef]
- Violanti, J.M.; Hartley, T.A.; Gu, J.K.; Fekedulegn, D.; Andrew, M.E.; Burchfiel, C.M. Life Expectancy in Police Officers: A Comparison with the U.S. General Population. Int. J. Emerg. Ment. Health 2013, 15, 217–228. [Google Scholar]
- Acquadro Maran, D.; Zedda, M.; Varetto, A. Organizational and occupational stressors, their consequences and coping strategies: A questionnaire survey among Italian patrol police officers. Int. J. Environ. Res. Public Health 2018, 15, 166. [Google Scholar] [CrossRef]
- Ma, C.C.; Burchfiel, C.M.; Fekedulegn, D.; Andrew, M.E.; Charles, L.E.; Gu, J.K.; Mnatsakanova, A.; Violanti, J.M. Association of shift work with physical activity among police officers: The Buffalo cardio-metabolic occupational police stress study. J. Occup. Environ. Med. 2011, 53, 1030–1036. [Google Scholar] [CrossRef]
- Pryor, R.R.; Colburn, D.; Crill, M.T.; Hostler, D.P.; Suyama, J. Fitness characteristics of a suburban special weapons and tactics team. J. Strength Cond. Res. 2012, 26, 752. [Google Scholar] [CrossRef] [PubMed]
- Smith, D.L. Firefighter Fitness: Improving Performance and Preventing Injuries and Fatalities. Curr. Sports Med. Rep. 2011, 10, 167–172. [Google Scholar] [CrossRef] [PubMed]
- Clark, J.G.; Jackson, M.S.; Schaefer, P.M.; Sharpe, E.G. Training SWAT teams: Implications for improving tactical units. J. Crim. Justice 2000, 28, 407–413. [Google Scholar] [CrossRef]
- MacDonald, D.; Pope, R.; Orr, R. Differences in Physical Characteristics and Performance Measures of Part-Time and Full- Time Tactical Personnel: A Critical Narrative Review. J. Mil. Veterans Health 2016, 24, 11. [Google Scholar]
- Williams, J.R. The declaration of Helsinki and public health. Bull World Health Organ. 2008, 86, 650–652. [Google Scholar] [CrossRef] [PubMed]
- Subošić, D. Organizacija i Poslovi Policije, 4th ed.; Kriminalističko-policijski univerzitet: Belgrade, Serbia, 2020; ISBN 978-86-7020-447-8. [Google Scholar]
- Specijalne-jedinice.com | Specijalna antiteroristička jedinica-SAJ. Available online: https://specijalne-jedinice.com/Srbija/SAJ.html#sthash.jKwlw7Y2.yXqNOWAI.dpbs (accessed on 11 August 2020).
- Specijalne-jedinice.com | Gendarmerie of the Republic of Serbia. Available online: https://specijalne-jedinice.com/Srbija/Zandarmerija-English.html#sthash.5p7ruaFn.ILhj4BeS.dpbs (accessed on 11 August 2020).
- Abel, M.G.; Sell, K.; Dennison, K. Design and Implementation of Fitness Programs for Firefighters. Strength Cond. J. 2011, 33, 31–42. [Google Scholar] [CrossRef]
- Cvorovic, A.; Kukić, F.; Abdulovic, A.; Orr, R.M.; Dawes, J. Effectiveness of a short-term conditioning program to prepare firefighters for an occupationally-specific competition-pilot study. J. Aust. Strength Cond. 2020, 28, 19–26. [Google Scholar]
- Aandstad, A.; Holtberget, K.; Hageberg, R.; Holme, I.; Anderssen, S.A. Validity and reliability of bioelectrical impedance analysis and skinfold thickness in predicting body fat in military personnel. Mil. Med. 2014, 179, 208–217. [Google Scholar] [CrossRef]
- Kim, M.; Shinkai, S.; Murayama, H.; Mori, S. Comparison of segmental multifrequency bioelectrical impedance analysis with dual-energy X-ray absorptiometry for the assessment of body composition in a community-dwelling older population. Geriatr. Gerontol. Int. 2015, 15, 1013–1022. [Google Scholar] [CrossRef]
- Craig, C.L.; Marshall, A.L.; Sjöström, M.; Bauman, A.E.; Booth, M.L.; Ainsworth, B.E.; Pratt, M.; Ekelund, U.; Yngve, A.; Sallis, J.F.; et al. International physical activity questionnaire: 12-country reliability and validity. Med. Sci. Sports Exerc. 2003, 35, 1381–1395. [Google Scholar] [CrossRef]
- Powell, K.E.; Paluch, A.E.; Blair, S.N. Physical activity for health: What kind? How much? How intense? On top of what? Annu. Rev. Public Health 2011, 32, 349–365. [Google Scholar] [CrossRef]
- Blair, S.N.; LaMonte, M.J.; Nichaman, M.Z. The evolution of physical activity recommendations: How much is enough? Am. J. Clin. Nutr. 2004, 79, 913S–920S. [Google Scholar] [CrossRef] [PubMed]
- Sullivan, G.M.; Feinn, R. Using effect size—or why the P value is not enough. J. Grad. Med Educ. 2012, 4, 279–282. [Google Scholar] [CrossRef] [PubMed]
- Boyce, R.W.; Ciulla, S.; Jones, G.R.; Boone, E.L.; Elliott, S.M.; Combs, C.S. Muscular Strength and Body Composition Comparison Between the Charlotte-Mecklenburg Fire and Police Departments. Int. J. Exerc. Sci. 2008, 1, 125–135. [Google Scholar]
- Dawes, J.J.; Orr, R.M.; Elder, C.L.; Rockwell, C. Association between fatness and measures of muscular endurance among part-time SWAT officers. J. Aust. Strength Cond. 2014, 22, 33–37. [Google Scholar]
- Dominski, F.H.; Crocetta, T.B.; Santo, L.B.D.E.; Cardoso, T.E.; da Silva, R.; Andrade, A. Police Officers Who Are Physically Active and Have Low Levels of Body Fat Show Better Reaction Time. J. Occup. Environ. Med. 2018, 60, e1–e5. [Google Scholar] [CrossRef]
- Kukić, F.; Jeknić, V.; Dawes, J.; Orr, R.; Stojković, M.; Čvorović, A. Effects of training and a semester break on physical fitness of police trainees. Kinesiology 2019, 51, 161–169. [Google Scholar] [CrossRef]
- Boyce, R.W.; Jones, G.; Lloyd, C. A longitudinal observation of police: Body composition changes over 12 years with gender and race comparisons. J. Exerc. Physiol. Online 2008, 11, 13. [Google Scholar]
- Lagestad, P.; van den Tillaar, R. Longitudinal changes in the physical activity patterns of police officers. Int. J. Police Sci. Manag. 2014, 16, 76–86. [Google Scholar] [CrossRef]
- Heinrich, K.M.; Gurevich, K.G.; Arkhangelskaia, A.N.; Karazhelyaskov, O.P.; Poston, W.S.C. Despite low obesity rates, body mass index under-estimated obesity among Russian police officers when compared to body fat percentage. Int. J. Environ. Res. Public Health 2020, 17, 1937. [Google Scholar] [CrossRef]
- Gurevich, K.G.; Poston, W.S.C.; Anders, B.; Ivkina, M.A.; Archangelskaya, A.; Jitnarin, N.; Starodubov, V.I. Obesity prevalence and accuracy of BMI-defined obesity in Russian firefighters. Occup. Med. (Lond.) 2017, 67, 61–63. [Google Scholar] [CrossRef] [PubMed]
- Dopsaj, M.; Vuković, M. Prevalence of the body mass index (BMI) among the members of the Ministry of Interior of the Republic of Serbia: Pilot study. Bezb. Beogr. 2015, 57, 28–48. [Google Scholar] [CrossRef]


| Var. | Group | Sedentary | Moderately Active | Very Active | |||
|---|---|---|---|---|---|---|---|
| Mean ± SD | Min.–Max. | Mean ± SD | Min.–Max. | Mean ± SD | Min.–Max. | ||
| Age (years) | SAU | 40.13 ± 5.77 | 32.00–49.00 | 36.41 ± 3.68 | 28.00 ± 43.00 | 33.63 ± 5.45 | 24.00 ± 44.00 |
| Gendarmerie | 41.0 ± 35.44 | 31.40–50.00 | 33.77 ± 5.42 | 25.00 ± 47.00 | 32.15 ± 3.77 | 28.00 ± 41.00 | |
| Firefighters | 38.60 ± 7.40 | 24.00–52.00 | 32.90 ± 6.72 | 21.00 ± 46.00 | 31.83 ± 6.71 | 23.00 ± 43.00 | |
| General police | 36.00 ± 6.66 | 25.00–52.00 | 33.94 ± 6.21 | 24.30 ± 46.60 | 28.93 ± 3.89 | 26.30 ± 33.40 | |
| BH (cm) | SAU | 181.40 ± 3.75 | 177.40–188.30 | 180.57 ± 5.41 | 171.70 ± 194.50 | 182.91 ± 6.74 | 166.10 ± 196.60 |
| Gendarmerie | 180.52 ± 5.76 | 168.50–190.30 | 183.91 ± 8.45 | 173.50 ± 197.60 | 180.93 ± 6.94 | 171.70 ± 192.80 | |
| Firefighters | 179.51 ± 6.35 | 162.70–191.70 | 185.92 ± 5.88 | 172.60 ± 193.40 | 182.38 ± 7.60 | 174.80 ± 193.40 | |
| General police | 182.88 ± 7.18 | 167.80–206.20 | 183.28 ± 7.83 | 171.50 ± 202.40 | 181.17 ± 10.77 | 170.80 ± 192.30 | |
| BM (kg) | SAU | 90.34 ± 10.78 | 78.80–106.40 | 89.76 ± 8.30 | 75.40 ± 106.00 | 87.30 ± 9.64 | 66.00 ± 109.40 |
| Gendarmerie | 93.74 ± 15.92 | 71.00–129.50 | 94.91 ± 18.92 | 72.70 ± 146.30 | 89.09 ± 12.69 | 72.40 ± 112.80 | |
| Firefighters | 93.48 ± 13.74 | 66.60–125.30 | 83.39 ± 9.21 | 67.90 ± 93.20 | 82.45 ± 10.80 | 63.00 ± 92.70 | |
| General police | 98.98 ± 17.08 | 70.20–145.90 | 86.18 ± 10.18 | 62.60 ± 104.70 | 91.57 ± 9.81 | 84.20 ± 102.70 | |
| BMI (kg/m2) | SAU | 27.43 ± 2.81 | 23.12–31.70 | 27.52 ± 2.19 | 22.94 ± 31.59 | 26.02 ± 1.51 | 23.86 ± 29.68 |
| Gendarmerie | 28.73 ± 4.45 | 21.38–38.80 | 27.96 ± 4.82 | 23.07 ± 44.26 | 27.06 ± 1.94 | 23.71 ± 30.35 | |
| Firefighters | 28.98 ± 3.81 | 20.91–39.21 | 24.20 ± 3.25 | 20.53 ± 31.02 | 24.75 ± 2.57 | 19.91 ± 26.80 | |
| General police | 29.47 ± 3.83 | 23.37–40.42 | 25.63 ± 2.32 | 19.43 ± 29.00 | 27.87 ± 0.95 | 26.98 ± 28.86 | |
| %BF (%) | SAU | 19.59 ± 3.64 | 13.45–24.21 | 18.46 ± 4.02 | 5.31 ± 26.51 | 12.56 ± 3.32 | 6.87 ± 18.12 |
| Gendarmerie | 23.61 ± 7.80 | 6.48–36.95 | 16.85 ± 5.79 | 12.10 ± 36.02 | 14.07 ± 4.32 | 7.98 ± 22.65 | |
| Firefighters | 23.69 ± 6.45 | 2.96–38.97 | 13.60 ± 6.11 | 5.47 ± 26.08 | 11.97 ± 3.76 | 5.87 ± 16.06 | |
| General police | 25.74 ± 5.85 | 14.97–40.20 | 17.45 ± 4.00 | 10.06 ± 22.73 | 15.63 ± 1.60 | 14.51 ± 17.46 | |
| %SMM (%) | SAU | 45.95 ± 1.83 | 43.70–48.86 | 46.68 ± 2.40 | 41.91 ± 54.51 | 50.17 ± 2.12 | 46.49 ± 54.03 |
| Gendarmerie | 43.48 ± 4.40 | 35.86–52.68 | 47.68 ± 3.28 | 36.84 ± 50.43 | 49.53 ± 2.59 | 44.61 ± 53.72 | |
| Firefighters | 43.28 ± 4.01 | 31.37–55.47 | 48.91 ± 3.67 | 41.77 ± 54.44 | 50.28 ± 1.59 | 47.69 ± 52.22 | |
| General police | 42.04 ± 3.22 | 33.53–48.87 | 47.18 ± 2.37 | 44.16 ± 51.37 | 48.19 ± 0.91 | 47.15 ± 48.75 | |
| IH (Index) | SAU | 0.72 ± 0.13 | 0.58–0.87 | 0.67 ± 0.13 | 0.23 ± 0.89 | 0.48 ± 0.13 | 0.27 ± 0.75 |
| Gendarmerie | 0.80 ± 0.18 | 0.28–1.06 | 0.59 ± 0.10 | 0.45 ± 0.81 | 0.52 ± 0.15 | 0.26 ± 0.79 | |
| Firefighters | 0.81 ± 0.16 | 0.14–1.07 | 0.56 ± 0.21 | 0.22 ± 0.84 | 0.48 ± 0.13 | 0.30 ± 0.66 | |
| General police | 0.87 ± 0.15 | 0.57–1.17 | 0.68 ± 0.13 | 0.42 ± 0.87 | 0.56 ± 0.04 | 0.52 ± 0.60 | |
| Variables | Age | Occupation | V-LTPA |
|---|---|---|---|
| Age | - | - | - |
| Occupation | −0.047 | - | - |
| V-LTPA | −0.331 ** | −0.475 ** | - |
| BMI | 0.183 ** | 0.140 * | −0.355 ** |
| %BF | 0.334 ** | 0.348 ** | −0.687 ** |
| %SMM | −0.345 ** | −0.371 ** | 0.698 ** |
| IH | 0.352 ** | 0.386 ** | −0.721 ** |
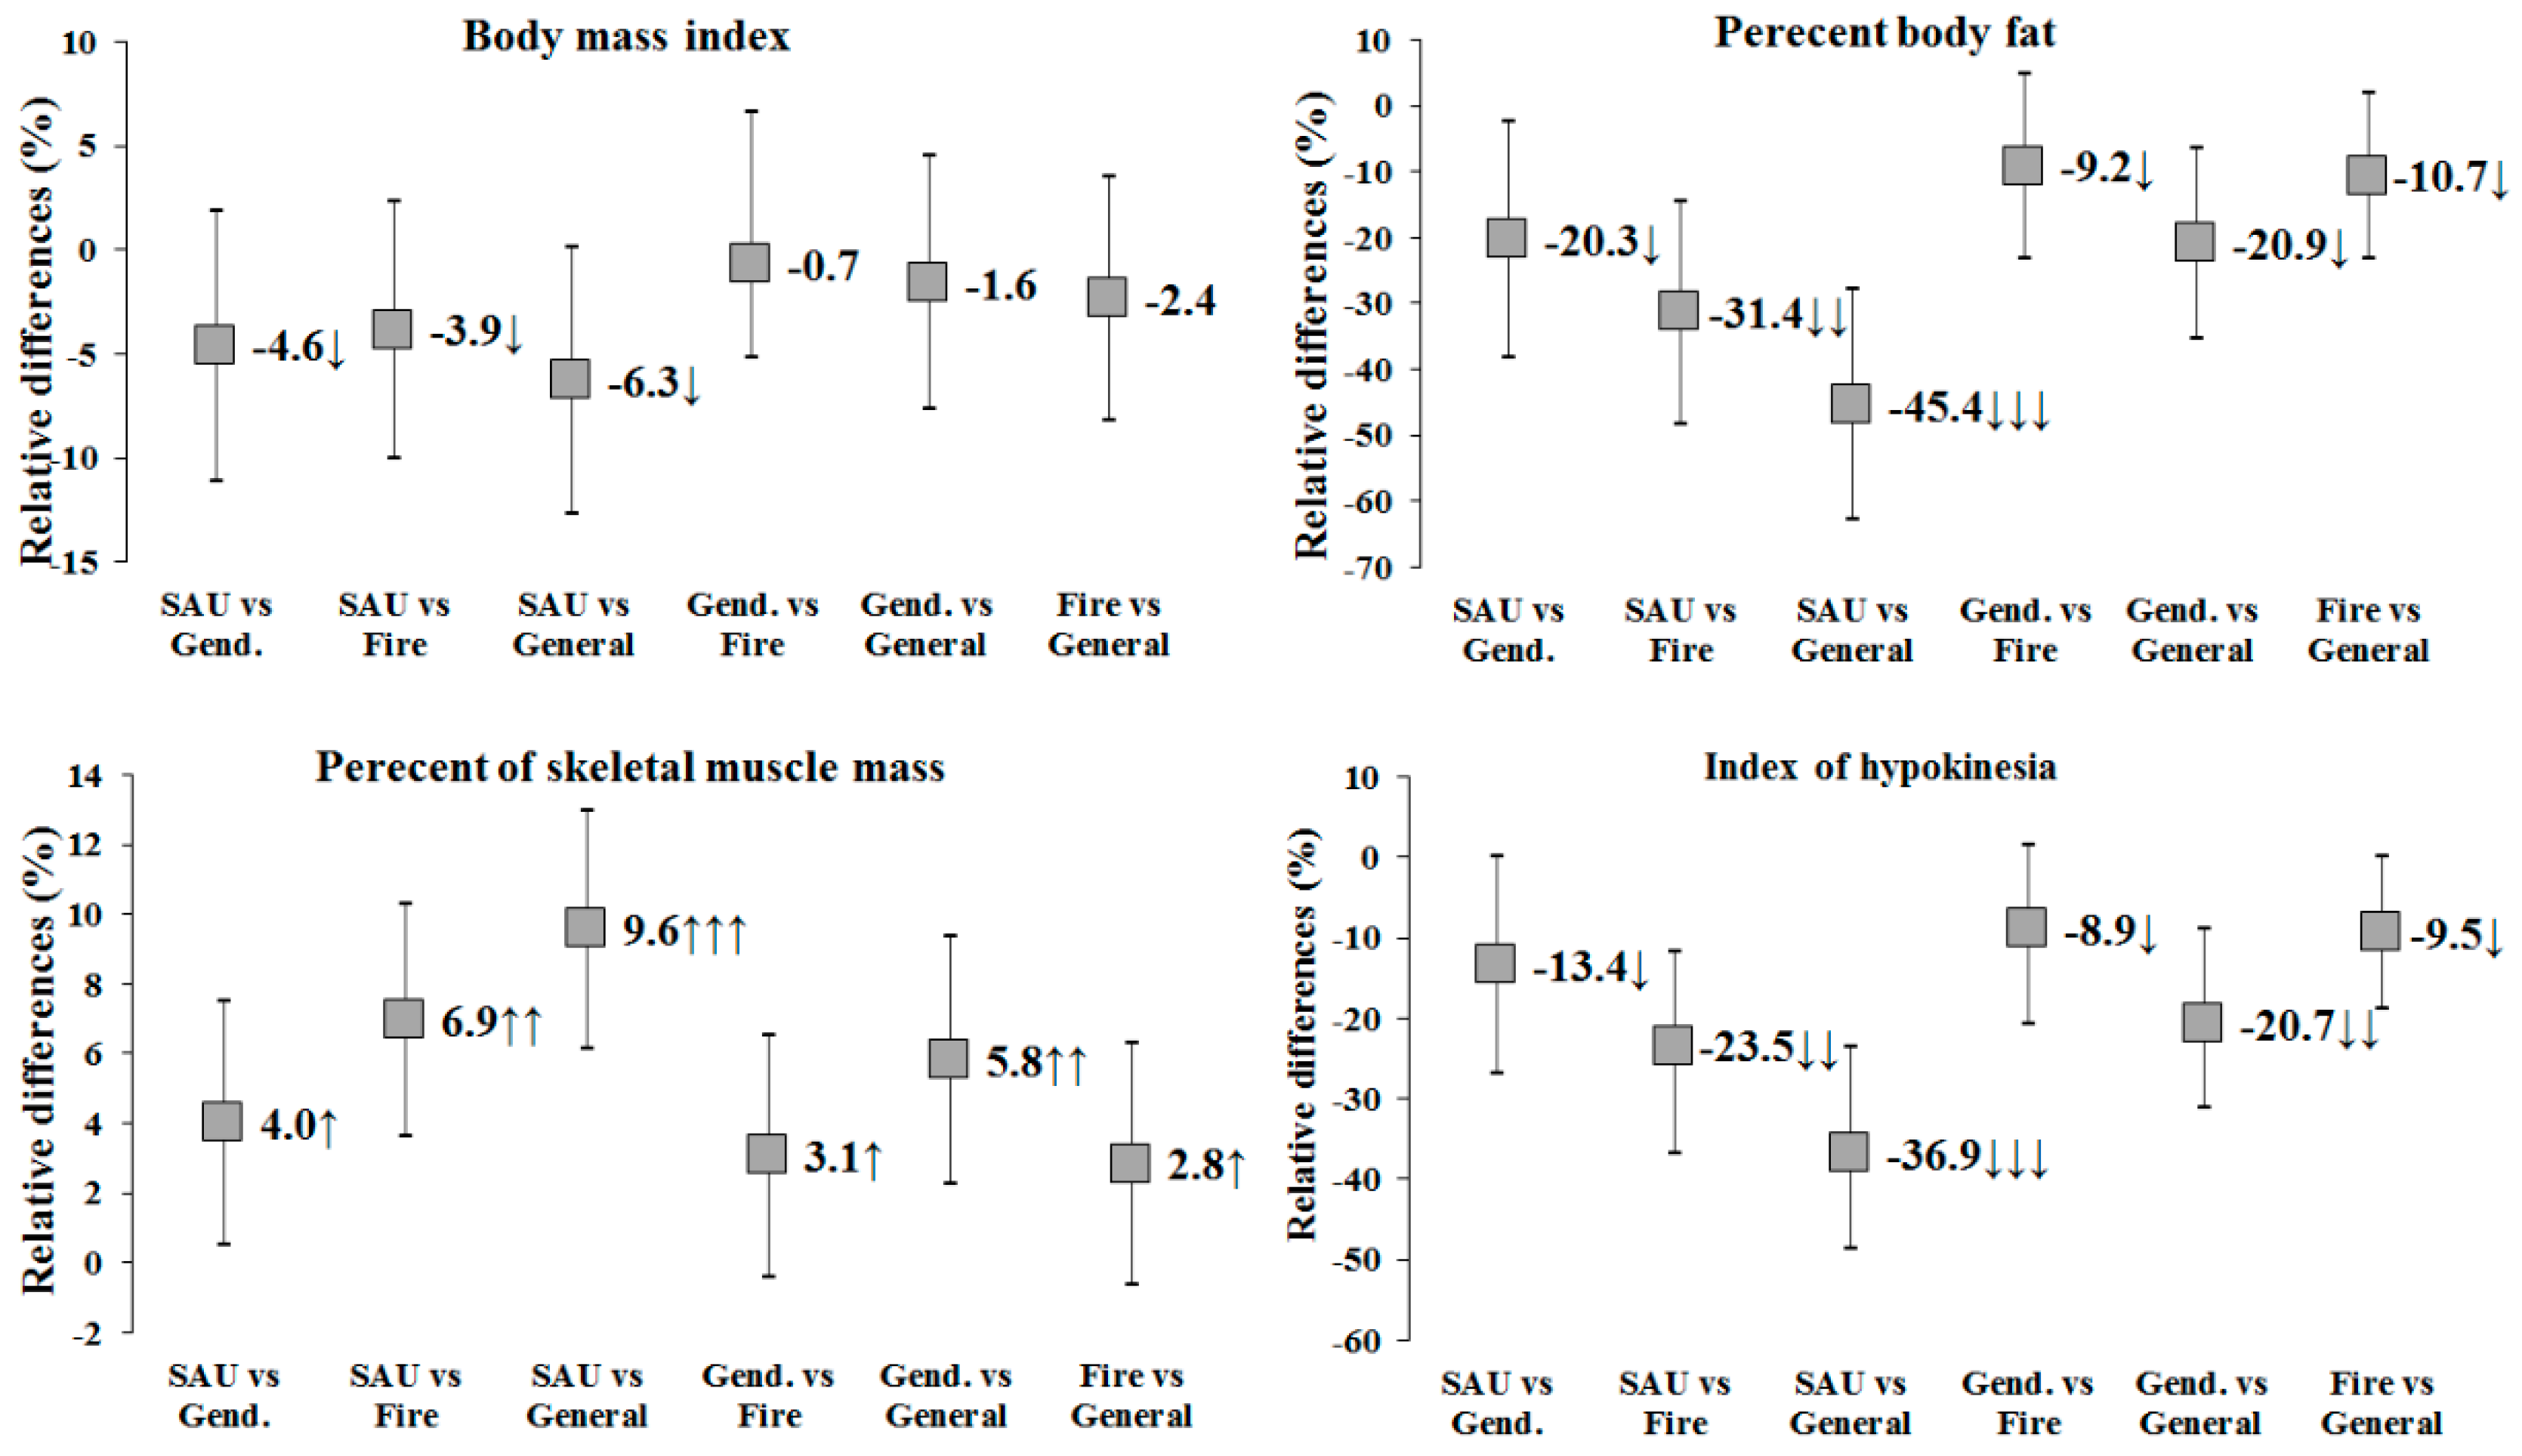
| Between-Occupation Comparison | %BF | %SMM | IH (Index Unit) | V-LTPA (min/week) | |
|---|---|---|---|---|---|
| Mean 95% CI | Mean 95% CI | Mean 95% CI | Mean 95% CI | ||
| SAU | Gendarmerie | −3.27 * −6.14–0.40 | 1.92 * 0.243.60 | −0.08 * −0.16–0.00 | 97.17 * 32.11–162.23 |
| Firefighters | −5.06 * −7.79–2.33 | 3.33 * 1.73–4.93 | −0.14 * −0.22–0.07 | 195.18 * 133.28–257.08 | |
| General police | −7.32 * −10.13–4.51 | 4.59 * 2.95–6.24 | −0.22 * −0.29–0.14 | 203.93 * 140.23–267.63 | |
| Gendarmerie | Firefighters | −1.79 −4.51–0.93 | 1.41 −0.18–3.00 | −0.06 −0.14–0.01 | 98.01 * 36.42–159.59 |
| General police | −4.05 * −6.85–1.25 | 2.67 * 1.03–4.31 | −0.14 * −0.21–0.06 | 106.76 * 43.36–170.16 | |
| Firefighters | General police | −2.26 −4.92–0.39 | 1.26 −0.29–2.81 | −0.07 * −0.14–0.00 | 8.75 −51.40–68.90 |
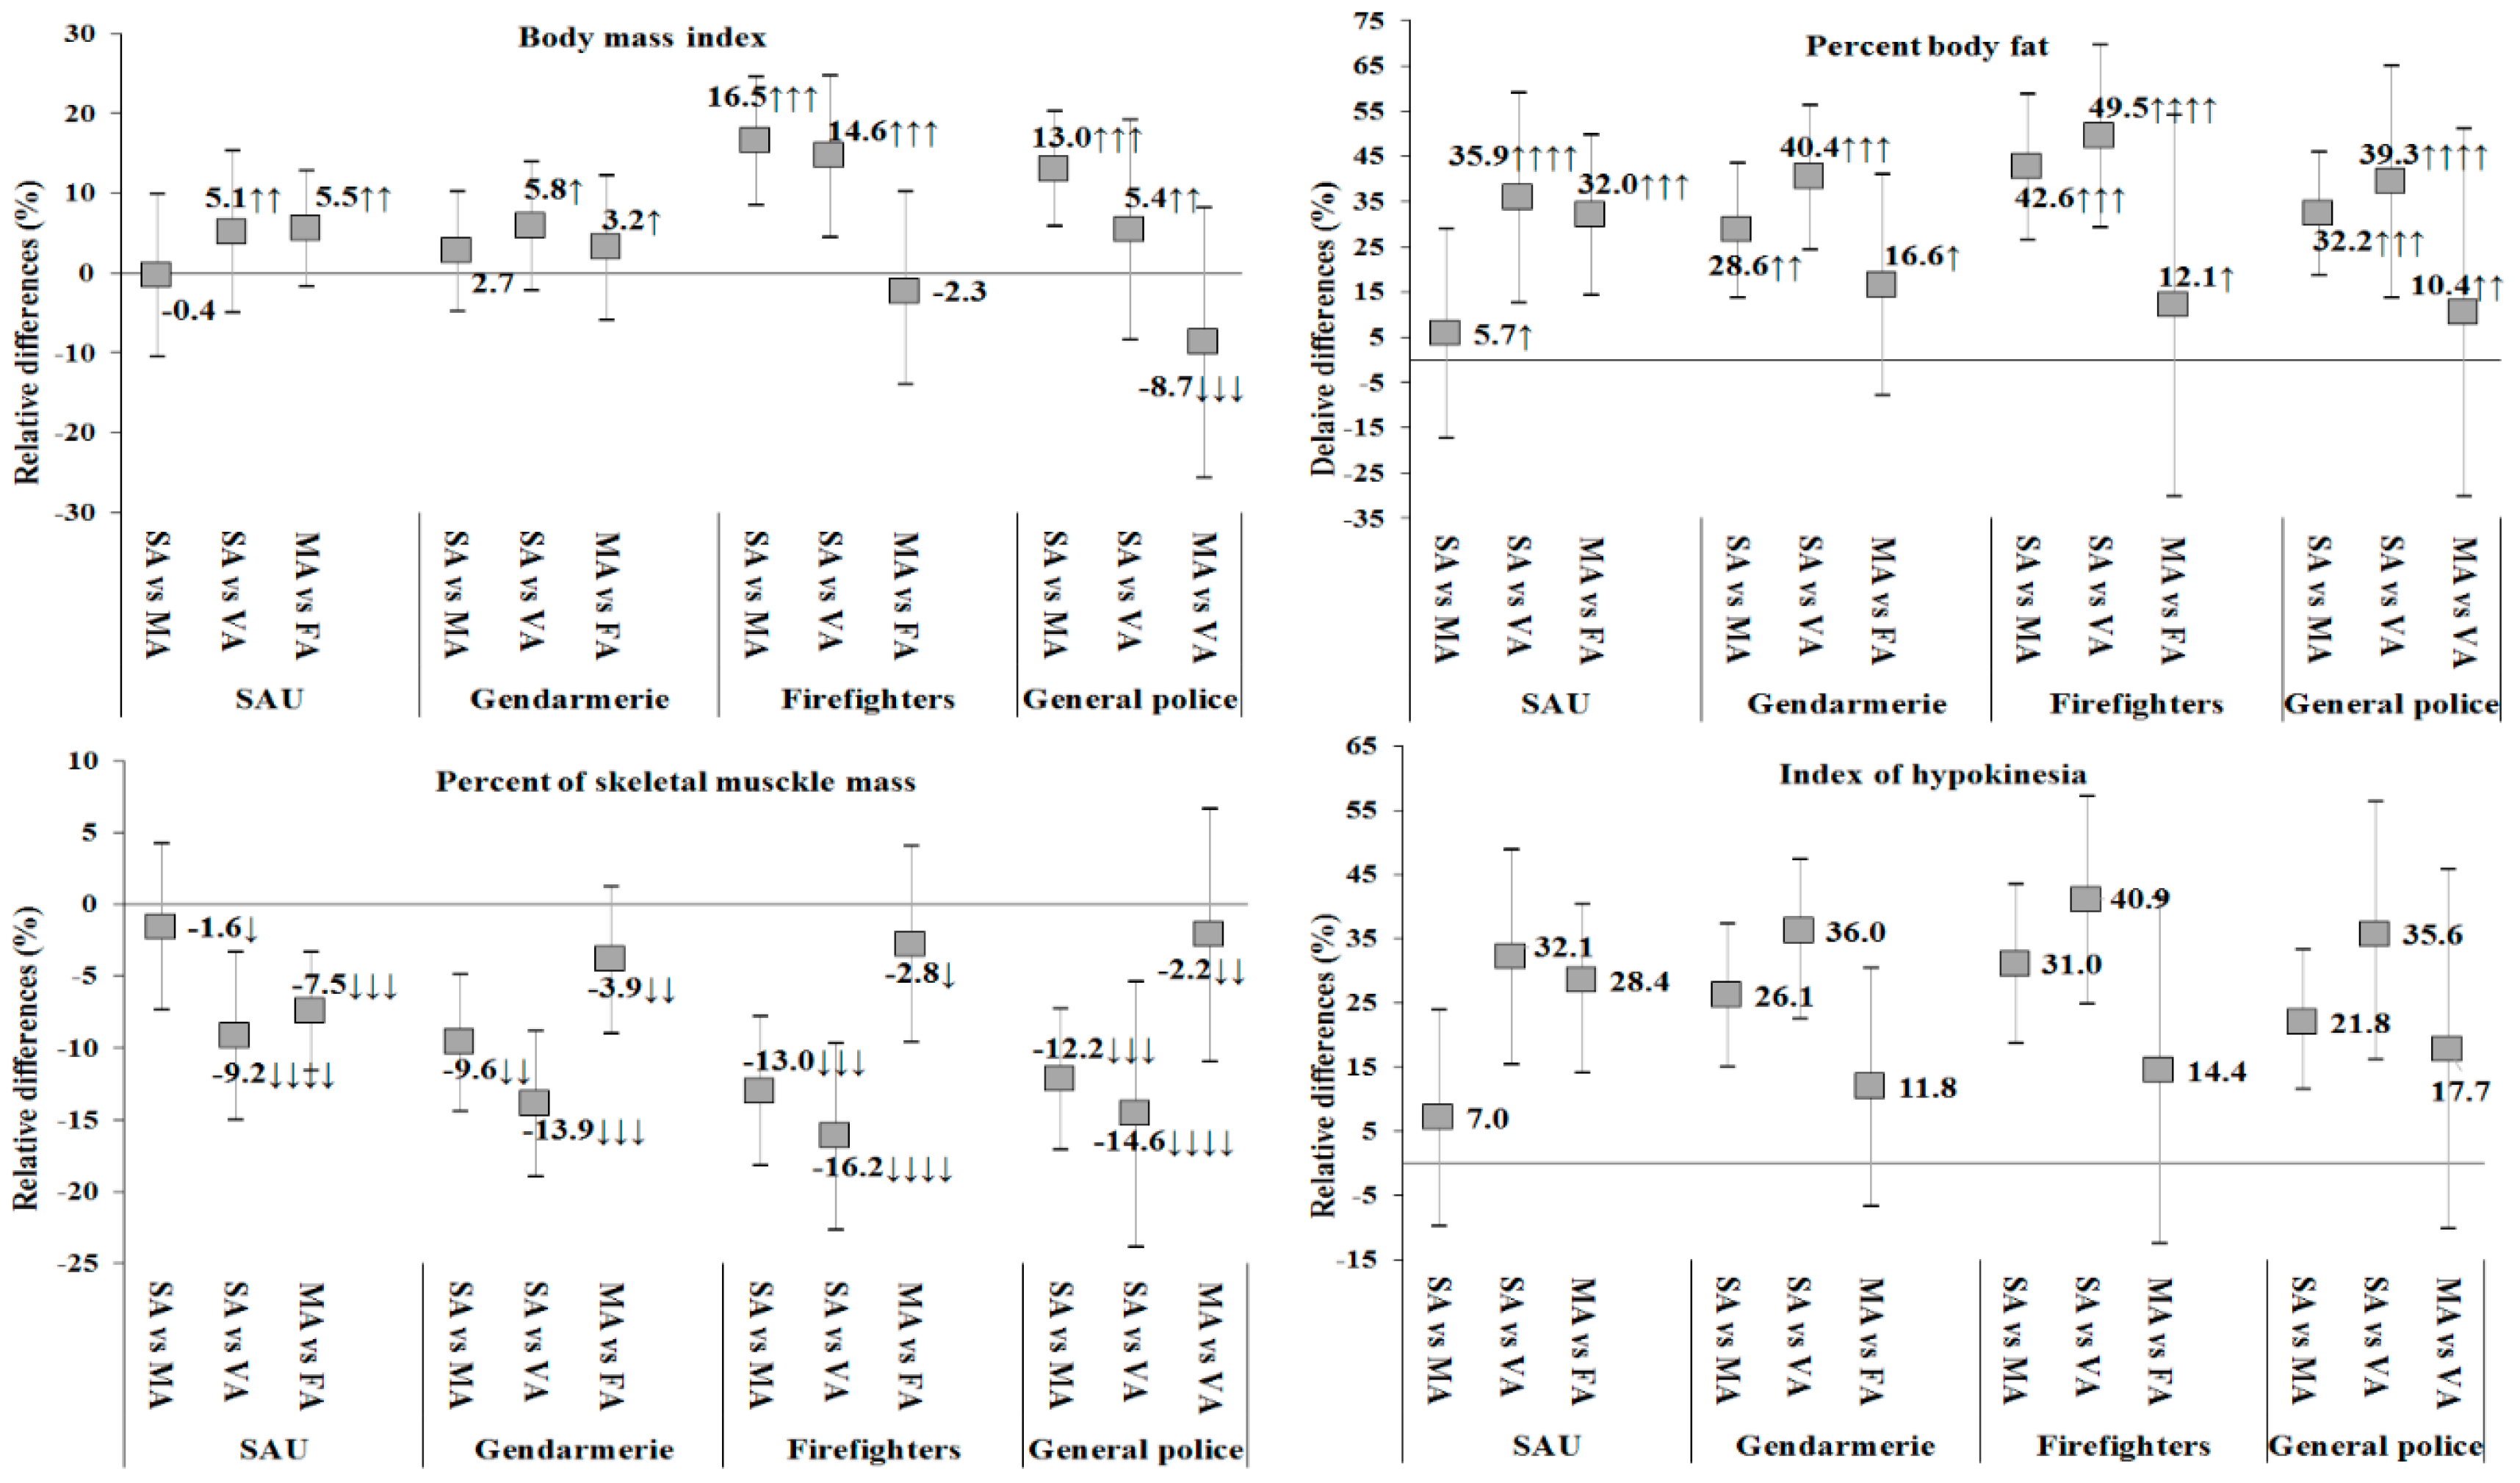
| Variables | Within-Between Comparison | SAU | Gendarmerie | Firefighters | General Police | |
|---|---|---|---|---|---|---|
| Mean 95% CI | Mean 95% CI | Mean 95% CI | Mean 95% CI | |||
| BMI (kg/m2) | ANOVA | F = 3.51, p = 0.037 | F = 0.72, p = 0.492 | F = 9.62, p < 0.001 | F = 6.11, p = 0.004 | |
| Sedentary | Moderately active | −0.10 −2.88–2.69 | 0.78 −1.38–2.93 | 4.78 * 2.44–7.13 | 3.84 * 1.70–5.98 | |
| Very active | 1.41 −1.38–4.19 | 1.67 −0.64–3.97 | 4.23 * 1.30–7.15 | 1.60 −2.45–5.65 | ||
| Moderately active | Very active | 1.51 * −0.49–3.51 | 0.89 −1.64–3.42 | −0.55 −4.06–2.95 | −2.24 −6.58–2.11 | |
| %BF (%) | ANOVA | F = 18.99, p < 0.001 | F = 10.81, p < 0.001 | F = 18.14, p < 0.001 | F = 15.09, p < 0.001 | |
| Sedentary | Moderately active | 1.12 −3.43–5.68 | 6.76 * 3.23–10.28 | 10.09 * 6.26–13.93 | 8.30 * 4.79–11.80 | |
| Very active | 7.03 * 2.47–11.58 | 9.54 * 5.77–13.31 | 11.73 * 6.94–16.51 | 10.11 * 3.49–16.73 | ||
| Moderately active | Very active | 5.90 * 2.63–9.18 | 2.79 −1.35–6.93 | 1.64 −4.10–7.37 | 1.82 −5.29–8.93 | |
| %SMM (%) | ANOVA | F = 18.59, p < 0.001 | F = 13.28, p < 0.001 | F = 18.14, p < 0.001 | F = 18.51, p < 0.001 | |
| Sedentary | Moderately active | −0.73 −3.40–1.93 | −4.19 −6.26–2.13 | −5.64 * −7.88–3.39 | −5.13 * −7.18–3.08 | |
| Very active | −4.22 * −6.89–1.55 | −6.05 −8.26–3.84 | −7.00 * −9.81–4.20 | −6.15 * −10.03–2.27 | ||
| Moderately active | Very active | −3.49 * −5.40–1.57 | −1.86 −4.28–0.57 | −1.37 −4.72–1.99 | −1.02 −5.18–3.14 | |
| IH (Index unit) | ANOVA | F = 15.77, p < 0.001 | F = 17.47, p < 0.001 | F = 18.27, p < 0.001 | F = 14.73, p < 0.001 | |
| Sedentary | Moderately active | 0.05 −0.07–0.17 | 0.21 * 0.12–0.30 | 0.25 * 0.15–0.35 | 0.19 * 0.10–0.29 | |
| Very active | 0.23 * 0.11–0.35 | 0.29 * 0.18–0.38 | 0.33 * 0.20–0.46 | 0.31 * 0.14–0.49 | ||
| Moderately active | Very active | 0.19 * 0.10–0.27 | 0.07 −0.04–0.18 | 0.08 −0.07–0.23 | 0.12 −0.07–0.31 | |
| Variables | Between-Within Comparison | Sedentary | Moderately Active | Very Active | |
|---|---|---|---|---|---|
| Mean 95% CI | Mean 95% CI | Mean 95% CI | |||
| BMI (kg/m2) | SAU | Gendarmerie | −1.31 −4.05–1.44 | −0.43 −2.64–1.78 | −1.05 −3.40–1.31 |
| Firefighters | −1.55 −4.13–1.02 | 3.33 * 0.76–5.90 | 1.27 −1.84–4.38 | ||
| General police | −2.05 −4.65–0.56 | 1.89 −0.46–4.25 | −1.86 −6.02–2.31 | ||
| Gendarmerie | Firefighters | −0.25 −1.88–1.38 | 3.76 * 1.02–6.49 | 2.32 −1.03–5.66 | |
| General police | −0.74 −2.42–0.94 | 2.32 −0.021–4.86 | −0.81 −5.15–3.54 | ||
| Firefighters | General police | −0.49 −1.88–0.90 | −1.44 −4.29–1.42 | −3.12 −7.92–1.68 | |
| %BF (%) | SAU | Gendarmerie | −4.02 −8.51–0.47 | 1.61 −2.00–5.22 | −1.50 −5.36–2.35 |
| Firefighters | −4.11 −8.32–0.11 | 4.86 * 0.66–9.07 | 0.59 −4.49–5.68 | ||
| General police | −6.15 * −10.42–1.89 | 1.02 −2.83–4.87 | −3.07 −9.88–3.74 | ||
| Gendarmerie | Firefighters | −0.09 −2.75–2.58 | 3.25 −1.22–7.73 | 2.10 −3.38–7.58 | |
| General police | −2.13 −4.88–0.61 | −0.59 −4.74–3.55 | −1.56 −8.67–5.54 | ||
| Firefighters | General police | −2.05 −4.32–0.23 | −3.85 −8.51–0.82 | −3.66 −11.51–4.18 | |
| %SMM (%) | SAU | Gendarmerie | 2.46 −0.16–5.09 | −1.00 −3.11–1.12 | 0.63 −1.62–2.89 |
| Firefighters | 2.67 * 0.20–5.14 | −2.23 −4.69–0.23 | −0.11 −3.09–2.86 | ||
| General police | 3.90 * 1.41–6.40 | −0.50 −2.75–1.76 | 1.97 −2.02–5.96 | ||
| Gendarmerie | Firefighters | 0.21 −1.35–1.77 | −1.24 −3.86–1.38 | −0.75 −3.95–2.46 | |
| General police | 1.44 −0.17–3.05 | 0.50 −1.93–2.92 | 1.34 −2.82–5.50 | ||
| Firefighters | General police | 1.23 −0.10–2.56 | 1.74 −1.00–4.47 | 2.09 −2.51–6.68 | |
| IH (Index unit) | SAU | Gendarmerie | −0.09 −0.21–0.03 | 0.08 −0.02–0.17 | −0.04 −0.14–0.07 |
| Firefighters | −0.09 −0.20–0.02 | 0.11 * 0.00–0.22 | 0.01 −0.13–0.14 | ||
| General police | −0.15 * −0.27–0.04 | −0.01 −0.11–0.09 | −0.08 −0.26–0.010 | ||
| Gendarmerie | Firefighters | 0.00 −0.07–0.07 | 0.04 −0.08–0.15 | 0.04 −0.10–0.19 | |
| General police | −0.07 −0.14–0.01 | −0.08 −0.19–0.03 | −0.04 −0.23–0.15 | ||
| Firefighters | General police | −0.06 * −0.12–0.00 | −0.12 −0.24–0.00 | −0.08 −0.29–0.12 | |
© 2020 by the authors. Licensee MDPI, Basel, Switzerland. This article is an open access article distributed under the terms and conditions of the Creative Commons Attribution (CC BY) license (http://creativecommons.org/licenses/by/4.0/).
Share and Cite
Kukić, F.; Heinrich, K.M.; Koropanovski, N.; Poston, W.S.C.; Čvorović, A.; Dawes, J.J.; Orr, R.; Dopsaj, M. Differences in Body Composition across Police Occupations and Moderation Effects of Leisure Time Physical Activity. Int. J. Environ. Res. Public Health 2020, 17, 6825. https://doi.org/10.3390/ijerph17186825
Kukić F, Heinrich KM, Koropanovski N, Poston WSC, Čvorović A, Dawes JJ, Orr R, Dopsaj M. Differences in Body Composition across Police Occupations and Moderation Effects of Leisure Time Physical Activity. International Journal of Environmental Research and Public Health. 2020; 17(18):6825. https://doi.org/10.3390/ijerph17186825
Chicago/Turabian StyleKukić, Filip, Katie M. Heinrich, Nenad Koropanovski, Walker S. C. Poston, Aleksandar Čvorović, J. Jay Dawes, Robin Orr, and Milivoj Dopsaj. 2020. "Differences in Body Composition across Police Occupations and Moderation Effects of Leisure Time Physical Activity" International Journal of Environmental Research and Public Health 17, no. 18: 6825. https://doi.org/10.3390/ijerph17186825
APA StyleKukić, F., Heinrich, K. M., Koropanovski, N., Poston, W. S. C., Čvorović, A., Dawes, J. J., Orr, R., & Dopsaj, M. (2020). Differences in Body Composition across Police Occupations and Moderation Effects of Leisure Time Physical Activity. International Journal of Environmental Research and Public Health, 17(18), 6825. https://doi.org/10.3390/ijerph17186825