Abstract
Hawai’i Island often receives extreme (UV Index ≥ 11) solar ultraviolet radiation (UVR). While the UV Index (UVI) has been measured since 1997 at Hawai’i’s high-altitude Mauna Loa Observatory (MLO), measurements where people live and recreate are rare. We measured UVI on the face of a rotating mannequin head with UVR sensors at its eyes, ears and cheeks while simultaneously measuring the UVI with a zenith-facing sensor at MLO and seven sites at or near sea level from 19 July to 14 August 2018. The mannequin sensors received higher UVR at midmorning and midafternoon than at noon. For example, at sea level the peak UVI at the left cheek was 5.2 at midmorning and 2.9 at noon, while the horizontal UVI at noon was 12.7. Our measurements were supplemented with wide-angle (190° and 360°) sky photographs and UV images of the mannequin head. Because the UVI applies to horizontal surfaces, people in tropical and temperate latitudes should be informed that their face may be more vulnerable to UVR at midmorning and midafternoon than at noon. Finally, our instruments provided opportunities to measure unexpected UVR-altering events, including rare biomass smoke over MLO and spectroscopic measurements of substantial UVR-absorbing sulfur dioxide in the eruption plume of the Kilauea volcano.
Keywords:
Hawai’i; Mauna Loa Observatory; Kilauea; ultraviolet; UV Index; ozone; sulfur dioxide; smoke 1. Introduction
Solar ultraviolet radiation (UVR) has been measured by a suite of well-maintained instruments at Hawai’i Island’s high-altitude (3400 m) Mauna Loa Observatory (MLO) for over 20 years [1]. While people in Hawai’i are potentially exposed to extreme levels of UVR, we have found only one formal report giving UVR measurements where people live, work and play near sea level [2]. This report describes a 13-month field study on Hawai’i Island between December 1994 and January 1996, during which UVR was measured from near sea level at Hilo and along traverses to and from the summit of Mauna Kea (4205 m) and MLO (3400 m) on the north slope of Mauna Loa. This study used Robertson–Berger UVR radiometers (Model 501 A) [3] that measure the band of UVR wavelengths (280–400 nm) responsible for the reddening of human skin (erythema) and skin cancer. A key finding was that under a clear sky the full-sky UVR from sea level to 4205 m increased by 25 % for a solar zenith angle (SZA) of 10°.
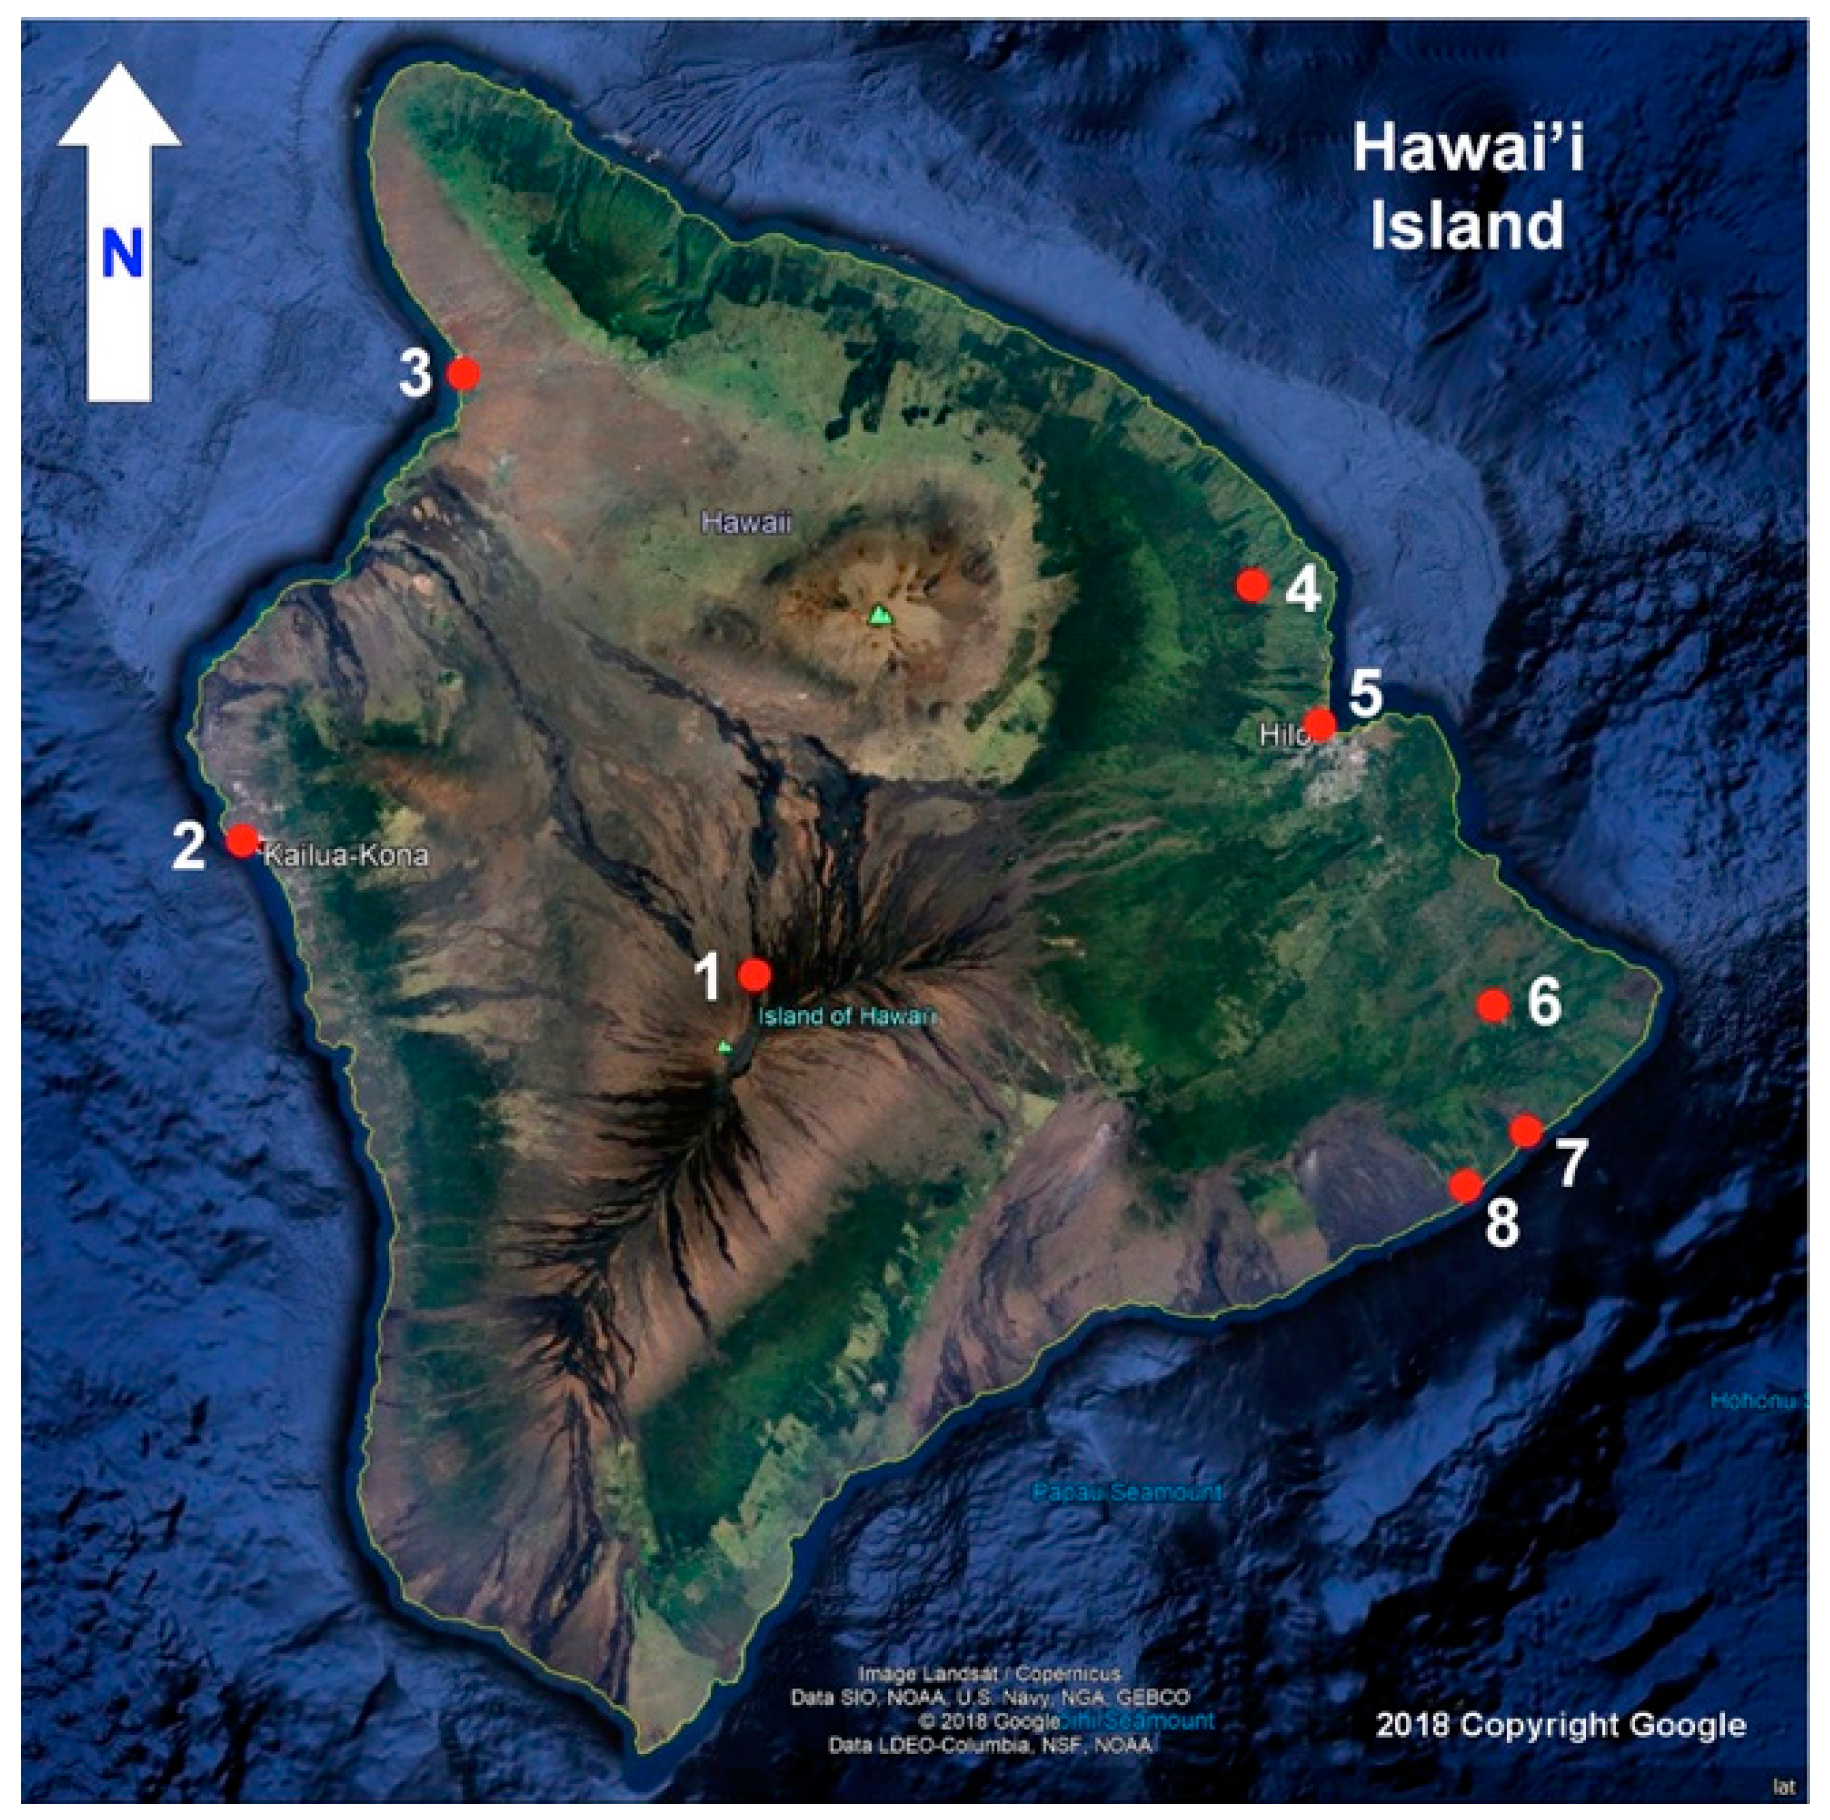
Our principle objective was to further this research theme by measuring the intensity of the UVI on a simulated, upright human face on Hawai’i Island at various times, places and elevations under a wide variety of sky conditions. These range from the pristine sky over MLO to skies that alter the UVI with clouds, smoke from dry season fires and vog, a haze of volcanic origin composed of gaseous SO2 and sulfuric acid aerosols. This objective was achieved through a field survey of erythemal UVR across Hawai’i Island from 19 July to 14 August 2018 at MLO and seven sites at or near sea level indicated in Figure 1.
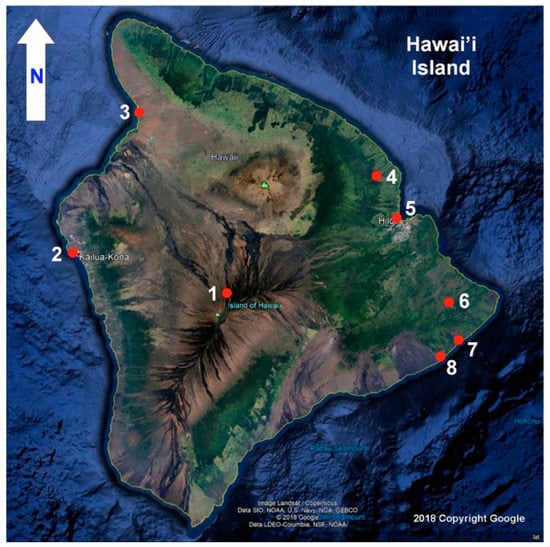
Figure 1.
Principal ultraviolet radiation (UVR) study sites are indicated by numbered red dots on this satellite image of Hawai’i Island (unannotated image copyright by Google 2018). 1. Mauna Loa Observatory. 2. Old Kona Airport Park. 3. Spencer Beach. 4. Akaka Falls. 5. Hilo waterfront. 6. Pāhoa. 7. Seaview Estates Park. 8. Kalapana.
Hawai’i Island was ideal for this field study because of its tropical location, the accessibility of measurement sites, the wide variety of sky conditions and the calibration opportunity provided by the suite of well-maintained UVR instruments at MLO. Our schedule specifically included the Lahaina noon on 24 July, one of two days on the Hawai’ian calendar when the sun is very near or at the zenith at solar noon when vertical posts and poles cast no shadows. This provided the opportunity to measure the UVI when the sun transited at or within a few degrees of the zenith at solar noon during its path from horizon to horizon. This very wide variety of observing conditions provides insights into UV irradiance conditions across the tropics and possibly the subtropics.
Our field study employed several very different approaches to measuring the UVI. One followed the traditional method for collecting full-sky UVR irradiance by using an instrument with a zenith-facing sensor equipped with a diffuser that provides a near-cosine response to global UVR irradiance. The second approach was to measure the UVI with sensors at the eyes, ears and cheeks of a rotating plastic mannequin head that simulated the vertical head of a standing, walking or seated person outdoors under a variety of sky conditions. Both these methods were employed simultaneously, and they were accompanied by wide-angle (190° and 360°) photographs of the sky and surrounding landscape using relatively inexpensive digital cameras as well as low cost smartphone sensor-based UV imagery to provide intuitive, color-coded visualizations of the UVR intensity across the mannequin head.
Considerable attention was given to the calibration of the UVR sensors, the measurements of which were given in terms of the widely used UVI. The rotating mannequin head apparatus and calibrated UVI sensor were relatively inexpensive (<$1500 US), easily duplicated by investigators with basic engineering skills, and sufficiently portable to be easily transported around the island. Overall, this study provides insights into the exposure to the human face of UVR under varying geographical and atmospheric conditions with relevance not only for Hawai’i Island, but also for a variety of tropical, subtropical, and high-altitude environments that are subjected to intense solar UVR.
The protocols for our study were sufficiently flexible to accommodate cloudy days and unexpected research opportunities, two of which occurred. One was the historic eruption of Kilauea Volcano [4], which was the world’s largest single source of UVR-absorbing SO2 during the first two weeks of our study. We used two UV cameras to reveal SO2 in photographs of the plume, and we measured the SO2 in the plume by means of a novel UV spectrometer. We also measured significant errors in total ozone measurements by a portable instrument when sunlight was passing through UVR-absorbing volcanic SO2. A second opportunity was the rare passage of dense forest fire smoke over MLO that permitted detailed measurements by our instruments and those at MLO of the attenuation of UVR by biomass smoke. These events are described in what follows with the intention that they will prepare others for serendipitous UVR measurement opportunities.
1.1. Health Effects of UVR
The UVB wavelengths (280–315 nm) stimulate synthesis of vitamin D, while both the UVB and UVA wavelengths (315–400 nm) are responsible for erythema. The intensity of these wavelengths in sunlight is influenced by scattering and absorption during their passage through the atmosphere [5]. When the sun is high in a clear sky, around half the UVR arrives from the direct sun and half is diffusely scattered by the sky. When the sun is low in the sky, diffuse UVR dominates. Natural and anthropogenic air pollution can dramatically alter this ratio and significantly reduce UVR. While UVR is absorbed by clouds, UVR scattered by cumulus clouds near the sun in an unpolluted sky can briefly increase the UVR by more than 10% [6].
More serious than UVR-initiated erythema are cutaneous malignant melanoma (CMM) and nonmelanoma skin cancers (basal cell carcinoma (BCC) and squamous cell carcinoma SCC)). The incidence of these skin cancers has latitudinal variations that depend on several factors, with the most important being UVA and UVB intensities, skin pigmentation, and sun exposure habits [7]. UVA comprises about 95% of solar UV reaching earth’s surface, with UVB comprising about 3–5% during midday in midlatitudes. UVA penetrates deeper in the skin due to the longer wavelengths, thereby being more likely to reach the bottom layer of the skin’s epidermis where melanocytes reside. Melanocytes can develop into melanomas.
Ironically, UVR also has significant health benefits. Besides suppressing pathogenic microorganisms in the outdoor environment, the UVB wavelengths stimulate the production of vitamin D in mammals and reptiles. This hormone is essential for the proper growth of bones, and insufficient UVR exposure and vitamin D in the diet can lead to the development of rickets. There is strong evidence that human skin pigmentation is a compromise between the need for protection against the adverse effects of UVR exposure and the need to produce vitamin D [8]. Moreover, geographical ecological studies have found that incidence and mortality rates for many types of cancer are lower in regions of countries with higher solar UVB doses [9]. However, since diet strongly affects risk of cancer [10], it is difficult to show that UVB does affect cancer risk when comparing rates in different countries.
Nevertheless, the damaging influence on the skin, eye, and the immune system by overexposure to UVR is widely accepted, with four out of five skin cancers being preventable [11]. This requires research as described in this paper to contribute to an improved understanding of the UVR environment to which humans are exposed.
1.2. The Ultraviolet Index (UVI)
In 1992, Environment Canada proposed the UV Index (UVI), a method for expressing the UVR on a horizontal surface on a scale of 0 to 10, a parameter easily understood by the public [12,13]. Because the UVI often exceeds 10 in tropical and subtropical regions, the World Health Organization [14] and World Meteorological Organization [15] removed the upper limit of 10. The UVI is now used by more than 100 countries and is widely published in the print and online media.
The UVI forecast for a day in advance is the integral of the solar UV spectral irradiance expected from ground-based UVR measurements, ground or satellite ozone measurements and cloud forecasts multiplied by the erythemal action spectrum [16,17] divided by 25 mW/m−2 [12,16]. This gives a nondimensional, intuitive figure of merit that is proportional to the incident UVR and much more easily understood than irradiance expressed in power per unit area.
He et al. [18] compared UVI forecasts across Canada with UVR measured by 10 Brewer spectrophotometers and found reasonable agreement, as did Cadet et al. [19] in a 10-year comparison of UVI forecasts and broadband instruments at six South African sites. Thus, while UVI forecasts are not perfect, they are considered sufficiently reliable to provide a useful guide for the public.
However, concerns have been raised about guidelines based on the UV Index. Some believe the guidelines are too strict. For example: “The important take home message for dermatologists and other clinicians is, that health campaigns promoting strict sun protection procedures to prevent skin cancer may increase the severe health risk of vitamin D-deficiency.” [20]. Others believe the guidelines aren’t sufficiently strict. For example: “Currently, health agencies recommend that no sun-protection is required when the UVI (UVI) is less than 3. We use high-quality data from spectroradiometers and model calculations to demonstrate that this simplification is seriously flawed, particularly for mid-latitude conditions.” [21]. Concerns like these led to a review of the UVI, which concluded, in part: “A number of new scientific publications have emerged since 2013 that provide indications of progress on relevant research questions, but the human evidence remains too limited to justify a modification of the WHO Global Solar UV Index and its guidance.” [22].
A well-known issue that influenced our field study and has yet to be fully addressed by the leading public health agencies is the application of the zenith-facing, horizontal standard represented by the UVI to the complex geometry of the uncovered human anatomy, the surface of which is not necessarily normal with respect to UVR arriving from the direct sun and the sky. This has been well-documented in studies that employ thin film UV sensors made from polysulfone (PS). These sensors darken over time when exposed to UVR, and this allows them to function as UVR dosimeters [23].
Attaching PS dosimeters to mannequins rather than living subjects permits UVR exposures to be measured under repeatable conditions. Downs et al. [24] and Parisi et al. [25] have applied this method by attaching PS dosimeters to various points on mannequin heads that simulate the human head and face. In the most detailed such study to date, Downs and Parisi [26] attached 1285 miniaturized PS dosimeters to a mannequin head that was exposed to sunlight over a wide range of SZAs. The dosimeter exposures were then transformed into an empirical model that provides UVR exposure maps that can be compared with the frequency and incidence of facial skin cancers.
Wang et al. [27] replaced traditional PS dosimeters with a spectrometer coupled by an optical fiber to nonhorizontal points on a rotating mannequin head. This approach has provided significant data on the exposure of a simulated human face to outdoor UVR under a variety of conditions. Of special significance is their finding that UVR on the upright mannequin face at their location (Dou Men, Zhejiang, China, 30.09° N, 120.60° E) does not peak at solar noon, when the UVI is highest on clear days. Instead, it peaks from 9:00 to 11:00 and from 13:00to 15:00 local time. Among our goals during the Hawai’i study was to replicate these findings under a variety of sun and sky conditions using simpler, less costly sensors that measure and store the UVI at 1-s intervals.
2. Instrumentation
Our principle instruments were a calibrated PMA1102 UVR Analog Erythema Sensor (Solar Light) to measure the horizontal UVI and a rotating mannequin head fitted with UVR sensors at its eyes, ears, cheeks and forehead. The PMA1102 sensor was inserted into a section of white PVC tube to reduce solar-induced warming. It was then placed on a platform together with its power supply (two 9-volt batteries) and a 16-bit analog data logger (Onset Hobo 4-channel analog logger) that stored voltages that represented the UVI measured by the sensor and its internal temperature. The sensor’s output voltage was converted to the UVI using the manufacturer’s algorithm, which includes a correction for the sensor’s temperature coefficient (1%/°C).
Figure 2 shows the mannequin head apparatus in operation. The heads sensors are unfiltered AlGaN photodiodes and integrated amplifier installed in a compact TO-5 enclosure (GenUV GUVB-T21GH; E-mail: uvsensor@geni-uv.com). Three-conductor phone plugs compatible with the data logger input jacks were connected to the three leads of each sensor with flexible 30 AWG wire. The sensors were then inserted into cylindrical plastic tubes fitted with 0.4-mm polytetrafluoroethylene (Teflon™) diffusers [28]. The assembled UVR sensors were inserted into the mannequin head, and their wire leads were secured to the head using fiber tape. The sensor plugs were then inserted into the input jacks of two 16-bit loggers securely strapped to the mannequin head’s neck with VELCRO® Brand hook-and-loop fastening tape. The voltage from these sensors was corrected for the temperature coefficient given by the manufacturer (0.1%/°C) during postprocessing.
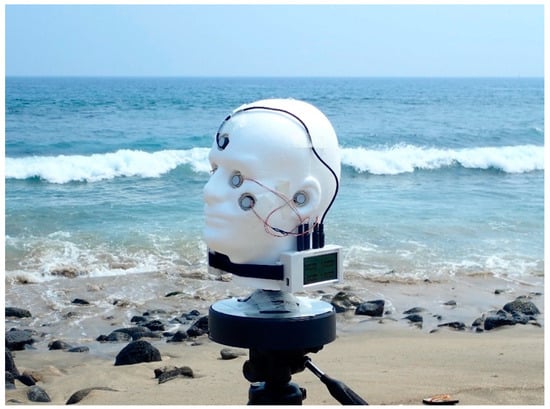
Figure 2.
Mannequin head fitted with UVR sensors at ears, eyes, cheeks, and forehead mounted on a battery-powered turntable while collecting data at the Old Kona Airport Park beach (23 July 2018). Two 16-bit data loggers are attached to the head’s neck with VELCRO®. Note the nearby surf, which scattered some low level UVR toward sensors facing the ocean.
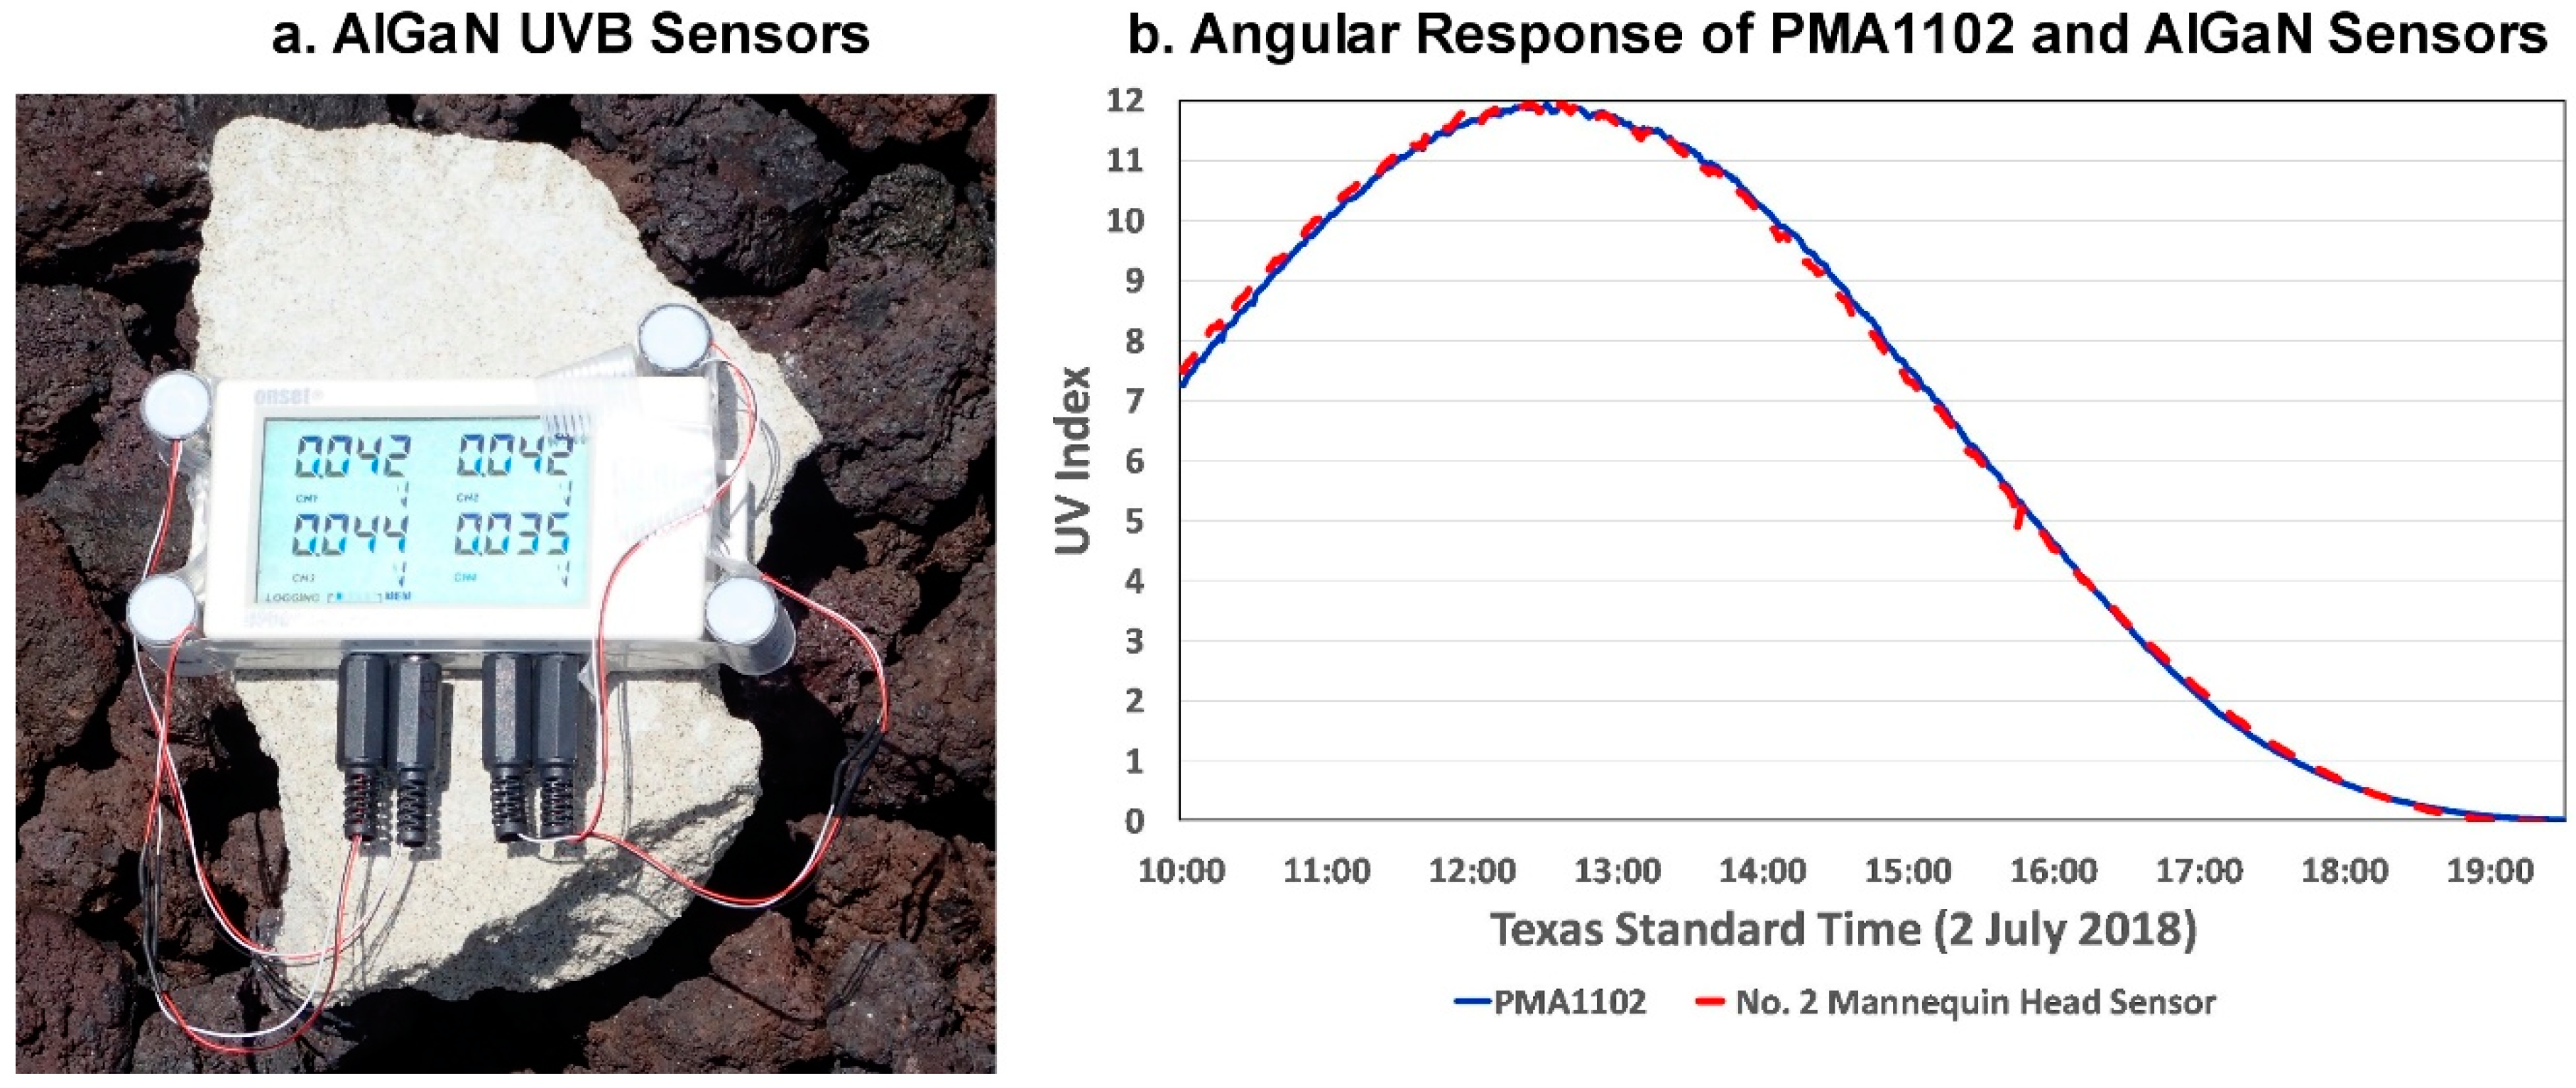
Figure 3a shows four of the UVR sensors temporarily mounted on a 16-bit data logger for a calibration check at MLO. The manufacturer’s spectral response of these sensors approximates that of the PMA1102 sensor, and the UVI measured by the PMA1102 and one of the AlGaN sensors over most of a day depicted in Figure 3b at Geronimo Creek Observatory, Texas (29.6° N 97.9° W), on 2 July 2018 is virtually identical, with the average UVI measured by the AlGaN sensor being only 0.00006 UVI higher than that measured by the PMA1102 (correlation coefficient (r2) = 0.999). Figure 3b affirms that the AlGaN photodiodes with Teflon™ diffusers have a cosine response that essentially matches that of the PMA1102, which the manufacturer specifies is within 5% of the ideal cosine response for angles <60°, increasing to 15% at 80°.
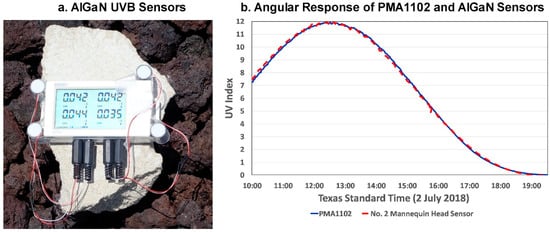
Figure 3.
(a) Four AlGaN UVB sensors with Teflon™ diffusers temporarily removed from the instrumented mannequin head for a calibration check at the high-altitude (3390 3401 m MSL) Mauna Loa Observatory, and (b) Angular response of the PMA1102 UVR sensor and an AlGaN sensor in (a).
A comparison of the UVI measured by the PMA1102 and 4 of the AlGaN sensors at MLO (Figure 3a) the first day of our campaign (19 July) yielded high correlation coefficients (r2 > 0.95). These calibrations coupled with the similarity of spectral response and the very close agreement with angular response provided assurance that the UVR measured by the mannequin head sensors could be reliably compared with that measured by the laboratory calibrated PMA1102 that served as the UVI indicator during the mannequin head tests. Challenges to this assumption are given in detail in Section 4.2 of the Results and Discussion.
3. Methodology
The PMA1102 UVI sensor and the sensor-equipped mannequin head were deployed at seven sites during the field study (Figure 1). Four sites were at or near sea level (Hilo, Old Kona Airport Park, Spencer Beach Park, Kalapana, and Kalapana Seaview Estates Park). Sites well above sea level were Pahōa, Akaka Falls, and MLO. Table 1 lists these sites along with their coordinates, elevations, and site suitability ratings. Two locations are given for the MLO site. The instrumented mannequin head and the PMA1102 UVI apparatus were placed in an open area at the north edge of the emergency helicopter site 136 m from the MLO Solar Deck since there was no unobstructed free space on the solar deck that hosts the station’s UVR and ozone instruments.

Table 1.
Principal UV Index (UVI) measuring sites for Hawai’i Island UVR study in order of their suitability.
None of the sites in Table 1 provide a totally unobstructed view of the sky. This includes MLO, which is on the north slope of Mauna Loa (3401 m) and not the summit (4169 m). Nevertheless, our 190° (2.17π sr) photographs of the sky indicate that those sites designated as Ideal or Good in Table 1 have a reasonably unobstructed view of the full sky. Clouds and weather significantly affected most of the sites. For example, while we rated the Hilo Concrete Pier off Banyan Drive as an ideal sea level site, our measurement session there was stopped by rain. Measurements at the Akaka Falls observation site ended when thick clouds arrived from the east near solar noon. Tourists from around the world were at this site, many of whom asked questions about the instrumented mannequin head and Hawai’i’s high UVI.
The night before each deployment, the three 16-bit data loggers connected to the global PMA1102 UVR sensor and the mannequin head sensors were programmed to collect data at 1-s intervals beginning at the same time the following morning. At each site, the PMA1102 platform was mounted atop a tripod and made level to within 0.2° with a bubble level. A motorized turntable powered by two 1.5-volt C cells (Master Tools 7-inch TurnTable) was mounted atop a second tripod and also made level. The mannequin head was then placed over a plastic pedestal attached atop the turntable. The turntable switch was then closed, and the mannequin commenced rotating once every 36 s or 100 times per hour. The instruments used during the field deployments and those that served as calibration standards at MLO are listed in Table 2.
Table 2.
Instruments used in the UVI survey and those that served as calibration standards at Mauna Loa Observatory (MLO).
During the daily measurement sessions, many photographs were made of the mannequin head and the sky. The data loggers and the cameras were downloaded into a laptop computer the evening of each measurement day, and their data was backed up to an external flash drive for safekeeping. During several days when the mannequin head was not deployed, the PMA1102 UVR sensor was mounted atop the field trip vehicle with sturdy but removable Gorilla tape.
4. Results and Discussion
During this 28-day study, the sun was nearly at the zenith at solar noon. While the UVR measured at and near sea level was significantly modulated by clouds and vog during many days, sky conditions allowed mannequin head deployments during some or all of 14 days. Some measurement days at MLO were made through an exceptionally clear sky in which UVR was modulated only by the ozone layer and Rayleigh scattering. During other days at MLO, clouds, vog, and a rare smoke event significantly altered the UVR. At or near sea level only a few days were free of clouds for most of a day. The results that follow reflect these very different sky conditions at the best sites where we made measurements.
4.1. Mannequin Head Results
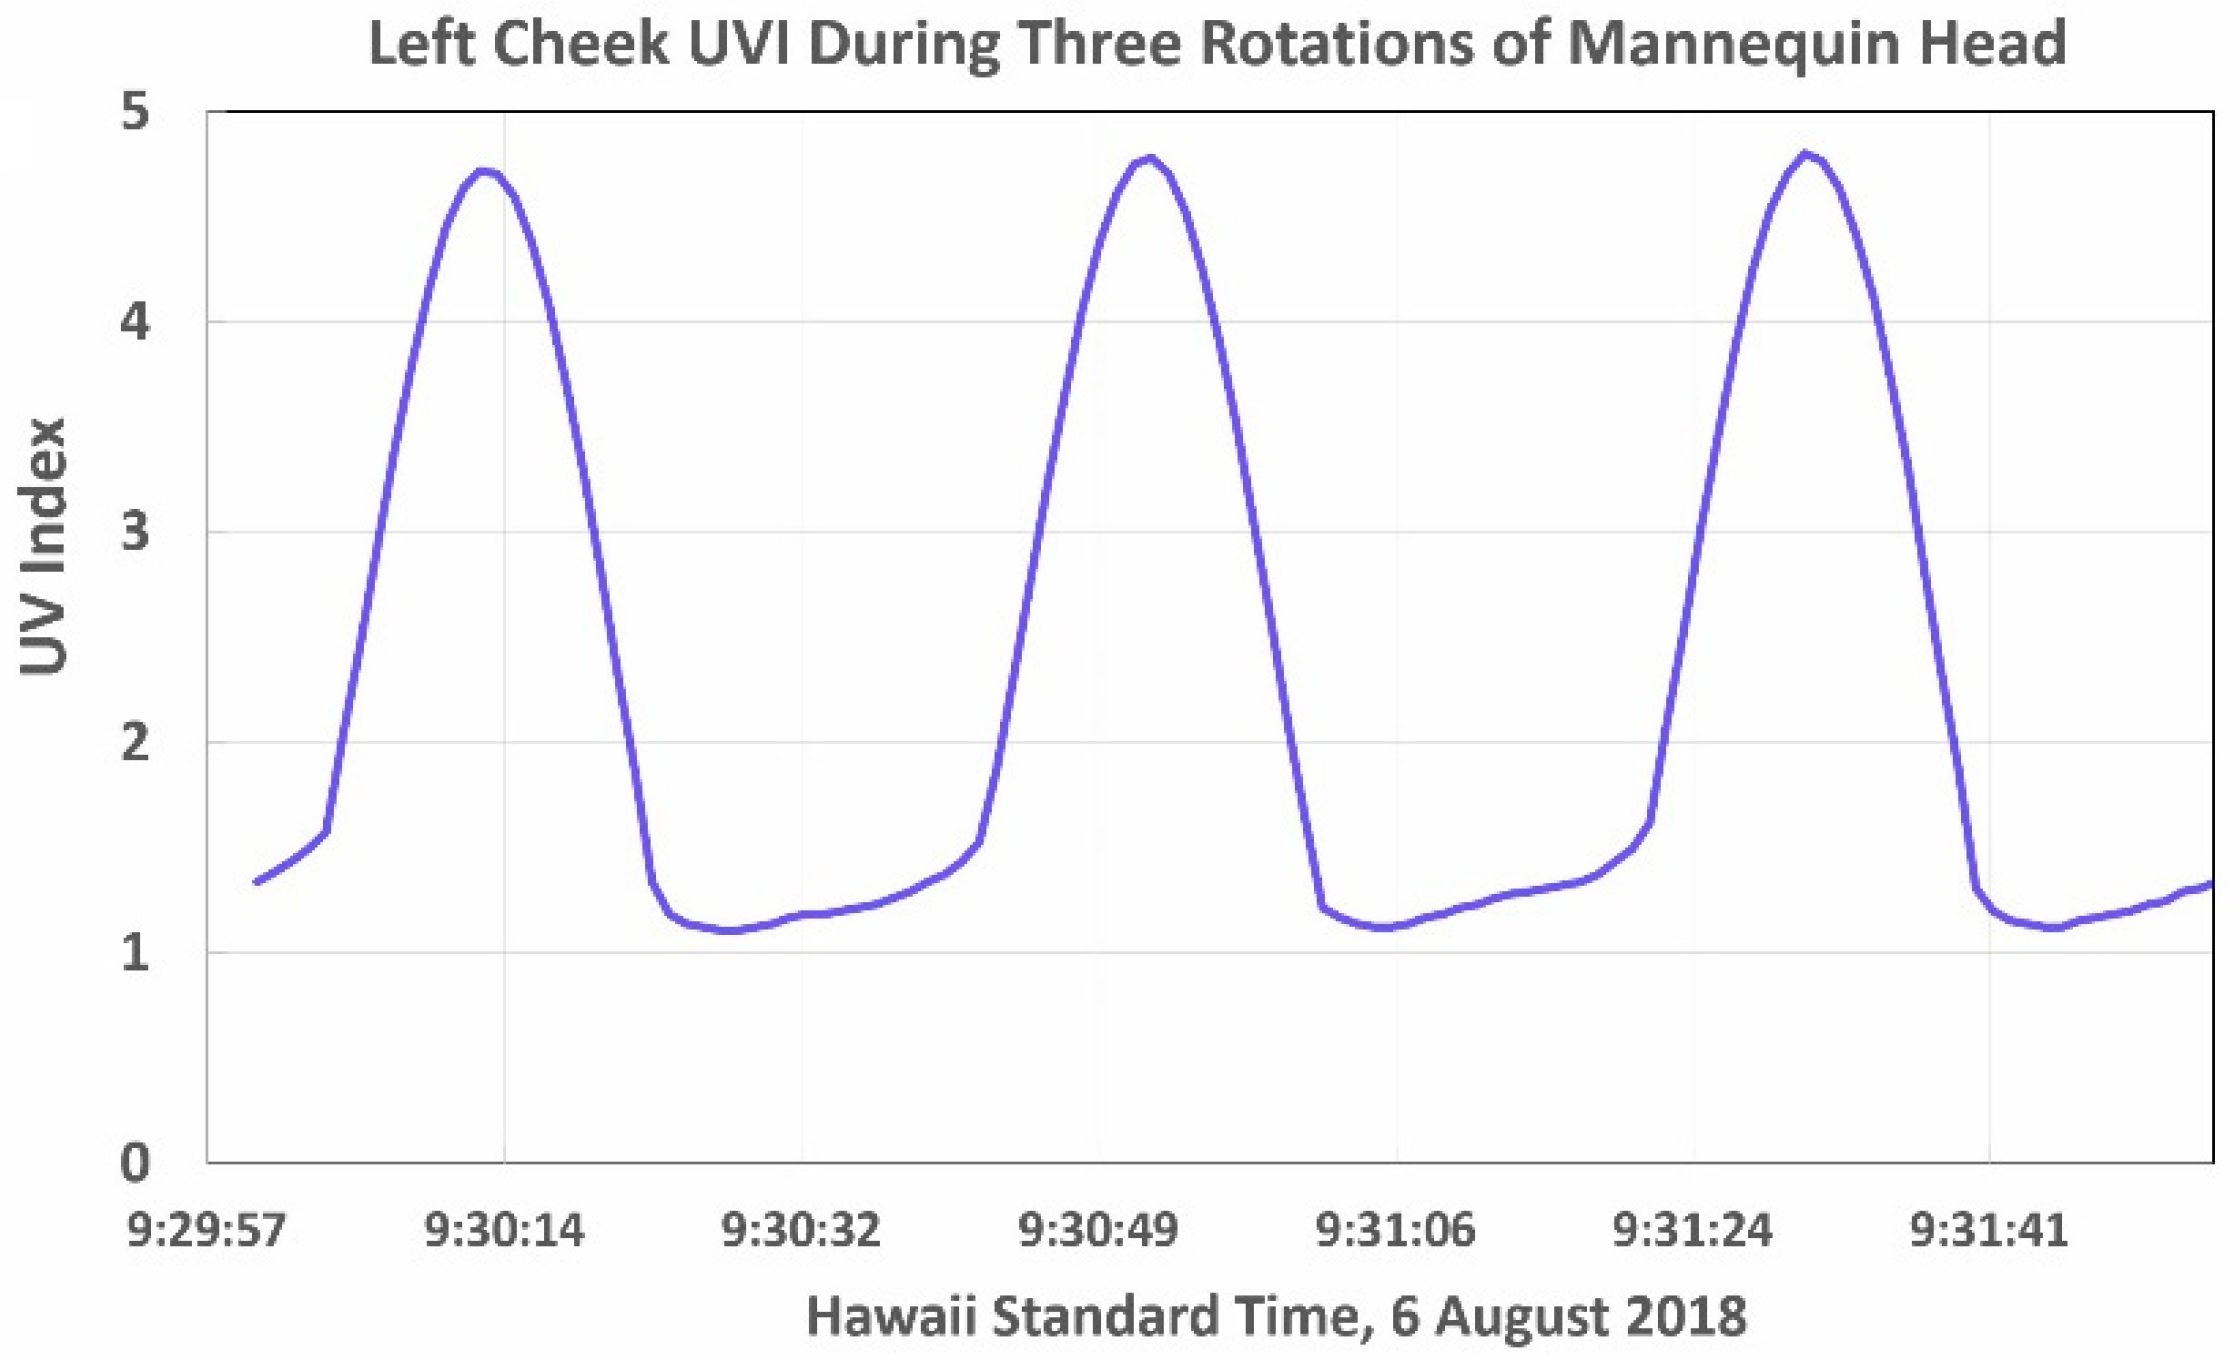
When all seven head sensors were in use, the head’s two data loggers collected 420 samples each minute and 252,000 samples per 10-h day. Figure 4 shows the ozone-corrected UVI measured by the left cheek sensor during three midmorning rotations of the head. The peaks in the data occurred when the cheek was pointed toward the sun. The minima occurred when the cheek was pointed opposite the sun. While the minima have a much lower UVI than the peaks, these data provide important information about diffuse UVR scattered from the sky and the surface.

Figure 4.
UVI measured by the mannequin head’s left cheek sensor during three revolutions at midmorning on 22 July 2018 at the Old Kona Airport park. Note the dramatic increase in the UVI as the cheek faces the sun’s direction.
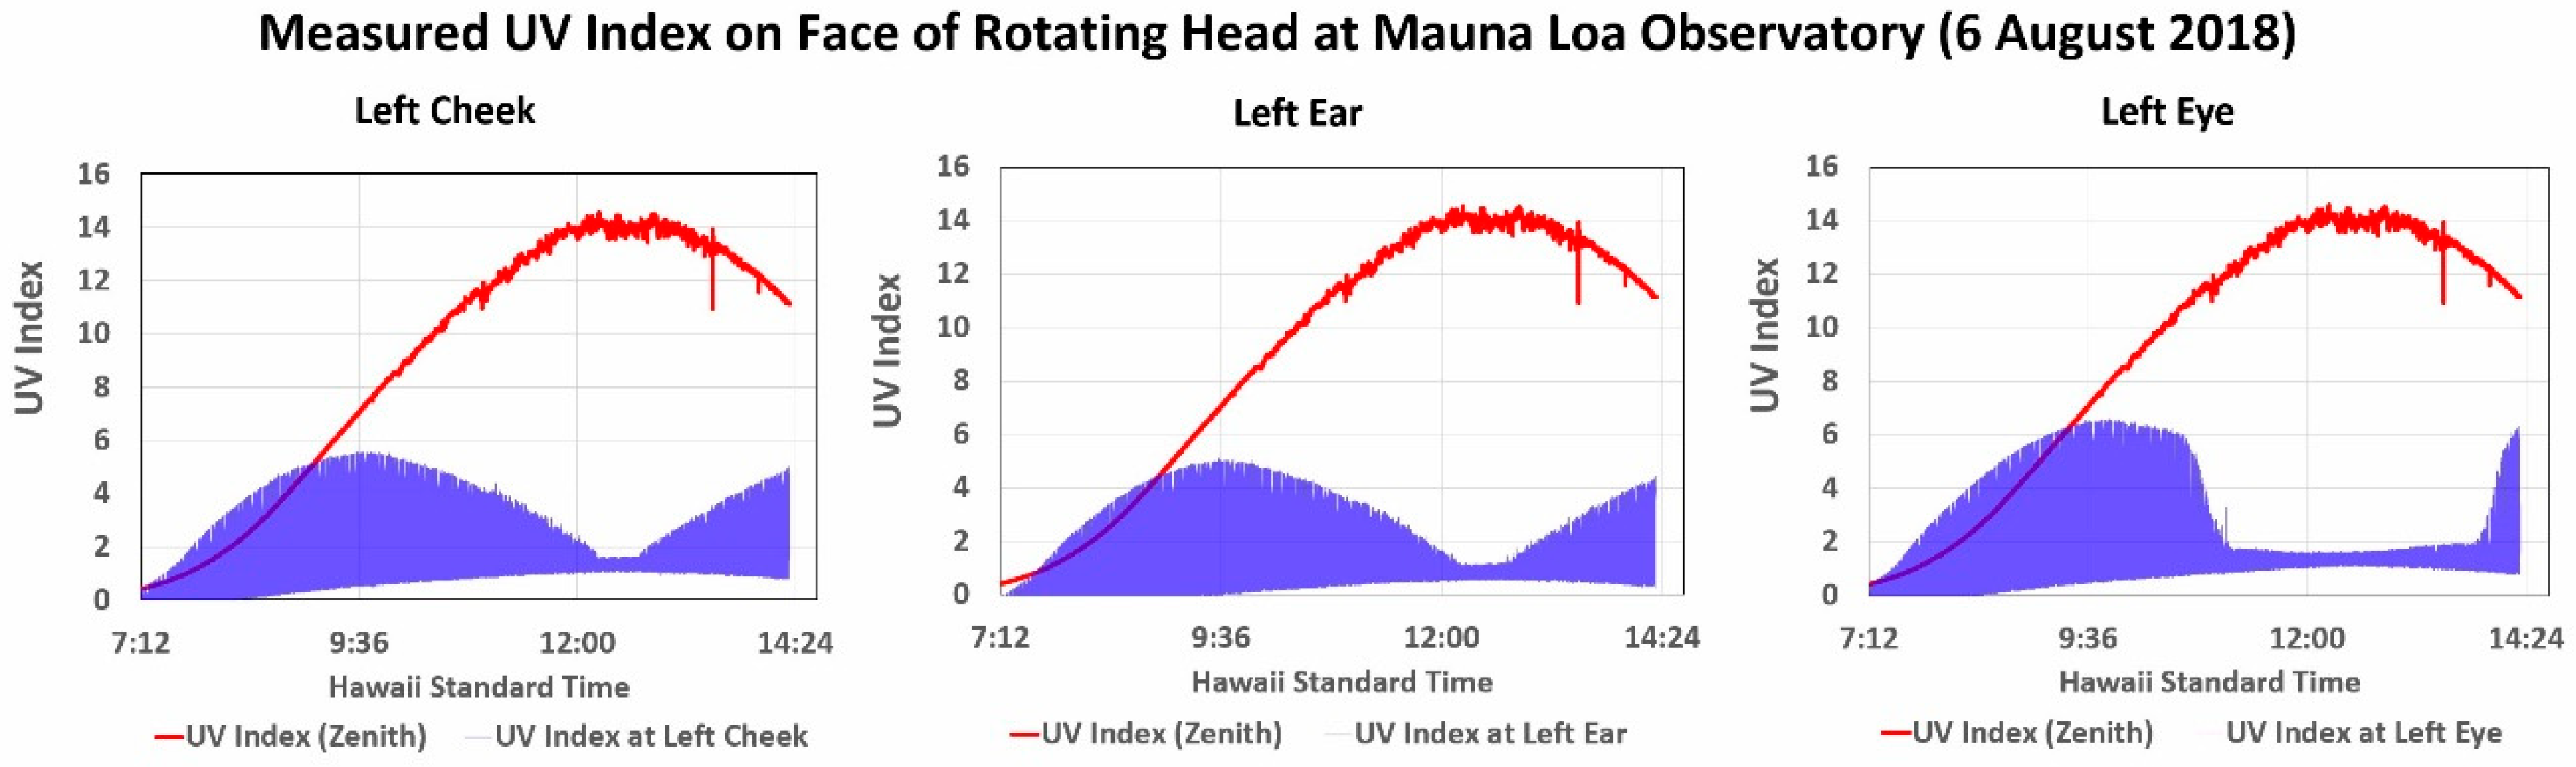
Figure 5 shows the variation in the ozone-corrected UVI received each second and plotted in blue for the left cheek, left ear and left eye during ~800 hundred 36-s rotations of the mannequin head at MLO on 6 August 2018. The forehead sensor was not often used, for this location is often covered by hair or shaded by a hat. The global UVR measured by the PMA1102 (red) is superimposed over the mannequin head data in Figure 5, which makes the very significant reduction in the UVI at solar noon especially obvious. At least as significant is that (1) the horizontal UVI is much higher than that measured by each of the three sensors during most of the time data was collected, and (2) the UVI measured by all three sensors is much higher at midmorning than at solar noon. As in Figure 4, the upper extreme of the ~25,000 samples plotted for each sensor in Figure 5 represents when the sensor was pointed in the direction of the sun, while the lower extreme represents when the sensor was pointed opposite the sun’s position.
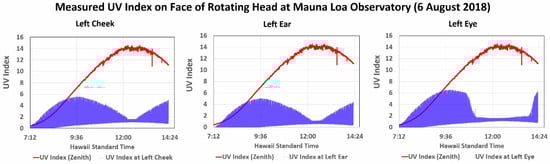
Figure 5.
Variation in UVR measured across the face of the rotating mannequin head during a deployment at the Mauna Loa Observatory.
Table 3 tabulates what is visually obvious in Figure 5. Note that the noon minimum UVI represents the UVR received from the sky and the lava surface, with each filling half the sensor’s FOV when the sensor was pointed opposite the direction of the sun. We address the potential significance of this scattered UVR and the cosine error of the sky in Section 4.2.2.
Table 3.
Maximum and minimum mannequin head sensor UVI values plotted in Figure 5.
The UVR sensitive surfaces of the head sensors are perpendicular to the surface and pointed at the horizon, and this explains the sharp drop in the UVI at noon when the sun is almost directly overhead. While the cheek and ear sensor data form similar patterns, the eye sensor was partially shaded by the brow, and this resulted in the prolonged reduction before and after noon shown in Figure 5. Conversely, the eye sensor measured the highest UVI, and we attribute this to scattering of UVR toward the sensor by the brow. Note that the diffuse UVR scattered by the lava and sky opposite the direction of the sun was too low to be detected during the first hour or so during this measurement session.
Figure 6 shows the global UVI measured by the zenith looking PMA1102 and the mannequin head’s left cheek UVI sensor for the most cloud-free days at four of the measurement sites. The mannequin head’s left cheek was selected for comparison with the UVR measured by the PMA1102, since the cheek sensors were subject to less shading from the mannequin head’s facial features than the ear and eye sensors, which were slightly shaded by, respectively, the brows and the ear lobes.
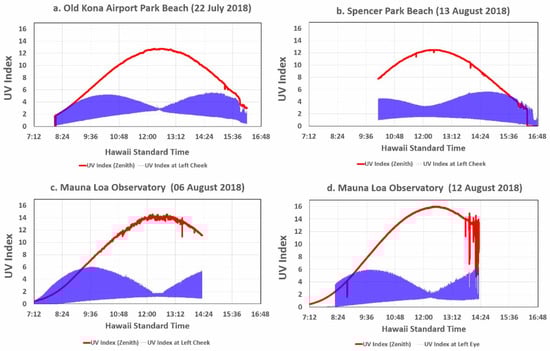
Figure 6.
The UVI measured by the PMA1102 global UVR sensor and the mannequin head left cheek UVI sensor during the most cloud-free days at three of the observation sites.
The UVI data plotted in Figure 6 clearly show significant differences among the three sites. Table 4 summarizes the most pertinent data for the voggy Kona site in (a) and the clear MLO site in (c). The noon peak and minimum UVI is higher for Kona than MLO, which is to be expected in view of scattering of UVR from the hazy sky over Kona caused by a thick layer of vog as opposed to the very clear sky at MLO.
Table 4.
Maximum and minimum mannequin head sensor UVI values plotted in Figure 6a,c.
Note that the data plotted in Figure 6 have a much tighter waist at solar noon on 22 July and 6 August than on 12 and 13 August. This suggests that the cheek sensor was perpendicular to the surrounding surface at solar noon, while the wide waist data suggests that the sensor was looking slightly upward. This was confirmed for the 12 August session by photographs of the mannequin head, which revealed that the head was tilted upward ~10° toward the west during the morning. While the turntable was always made level before the mannequin head was placed atop it, its angle likely shifted when the mannequin head was pushed down over its holder more tightly than usual due to windy conditions.
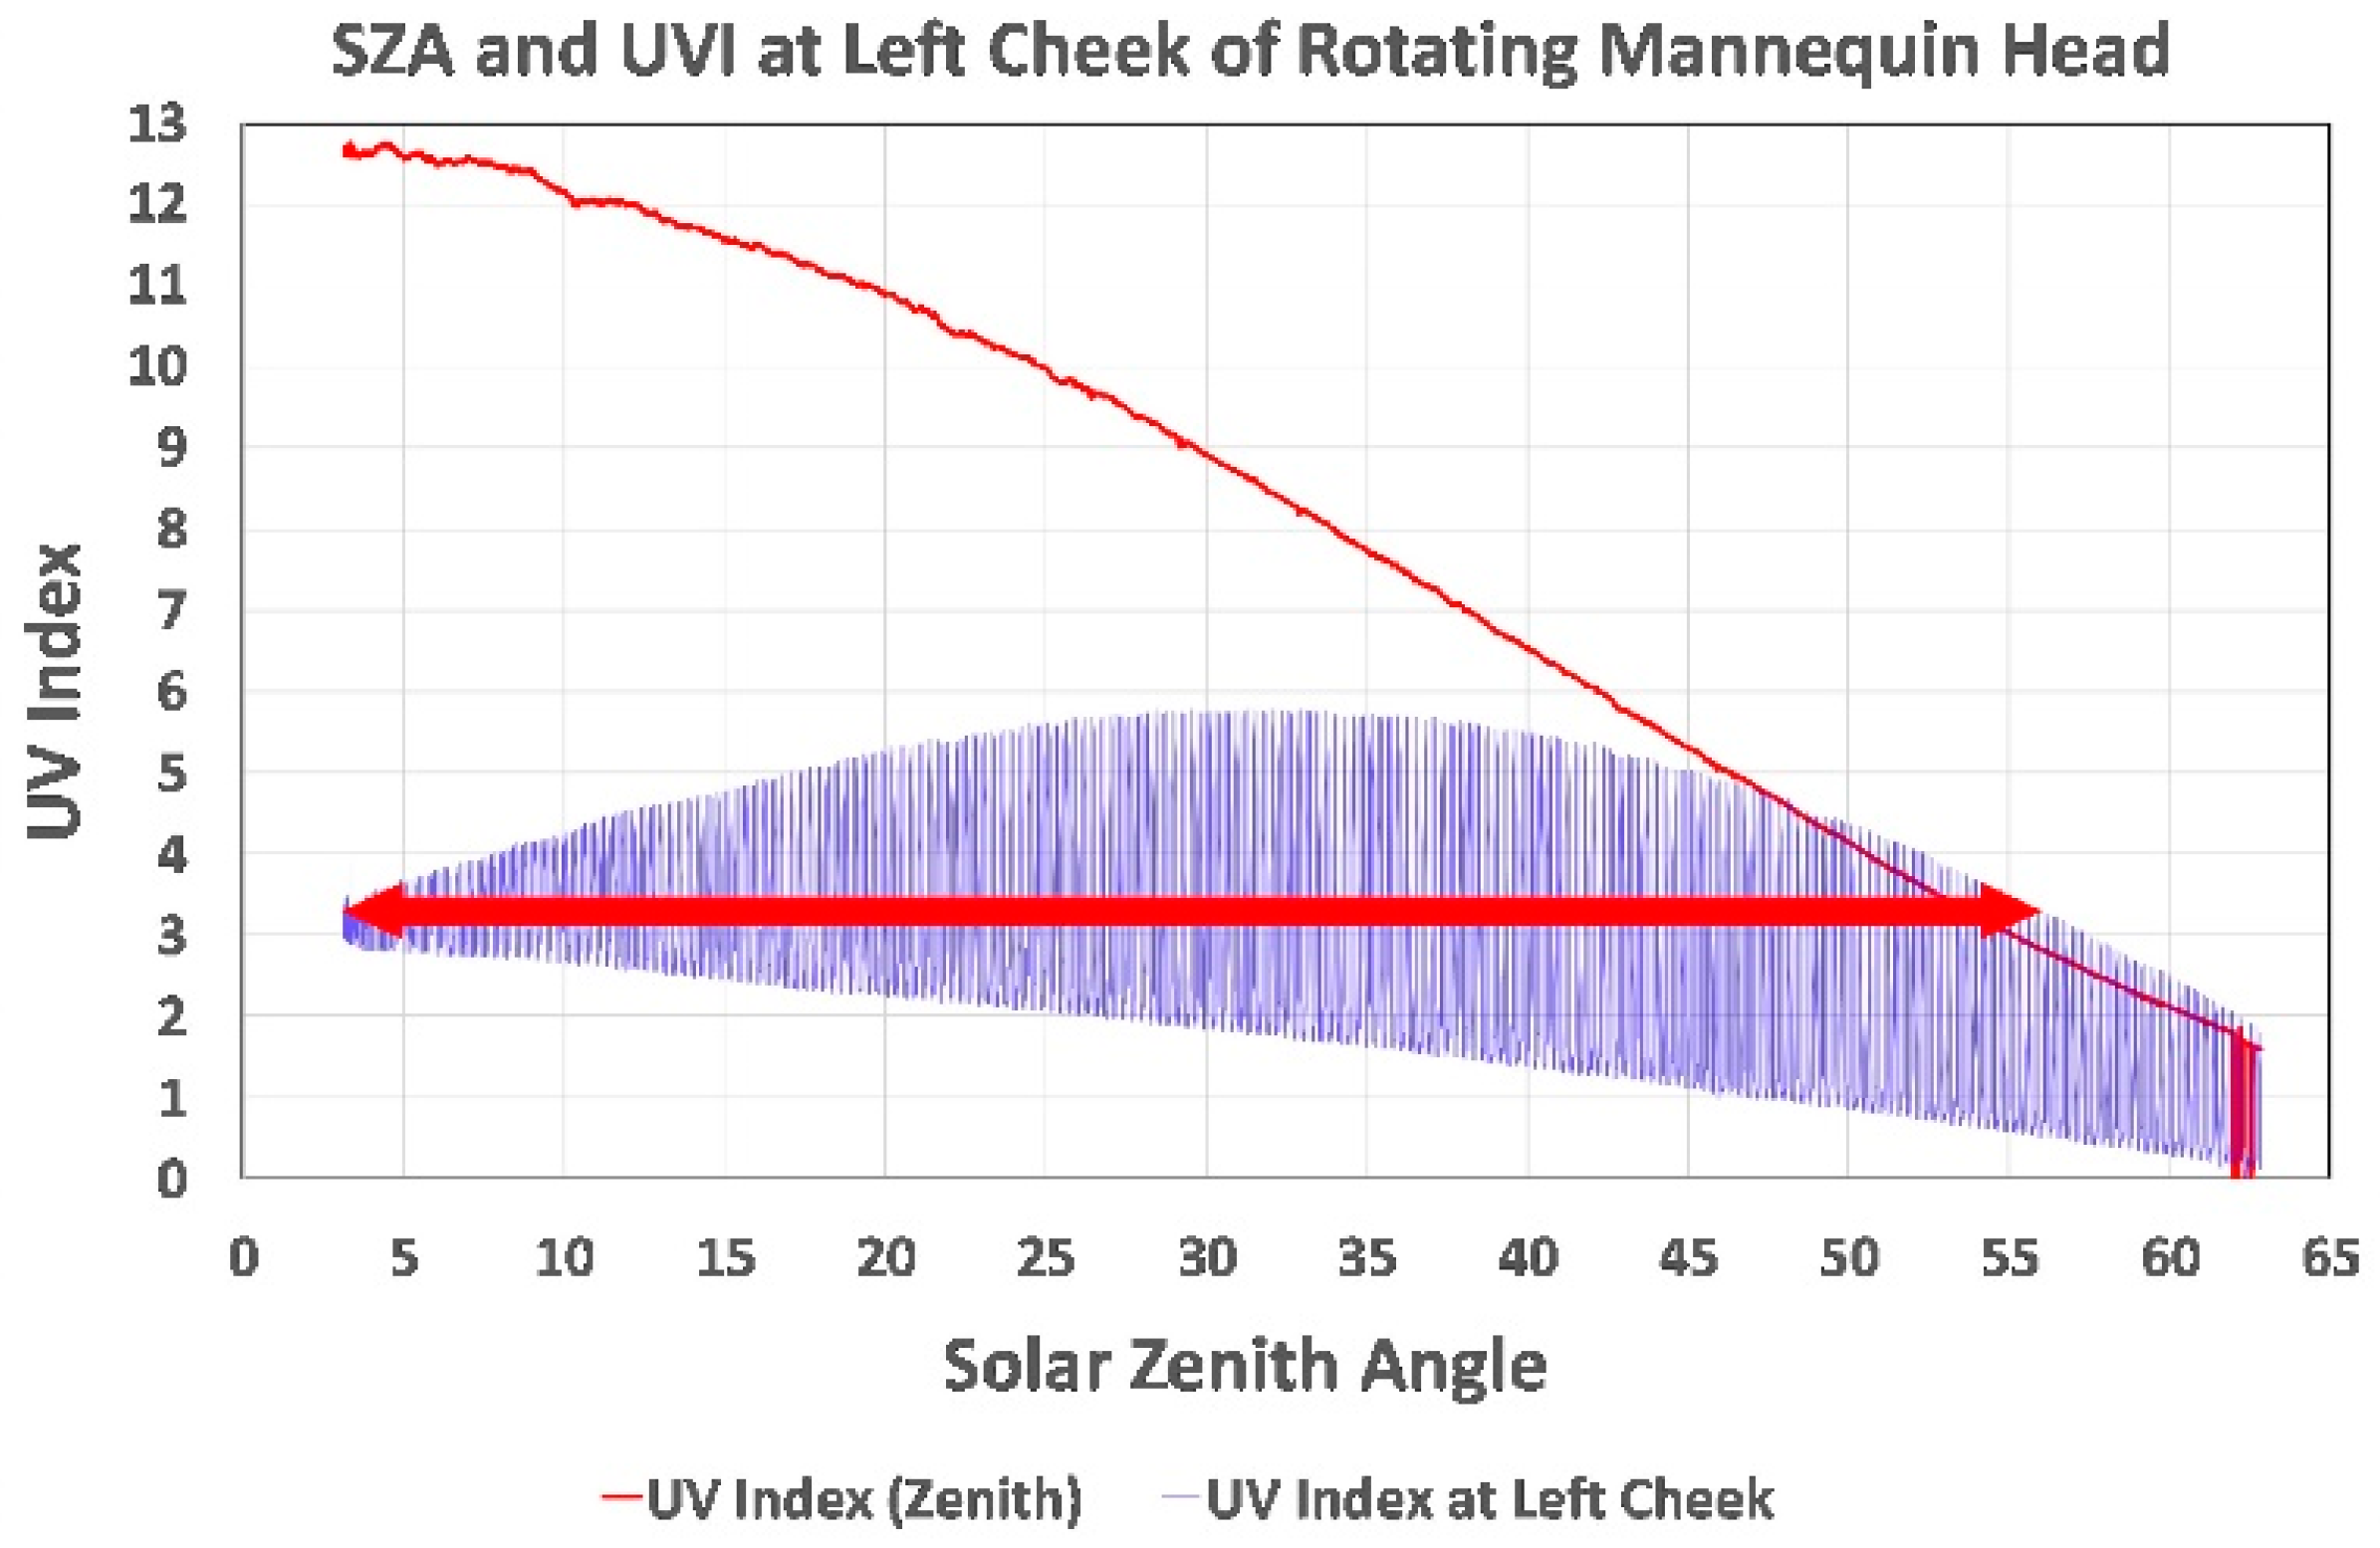
The data in Figure 4, Figure 5 and Figure 6 are plotted against local time to provide a more intuitive depiction of the UVI magnitude over the course of a day than the SZA. The data can also be plotted against the SZA as shown for the 22 July morning measurements in Figure 7. At solar noon, the PMA1102-measured UVI reached 12.8 (extremely high) while the UVI at the left cheek was only 3.3 (moderate). When the mannequin head’s left cheek was facing toward the sun, the UVR at the cheek exceeded its noon UVI (3.3) from a SZA of from 56° to 3°, reaching a peak UVI of 5.5 at a SZA of 32°, which clearly demonstrates why facial protection from UV is more important at midmorning and midafternoon than at noon for this and other tropical sites and probably temperate sites during summer.

Figure 7.
Horizontal UVI and UVI measured by the left cheek sensor plotted against the morning solar zenith angle (SZA) at the Old Kona Airport Park on 22 July 2018. The bidirectional arrow indicates that the left cheek received more UVR than at solar noon from a SZA of from 56° to 3°.
4.2. UVI Measurement Challenges
We were unequipped to measure the spectral response of the UVI sensors used in this study and assumed that the responses provided by their respective manufacturers were reasonably correct. This left two challenges facing our measurements of the UVI. Here we report these challenges in detail, for they may affect those who duplicate or expand upon our study.
4.2.1. Ozone Error
The first challenge was a positive error of uncertain origin in the UVI reported by the zenith-facing PMA1102 global UVR sensor. The manufacturer’s algorithm for extracting the UVI from the PMA1102 sensor’s output voltage and correcting for the temperature error produced a UVI significantly higher than that measured by the carefully maintained, temperature-regulated instruments that measure the UVI at MLO. Several of these instruments provided convenient calibration standards for checking the accuracy of the PMA1102, including two Environment Canada Brewer spectroradiometers (Nos. 009 and 119) and a Colorado State University (CSU) broadband UVR pyranometer (Yankee Environmental Systems UVB-1, Turners Falls, Massachusetts). The CSU instruments are part of the UV-B Monitoring Climatological and Research Network managed by CSU for the US Department of Agriculture [29].
For example, during the clear morning of 7 August, before the arrival of a rare smoke event at MLO, the PMA1102 indicated an average UVI 8% higher than the average UVI measured by the two Brewers and the CSU broadband radiometer. The average UVI measured by the MLO instruments agreed much more closely, with the CSU radiometer and Brewer 119 agreeing to within 0.1% and their average agreeing with Brewer 009 to within 3%.
The PMA1102 documentation established that three months before deployment to Hawai’i the sensor was calibrated by the manufacturer against an identical master sensor calibrated with a NIST-traceable standard lamp. However, the manufacturer’s calibration assumed an ozone column of 300 DU, which is higher than typical summer ozone amounts over Hawai’i. During the two hours preceding the 7 August smoke event at MLO, the average column ozone measured by Brewers 009 and 119 was, respectively, 275.2 and 276.1 DU, for an agreement of 0.3% Therefore, we added an ozone correction to the manufacturer’s algorithm in conformance with the finding by McKenzie et al. [30] that: “Ozone reductions of 1% typically cause an increase in erythemally active UV irradiance of 1.25 +/− 0.20%.” Dividing the average ozone amount (275.65 DU) by 300 DU and applying the 1.25% UVR correction factor yielded a PMA1102 UVI 3% below the average UVI measured by the three MLO instruments and 2% below the average, nearly identical UVI measured by the CSU radiometer and Brewer 119. This ozone correction was applied to all PMA1102 and mannequin head data reported herein for which the column ozone was available.
4.2.2. Cosine Error
The second challenge to our study was the cosine error of the UVR sensors that we used. The cosine error is defined as: “The deviation of the angular response of a radiometer from the ideal cosine response.” [31] The cosine error of the PMA1102 sensor that provided the UVI at each site where the UVR sensor-equipped rotating mannequin head was deployed was specified by the manufacturer as within 5% for a SZA < 60°. This agrees with the sensor’s angular response error extracted from a cosine chart in the manufacturer’s data sheet, which shows the error remains <4.75% for a SZA from 20° to 70°. This range is well within the <10% for incidence angles < 60° recommended for broadband UVI radiometers by the World Meteorological Organization [31].
Finding the cosine error of the head-mounted, vertically oriented UVR photodiode sensors posed a much more difficult challenge. The angular response of the PMA1102 matched that of one of the mannequin head sensors when both sensors were mounted on a horizontal surface facing the zenith (Figure 3b). However, when the mannequin head was deployed, the PMA1102 always faced the zenith, while all the head sensors faced the horizon. Thus, the head sensors were exposed to their highest cosine error when the PMA1102 was exposed to its lowest.
Determining the cosine response error of a vertically oriented sensor at low SZAs is not trivial, especially when UVR scattered from the surface and the unpredictable, highly variable UVR scattered from the sky significantly add to the uncertainty. Apparently this challenge is not new, for a prior study in which a rotating mannequin head was used [27] does not report the cosine response of the spectrometer that served as a sensor. While flat polysulfone film UVR dosimeters would seem to have a good cosine response, the maximum SZA measured in the sole paper on this topic, to our knowledge, is 70° [32]. Evidently, a high SZA angle is subject to enhanced error caused by reflection from the surface of these sensors. Because these dosimeters generally measure integrated daily exposure, the contribution for when the sun is at a SZA between 70–90° is significantly less than when the SZA is <70° degrees.
To better understand the very high SZA cosine error of the mannequin head sensors, we looked closely at the data collected at solar noon on 22 July at the Old Kona Airport Beach, a day when the sky was made hazy by vog. Noon that day occurred at 12:30:19, when the SZA was only 3.64°. At noon the zenith-facing PMA1102 sensor measured an ozone-corrected, global UVI of 12.8, and the left cheek sensor measured an ozone-corrected UVI of 2.8. Analysis of two photographs of the left cheek established that the cheek sensor’s face was vertical with respect to the horizon formed by the ocean. Therefore, at solar noon the PMA1102 measured the total UVI from the direct sun and that scattered by the entire sky, while the vertical left cheek sensor received UVR from the sky and the surface (beach sand and ocean) but little or even none from the direct sun (see Table 4).
At 12:32 (1.7 min past solar noon) on 22 July, we measured the full and diffuse sky irradiance with a UVR (305 nm) radiometer built and used for this purpose during annual Hawaii calibrations since 1994 [33]. The full sky measurement was made by placing the instrument on the sand and making it level with the assistance of a bubble level. The diffuse sky measurement was made by shading the UVI sensor with a black, 2-cm diameter disk mounted on a 1-mm rod and held approximately 20 cm over the sensor. At the near solar noon time of these measurements, 62% of the surface UVR was diffusely received from the hazy sky and 38% from the direct sun. The sky was much clearer at MLO on 12 August at 12:23 (7.8 min before solar noon), and the same method found that only 31% of the UVR was scattered from the sky (half the sea level fraction) and 69% arrived from the direct sun. These values are conservative, for the occluder disk subtends an angle of ~5°, while the sun subtends ~0.5°. Thus, the disk blocked the most intense scattering within the solar aureole that would have added to the diffuse fraction.
Because the surface below the horizon is in the lower half of the 2.17π sr FOV of the UVR sensors on the rotating mannequin head, on 21 July (10:36) at the Old Kona Airport Park we measured the reflectance (ρ) of the dry beach sand near the mannequin head apparatus with a Model 6.5 UVI Radiometer (Solar Light). The full sky UVI was 10.1 when the instrument was pointed at the zenith, and the UVI was 0.6 when the instrument was pointed at the beach sand, which gave a ρ of 5.9% of the full sky UVI. We used a variation of this method to measure the outdoor UVR ρ of a sample of MLO lava alongside a Spectralon® diffuse reflectance standard (ρ = 0.99, Labsphere, https://www.labsphere.com/), which yielded a surprisingly high ρ of 20%. These results indicate that the MLO measurements were affected less by the sky and more by surface scattering than the respective measurements made at sea level. Nevertheless, as shown in Table 4, at solar noon on 22 July the Kona site received a higher UVI (2.8) than MLO (1.6).
The 190° image in Figure 8 illustrates the FOV of the head-mounted sensors at MLO when pointed toward Mauna Kea. This horizontally-aligned image clearly shows how the surface and sky each form half the FOV of the vertically-aligned head sensors. We made similar images at the Old Kona Airport Park, Seaview Estates Park and Spencer Park. In retrospect, we should have made horizontal 190° images of the four ordinates at each of our sites to better document the surface conditions.
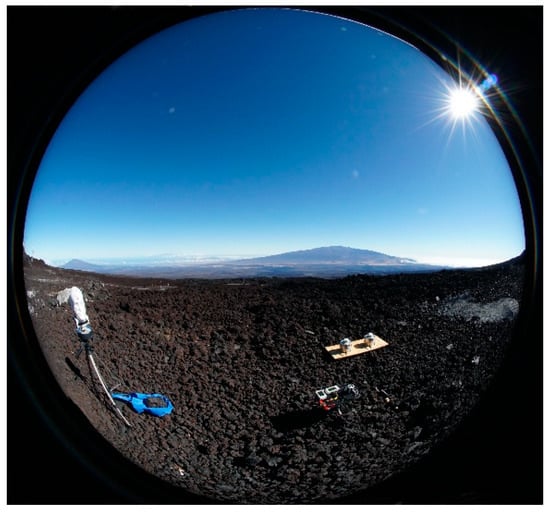
Figure 8.
Horizontal 190° view of the sky and surface that approximates the field of view (FOV) of the mannequin head-mounted UVR sensors. This image was made at 8:52 on 11 July 2018 at MLO. The mannequin head is on the left, and the PMA1102 is to its right. Mauna Kea is in the background.
Referring to Table 5, which summarizes these measurements, note that the noon data were collected when the sun was so near the zenith that the cosine error of the sky dominated and the error for the direct sun is absent or unknown. A laboratory-tested 501 UVB radiometer (Solar Light) operated from a SZA of 0° to 85° gave a cosine error of ~0.15 at 85° [34]. This is relevant to our high SZA measurements, for the manufacturer’s cosine error for the 501 and the PMA1102 that we used are identical (<5% from a SZA of 20° to 60°). Yet, applying indoor lab measurements of cosine error is risky, for, as Hülsen and Gröbner report [35], the magnitude of the correction also depends both on the distribution of the diffuse radiation across the sky and the ratio of the direct and diffuse irradiance, neither of which is available indoors. They further observe that these uncertainties can lead to significant errors. Moreover, in our study the head sensors were continually rotating, thus exposing them to a constantly changing cosine errors from the sun and diffuse sky. While the heads of human subjects do not rotate, they often tilt up, down and sideward, thereby further complicating the cosine problem. For all these reasons, we corrected our data only for the ozone error.
Table 5.
Comparison of direct and diffuse UVI measurements near solar noon at the Old Kona Airport Park beach (22 July 2018) and MLO (12 August 2018). The Kona sky was overlain with hazy vog with distant cumulus clouds very low over the west horizon; the MLO sky was clean and clear.
4.3. UVR and Volcanic Sulfur Dioxide
From 1986 to 2018, continuous emissions from the Kilauea volcano caused hazy vog and respiratory distress across Hawai’i Island. Vog is formed from the aerosolization of SO2 that has combined with water vapor in the emission plume and the atmosphere [36]. Residual SO2 in vog absorbs UVR, while the aerosols in vog both absorb and scatter UVR. The latter effect significantly increases the sky’s diffuse UVR. During the first 19 days of our field study, the historic eruption of the Kilauea volcano that ended 5 August blanketed much of Hawai’i Island with considerably more vog than usual. On 22 July at the Old Kona Airport Park beach, the cloud-free sky was veiled with volcanic SO2 at solar noon. As explained above, byBy shading a zenith-facing, global UVI sensor with a black 2-cm diameter disk mounted on a 1-mm rod and held approximately 20 cm over the sensor, we found that 62% of the surface UVR was scattered from the hazy sky and 38% arrived from the direct sun. The sky was much cleaner at MLO on 12 August, and the same method found that only 31% of the UVR was scattered from the sky (half the sea level fraction) and 69% arrived from the direct sun. While haze can alter a UVR sensor’s cosine response, we were unable to incorporate appropriate corrections, for we did not regularly measure the diffuse/direct UVR.
During the main phase of this eruption, Kilauea’s fissure 8 (Figure 9) was emitting up to 50,000 tons of SO2 per day [37], and this provided a serendipitous opportunity to expand the measurement objectives for the Hawai’i UV study, particularly since the UVR absorption spectrum of SO2 emitted by coal-burning power plants and industrial activity matches the UVR spectral absorption by volcanic SO2. Natural and anthropogenic aerosols mixed with the SO2 may cause minor differences.
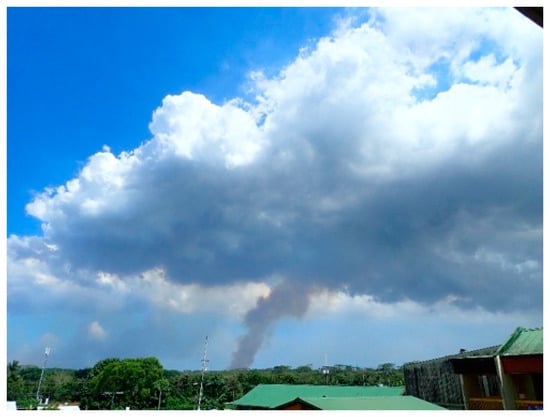
Figure 9.
Water vapor and aerosols in the eruption plume from Fissure 8 of the Kilauea volcano created a persistent weather system that sometimes included thunderstorms. This photograph was made from a second-floor overlook at the Pāhoa High and Intermediate School on 31 July 2018.
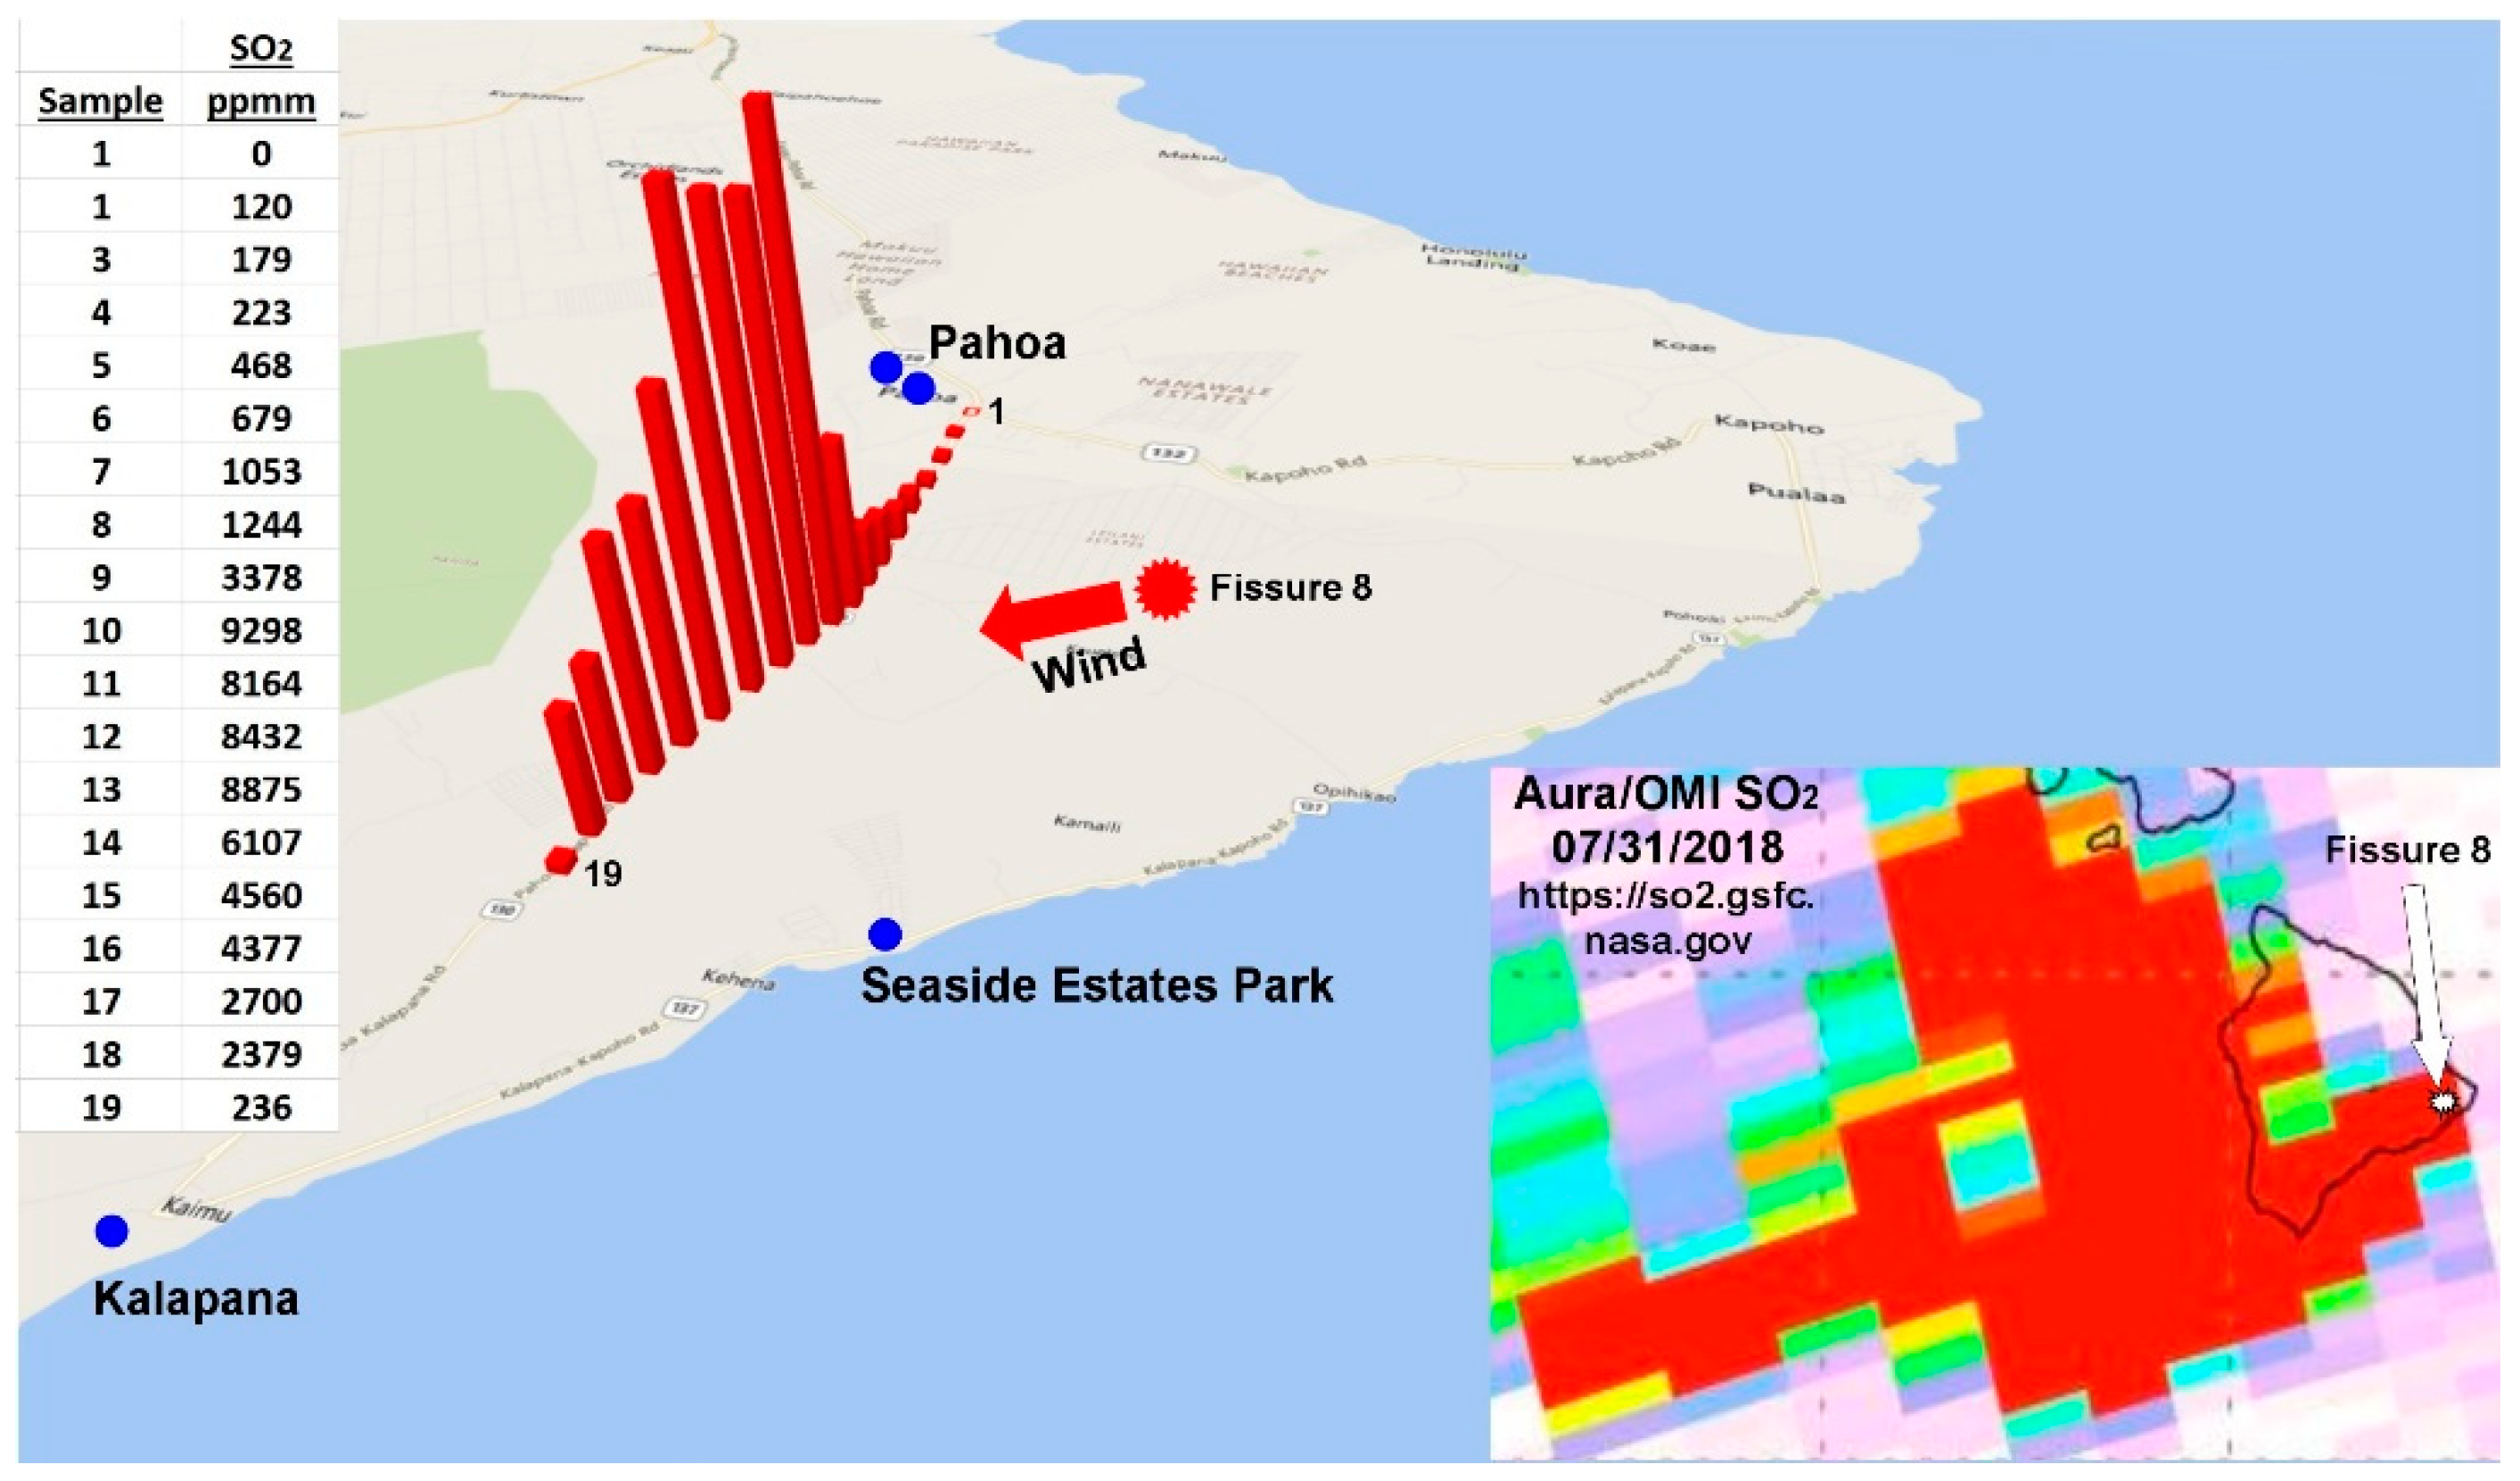
The Fissure 8 eruption plume created a continuous cumulus cloud infused with significant SO2 that we measured by pointing a PiSpec spectrometer at the zenith sky during one of two vehicular traverses along Pāhoa-Kalapana Road (Highway 130) under and adjacent to the eruption plume (Figure 10). The PiSpec is a novel UV spectrometer that has a resolution of 1 nm and a bandpass of 60 nm centered at 310 nm [38]. Specifically designed to measure volcanic SO2, the PiSpec is built from a 3D-printed housing, off-the-shelf optical components and a low-cost sensor primarily designed for the smartphone market. The latter is from a modified Raspberry Pi camera module, making sensor control and data acquisition relatively straightforward using the Python programming language.
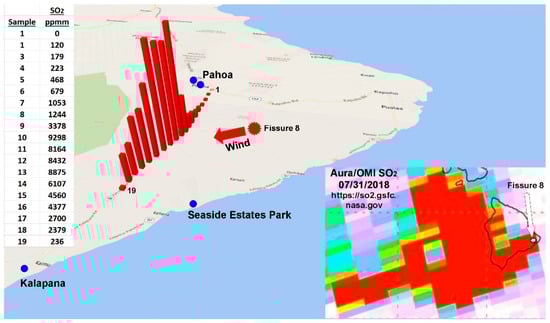
Figure 10.
SO2 (ppmm) measured by a UV spectrometer during a traverse along a highway adjacent to the eruption plume from Fissure 8 of the Kilauea volcano on 31 July 2018. The inset is an Aura/Omi image of SO2 over and downwind from Hawai’i Island on the same day. In the inset, Kilauea’s Fissure 8 is indicated by the red dot in the large map and by a white arrow in the inset at lower right.
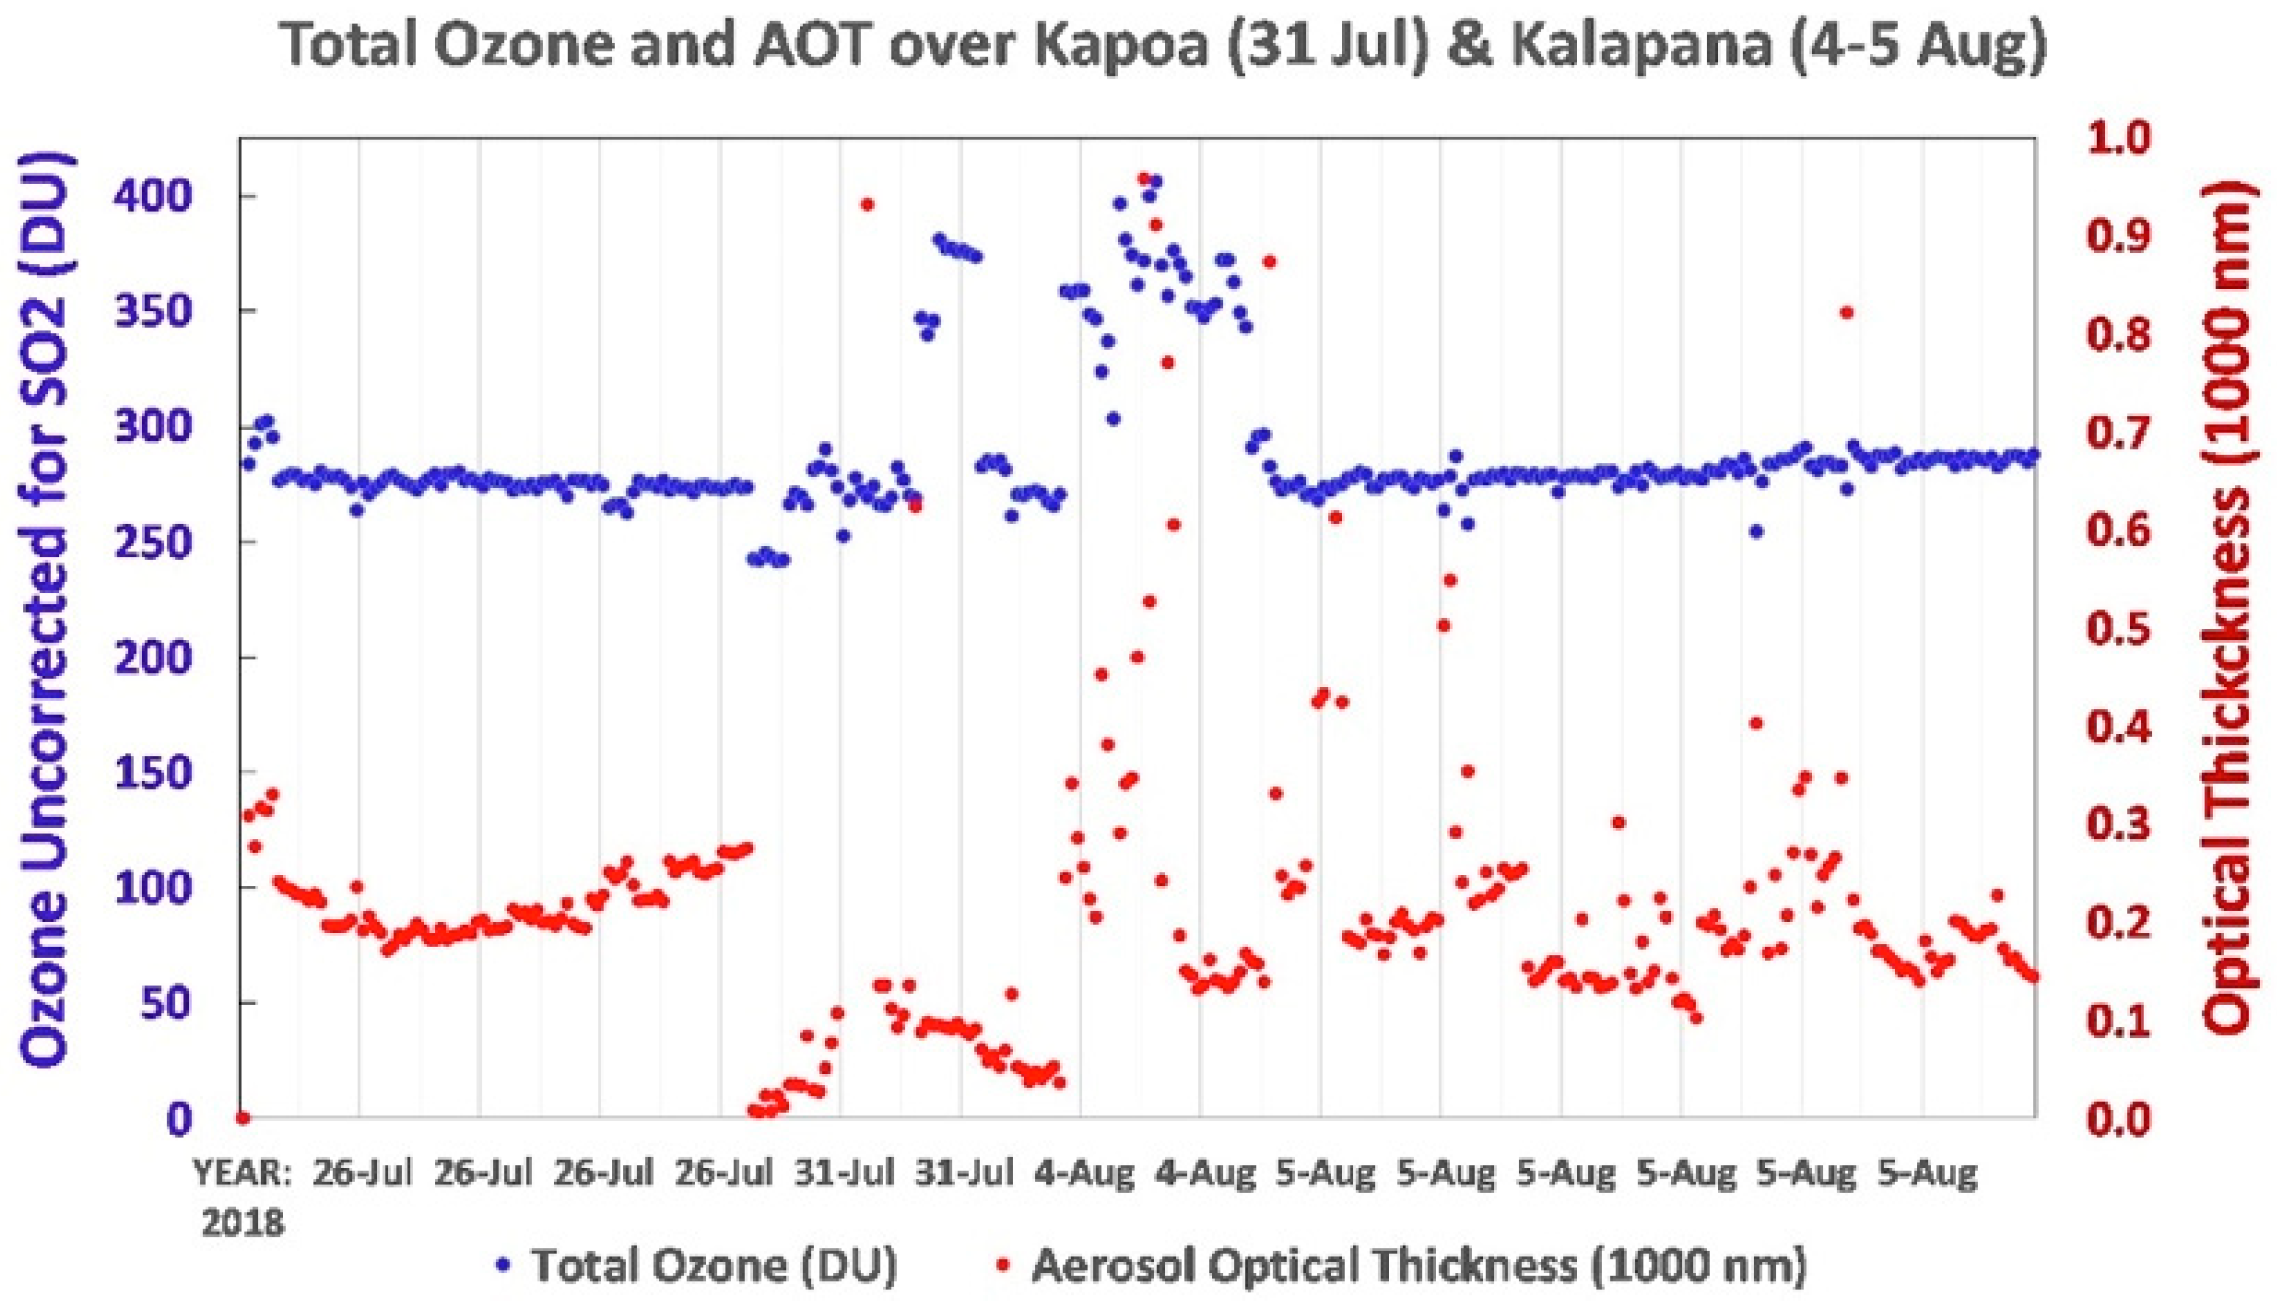
Because SO2 efficiently absorbs UVR wavelengths also absorbed by ozone, SO2 from industrial sources can inflate measurements of total column ozone made by Dobson, Brewer and other spectroscopic instruments. Zerefos et al. [39] have observed that: “… SO2 has a number of strong UV absorption bands in which the cross-sections are three to four times as large as those for ozone.” This interference has long been known to the ozone monitoring community, and Komhyr and Evans [40] have reported that Dobson spectrophotometer measurement of total ozone in regions with high levels of anthropogenic SO2 can cause errors as high as +25%.
We observed examples of this while using a handheld Microtops II® (Solar Light Microtops II®) (Solar Light, 100 East Glenside Ave., Glenside, PA 19038, USA) [41]) to make ozone measurements where the SO2 was especially concentrated near the Fissure 8 eruption plume. Microtops II measures direct UVR at 300, 305 and 312 nm (5 nm FWHM) in W/m2 when pointed directly at the sun. Microtops II infers the ozone column from ratios of direct sunlight intensity at these wavelengths, where some of the key absorption bands of SO2 and ozone overlap. Thus, SO2 can cause erroneously high ozone measurements by Microtops II. The instrument also measures total water vapor at 940 nm/1000 nm and the optical depth at 1000 nm.
Microtops II measurements indicated excessively high levels of total ozone over Pāhoa on 31 July and over both Kalapana and the Seaview Estates Park on 4 August. On 4 August, Microtops II measured up to 410 DU of ozone through openings to the sun in the volcanic eruption cloud over Seaview Estates Park 8 km SSW of Fissure 8. This measurement was clearly erroneous, for the average of 99 total ozone measurements from several sites well away from the eruption cloud on 24–26 July was 270 DU. Thus, it’s reasonable to conclude that the ozone error caused by SO2 on 4 August was 410–270 or 140 DU, an error of +52%. On 5 August at the Seaview Park site, the fraction of sky covered by the volcanic cloud was significantly reduced. This permitted 128 Microtops II total ozone measurements, the average of which was only 2% over the background ozone measured on 24–26 July. All Microtops II ozone measurements during this time are plotted in Figure 11.

Figure 11.
Microtops II indicated normal total ozone amounts outside the SO2-laden plume from Fissure 8 and highly inflated total ozone through openings in the plume.
The Fissure 8 eruption ceased on 5 August, and the Hawai’i Volcano Observatory described the dramatic drop in SO2 emissions that followed:
“When lava output from fissure 8 suddenly declined in early August, SO2 emission rates dropped precipitously as well. Emissions on Aug. 3 indicated tens of thousands of tons of SO2 coming from the fissure 8 vent, but just two days later, on Aug. 5, the emission rate was only about 200 tons per day.” [42]
4.4. UVR during Major Smoke Event at MLO
Brush fires caused by lightning, human activity, and military exercises are relatively common on Hawai’i Island during drought years. A rare biomass smoke event occurred over MLO from 11:45 to 12:25 on 7 August 2018 when dense smoke from the Keauhou Fire (5–15 August 2018), a major brush and forest fire on the southeast slope of Mauna Loa [43], covered most of the sky and provided a second serendipitous measurement opportunity. While this was a highly unusual event, the staff at the adjacent Mauna Loa Solar Observatory reports it has occasionally observed similar smoke events over MLO [44]. Smoke from the fire was also present over MLO on 10 August.
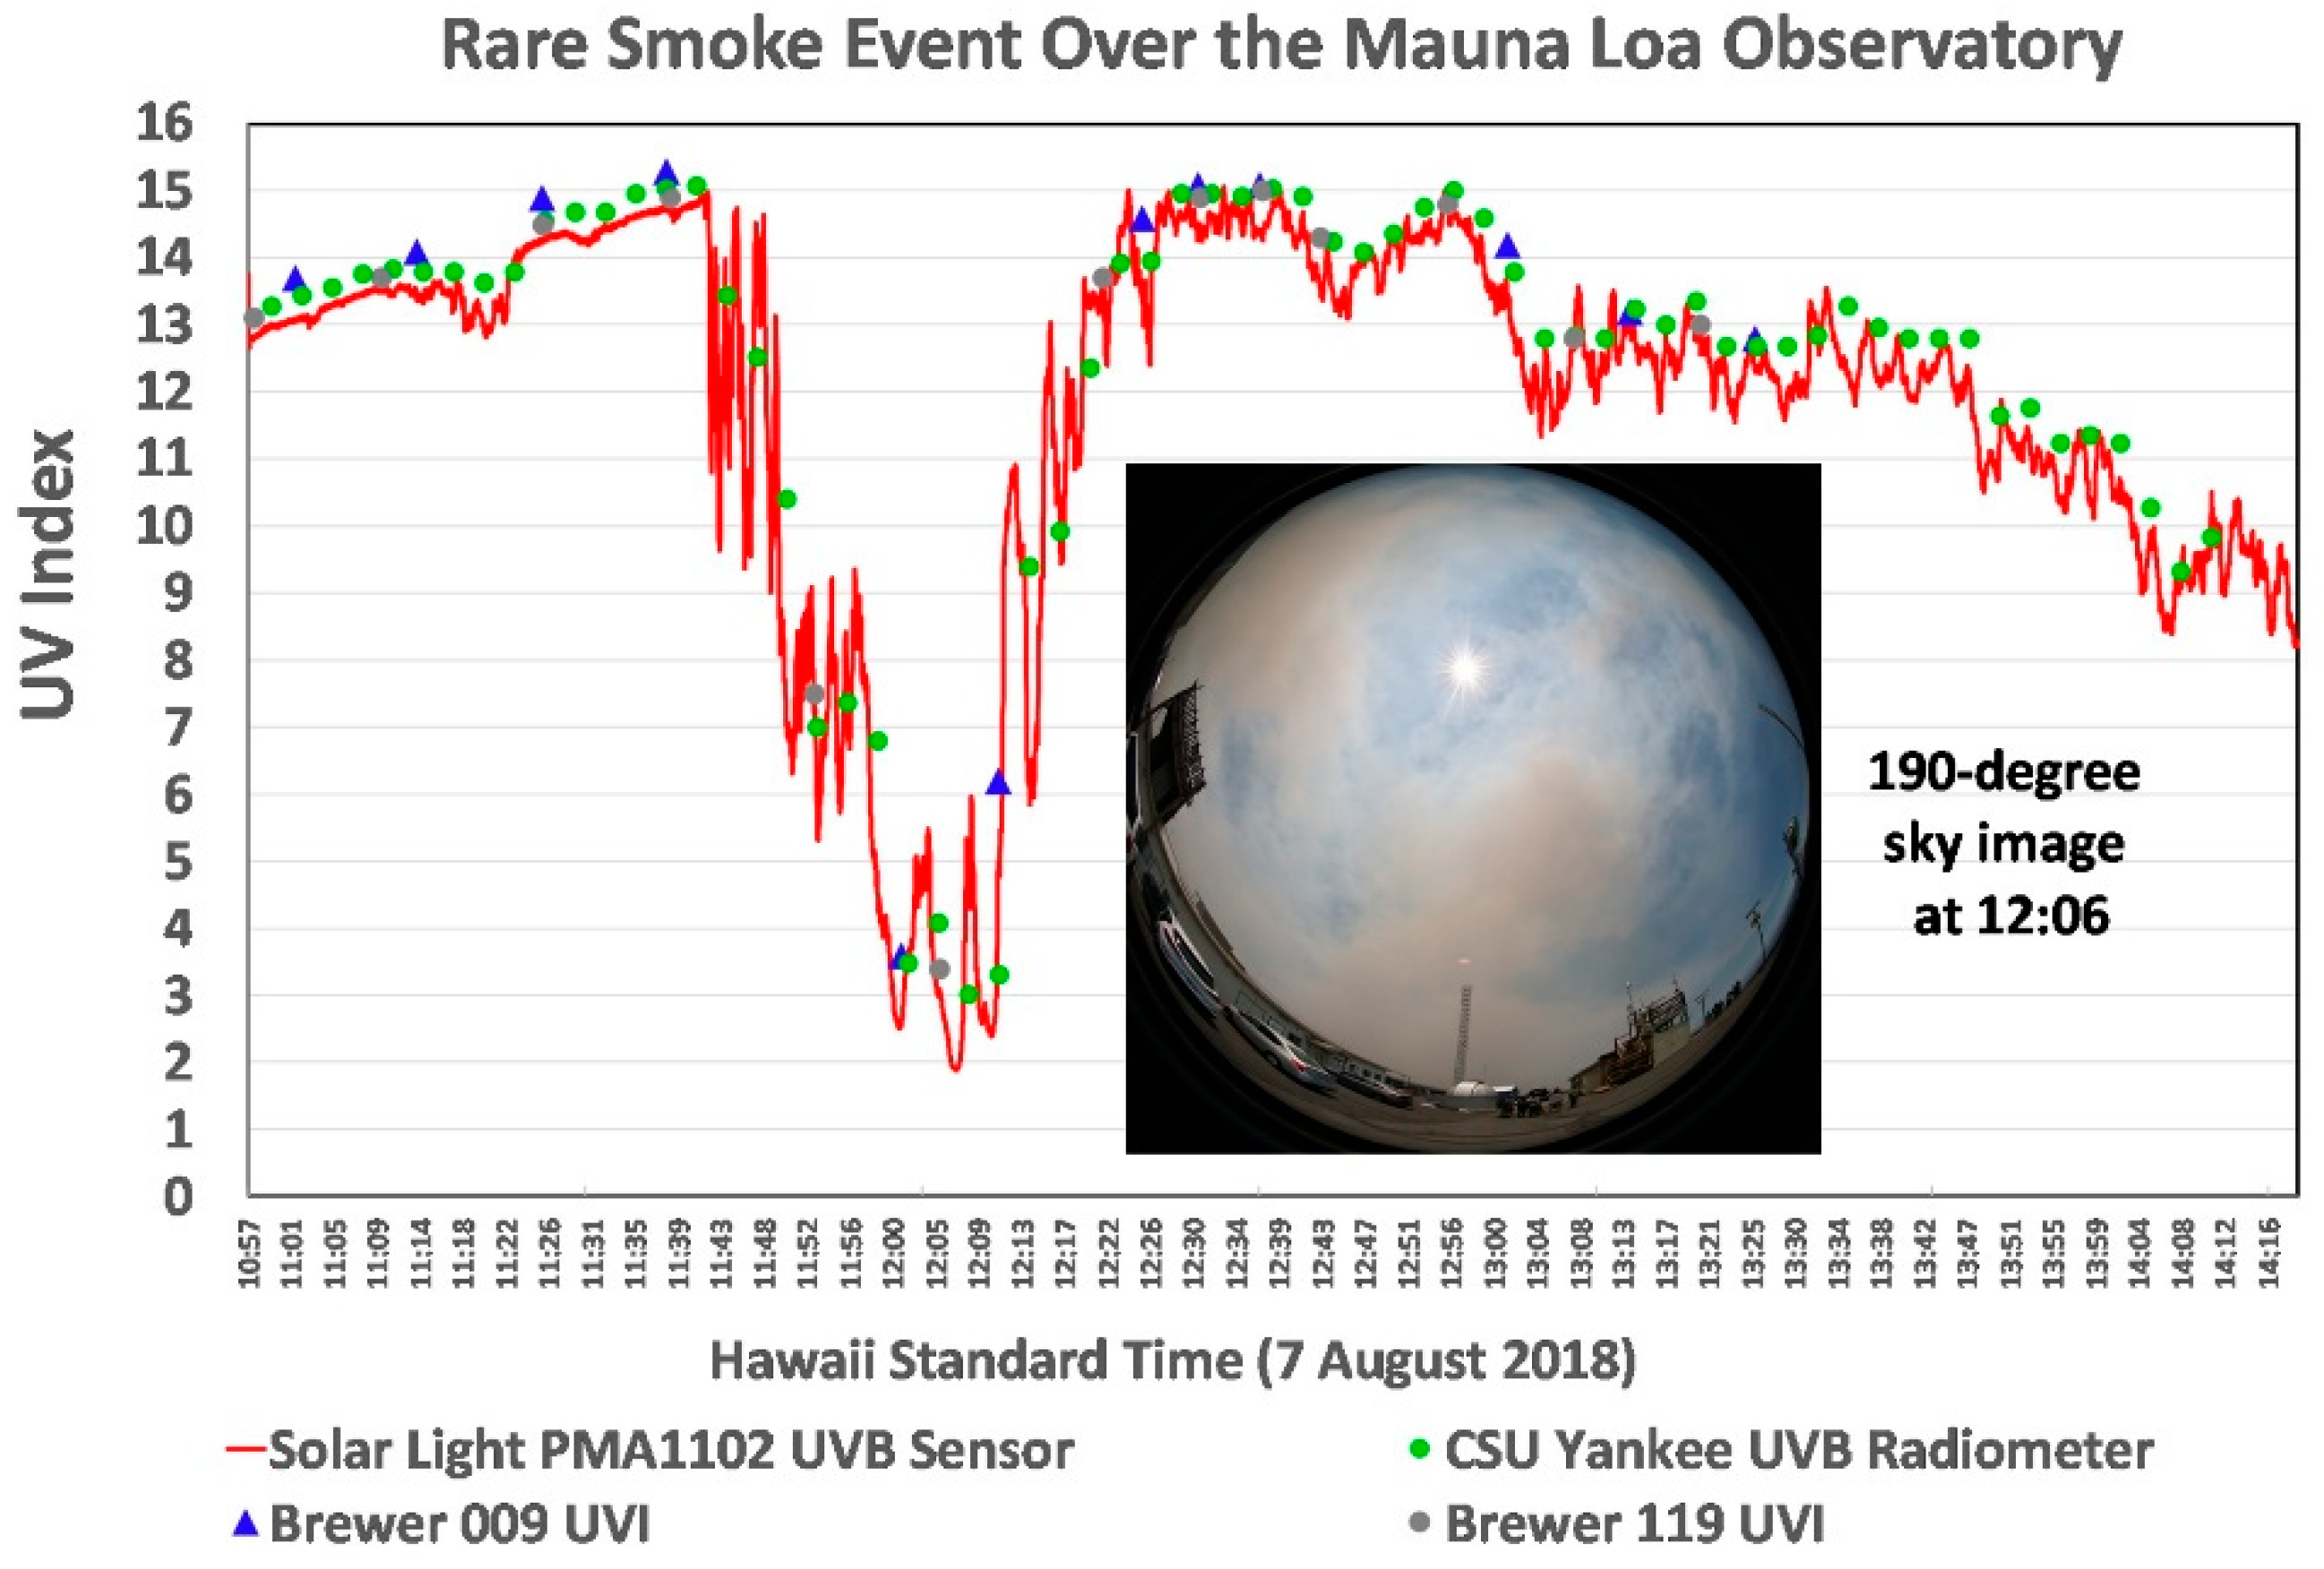
UVR is strongly absorbed by smoke [45,46], and this was dramatically illustrated by the UVI measured during this event by the PMA1102 sensor and confirmed by data from a CSU broadband UVR radiometer and the pair of Canadian Brewer spectroradiometers (Nos. 009 and 119) at MLO. Figure 12 shows the UVI measured by these four sensors during the smoke event, which fortuitously arrived just before solar noon (12:30) after a very clear morning. The PMA1102 UVI data are plotted as a continuous line at one-second intervals. The CSU broadband UVI data are plotted as the average of 3-min intervals, and the preliminary UVI measured by each of the two Brewers is plotted at greater intervals. The minimum UV occurred at 12:07, when the full sky UVR was only 8.3% of the UVR before the smoke arrived. Figure 12 includes a 190° photograph of the smoky sky 1 min past the peak blockage of UVR (12:08).
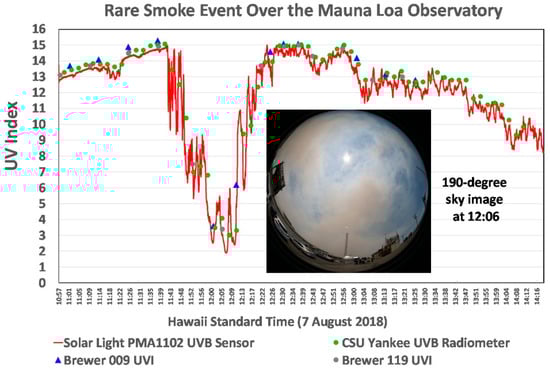
Figure 12.
UVI measured by four instruments during a rare smoke event just before solar noon at the Mauna Loa Observatory. The Brewer data are preliminary.
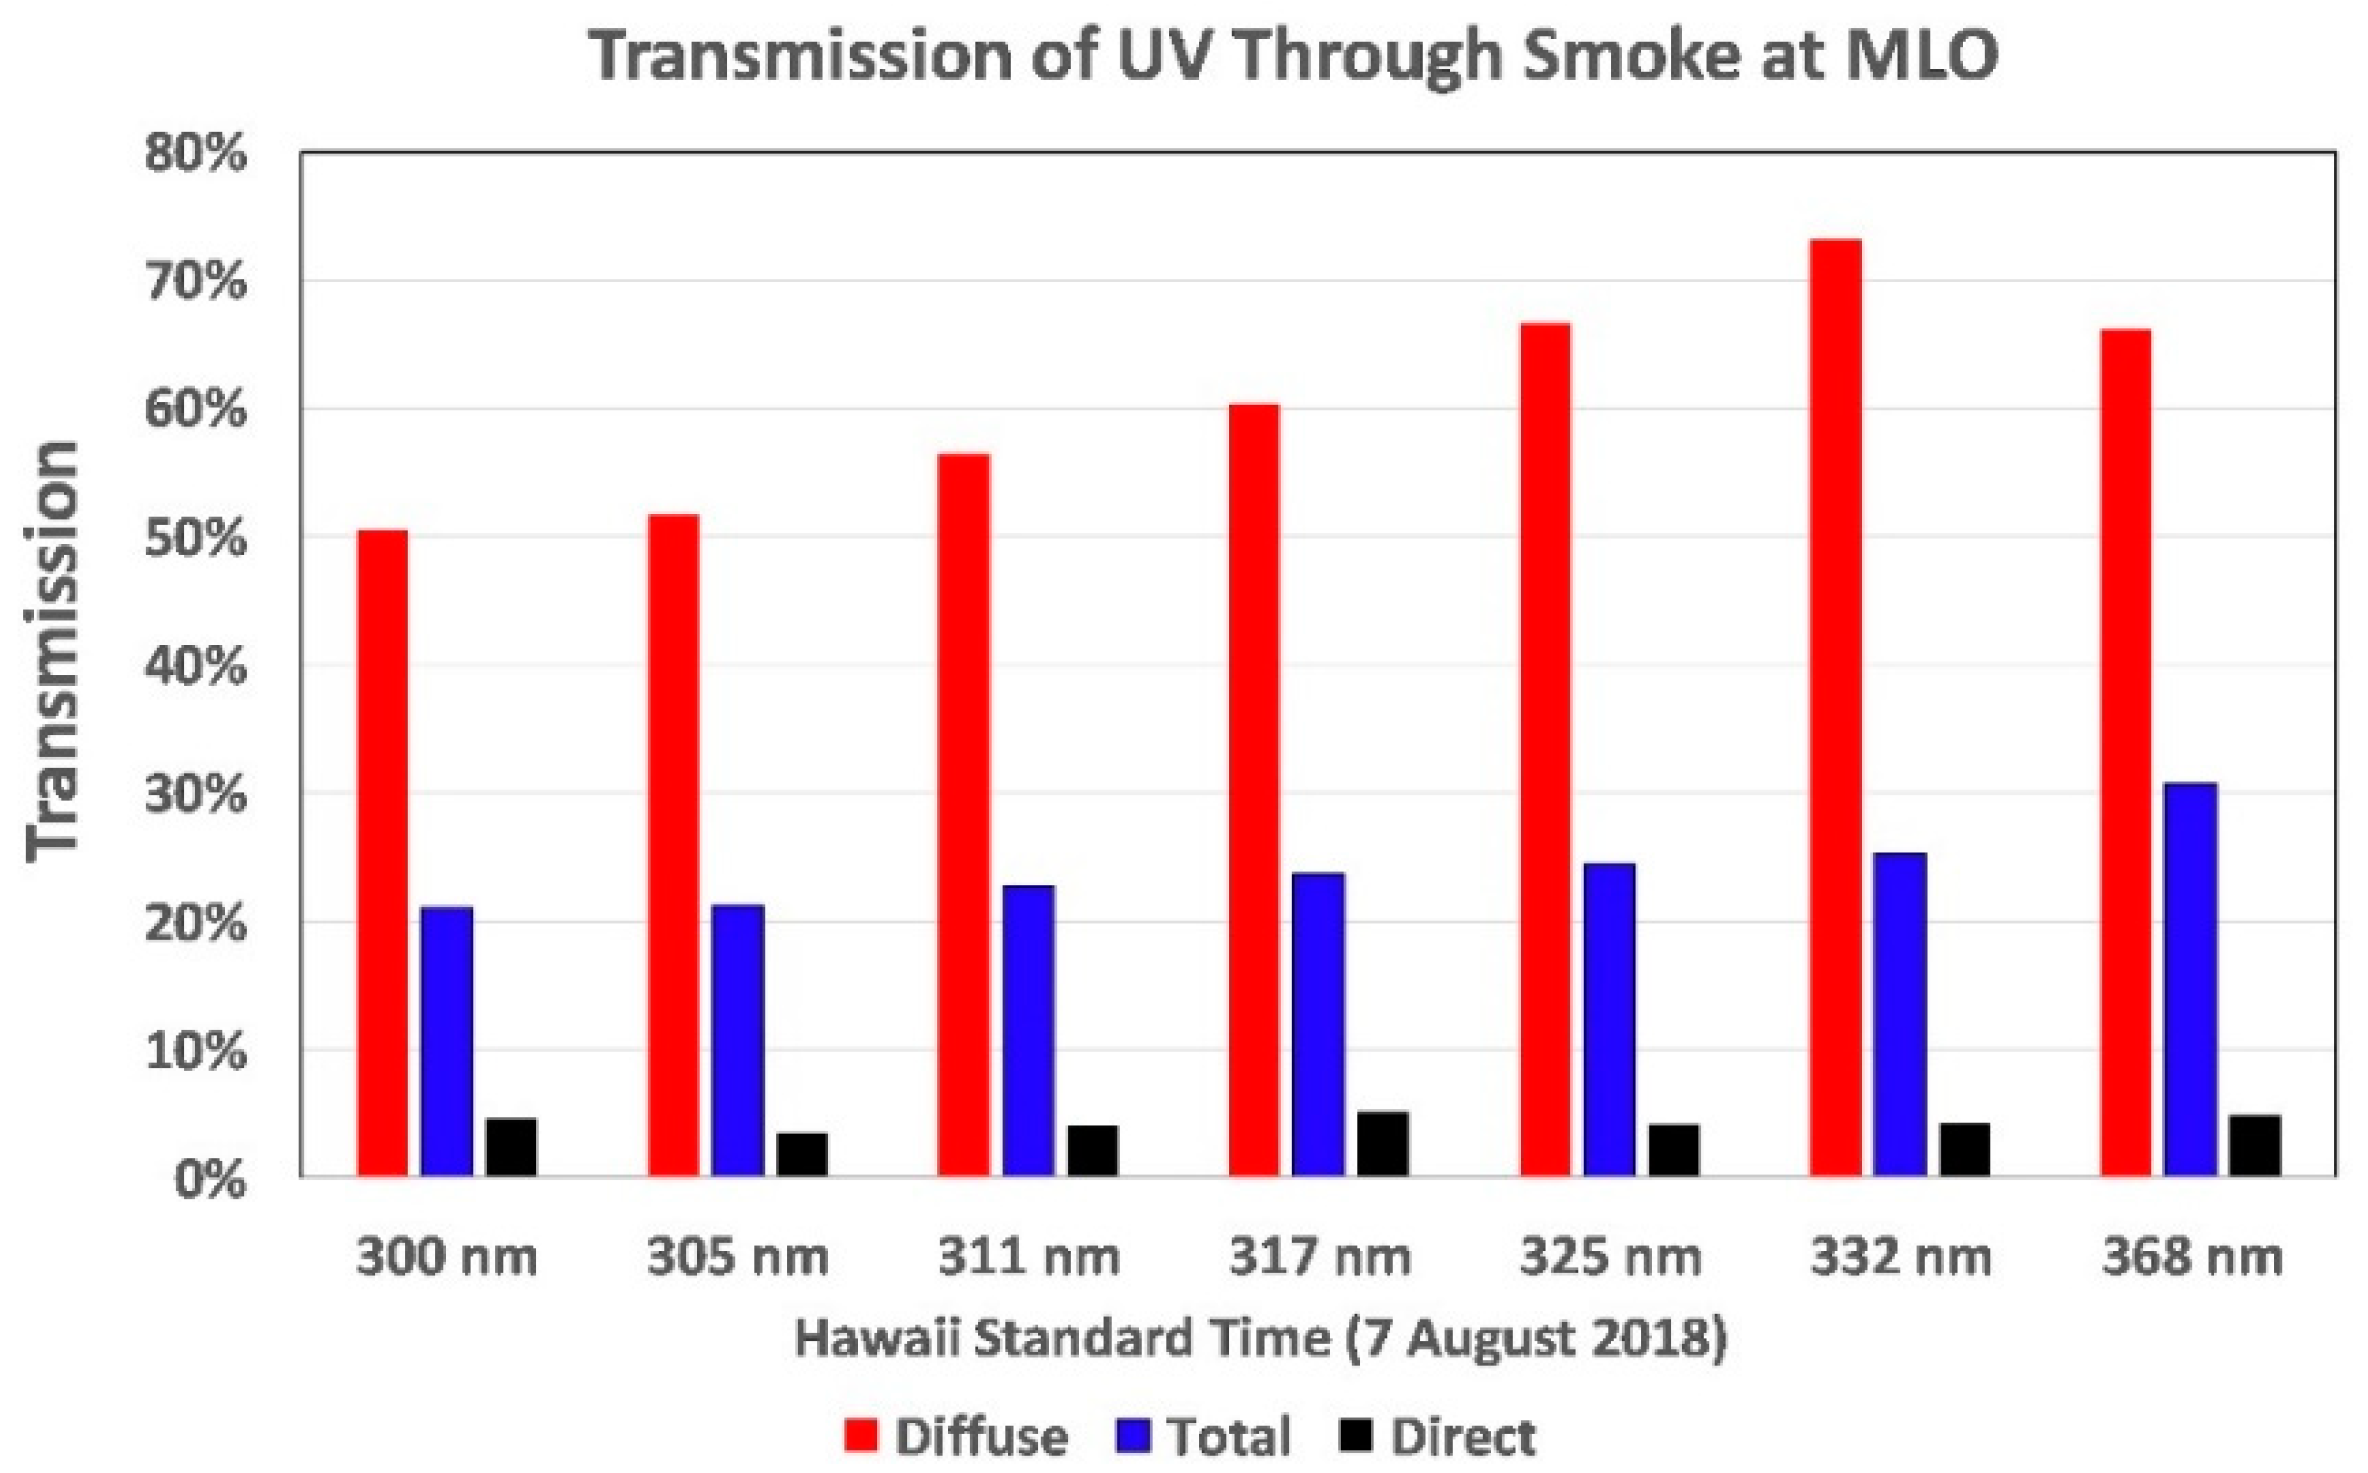
The smoke was also measured by all 7 channels of a CSU UVR radiometer (Yankee UV-1; HI22). and a CSU 7-channel Ultraviolet Multifilter Rotating Shadowband Radiometer (Yankee UVMFR-7). The latter provides measurements at 300, 305, 311, 317, 325, 332, and 368 nm (5 nm full width, half maximum (FWHM)) of the total, direct sun, and diffuse UVR at 3-min intervals. Figure 13 shows significant attenuation of UVR at all 7 wavelengths during the smoke event. UVB wavelengths can suppress or kill exposed viruses and bacteria that might cause infectious diseases in people and animals. Thus, the persistent suppression of natural UVB by biomass smoke or clouds might play a role in the incidence of infectious respiratory diseases [46,47]. Therefore, the MLO smoke event provides relevant data for future studies of this possible connection. After the smoke drifted away, the sky became sufficiently pristine to permit Langley calibrations of 5 Microtops II sun photometers.
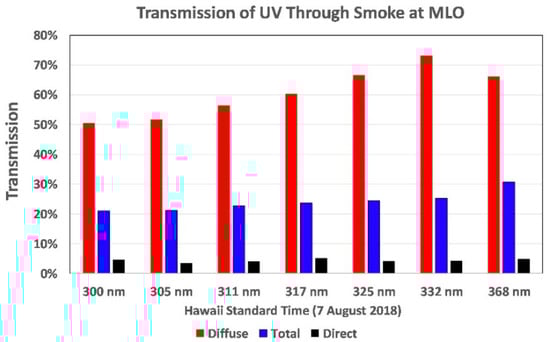
Figure 13.
Wavelength-dependent transmission of solar UVR measured by a 7-channel rotating shadowband radiometer during a rare smoke event over the Mauna Loa Observatory.
4.5. Photography
Photography provides an important and inexpensive method for recording sky conditions, yet few papers on UVR and the UVI include photographs of the sky, much less the surrounding landscape or body of water. We employed several conventional and specialized digital cameras to record the sky, landscape, rotating mannequin head, PMA1102 sensor, ocean and landscape during our measurement sessions. The principle cameras we used are listed in Table 6.
Table 6.
Cameras used in the UVI survey and their principle purposes.
These cameras provided superb results. While their total cost was approximately $2000 US, investigators with a limited budget can collect reasonable sky images with an inexpensive mobile phone camera equipped with a clip-on, wide-angle lens available for as little as $15 US.
During deployments of the rotating mannequin head, photographs were made of the solar aureole, which provide a visually obvious view of atmospheric haze that forms a glow around the sun (Figure 14). The aureole was captured by a digital camera (Canon G9) mounted on a fixture equipped with a black ball centered in the camera’s field of view (FOV) that blocks the direct sun (0.5°) with a 4° black circle [48]. The camera settings (f4, 1/600 s, ISO-500) were identical to those used for solar aureole photographs on all days when atmospheric measurements were made at Geronimo Creek Observatory (GCO), Texas (29.6° N, 97.9° W), since 3 October 2008. These fixed settings permit quantitative comparisons of sky conditions recorded in thousands of solar aureole images from Hawai’i Island and GCO.
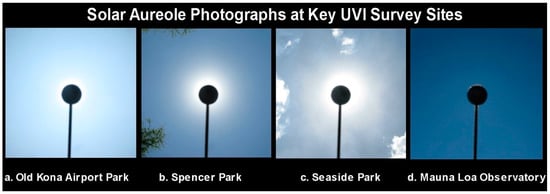
Figure 14.
Solar aureole photographs made by blocking the sun with a black ball mounted on a digital camera [48]. The pale sky in (a–c) is caused by vog.
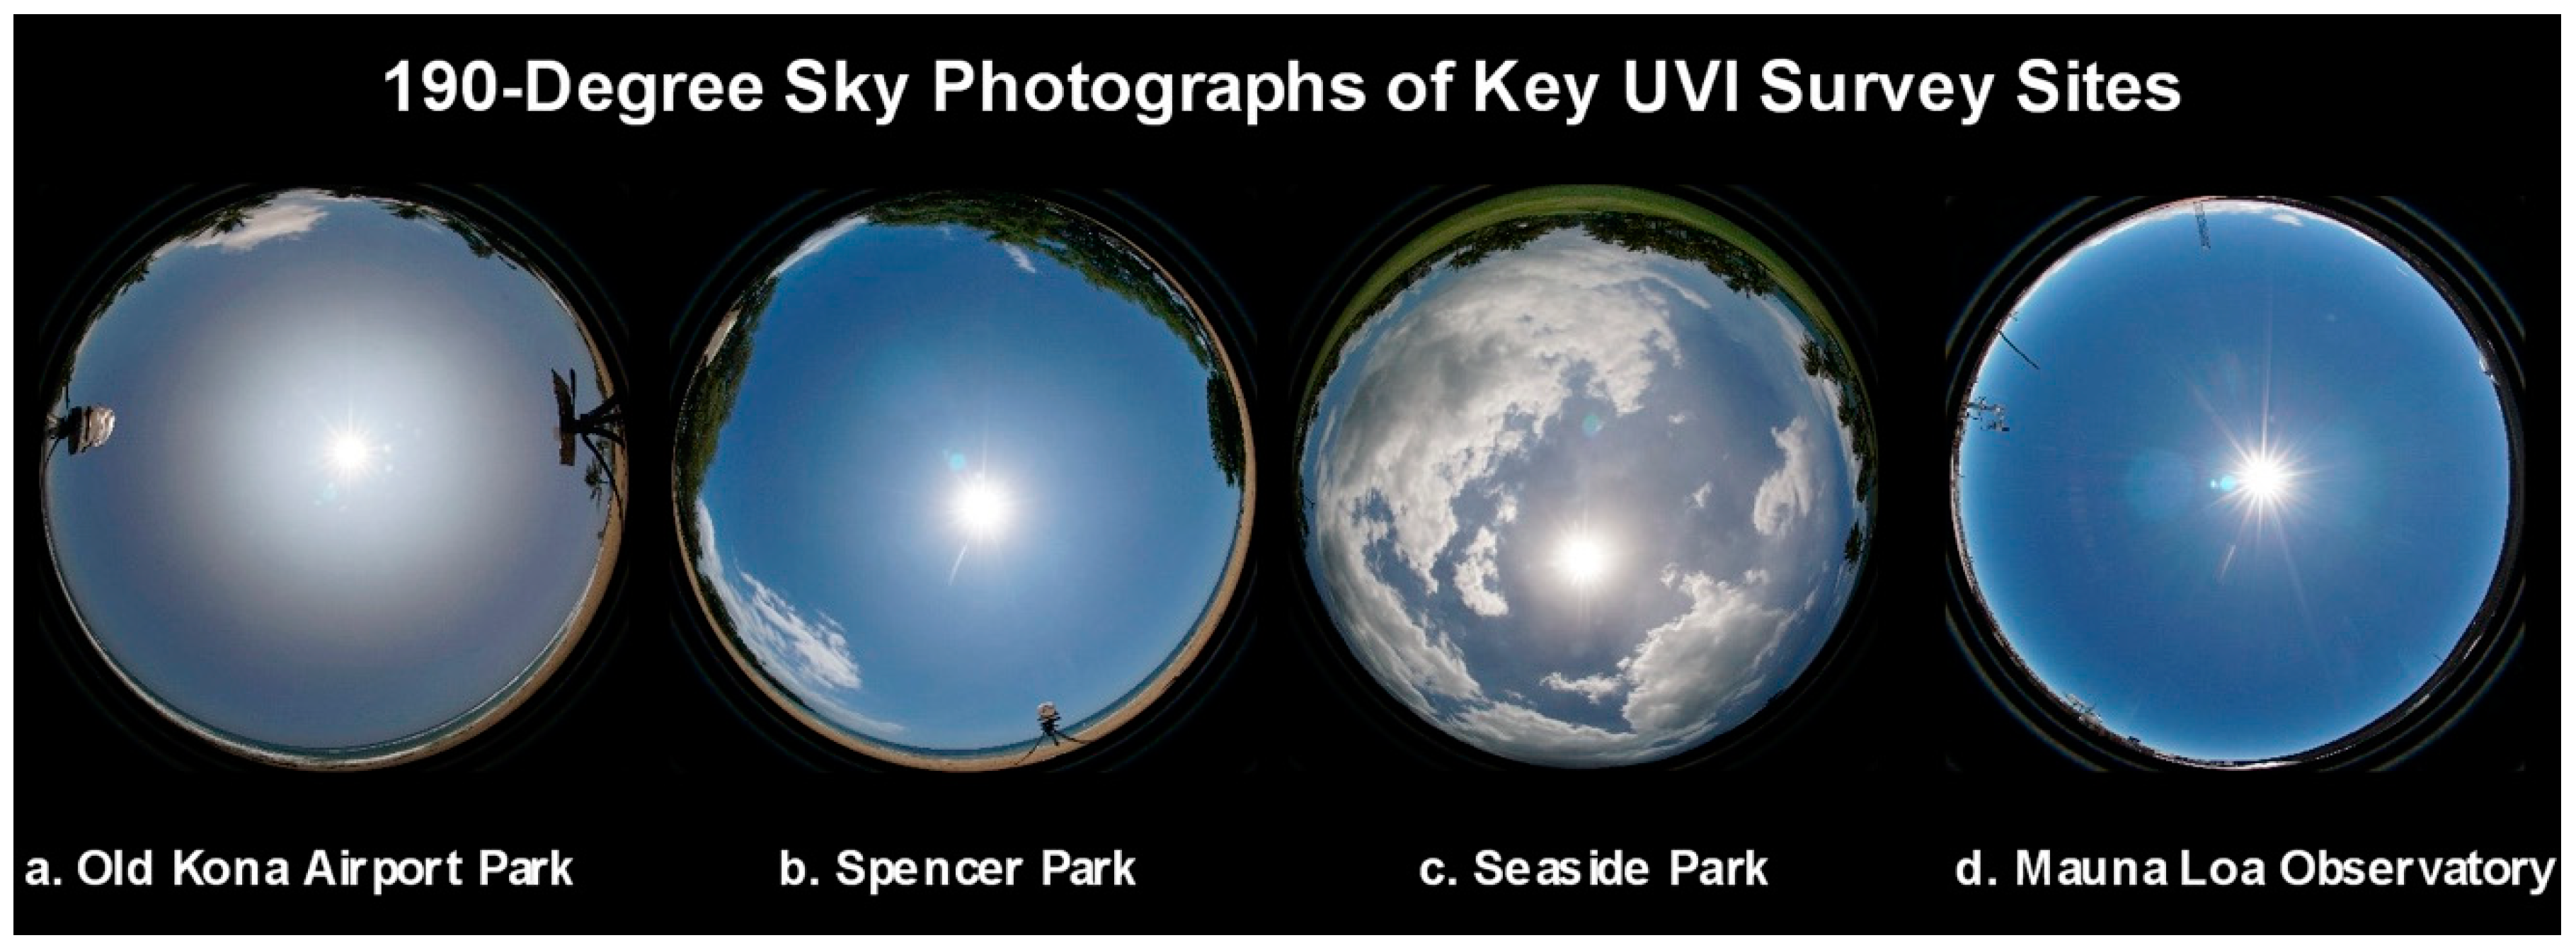
The sky over each measurement site was also photographed at intervals with a digital camera (Sony α6300) equipped with a lens having a 190° (2.17π sr) FOV (Meike 6.5 mm f/2.0 Circular Fisheye Lens). These images, four of which are shown in Figure 15, show the entire sky and provide a visually obvious depiction of haze. Their outer edges show surrounding trees, soil, water, and structures.
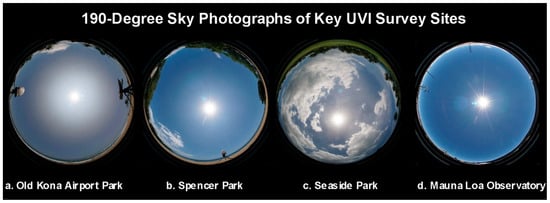
Figure 15.
Full sky photographs at the four measurement sites in Figure 14.
Virtual reality (VR) cameras produce omnidirectional images with a spherical, 360° (4π sr) FOV of view of the entire sky and surrounding terrain, which can be depicted in various formats (Figure 16). We employed a miniature VR camera (Xiaomi Mijia Mi Dual-Lens Sphere Action Cam) with a pair of 190° (2.17π sr) lenses, one on each side of this shirt-pocket camera. There is sufficient overlap in the FOV of the two lenses to block a rod used to support the camera, thereby providing images that suggest the camera is floating in the air.
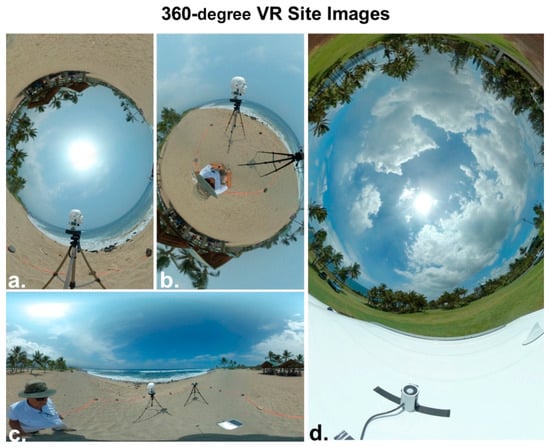
Figure 16.
The three virtual reality (VR) images at left (a–c) were made at the Old Kona Airport Park. They show the entire sky and the trees, ground and surf surrounding the rotating mannequin head and the PMA1102 sensor. The VR image at right (d) shows the sky and landscape at Seaside Estates Park on 5 August 2018, the day Fissure 8 of the Kilauea volcano ceased erupting. The UVR from the sun and sky in this image was being measured by the rotating mannequin head and the PMA1102 UV sensor in the foreground, which is mounted atop the project’s rental car.
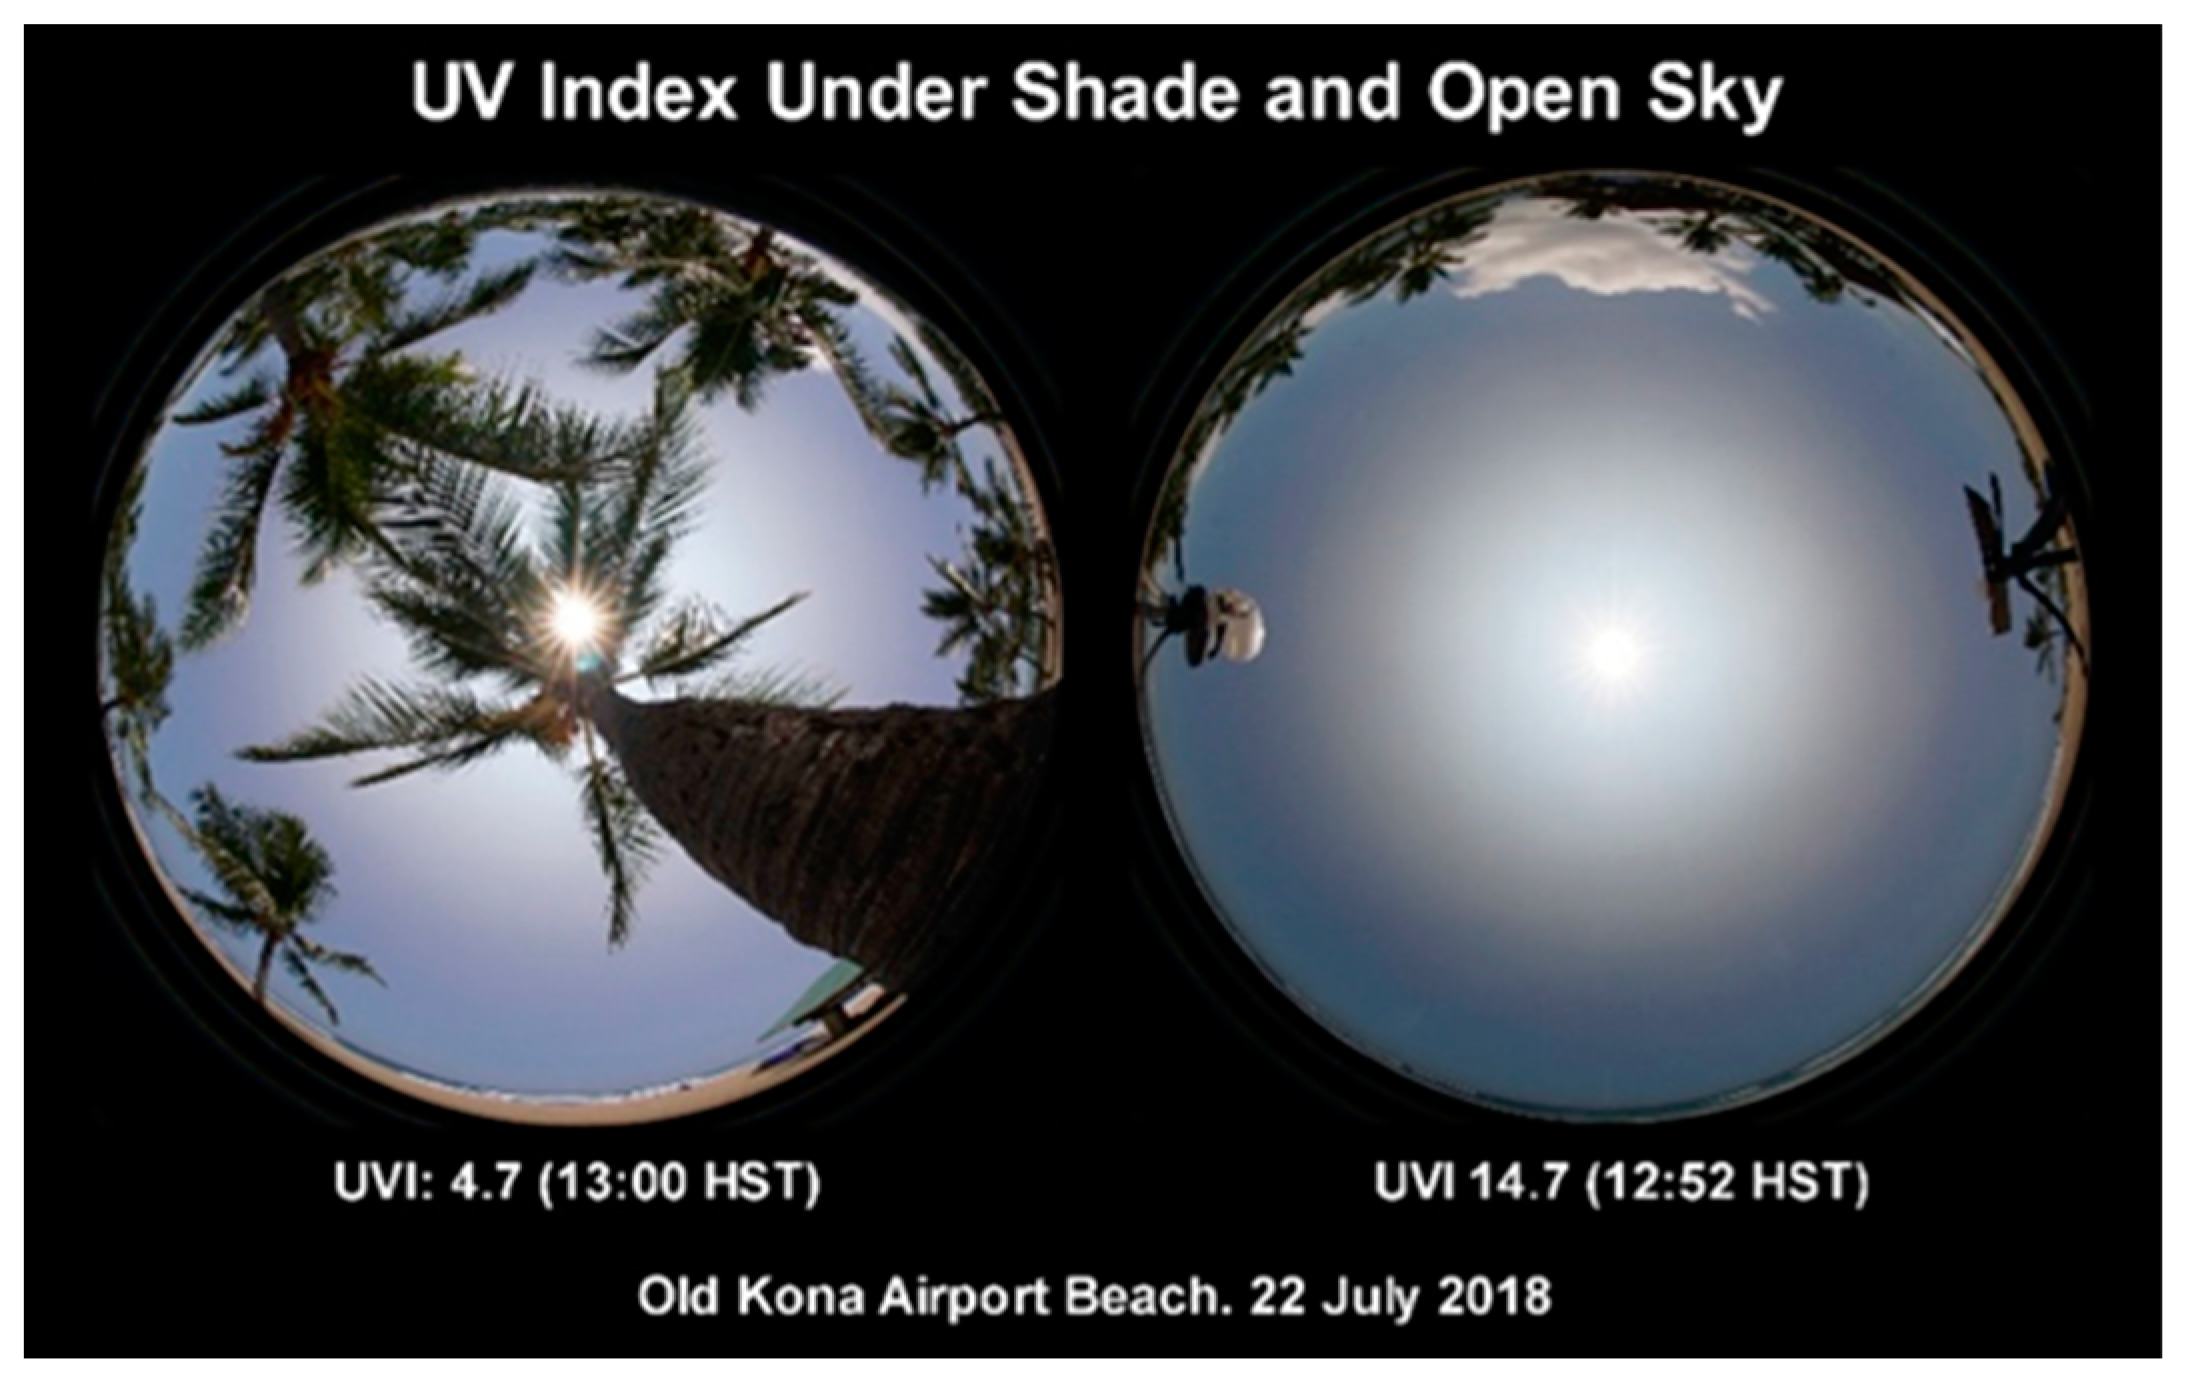
Our cameras captured images of the sky intended for a webpage for the public that describes how shade and a hazy sky affect UVI. While the role of shade in reducing the UVI is intuitive, the image of the sky through coconut palms in Figure 17 shows that significant UVR can leak through overhead branches. The public may not know that diffuse UVR scattered from a sky polluted with aerosols can exceed direct sun UVR. This is also illustrated in Figure 17, a photo of the open sky veiled by thick haze caused by volcanic vog. UVR from the diffuse sky in this image was 62% of the total UVR, while only 38% arrived from the direct sun.
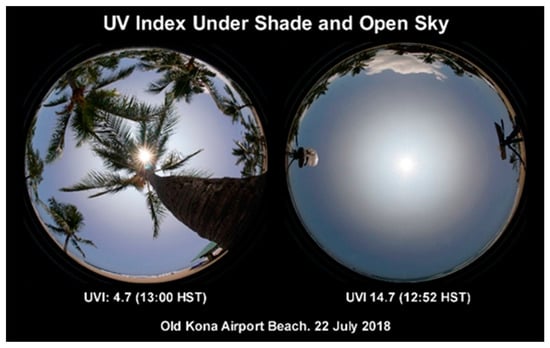
Figure 17.
UVI in the shade of palm trees (4.7) and under an open sky (14.7) at the Old Kona Airport Park beach at near noon on 22 July 2018. The prominent solar aureole was caused by vog.
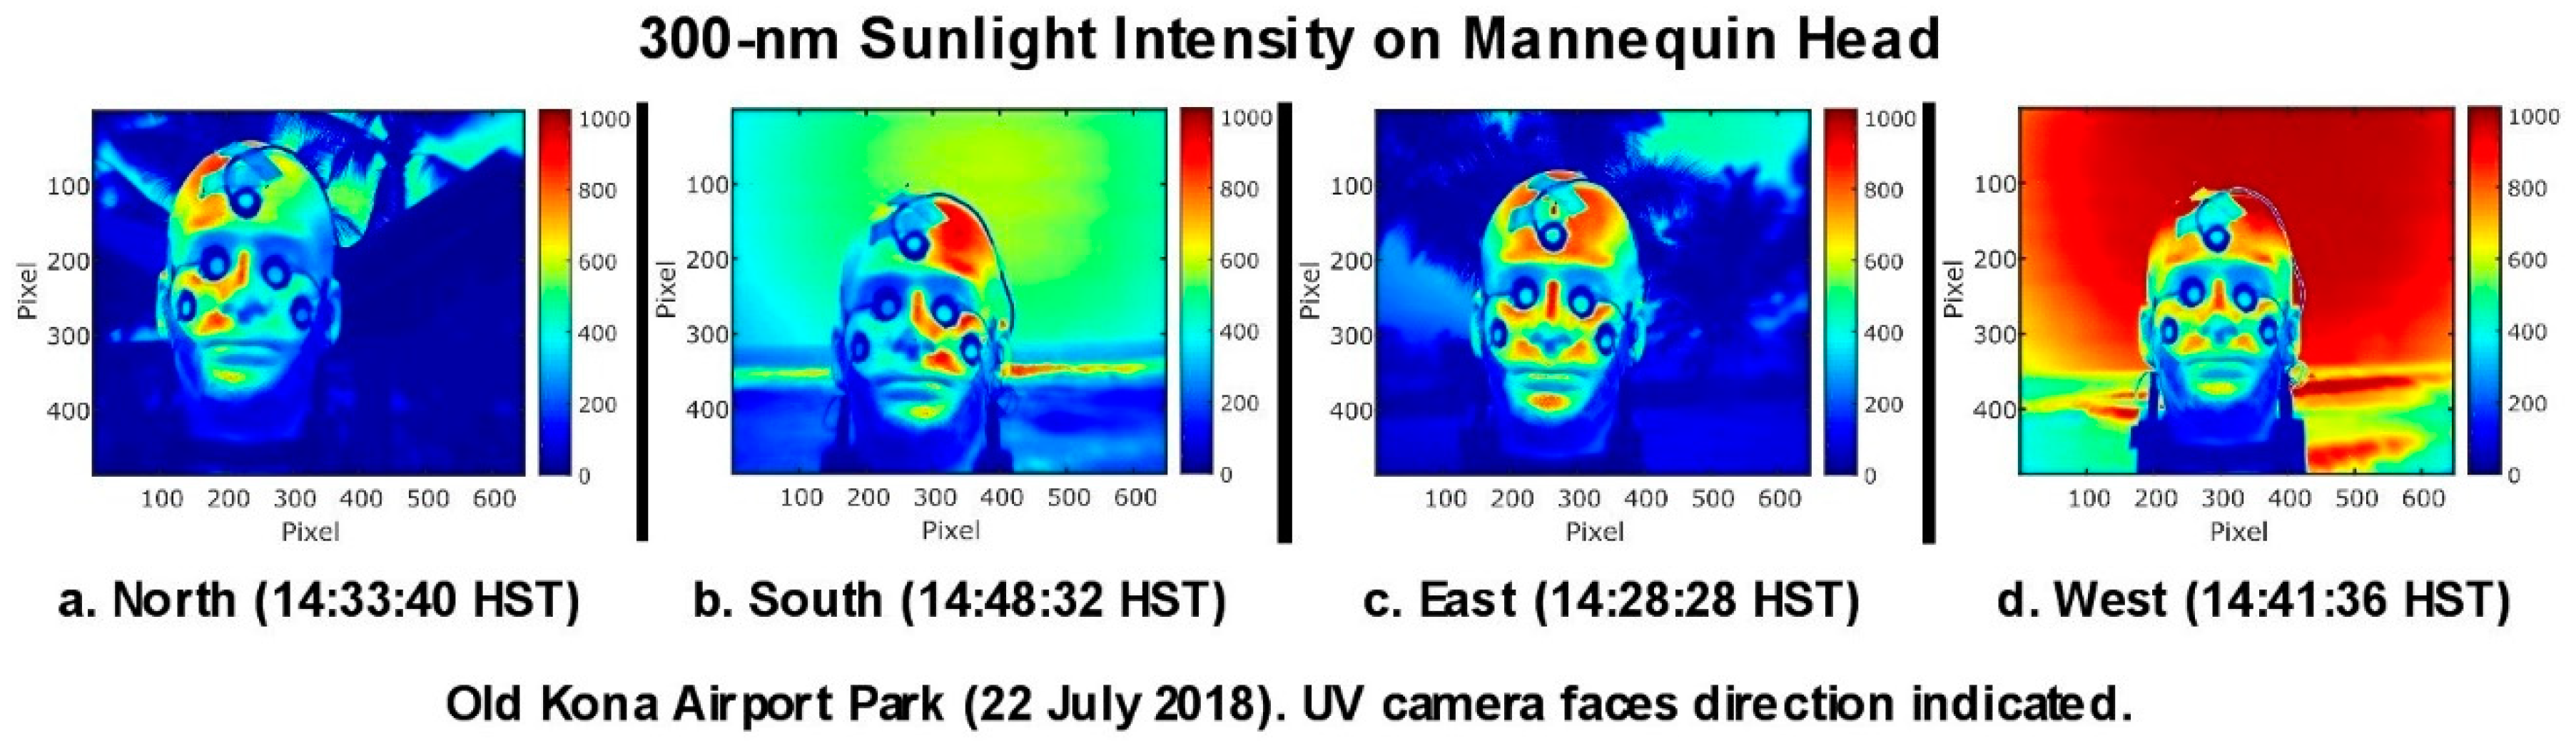
A novel, low-cost UV camera [49] that could be fitted with various UVR filters was used to make several hundred UV photos of the mannequin head at the Old Kona Airport Park beach. The ozone column blocks virtually all sunlight below 295 nm. Thus, the UV camera’s spectral response with a 300-nm filter (40 nm FWHM) approximated that of the UVB portion of the erythemal action spectrum. The color-coded versions of these images (TW) in Figure 18 clearly indicate significant variations in the intensity of the UVR illuminating the mannequin’s head’s face at midafternoon when the head was pointed north, east, south, and west. While we have yet to analyze these images, we include them here to illustrate their potential merit.
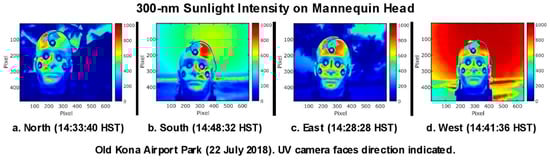
Figure 18.
These color-coded UVR images provide a visually obvious depiction of the UVR intensity at 300 nm across the mannequin head’s face. The forehead and nose are the most consistently illuminated areas.
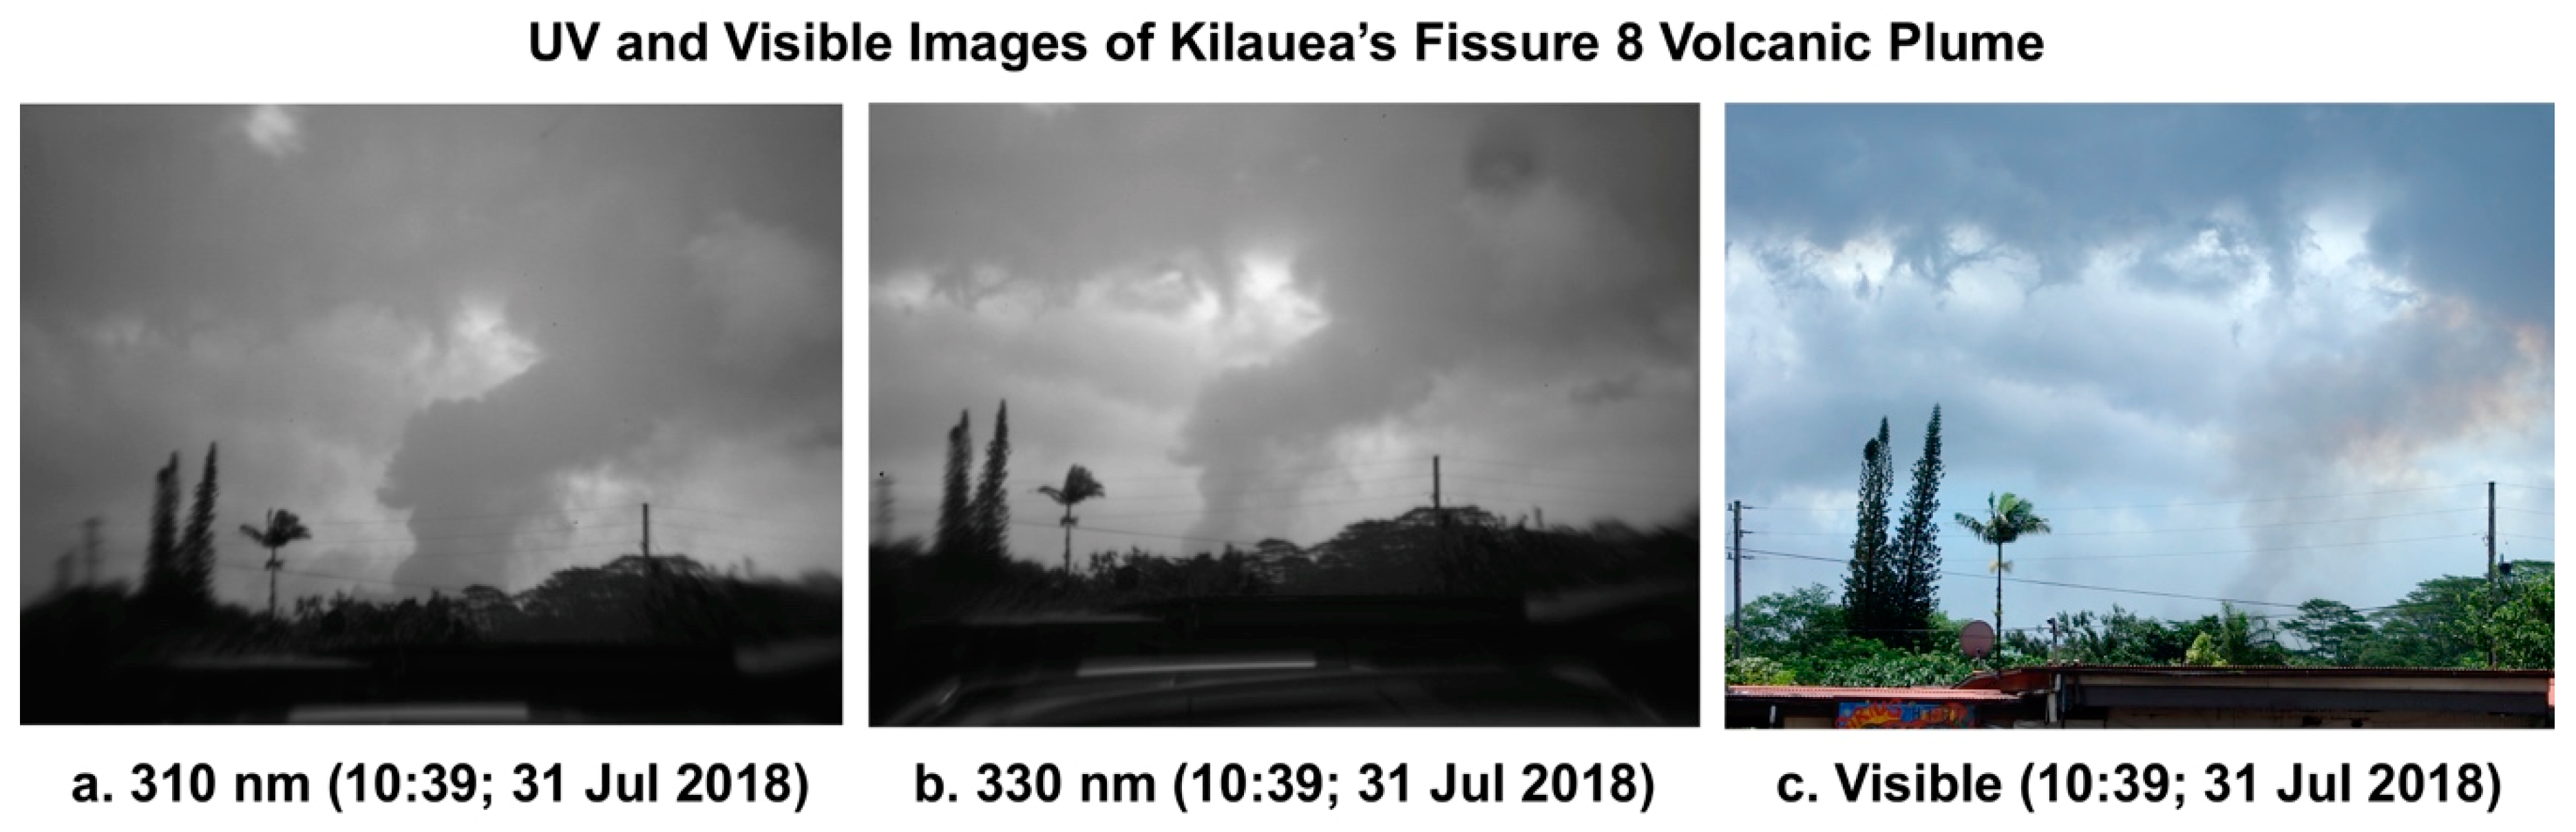
Finally, the historic eruption of Kilauea provided an opportunity to employ the UV camera technique commonly applied in volcanology [50,51,52] to make UV photographs of the major emission plume from what was then the world’s single largest emitter of SO2, which strongly absorbs UVR. The plume from Kilauea’s Fissure 8 is clearly visible in the UVR photographs in Figure 19a,b, both of which were made at 10:39 on 31 July 2018. Photograph (a) was made through a 310-nm filter (10 nm FWHM), a wavelength strongly absorbed by SO2. Photograph (b) was made through a 330-nm filter (10 nm FWHM), a wavelength weakly absorbed by SO2. This explains why the plume appears darker and larger in the 310-nm image. Some of the dark cloud to the left (east) of the plume is caused by SO2 rising from the lava flowing to the ocean from Fissure 8. Figure 19c is a visible light photograph made at the same time as the two UVR images. SO2 does not significantly absorb visible light. Thus, the plume appears much narrower and less dense than in the UVR images.
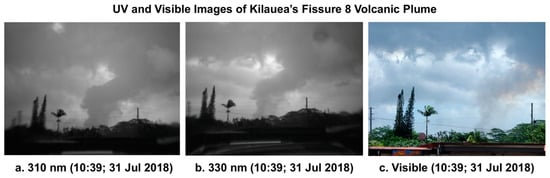
Figure 19.
The darkened tint of UVR images (a,b) clearly reveal the presence of significant SO2 in the volcanic plume emerging from Kilauea’s Fissure 8. Aerosols alone are responsible for the visibility of the plume in the visible image (c).
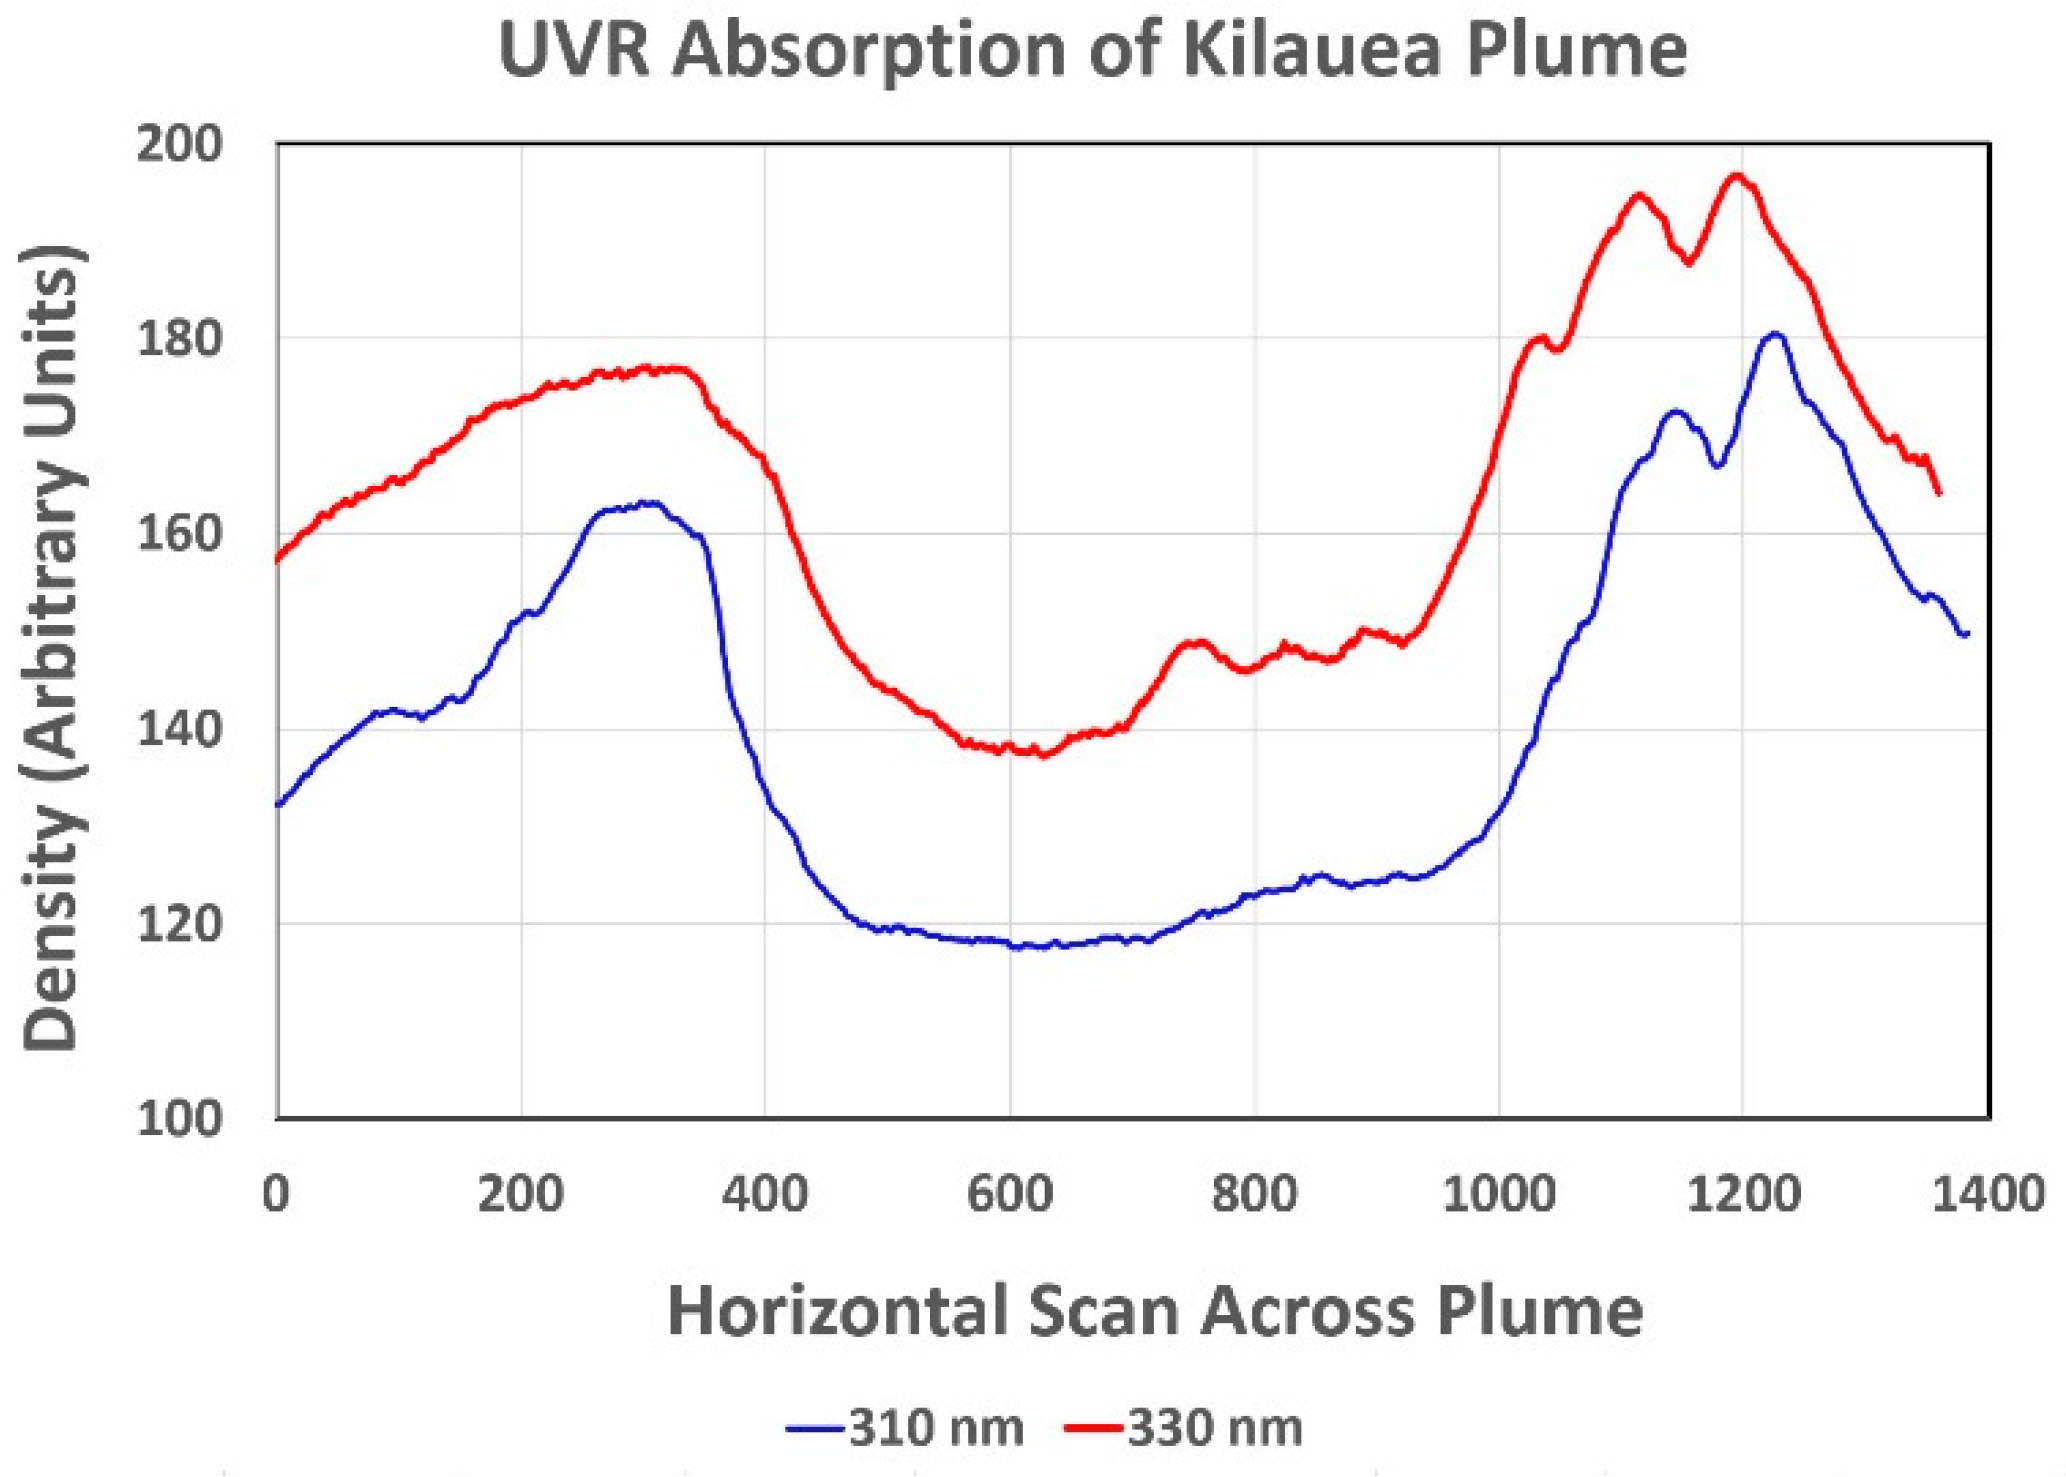
Horizontal scans with ImageJ image processing software across the plume between the tops of the palm tree at left and the utility pole at right in Figure 19a,b reveal the optical density of the 310- and 330-nm images. The resulting plots in Figure 20 show the enhanced absorption by SO2 at 310 nm that quantifies what is visually evident in Figure 19.
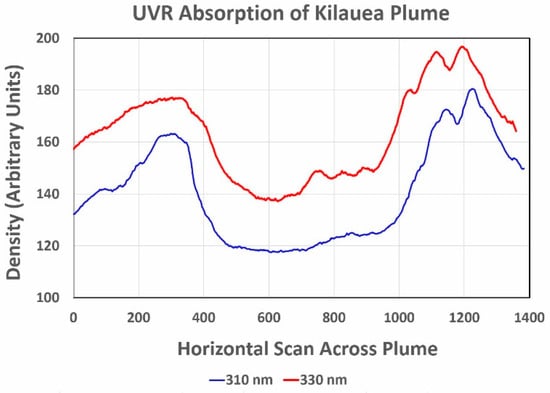
Figure 20.
Densitometry scans across the Kilauea plume in the 310- and 330-nm images in Figure 19 show the enhanced absorption by SO2 at 310 nm.
5. Conclusions
Our findings provided new insights into UVI under various sky conditions during our brief, 28-day field campaign across Hawai’i Island. We validated previous findings regarding the intensity profile of UVR on a simulated human face [27] with an easily constructed, economical rotating mannequin head equipped with UVR sensors that can be employed under a wide variety of outdoor conditions. We demonstrated that wide-angle, visible photography of the full sky and surrounding landscape and UV photography of a mannequin head illuminated with natural sunlight can inform studies of UVR measurements. The methods and protocols reported herein can be applied by professional and academic scientists with limited research budgets.
In particular, our mannequin head findings are applicable from the tropics to the temperate latitudes, for the rotational profiles of the mannequin head measurements by Wang et al. [27] at 30.01° N (May 27, 30, 2010, minimum SZA = 8°) resemble ours first made at Geronimo Creek Observatory, Texas, at 29.61° N (6 July 2018, minimum SZA = 6°) 15 days prior to the first Hawai’i test.
We believe that the UVI provides valuable, easily understood information for the public. The UVR measurements during this study suggest that individuals who rely on the UVI to govern their UVR exposure, especially in the tropics and subtropics where extreme levels of UVR prevail, will benefit from an expanded explanation of the factors that alter the Index. For example, haze and clouds often and unpredictably reduce direct UVR while increasing diffuse UVR. These effects often altered the UVI during the present study and lend support to Blumthaler’s suggestion [53] that the public would be better served if the daily UVI forecast could be updated in real time on the World Wide Web.
We particularly agree with the observation by McKenzie et al. [54] that: “There are problems with the way UV information is presented. … the complex 3D geometry of a human might need to be taken into account.” Our mannequin head UVR sensors measured significantly diminished UVI on the cheeks, ears and eyes of the simulated face of a person standing, walking or seated outdoors at noon when the downwelling UVR is highest. Populations subject to high UVI levels should be informed that the UVI applies more to reclining people (e.g., lying on a beach) whose bodies are much more exposed to sunlight at solar noon than the faces of people who are walking, standing, or seated outdoors. This information is not provided in the UVI publications intended for the public that we have reviewed and could be easily added in a few lines of text, perhaps alongside a schematic figure of a vertical human face receiving less UVR when the sun is high in the sky than when it is somewhat lower.
While photographs of the sky are uncommon in published UVR studies, the visible light 190° and 360° VR photos included in this study illustrate the value of photography in providing scientifically useful information about the presence of clouds, haze, trees, structures, water, ocean surf, soil, and ground cover, all of which can enhance or reduce UVR. Such photographs can also better inform the public about the circumstances that influence the UVI. We are hopeful that our use of sky and landscape photography will be emulated by other UVR investigators. Furthermore, while UV cameras are highly specialized, we learned that color-coded imagery from a UV camera can provide important information about the distribution of UVR across the simulated human face provided by a mannequin head.
This study encountered two unexpected natural phenomena not included in our research plan. The first was significant SO2 from an historically persistent and immense volcanic plume. Because ozone and SO2 have similar UVR absorption spectra, SO2 emissions from industrial sources and thermal power plants can falsely inflate surface-based measurements of the total ozone column. Our measurements found that volcanic SO2 can cause a similar result. On 4 August, Microtops II measured up to 410 DU of ozone through openings to the sun in the volcanic eruption cloud when the average of 99 total ozone measurements from several sites well away from the eruption cloud on 24–26 July was 270 DU. Thus, volcanic SO2 inflated our ozone readings by up to 52% (Figure 11).
The second unexpected event occurred shortly before noon on 7 August when a massive plume of forest fire smoke drifted over MLO and its suite of UVR and ozone instruments. This was an especially unusual event, for MLO is an alpine site famous for its very clear skies. The average UVI measured before, during and after the smoke event by the PMA1102 UVR sensor (14.0) was remarkably close to that measured by a CSU broadband radiometer standard (14.06), Brewer 009 (14.5) and Brewer 119 (14.05). Particularly notable is that these measurements were made from a maximum SZA of 26.7° to a minimum of just 3°. These results are plotted in Figure 12, and they give confidence to the ozone-corrected calibration that we used for the PMA1102.
While our schedule was sufficiently flexible to measure and photograph these highly unusual phenomena, we neglected to make horizontal 190° photos (Figure 8) of the four ordinates at each measurement site. Those photos that we did make clearly illustrate the role, if not the magnitude, of the surface and the sky as the mannequin head rotated. We also neglected to make periodic diffuse sky UVI measurements at every site beyond one at MLO (31%), one at Kona (62%), and one at Spencer Beach (48%). Together, these missing images and data would likely have contributed toward a much better understanding of the role of the ever-changing diffuse component of the data as the head rotated. Accordingly, we propose to address these issues in a future study, while acknowledging that the sky and the natural environment are so variable that there will be no simple answers.
Author Contributions
Conceptualization, F.M.M. and A.J.S.M.; methodology, F.M.M., A.J.S.M. and T.C.W.; software, T.C.W.; validation, F.M.M., A.V.P. and W.B.G.; formal analysis, F.M.M., A.V.P. and W.B.G.; investigation, F.M.M., A.J.S.M. and T.C.W.; resources, F.M.M., T.C.W., J.M.C. and T.D.P.; data curation, F.M.M., A.J.S.M. and T.C.W.; writing—original draft preparation, F.M.M.; writing—review and editing, F.M.M., A.J.S.M., T.C.W., A.V.P., W.B.G. and J.M.C.; visualization, F.M.M. and T.C.W.; supervision, A.J.S.M.; project administration, A.J.S.M.; funding acquisition, A.J.S.M. and J.M.C.
Funding
The Rolex Awards for Enterprise made this study possible by providing funds for UVR instruments, specialized visible photography and travel. Rolex had no role in the design of the study; the collection, analyses, or interpretation of data; or the writing of the manuscript. A.J.S.M. and J.M.C. acknowledge support of UK National Environmental Research Council Grant NE/M021084/1.
Acknowledgments
The Hawai’i Film Office provided permission for making photographs and videos at the two beach sites. Residents of Seaview Estates gave permission for measurements from their private park. The principal of the Pāhoa High and Intermediate School allowed us to make photographs of the Fissure 8 eruption plume from a campus building. The Mauna Loa Observatory provided permission to make measurements, photographs and videos at its alpine site. David R. Brooks constructed the UVB photodiode holders and diffusers. Broadband and direct sun UVR measurements at MLO were provided by George Janson and Becky Olson of the UV-B Monitoring Climatological and Research Network, Colorado State University. Akira Ogyu of Environment and Climate Change Canada provided preliminary data for Brewers 009 and 119 at the MLO. Robert Evans of NOAA provided helpful assistance concerning the interference by SO2 with Microtops II ozone measurements. We thank three anonymous reviewers for their thoughtful suggestions that greatly improved the manuscript.
Conflicts of Interest
F.M.M. receives a royalty on sales of Microtops II from Solar Light Company, Inc. Otherwise, the authors assert they have no conflicts of interest regarding the research reported herein. The use or mention of commercial products does not constitute an endorsement.
References
- USDA UV-B Monitoring and Research Program, Colorado State University 2018. Available online: https://uvb.nrel.colostate.edu/UVB/index.jsf (accessed on 9 December 2018).
- Nullet, D.; Juvik, J.O. Measured Altitudinal Profiles of UV-B Irradiance in Hawai’i. Phys. Geogr. 1997, 18, 335–345. [Google Scholar] [CrossRef]
- Grainger, R.G.; Basher, R.E.; McKenzie, R.L. UV-B Robertson-Berger characterization and field calibration. App. Opt. 1993, 32, 343–349. [Google Scholar] [CrossRef] [PubMed]
- Voiland, A. Tracking the Kilauea Eruption. In NASA Earth Observatory; 2018. Available online: https://earthobservatory.nasa.gov/blogs/earthmatters/2018/05/14/tracking-the-kilauea-eruption/ (accessed on 9 December 2018).
- Kerr, J.B. Understanding the factors that affect surface ultraviolet radiation. Opt. Eng. 2005, 44, 041002. [Google Scholar] [CrossRef]
- Mims, F.M., III; Frederick, J.E. Cumulus Clouds and UV-B. Nature 1994, 371, 291. [Google Scholar] [CrossRef]
- Moan, J.; Dahlback, A.; Setlow, R.B. Epidemiological support for an hypothesis for melanoma induction indicating a role for UVA radiation. Photochem. Photobiol. 1999, 70, 243–247. [Google Scholar] [CrossRef]
- Grant, W.B. The UVB-vitamin D3-skin pigmentation hypothesis is alive and well. Am. J. Phys. Anthropol. 2016, 61, 752–755. [Google Scholar] [CrossRef]
- Moukayed, M.; Grant, W.B. Molecular link between vitamin D and cancer prevention. Nutrients 2013, 5, 3993–4023. [Google Scholar] [CrossRef] [PubMed]
- Grant, W.B. A multicountry ecological study of cancer incidence rates in 2008 with respect to various risk-modifying factors. Nutrients 2013, 6, 163–189. [Google Scholar] [CrossRef]
- World Health Organization, Ultraviolet Radiation. 2018. Available online: https://www.who.int/uv/sun_protection/en/ (accessed on 2 January 2019).
- Kerr, J.B.; McElroy, C.T.; Tarasick, D.W.; Wardle, D.I. The Canadian Ozone Watch and UV-B Advisory programs. Ozone in the troposphere and stratosphere, Part 2. In Proceedings of the Quadrennial Ozone Symposium, Charlottesville, VR, USA, 4–13 June 1992; Hudson, R.D., Ed.; International Ozone Commission: NASA. Goddard Space Flight Center. 1994; pp. 794–797. Available online: https://ntrs.nasa.gov/search.jsp?R=19950004680 (accessed on 8 December2018).
- Fioletov, V.; Kerr, J.; Fergusson, A. The UV Index: Definition, Distribution and Factors Affecting It. Can. J. Public Health 2010, 101, I5–I9. [Google Scholar]
- World Health Organization. Global Solar Uv Index: A Practical Guide; WHO/SDE/OEH/02.2; World Health Organization: Geneva, Switzerland, 2002. [Google Scholar]
- World Meteorological Organization. Global Atmospheric Watch (GAW): UV Radiation; World Health Organization: Geneva, Switzerland, 2018; Available online: https://www.wmo.int/pages/prog/arep/gaw/UV-radiation.html (accessed on 9 December2018).
- McKinlay, A.F.; Diffey, B.L. A Reference Action Spectrum for Ultraviolet Induced Erythema in Human Skin. CIE J. 1987, 6, 17–22. [Google Scholar]
- Webb, A.R.; Slaper, H.; Koepke, P.; Schmalvieser, A. Know your standard: clarifying the CIE erythema spectrum. Photochem. Photobiol. 2011, 87, 483–486. [Google Scholar] [CrossRef] [PubMed]
- He, H.; Fioletov, V.E.; Tarasick, D.W.; Mathews, T.W.; Long, C. Validation of Environment Canada and NOAA UV Index Forecasts with Brewer Measurements from Canada. J. Appl. Meteorol. Climatol. 2013, 52, 1477–1489. [Google Scholar] [CrossRef]
- Cadet, J.M.; Bencherif, H.; Portafaix, T.; Lamy, K.; Ncongwane, K.; Coetzee, G.J.R.; Wright, C.Y. Comparison of Ground-Based and Satellite-Derived Solar UV Index Levels at Six South African Sites. Int. J. Environ. Res. Public Health 2017, 14, 1384. [Google Scholar] [CrossRef] [PubMed]
- Reichrath, J. Skin cancer prevention and UV-protection: how to avoid vitamin D-deficiency? Br. J. Dermatol. 2009, 161, 54–60. [Google Scholar] [CrossRef]
- McKenzie, R.L.; Lucas, R.M. Reassessing Impacts of Extended Daily Exposure to Low Level Solar UV Radiation. Nat. Sci. Rep. 2018, 8, 13805. [Google Scholar] [CrossRef] [PubMed]
- Gies, P.; van Deventer Green, A.C.; Sinclair, C.; Tinker, R. Review of the Global Solar UV Index 2015 Workshop Report. Health Phys. 2018, 114, 84–90. [Google Scholar] [CrossRef]
- Davis, A.; Deane, G.H.W.; Diffey, B.L. Possible dosimeter for ultraviolet radiation. Nature 1976, 261, 169–170. [Google Scholar] [CrossRef]
- Downs, N.J.; Kimlin, M.G.; Parisi, A.V.; McGrath, J.J. Modelling human facial UV exposure. Rad. Prot. Australas. 2001, 17, 103–109. [Google Scholar]
- Parisi, A.V.; Eley, R.; Downs, N. Determination of the Usage of Shade Structures via a Dosimetry Technique. Photochem. Photobiol. 2012, 88, 1012–1015. [Google Scholar] [CrossRef] [PubMed]
- Downs, N.; Parisi, A. Three dimensional visualisation of human facial exposure to solar ultraviolet. Photochem. Photobiol. Sci. 2007, 6, 90–98. [Google Scholar] [CrossRef] [PubMed]
- Wang, F.; Yu, J.M.; Yang, D.Q.; Gao, Q.; Hua, H.; Liu, Y. Distribution of Facial Exposure to Non-melanoma Biologically Effective UV Irradiance Changes by Rotation Angles. Biomed. Environ. Sci. 2017, 30, 113–127. [Google Scholar]
- Mims, F.M., III. Sunburn Sensors. MAKE Mag. 2018, 65, 56–58. [Google Scholar]
- Bigelow, D.S.; Slusser, J.R.; Beaubien, A.F.; Gibson, J.H. The USDA Ultraviolet Radiation Monitoring Program. Bull. Am. Meteorol. Soc. 1998, 79, 601–615. [Google Scholar] [CrossRef]
- McKenzie, R.L.; Matthews, W.A.; Johnston, P.V. The relationship between erythemal UV and ozone, derived from spectral irradiance measurements. Geophys. Res. Lett. 1991, 18, 2269–2272. [Google Scholar] [CrossRef]
- Seckmeyer, G.; Bais, A.; Bernhard, G.; Blumthaler, M.; Booth, C.R.; Lantz, K.; McKenzie, R.L. Instruments to Measure Solar Ultraviolet Radiation, Part 2: Broadband Instruments Measuring Erythemally Weighted Solar Irradiance; Global Atmosphere Watch No. 164; World Meteorological Organization: Geneva, Switzerland, 2008; Available online: http://library.wmo.int/pmb_ged/wmo-td_1289.pdf (accessed on 15 March 2019).
- Krins, A.; Bolsée, B.; Dörschel, B.; Gillotay, D.; Knuschke, P. Angular Dependence of the Efficiency of the UV Sensor Polysulphone Film. Radiat. Prot. Dosim. 2000, 87, 261–266. [Google Scholar] [CrossRef]
- Mims, F.M. Dual-Channel Solar Radiometer with Interchangeable UV and Visible Sensors. Unpublished work. 1994. [Google Scholar]
- Swift, N.; Hülsen, G.; Nield, K.; Gröbner, J.; Hamlin, J. Calibration of erythemally weighted broadband instruments: A comparison between PMID/WRC and MSL. In AIP Conference Proceedings; American Institute of Physics: College Park, MD, USA, 2013; Volume 1531, p. 817. [Google Scholar]
- Hülsen, G.; Gröbner, J. Characterization and calibration of ultraviolet broadband radiometers measuring erythemally weighted irradiance. App. Opt. 2007, 46, 5877–5886. [Google Scholar] [CrossRef]
- Tamar, E.; Sutton, A.J. Volcanic Air Pollution Hazards in Hawai’i. USGS Fact Sheet 2017–3017. Available online: htttps://doi.org/10.3133/fs20173017 (accessed on 25 February 2019).
- Hawai’i Volcano Observatory. Kīlauea 2018 events mark a watershed for volcano science. In Volcano Watch; 25 October 2018. Available online: https://volcanoes.usgs.gov/observatories/hvo/hvo_volcano_watch.html?vwid=1388 (accessed on 8 December2018).
- Wilkes, T.C.; McGonigle, A.J.S.; Willmott, J.R.; Pering, T.D.; Cook, J.M. Low-cost 3D printed 1 nm resolution smartphone sensor-based spectrometer: Instrument design and application in ultraviolet spectroscopy. Opt. Lett. 2017, 42, 4323–4326. [Google Scholar] [CrossRef]
- Zerefos, C.S.; Mantis, H.T.; Bais, A.F.; Ziomas, I.C.; Zoumakis, N. Solar ultraviolet absorption by sulphur dioxide in Thessaloniki, Greece. Atmosphere-Ocean 1986, 24, 292–300. [Google Scholar] [CrossRef]
- Komhyr, W.D.; Evans, R.D. Dobson spectrophotometer measurement errors caused by interfering absorbing species such as SO2, NO2 and photochemically produced O3, in polluted air. Geophys. Res. Lett. 1980, 7, 157–160. [Google Scholar] [CrossRef]
- Morys, M.; Mims, F.M., III; Hagerup, S.; Anderson, S.E.; Baker, A.; Kia, J.; Walkup, T. Design, calibration, and performance of MICROTOPS II handheld ozone monitor and Sun photometer. J. Geophys. Res. 2001, 6, 14573–14582. [Google Scholar] [CrossRef]
- U.S. Geological Survey Hawaiian Volcano Observatory Scientists and Affiliates. Volcano Watch: Significant Changes in Air Quality. Big Island Now. 23 August 2018. Available online: http://bigislandnow.com/2018/08/23/volcano-watch-significant-changes-in-air-quality/ (accessed on 25 February 2019).
- National Park Service, Hawai’i Volcanoes National Park News Release, Keauhou Ranch Fire. 16 August 2018. Available online: https://www.nps.gov/havo/keauhou-ranch-fire.htm (accessed on 15 March 2019).
- Waters, L.; Mauna Loa Solar Observatory, Hilo, HI, USA. Personal communication, 2018.
- Mims, F.M., III. How to Monitor Ultraviolet Radiation from the Sun. Sci. Am. 1990, 263, 106–109. [Google Scholar] [CrossRef]
- Mims, F.M., III. Significant Reduction in UV-B Caused by Smoke from Biomass Burning in Brazil. Photochem. Photobiol. 1996, 64, 123–125. [Google Scholar]
- Mims, F.M., III. Avian Influenza and UV-B Blocked by Biomass Smoke. Environ. Health Perspect. 2005, 113, A806–A807. [Google Scholar] [CrossRef]
- Mims, F.M., III. How to photograph the solar aureole. Make Mag. 2009, 17, 48–50. [Google Scholar]
- Wilkes, T.C.; McGonigle, A.J.; Pering, T.D.; Taggart, A.J.; White, B.S.; Bryant, R.G.; Willmott, J.R. Ultraviolet imaging with low cost smartphone sensors: Development and application of a raspberry Pi-based UV camera. Sensors 2016, 6, 1649. [Google Scholar] [CrossRef]
- Mori, T.; Burton, M. The SO2 camera: A simple, fast and cheap method for ground-based imaging of SO2 in volcanic plumes. Geophys. Res. Lett. 2006, 33, L24804. [Google Scholar] [CrossRef]
- Kern, C.; Werner, C.; Elias, T.; Sutton, A.J.; Lübcke, P. Applying UV cameras for SO2 detection to distant or optically thick volcanic plumes. J. Volcanol. Geotherm. Res. 2013, 262, 80–89. [Google Scholar] [CrossRef]
- Kern, C.; Lübcke, P.; Bobrowski, N.; Campion, R.; Mori, T.; Smekens, J.-F.; Stebel, K.; Tamburello, G.; Burton, M.R.; Platt, U.; et al. Intercomparison of SO2 camera systems for imaging volcanic gas plumes. J. Volcanol. Geotherm. Res. 2015, 300, 22–36. [Google Scholar] [CrossRef]
- Blumthaler, M. UV Monitoring for Public Health. Int. J. Environ. Res. Public Health 2018, 15, 1723. [Google Scholar] [CrossRef] [PubMed]
- McKenzie, R.; Blumthaler, M.; Diaz, S.; Fioletov, V.; Herman, J.; Seckmeyer, G.; Smedley, A.; Webb, A. Rationalizing Nomenclature for UV Doses and Effects on Humans, CIE and WMO; WMO/GAW Report; Commission Internationale De L’eclairage Cie Central Bureau Babenbergerstrasse: Vienna, Austria, 2014; No. 211; Available online: https://library.wmo.int/pmb_ged/gaw_211_en.pdf (accessed on 8 December 2018).


© 2019 by the authors. Licensee MDPI, Basel, Switzerland. This article is an open access article distributed under the terms and conditions of the Creative Commons Attribution (CC BY) license (http://creativecommons.org/licenses/by/4.0/).