Trends and Determinants of Antenatal Care Service Use in Ethiopia between 2000 and 2016


Abstract
:1. Introduction
2. Methods
2.1. Data Sources
2.2. Study Setting
2.3. Outcome Variable
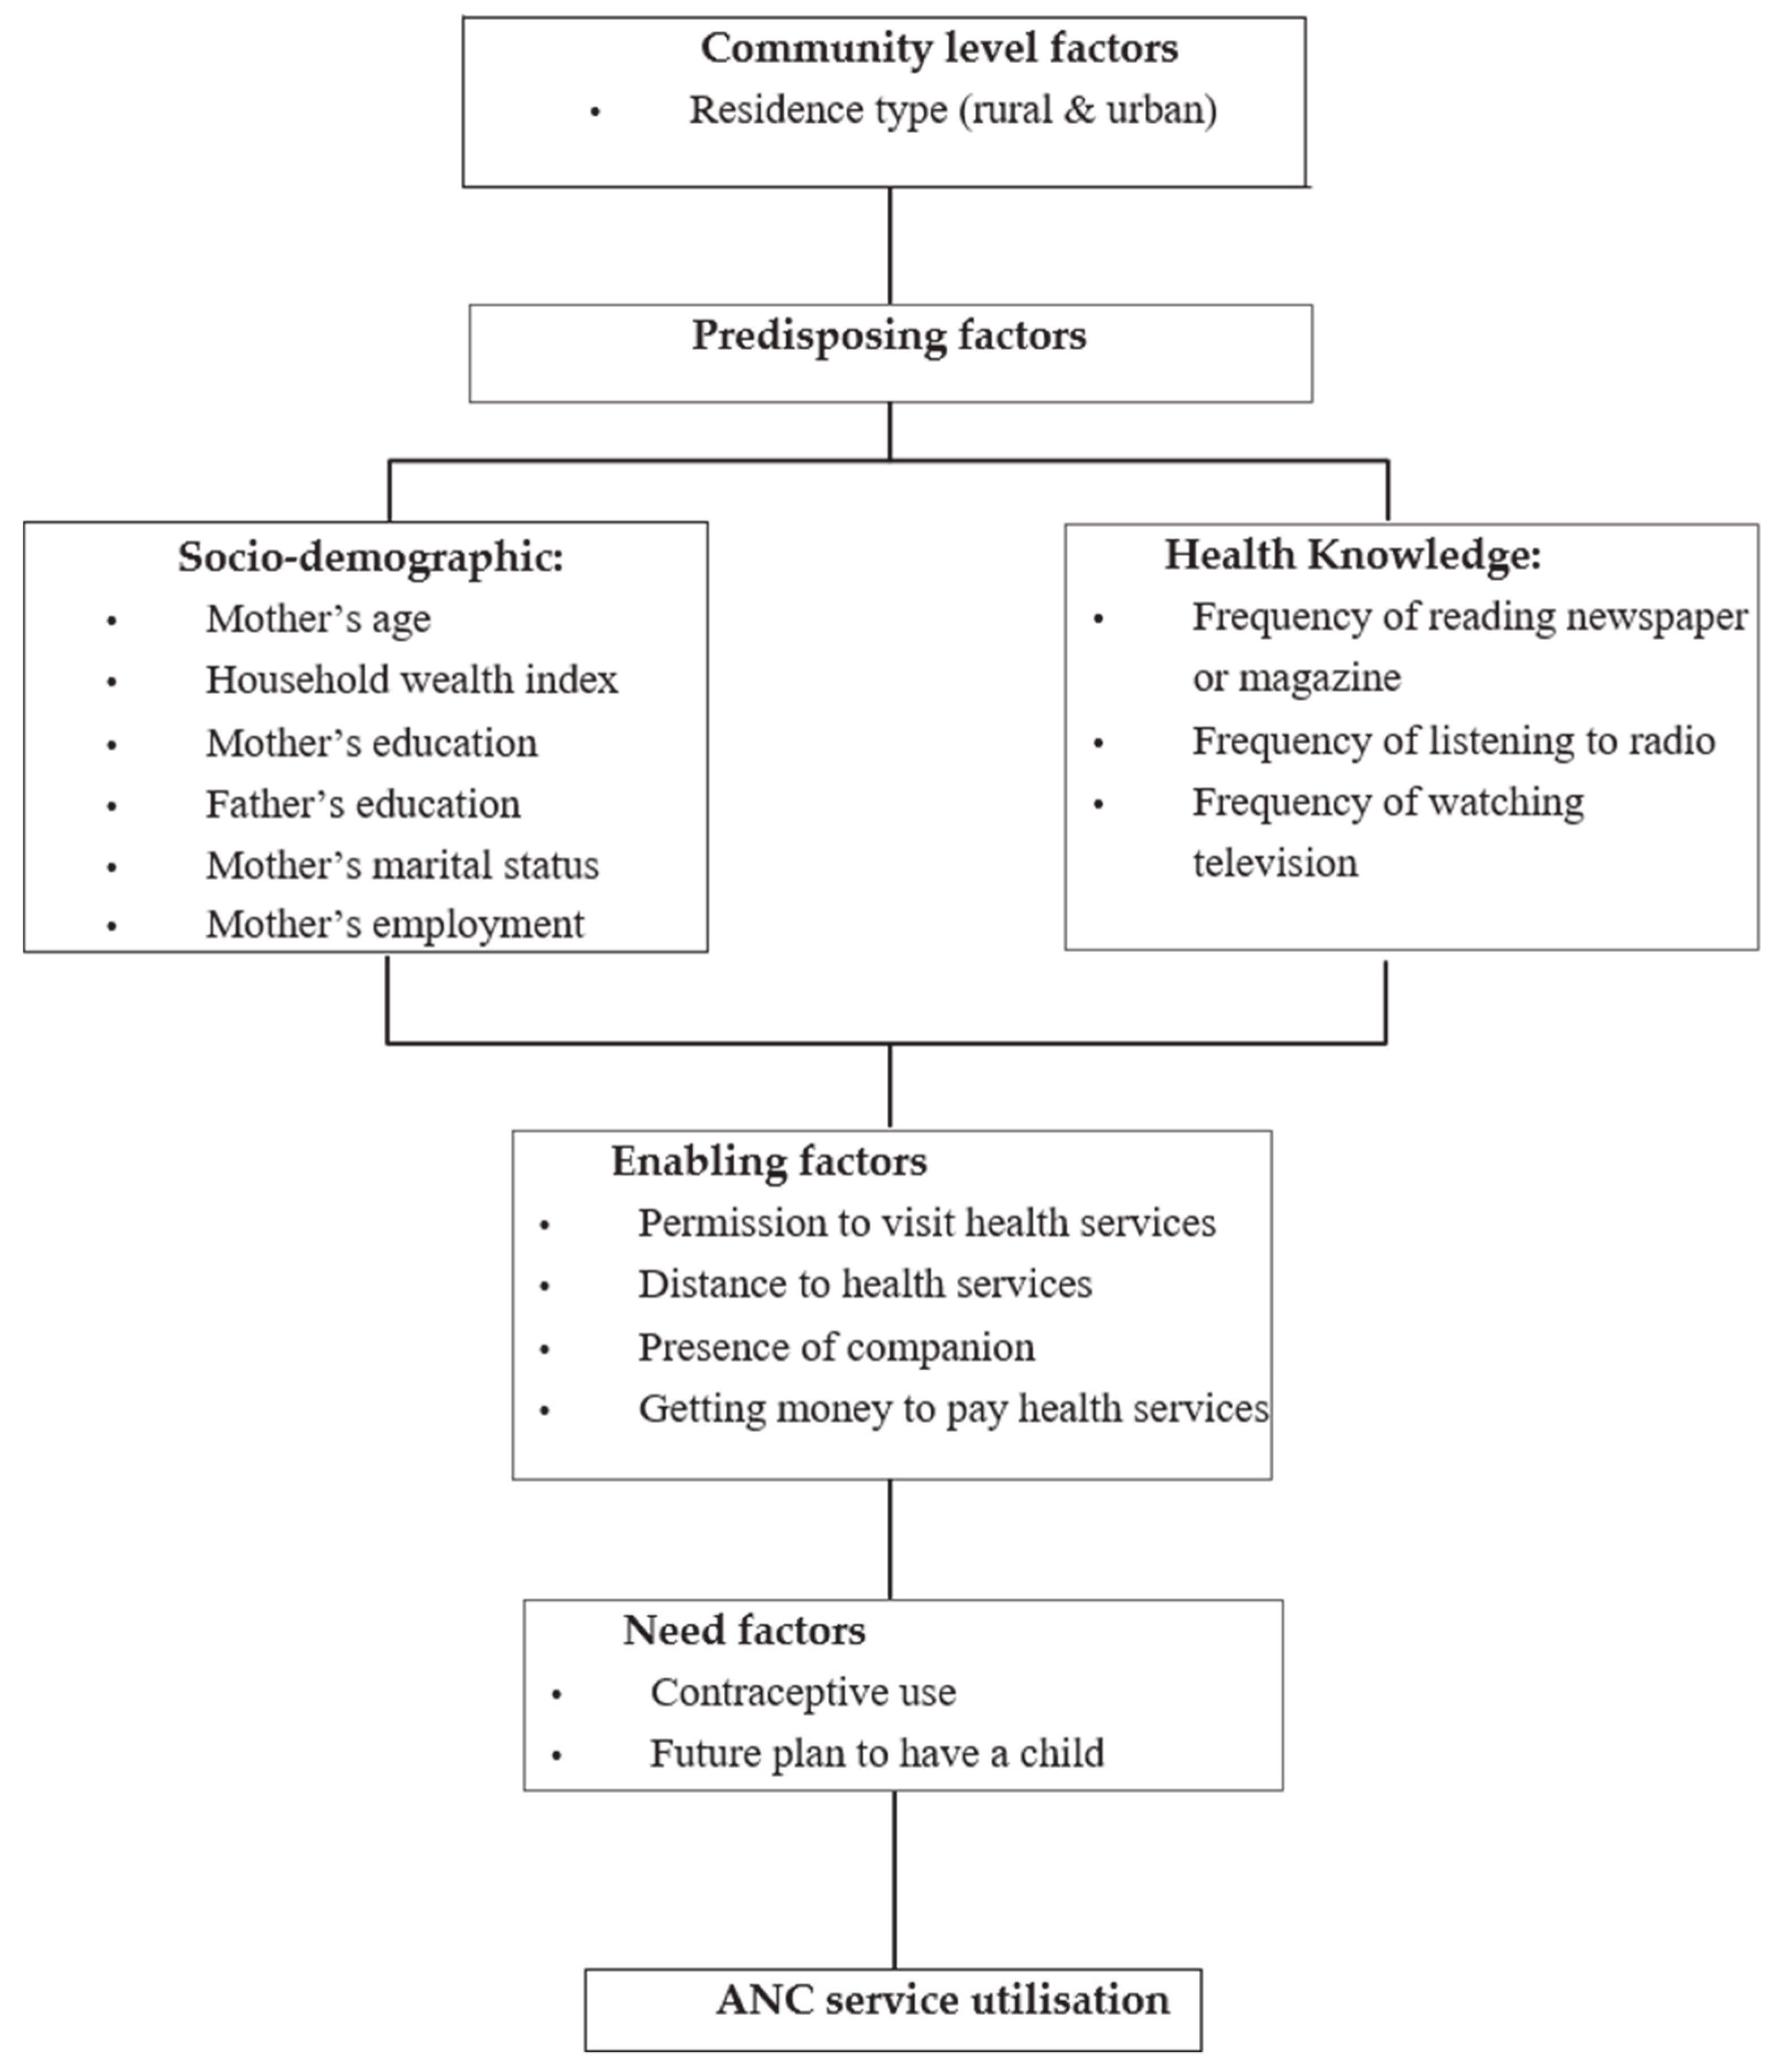
2.4. Independent Variables
2.5. Analytical Strategy
2.6. Ethics
3. Results
3.1. Characteristics of the Study Participants
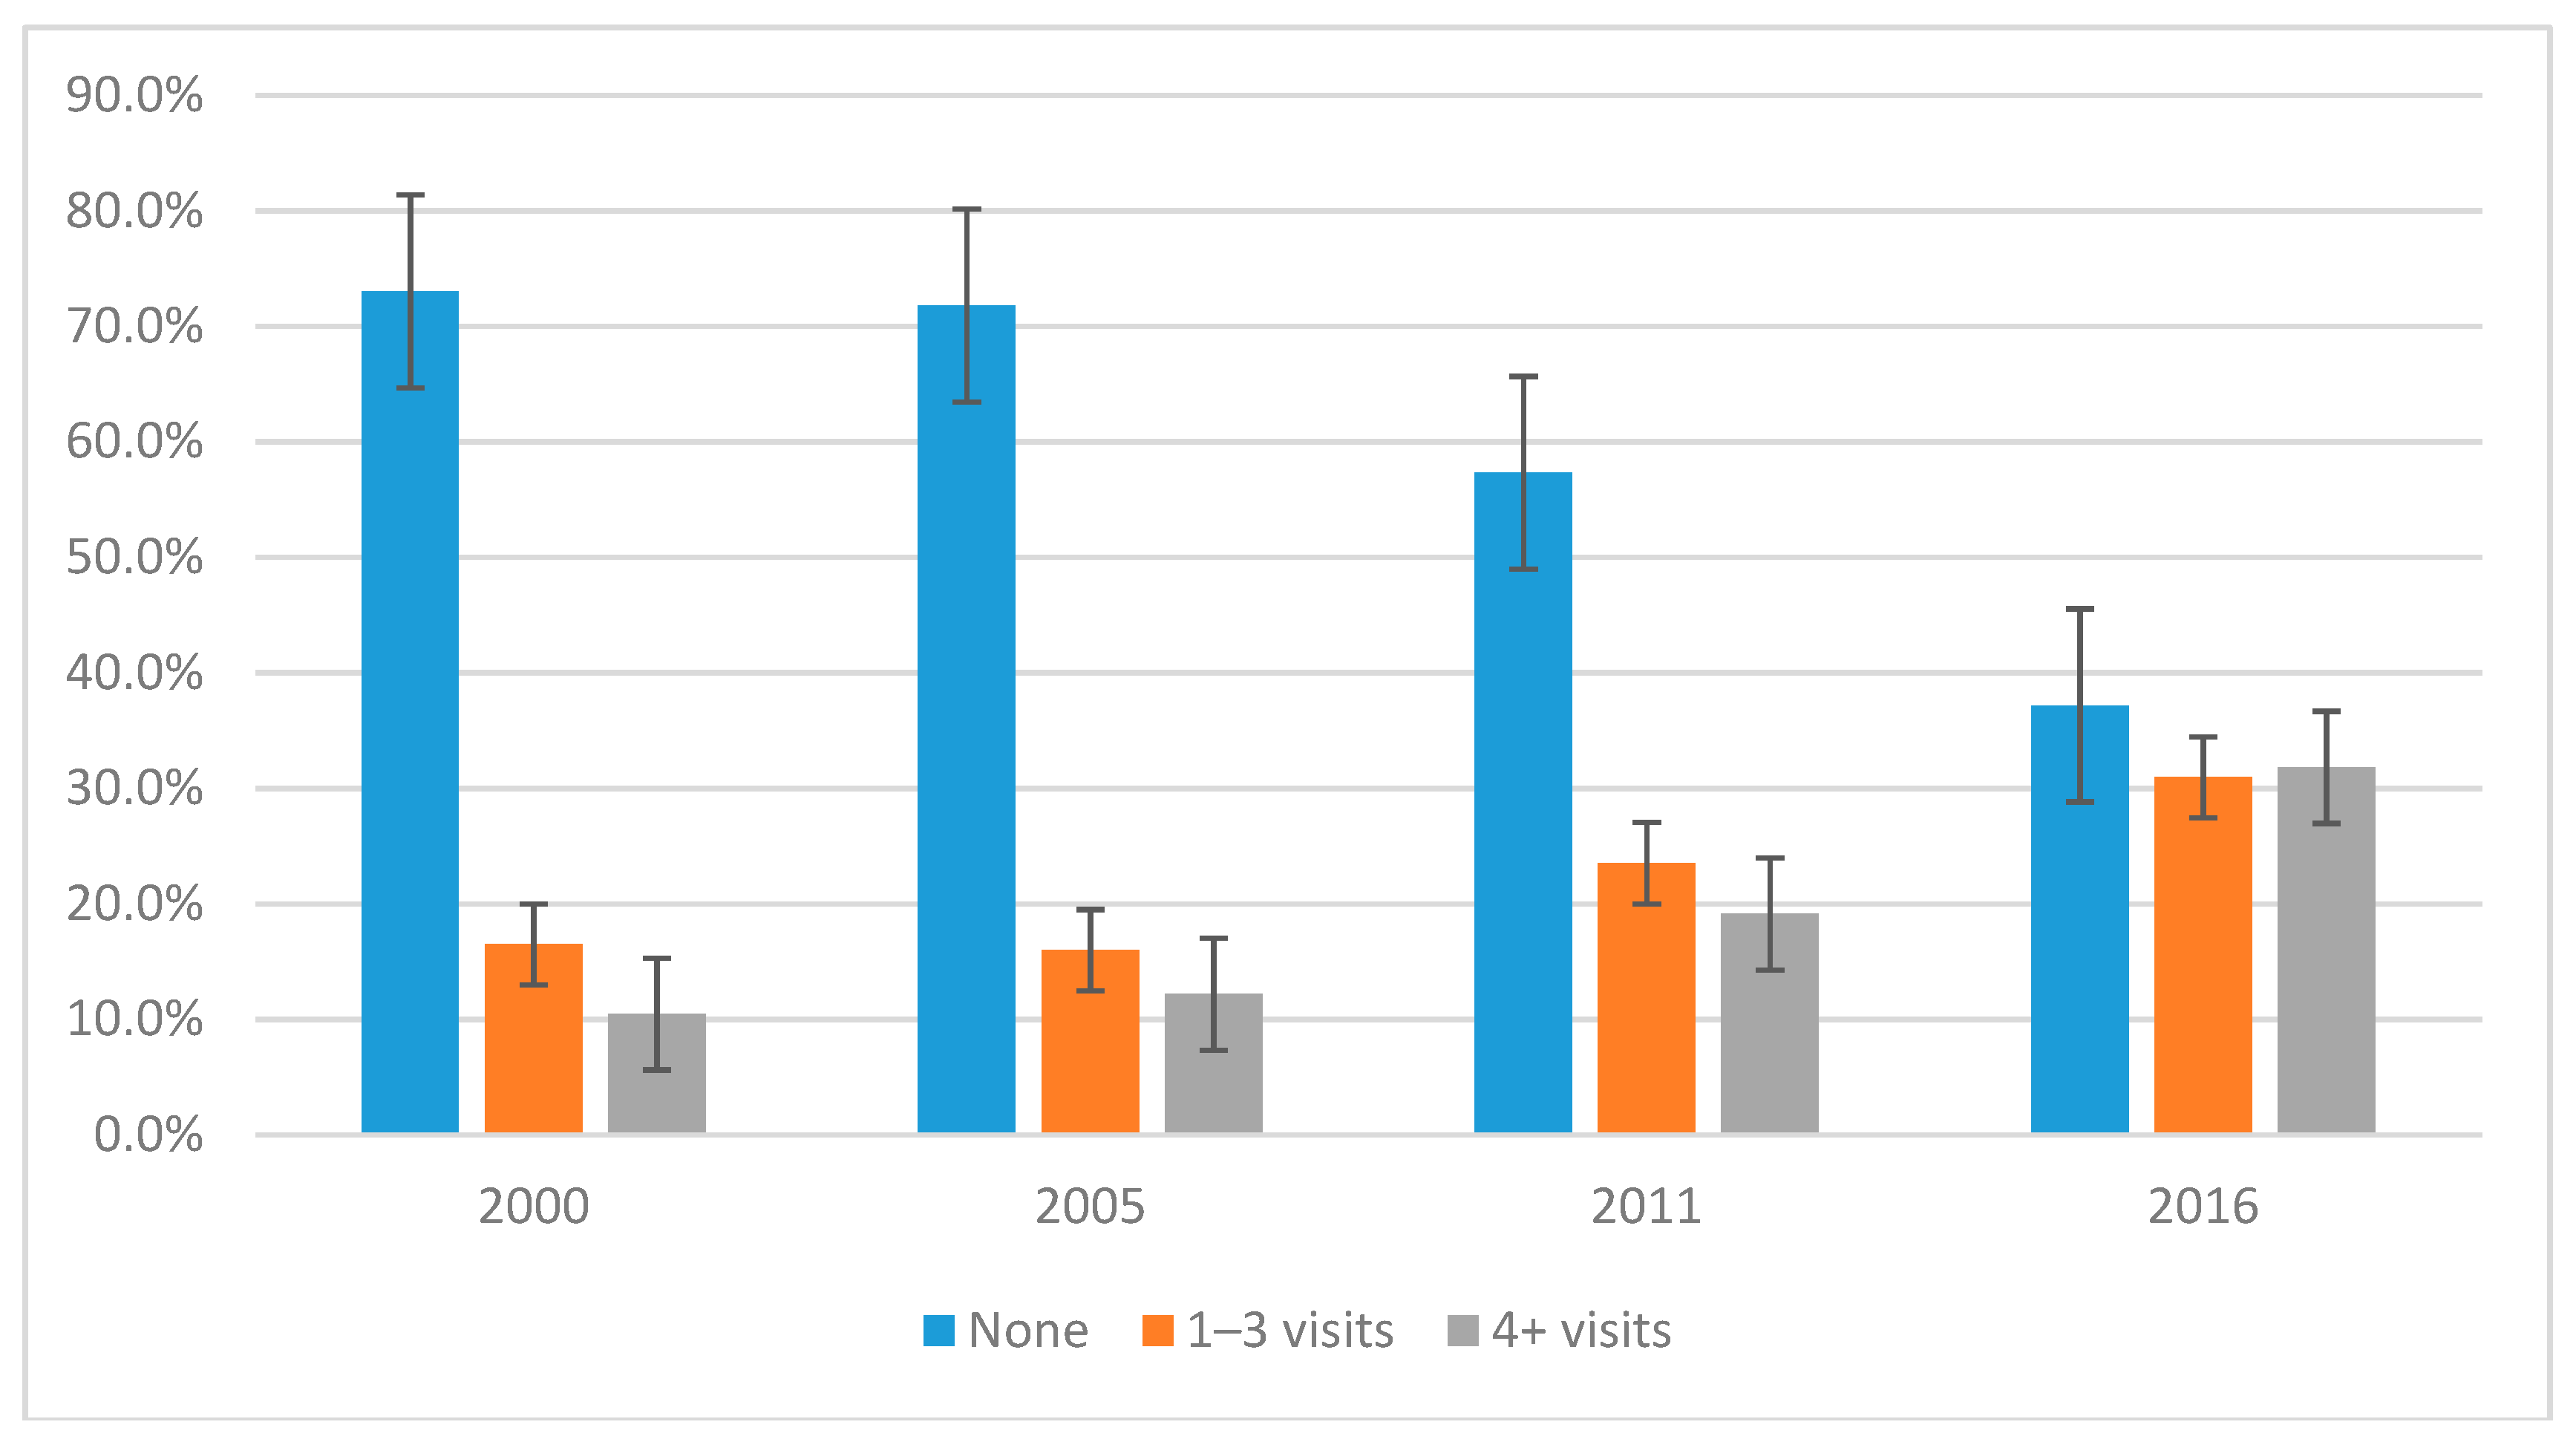
3.2. Trends in Antenatal Care Service Use in Ethiopia, 2000–2016
3.3. Determinants of ANC Service Use: (1–3 Visits)
3.4. Determinants of ANC Service Use (4 or More Visits)
4. Discussion
5. Conclusions
Author Contributions
Funding
Acknowledgments
Conflicts of Interest
Abbreviations
| ANC | Antenatal care |
| SDG | Sustainable Development Goal |
| MDG | Millennium Development Goal |
| WHO | World Health Organization |
| ICF | Inner City Fund |
| EDHS | Ethiopia Demographic and Health Survey |
| PNC | Post-Natal care |
| CSA | Central Statistical Agency |
| MOH | Minster of Health |
| USA | United States of America |
| TV | Television |
| CIS | Confidence Interval |
| DHS | Demographic and Health Survey |
References
- World Health Organization and UNICEF. Trends in Maternal Mortality: 1990–2015: Estimates from WHO, UNICEF, UNFPA, World Bank Group and the United Nations Population Division; World Health Organization: Geneva, Switzerland, 2015. [Google Scholar]
- Kassebaum, N.J.; Barber, R.M.; Bhutta, Z.A.; Dandona, L.; Gething, P.W.; Hay, S.I.; Kinfu, Y.; Larson, H.J.; Liang, L.F.; SLim, S.; et al. Global, regional, and national levels of maternal mortality, 1990–2015: A systematic analysis for the Global Burden of Disease Study 2015. Lancet 2016, 388, 1775–1812. [Google Scholar] [CrossRef]
- Berhan, Y.; Berhan, A. Causes of maternal mortality in Ethiopia: A significant decline in abortion related death. Ethiop. J. Health Sci. 2014, 24, 15–28. [Google Scholar] [CrossRef] [PubMed]
- WHO. Maternal Mortality 2018. Available online: http://www.who.int/news-room/fact-sheets/detail/ maternal-mortality (accessed on 9 December 2018).
- Tessema, G.A.; Laurence, C.O.; Melaku, Y.A.; Misganaw, A.; Woldie, S.A.; Hiruye, A.; Amare, A.T.; Lakew, Y.; Zeleke, B.M.; Deribew, A. Trends and causes of maternal mortality in Ethiopia during 1990–2013: Findings from the Global Burden of Diseases study 2013. BMC Public Health 2017, 17, 160. [Google Scholar] [CrossRef] [PubMed]
- CSA [Ethiopia] and ICF. Ethiopia Demographic and Health Survey 2016; CSA [Ethiopia] and ICF: Addis Ababa, Ethiopia; Rockville, MD, USA, 2016. [Google Scholar]
- Darmstadt, G.L.; Bhutta, Z.A.; Cousens, S.; Adam, T.; Walker, N.; De Bernis, L.; The Lancet Neonatal Survival Steering Team. Evidence-based, cost-effective interventions: How many newborn babies can we save? Lancet 2005, 365, 977–988. [Google Scholar] [CrossRef]
- Hill, K.; Thomas, K.; AbouZahr, C.; Walker, N.; Say, L.; Inoue, M.; Suzuki, E.; The Maternal Mortality Working Group. Estimates of maternal mortality worldwide between 1990 and 2005: An assessment of available data. Lancet 2007, 370, 1311–1319. [Google Scholar] [CrossRef]
- Tunçalp, Ӧ.; Pena-Rosas, J.; Lawrie, T.; Bucagu, M.; Oladapo, O.; Portela, A.; Gülmezoglu, A.M. WHO recommendations on antenatal care for a positive pregnancy experience—Going beyond survival. BJOG 2017, 124, 860–862. [Google Scholar] [CrossRef] [PubMed]
- World Health Organization. WHO Recommendations on Antenatal Care for a Positive Pregnancy Experience; World Health Organization: Geneva, Switzerland, 2016. [Google Scholar]
- Afework, M.F. Achieving the maternal health Millennium Development Goals in Ethiopia: Where we are and what needs to be done? Ethiop. J. Health Develop. 2010, 24, 87–88. [Google Scholar]
- CSA [Ethiopia] and ICF. Ethiopia Demographic and Health Survey 2005; CSA [Ethiopia] and ICF: Addis Ababa, Ethiopia; Calverton, MD, USA, 2005. [Google Scholar]
- CSA [Ethiopia] and ORC Macro. Ethiopia Demographic and Health Survey 2000; Central Statistical Authority and ORC Macro: Addis Ababa, Ethiopia; Calverton, MD, USA, 2000. [Google Scholar]
- Central Statistical Agency [Ethiopia] and Inner City Fund International. Ethiopia Demographic and Health Survey 2011; CSA [Ethiopia] and ICF: Addis Ababa, Ethiopia; Calverton, MD, USA, 2011. [Google Scholar]
- Andersen, R.M. Revisiting the behavioral model and access to medical care: Does it matter? J. Health Soc. Behav. 1995, 36, 1–10. [Google Scholar] [CrossRef] [PubMed]
- Agho, K.E.; Ezeh, O.K.; Ogbo, F.A.; Enoma, A.I.; Raynes-Greenow, C. Factors associated with inadequate receipt of components and use of antenatal care services in Nigeria: A population-based study. Int. Health 2018, 10, 172–181. [Google Scholar] [CrossRef] [PubMed]
- Ogbo, F.A.; Ogeleka, P.; Awosemo, A.O. Trends and determinants of complementary feeding practices in Tanzania, 2004–2016. Trop. Med. Health 2018, 46, 40. [Google Scholar] [CrossRef] [PubMed]
- Ogbo, F.A.; Page, A.; Idoko, J.; Claudio, F.; Agho, K.E. Trends in complementary feeding indicators in Nigeria, 2003–2013. BMJ Open 2015, 5, e008467. [Google Scholar] [CrossRef] [PubMed]
- Banke-Thomas, O.E.; Banke-Thomas, A.O.; Ameh, C.A. Factors influencing utilisation of maternal health services by adolescent mothers in Low-and middle-income countries: A systematic review. BMC Pregnancy Childbirth 2017, 17, 65. [Google Scholar] [CrossRef] [PubMed]
- Adjiwanou, V.; LeGrand, T. Does antenatal care matter in the use of skilled birth attendance in rural Africa: A multi-country analysis. Soc. Sci. Med. 2013, 86, 26–34. [Google Scholar] [CrossRef] [PubMed]
- Gebreyohannes, Y.; Ararso, D.; Mengistu, F.; Abay, S.; Hadis, M. Improving Antenatal Care Services Utilization in Ethiopia: An Evidence–Based Policy Brief. Int. J. Health Econ. Policy 2017, 2, 111–117. [Google Scholar]
- Rahman, A.; Anwar, I. Behavior Change Communications during Antenatal Visits Using Pictorial Cards Improves Institutional Delivery Rates: Evidence from Matlab, Bangladesh. Int. J. Trop. Dis. Health 2013, 3, 242–256. [Google Scholar] [CrossRef]
- Regassa, N. Antenatal and postnatal care service utilization in southern Ethiopia: A population-based study. Afr. Health Sci. 2011, 11, 3. [Google Scholar]
- Mekonnen, Y. Patterns of maternity care service utilization in Southern Ethiopia: Evidence from a community and family survey. Ethiop. J. Health Dev. 2003, 17, 27–33. [Google Scholar] [CrossRef]
- Tarekegn, S.M.; Lieberman, L.S.; Giedraitis, V. Determinants of maternal health service utilization in Ethiopia: Analysis of the 2011 Ethiopian Demographic and Health Survey. BMC Pregnancy Childbirth 2014, 14, 161. [Google Scholar] [CrossRef] [PubMed]
- Yesuf, E.A.; Calderon-Margalit, R. Disparities in the use of antenatal care service in Ethiopia over a period of fifteen years. BMC Pregnancy Childbirth 2013, 13, 131. [Google Scholar] [CrossRef] [PubMed]
- Zegeye, A.M.; Bitew, B.D.; Koye, D.N. Prevalence and determinants of early antenatal care visit among pregnant women attending antenatal care in Debre Berhan Health Institutions, Central Ethiopia. Afr. J. Reprod. Health 2013, 17, 130–136. [Google Scholar] [PubMed]
- Fathalla, M.F. Family planning linked to an obstetric service. Trop Doct. 1988, 18, 25–29. [Google Scholar] [CrossRef] [PubMed]
- Singh, S.; Darroch, J.E.; Ashford, L.S.; Vlassoff, M. Adding It Up: The Costs and Benefits of Investing in Family Planning and Maternal and New Born Health. In Proceeding of the 15th anniversary of the International Conference on Population and Development; Guttmacher Institute and United Nations Population Fund: New York, NY, USA, 2009. [Google Scholar]
- Williamson, L.M.; Parkes, A.; Wight, D.; Petticrew, M.; Hart, G.J. Limits to modern contraceptive use among young women in developing countries: A systematic review of qualitative research. Reprod. Health 2009, 6, 3. [Google Scholar] [CrossRef] [PubMed]
- Fantahun, M.; Berhane, Y.; Wall, S.; Byass, P.; Högberg, U. Women’s involvement in household decision-making and strengthening social capital—Crucial factors for child survival in Ethiopia. Acta Paediatrica. 2007, 96, 582–589. [Google Scholar] [CrossRef] [PubMed]
- Babalola, S.; Fatusi, A. Determinants of use of maternal health services in Nigeria—Looking beyond individual and household factors. BMC Pregnancy Childbirth 2009, 9, 43. [Google Scholar] [CrossRef] [PubMed]
- Bloom, S.S.; Wypij, D.; Das Gupta, M. Dimensions of women’s autonomy and the influence on maternal health care utilization in a north Indian city. Demography 2001, 38, 67–78. [Google Scholar] [CrossRef] [PubMed]


| Characteristics | 2000 (n = 1308) | 2005 (n = 1164) | 2011 (n = 1856) | 2016 (n = 2341) | p Trend | |
|---|---|---|---|---|---|---|
| n (%) * | n (%) | n (%) | n (%) | |||
| Community level factors | ||||||
| Residence type | Urban | 201 (2.5) | 93 (1.2) | 352 (4.4) | 262 (3.4) | |
| Rural | 1106 (13.9) | 1071 (14.7) | 1504 (19.0) | 2079 (27.5) | p < 0.001 | |
| Sociodemographic factors | ||||||
| Maternal age | 15–24years | 370 (4.6) | 304 (4.2) | 553 (7.0) | 674 (8.9) | p < 0.001 |
| 25–34 | 603 (7.6) | 562 (7.7) | 878 (11.1) | 1159 (15.3) | ||
| 35–49 | 334 (4.2) | 297 (4.0) | 425 (5.3) | 507 (6.7) | ||
| Marital status | Currently | 1179 (14.8) | 1081 (14.8) | 1692 (21.4) | 2226 (29.4) | |
| Formerly | 128 (1.6) | 83 (1.1) | 165 (2.0) | 114 (1.5) | p < 0.001 | |
| Mother’s education | No education | 985 (12.4) | 825 (11.3) | 1135 (14.4) | 1412 (18.6) | |
| Primary | 233 (2.9) | 274 (3.7) | 626 (7.9) | 745 (9.8) | p < 0.001 | |
| Secondary and above | 90 (1.1) | 65 (0.8) | 95(1.2) | 183 (2.4) | p < 0.001 | |
| Household Wealth index | Poor | 453 (5.7) | 298 (4.0) | 493 (6.2) | 562 (7.4) | |
| Middle | 556 (7.0) | 636 (8.7) | 929 (11.7) | 1412 (18.6) | p < 0.001 | |
| Rich | 298 (3.7) | 229 (3.1) | 435 (5.5) | 366 (4.8) | p < 0.001 | |
| Mother’s employment | Not working | 535 (6.7) | 812 (11.7) | 1287 (16.3) | 1707 (22.5) | |
| Working | 769 (9.7) | 301 (4.3) | 569 (7.2) | 634 (8.3) | p < 0.001 | |
| Partner education | No education | 734 (9.4) | 560 (7.7) | 804 (10.3) | 1013 (14.3) | |
| Primary | 377 (4.8) | 414 (5.7) | 820 (10.5) | 906 (12.8) | p < 0.001 | |
| Secondary and above | 178 (2.2) | 173 (2.3) | 209 (2.6) | 299 (4.2) | p < 0.001 | |
| Partner occupation | Agricultural | 993 (12.5) | 955 (13.1) | 1372 (17.4) | 1417 (18.7) | |
| Non agricultural | 300 (3.7) | 196 (2.6) | 461 (5.8) | 664 (8.7) | p < 0.001 | |
| Not working | 14 (0.1) | 12 (0.1) | 23 (0.2) | 260 (3.4) | p < 0.001 | |
| Health knowledge factors | ||||||
| Frequency of reading newspaper or magazine | At least once a week | 6 (0.07) | 9(0.1) | 41 (0.5) | 42 (0.5) | |
| Less than once a week | 95 (1.2) | 71 (0.9) | 174 (2.2) | 92 (1.2) | p < 0.001 | |
| Never | 1206 (15.2) | 1080 (14.9) | 1642 (20.8) | 2207 (29) | p < 0.001 | |
| Need factors | ||||||
| Contraceptive use | Yes | 130 (1.6) | 214 (2.9) | 569 (7.2) | 861 (11.3) | |
| No | 1178 (14.8) | 949 (13.0) | 1287 (16.3) | 1480 (19.5) | p < 0.001 | |
| Intention to become pregnant | Immediately | 751 (9.4) | 693 (9.5) | 1263 (16.0) | 1757 (23.2) | |
| Later | 289 (3.6) | 257 (3.5) | 411 (5.2) | 428 (5.6) | p < 0.001 | |
| No more | 268 (3.3) | 211 (2.9) | 182 (2.3) | 155 (2.0) | p < 0.001 | |
| Characteristics | 2000 (n = 831) | 2005 (n = 889) | 2011 (n = 1508) | 2016 (n = 2407) | p Trend | |
|---|---|---|---|---|---|---|
| n (%) * | n (%) | n (%) | n (%) | |||
| Community level factors | ||||||
| Residence type | Urban | 396 (4.9) | 346 (4.7) | 541 (6.8) | 603 (7.9) | p < 0.001 |
| Rural | 435 (5.4) | 543 (7.4) | 967 (12.2) | 1804 (23.8) | p < 0.001 | |
| Socio-demographic factors | ||||||
| Maternal age | 15–24 | 223 (2.8) | 281 (3.8) | 394 (4.9) | 558 (7.3) | p < 0.001 |
| 25–34 | 420 (5.3) | 437 (6.0) | 757 (9.6) | 1321 (17.4) | ||
| 35–49 | 187 (2.3) | 170 (2.3) | 357 (4.5) | 528 (6.9) | ||
| Marital status | Currently | 734 (9.2) | 800 (11) | 1370 (17.3) | 2234 (29.5) | |
| Formerly | 97 (1.2) | 88 (1.2) | 138 (1.7) | 173 (2.2) | p < 0.001 | |
| Mother’s education | No education | 403 (5.0) | 453 (6.2) | 644 (3.0) | 1153 (15.2) | |
| Primary | 219 (2.7) | 203 (2.7) | 625 (7.9) | 828 (10.9) | p < 0.001 | |
| Secondary and above | 209 (2.6) | 232 (3.1) | 239 (3.0) | 426 (5.6) | p < 0.001 | |
| Household Wealth index | Poor | 168 (2.1) | 138 (1.8) | 213 (2.6) | 354 (4.6) | p < 0.001 |
| Middle | 199 (2.5) | 280 (3.8) | 628 (7.9) | 1313 (17.3) | p < 0.001 | |
| Rich | 464 (5.8) | 471 (6.4) | 667 (8.4) | 740 (9.7) | p < 0.001 | |
| Mother’s employment | Not working | 381 (4.8) | 544 (7.8) | 892 (11.3) | 1646 (21.7) | |
| Working | 450 (5.6) | 304 (4.3) | 617 (7.8) | 761 (10.0) | p < 0.001 | |
| Partner education | No education | 279 (3.5) | 276 (3.8) | 428 (5.5) | 770 (10.9) | |
| Primary | 222 (2.8) | 258 (3.5) | 699 (9.0) | 908 (12.9) | p < 0.001 | |
| Secondary and above | 312 (3.9) | 336 (4.6) | 345 (4.4) | 541 (7.6) | p < 0.001 | |
| Partner occupation | Agricultural | 372 (4.6) | 409 (5.6) | 785 (9.9) | 1186 (15.6) | p < 0.001 |
| Non agricultural | 441 (5.5) | 454 (6.2) | 688 (8.7) | 935 (12.3) | p < 0.001 | |
| Not working | 17 (0.2) | 25 (0.3) | 35 (0.4) | 285 (3.7) | p < 0.001 | |
| Health knowledge factors | ||||||
| Frequency of reading newspaper or magazine | At least | 22 (0.2) | 17 (0.2) | 70 (0.8) | 81 (1.0) | p < 0.001 |
| Less than | 193 (2.4) | 189 (2.6) | 279 (3.5) | 254 (3.3) | p < 0.001 | |
| Never | 599 (7.5) | 668 (9.2) | 1159 (14.7) | 2071 (27.4) | p < 0.001 | |
| Need factors | ||||||
| Contraceptive use | Yes | 254 (4.9) | 346 (4.75) | 541 (6.8) | 603 (7.9) | p < 0.001 |
| No | 577 (5.4) | 543 (7.4) | 967 (12.2) | 1804 (23.8) | p < 0.001 | |
| Intention to become pregnant | Then | 465 (5.8) | 534 (7.3) | 1020 (12.9) | 1845 (24.4) | p < 0.001 |
| Later | 166 (2.1) | 186 (2.5) | 329 (4.1) | 393 (5.2) | p < 0.001 | |
| No more | 198 (2.4) | 169 (2.3) | 159 (2.0) | 168 (2.2) | p < 0.001 | |
| Characteristics | 2000 EDHS | 2005 EDHS | 2011 EDHS | 2016 EDHS | |||||
|---|---|---|---|---|---|---|---|---|---|
| *AOR (95% CI) | p-Value | AOR (95% CI) | p-Value | AOR (95% CI) | p-Value | AOR (95% CI) | p-Value | ||
| Community level factors | |||||||||
| Residence type | Urban | 1.00 | 1.00 | 1.00 | 1.00 | ||||
| Rural | 0.39 (0.24–0.61) | p < 0.001 | 0.65 (0.39–1.10) | p = 1.100 | 0.38 (0.26–0.56) | p < 0.001 | 0.42 (0.25–0.72) | p < 0.001 | |
| Socio-demographic factors | |||||||||
| Maternal employment status | Not working | 1.00 | 1.00 | 1.00 | 1.00 | 1.00 | |||
| Working | 1.00 (0.80–1.20) | p = 0.700 | 1.10 (0.80–1.40) | p = 0.500 | 1.00 (0.90–1.30) | p = 0.300 | 1.30 (1.10–1.60) | p = 0.020 | |
| Mother’s education | Secondary | 1.00 | 1.00 | 1.00 | 1.00 | ||||
| Primary | 0.80 (0.40–1.40) | p = 0.430 | 0.60 (0.38–1.16) | p = 0.150 | 0.83 (0.18–0.03) | p = 0.020 | 0.41 (0.21–0.82) | p = 0.010 | |
| No education | 0.40 (0.20–0.80) | p = 0.010 | 0.40 (0.24–0.73) | p = 0.002 | 0.28 (0.13–0.61) | p = 0.010 | 0.28 (0.14–0.57) | p = 0.010 | |
| Household wealth index | Poor | 1.00 | 1.00 | 1.00 | 1.00 | ||||
| Medium | 1.58 (1.27–1.96) | p = 0.010 | 1.60 (1.25–2.04) | p = 0.010 | 1.40 (1.13–1.73) | p = 0.010 | 1.38 (1.07–1.77) | p = 0.010 | |
| Rich | 3.21(2.34–4.40) | p = 0.010 | 2.23 (1.53–3.26) | p = 0.010 | 2.24 (2.24–4.54) | p = 0.010 | 2.30 (1.54–3.42) | p = 0.001 | |
| Partner occupation | Non-agricultural | 1.00 | 1.00 | 1.00 | 1.00 | ||||
| Agricultural | 0.62 (0.48–0.81) | p < 0.001 | 0.88 (0.65–1.21) | p = 0.580 | 0.62 (0.46–0.83) | p < 0.001 | 0.78 (0.59–1.02) | p = 0.700 | |
| Not working | 0.38 (0.14–1.08) | p = 0.070 | 0.77 (0.20–2.96) | p = 0.170 | 0.30 (0.13–0.69) | p = 0.010 | 0.62 (0.44–0.87) | p = 0.010 | |
| Partner education | Secondary | 1.00 | 1.00 | 1.00 | 1.00 | ||||
| Primary | 0.73 (0.51–1.04) | p = 0.089 | 0.58 (0.43–0.79) | p = 0.001 | 0.54 (0.36–0.81) | p = 0.003 | 0.61 (0.41–0.91) | p = 0.016 | |
| No education | 0.50 (0.35–0.70) | 0.000 | 0.33 (0.24–0.46) | p < 0.001 | 0.34 (0.23–0.49) | p < 0.001 | 0.42 (0.29–0.61) | p < 0.001 | |
| Marital status | Currently married | 1.00 | 1.00 | 1.00 | 1.00 | ||||
| Formerly married | 0.98 (0.73–1.31) | p = 0.88 | 1.05 (0.75–1.48) | p = 0.77 | 0.86 (0.64–1.15) | p = 0.32 | 0.1 (0.05–0.19) | p < 0.001 | |
| Need factors | |||||||||
| History of contraceptive use | Yes | 1.00 | 1.00 | 1.00 | 1.00 | ||||
| No | 0.45 (0.32–0.62) | p < 0.001 | 0.64 (0.51–0.80) | p < 0.001 | 0.62 (0.50–0.77) | p < 0.001 | 0.72 (0.57–0.90) | p < 0.001 | |
| Wanted pregnancy at the time | Wanted then | 1.00 | 1.00 | 1.00 | 1.00 | ||||
| Wanted later | 1.15 (0.92–1.43) | p = 0.230 | 1.29 (0.99–1.68) | p = 0.060 | 0.98 (0.79–1.22) | p = 0.860 | 0.93 (0.70–1.22) | p = 0.580 | |
| Unwanted | 1.13 (0.87–1.47) | p = 0.340 | 0.97 (0.76–1.24) | p = 0.830 | 0.91 (0.67–1.24) | p = 0.550 | 0.56 (0.37–0.86) | p = 0.010 | |
| Enabling factors | |||||||||
| Seek permission to visit health services ** | Not a big problem | 1.00 | 1.00 | 1.00 | |||||
| A big problem | 0.78 (0.62–0.97) | p < 0.001 | 0.97 (0.78–1.22) | p = 0.853 | 0.74 (0.57–0.97) | p = 0.029 | |||
| Getting money to pay health services ** | Not a big problem | 1.00 | 1.00 | 1.00 | |||||
| A big problem | 0.76 (0.61–0.96) | p = 0.021 | 0.91 (0.75–1.11) | p = 0.378 | 0.72 (0.56–0.91) | p = 0.008 | |||
| Distance to health facility ** | Not a big problem | 1.00 | 1.00 | 1.00 | |||||
| A big problem | 0.63 (0.50–0.80) | p < 0.001 | 0.81(0.66–1.01) | p = 0.066 | 0.62 (0.49–0.79) | p < 0.001 | |||
| Accompany to health facility ** | Not a big problem | 1.00 | 1.00 | 1.00 | |||||
| A big problem | 0.73 (0.59–0.91) | p = 0.007 | 1.17 (0.97–1.41) | p = 0.081 | 0.80 (0.65–1.00) | p = 0.052 | |||
| Health knowledge factors | |||||||||
| Frequency of listening to Radio | At least once a week | 1.00 | 1.00 | 1.00 | 1.00 | ||||
| Less than once a week | 0.65 (0.39–1.10) | p = 0.110 | 0.68 (0.42–1.12) | p = 0.130 | 1.27 (1.00–1.63) | p = 0.050 | 1.15 (0.75–1.76) | p = 0.530 | |
| Never | 0.39 (0.23–0.68) | p < 0.001 | 0.51 (0.31–0.83) | p = 0.010 | 0.72 (0.55–0.95) | p = 0.020 | 0.61 (0.44–0.85) | p < 0.001 | |
| Characteristics | 2000 EDHS | 2005 EDHS | 2011 EDHS | 2016 EDHS | |||||
|---|---|---|---|---|---|---|---|---|---|
| * AOR (95%CI) | p-Value | AOR (95% CI) | p-Value | AOR (95% CI) | p-Value | AOR (95% CI) | p-Value | ||
| Sociodemographic level factors | |||||||||
| Mother’s education | Secondary | 1.00 | 1.00 | 1.00 | 1.00 | ||||
| Primary | 0.73 (0.40–1.33) | p = 0.300 | 0.31 (0.17–0.54) | p < 0.001 | 0.23 (0.12–0.45) | p < 0.001 | 0.33 (0.17–0.62) | p < 0.001 | |
| No education | 0.34 (0.18–0.64) | p < 0.001 | 0.21 (0.12–0.38) | p < 0.001 | 0.13 (0.06–0.26) | p < 0.001 | 0.17 (0.09–0.34) | p < 0.001 | |
| House hold wealth status | Poor | 1.00 | 1.00 | 1.00 | 1.00 | ||||
| Medium | 1.38 (1.02–1.89) | p =0.040 | 1.41 (1.0–1.94) | p =0.030 | 2.01 (1.51–2.69) | p < 0.001 | 1.38 (1.07–1.77) | p =0.010 | |
| Rich | 6.12 (3.80–9.85) | p < 0.001 | 5.54 (3.75–8.20) | p < 0.001 | 6.04 (4.02–9.08) | p < 0.001 | 2.30 (1.54–3.42) | p < 0.001 | |
| Mother’s employment | Not working | 1.00 | 1.00 | 1.00 | 1.00 | ||||
| Working | 0.90 (0.66–1.22) | p = 0.500 | 1.54 (1.14–2.09) | p = 0.010 | 1.45 (1.16–1.80) | p < 0.001 | 1.30 (1.01–1.68) | p = 0.040 | |
| Partner occupation | Non-agricultural | 1.00 | 1.00 | 1.00 | 1.00 | ||||
| Agricultural | 0.32 (0.21–0.47) | p < 0.001 | 0.32 (0.23–0.44) | p < 0.001 | 0.40 (0.30–0.52) | p < 0.001 | 0.71 (0.51–0.98) | p = 0.040 | |
| Not working | 0.73 (0.23–2.30) | p = 0.590 | 1.52 (0.56–4.11) | p = 0.410 | 0.92 (0.27–3.12) | p = 0.890 | 0.48 (0.32–0.71) | p < 0.001 | |
| Partner education | Secondary | 1.00 | 1.00 | 1.00 | 1.00 | ||||
| Primary | 0.29(0.21–0.41) | p < 0.001 | 0.29(0.21–0.41) | p < 0.001 | 0.38(0.26–0.56) | p < 0.001 | 0.45(0.32–0.65) | p < 0.001 | |
| No education | 0.18(0.12–0.27) | p < 0.001 | 0.18 (0.12–0.27) | p < 0.001 | 0.19(0.13–0.28) | p < 0.001 | 0.26(0.18–0.36) | p < 0.001 | |
| Marital status | Currently married | 1.00 | 1.00 | 1.00 | 1.00 | ||||
| Formerly married | 1.21(0.80–1.83) | p = 0.35 | 1.33(0.91–1.93) | p = 0.14 | 0.79(0.54–1.15) | p = 0.22 | 0.1(0.05–0.19) | p < 0.001 | |
| Need factors | |||||||||
| Contraceptive use | Yes | 1.00 | 1.00 | 1.00 | 1.00 | ||||
| No | 0.15 (0.11–0.21) | p < 0.001 | 0.41 (0.30–0.56) | p < 0.001 | 0.35 (0.28–0.43) | p < 0.001 | 0.55 (0.42–0.70) | p < 0.001 | |
| Wanted pregnancy at the time | Wanted then | 1.00 | 1.00 | 1.00 | 1.00 | ||||
| Wanted later | 0.91 (0.68–1.21) | p = 0.520 | 1.14 (0.84–1.54) | p = 0.400 | 0.91 (0.69–1.19 | p = 0.490 | 0.77 (0.59–1.02) | p = 0.070 | |
| Unwanted | 1.12 (0.82–1.54) | p = 0.470 | 1.04 (0.76–1.43) | p = 0.810 | 1.07 (0.76–1.50) | p = 0.710 | 0.60 (0.42–0.86) | p = 0.010 | |
| Enabling factors | |||||||||
| ** Seek permission to visit health services | Not a big problem | 1.00 | 1.00 | 1.00 | |||||
| A big problem | 0.62 (0.48–0.80) | p < 0.001 | 0.62 (0.46–0.84) | p = 0.002 | 0.72 (0.53–0.97) | p = 0.031 | |||
| ** Getting money to pay health services | Not a big problem | 1.00 | 1.00 | 1.00 | |||||
| A big problem | 0.58 (0.44–0.76) | p < 0.001 | 0.73 (0.58–0.93) | p = 0.010 | 0.65 (0.52–0.83) | p = 0.010 | |||
| ** Distance to health facility | Not a big problem | 1.00 | 1.00 | 1.00 | |||||
| A big problem | 0.45 (0.35–0.59) | p < 0.001 | 0.49 (0.38–0.62) | p < 0.001 | 0.57 (0.43–0.75) | p < 0.001 | |||
| ** Accompany to health facility | Not a big problem | 1.00 | 1.00 | 1.00 | |||||
| A big problem | 0.60 (0.47–0.77) | p < 0.001 | 0.87 (0.69–1.10) | p = 0.272 | 0.62 (0.47– 0.81) | p = 0.001 | |||
| Community level factors | |||||||||
| Residence type | Urban | 1.00 | 1.00 | 1.00 | 1.00 | ||||
| Rural | 0.18 (0.09–0.33) | p < 0.001 | 0.19 (0.12–0.30) | p < 0.001 | 0.30 (0.20–0.45) | p < 0.001 | 0.29 (0.15–0.55) | p < 0.001 | |
| Health knowledge factors | |||||||||
| Frequency of reading newspaper or magazine | At least once a week | 1.00 | 1.00 | 1.00 | 1.00 | ||||
| Less than once a week | 0.03 (0.02–1.25) | p = 0.080 | 0.80 (0.23–2.86) | p = 0.740 | 0.75 (0.24–2.33) | p = 0.620 | 0.89 (0.23–3.44) | p = 0.860 | |
| Never | 0.15 (0.00–0.20) | p < 0.001 | 0.23 (0.07–0.79) | p = 0.020 | 0.20 (0.07–0.57) | p < 0.001 | 0.31 (0.10–0.99) | p = 0.050 | |
| Frequency of listening to radio | Never | 1.00 | 1.00 | 1.00 | 1.00 | ||||
| Less than once a week | 0.55 (0.27–1.13) | p = 0.100 | 0.68 (0.42–1.12) | p = 0.130 | 1.15 (0.87–1.53) | p = 0.340 | 1.05 (0.69–1.61) | p = 0.810 | |
| More than once a week | 0.28 (0.14–0.59) | p < 0.001 | 0.51 (0.31–0.83), | p = 0.010 | 0.52 (0.39–0.69), | p < 0.001 | 0.51 (0.36–0.72) | p < 0.001 | |
| Frequency of watching television | At least once a week | 1.00 | 1.00 | 1.00 | 1.00 | ||||
| Less than once a week | 0.69 (0.18–2.72) | p = 0.600 | 0.21 (0.05–0.85) | p = 0.030 | 0.55 (0.39–0.78) | p < 0.001 | 0.57 (0.33–0.97) | p = 0.040 | |
| Never | 0.25 (0.06–0.94) | p = 0.040 | 0.07 (0.02–0.26) | p < 0.001 | 0.27 (0.18–0.40) | p < 0.001 | 0.35 (0.21–0.58) | p < 0.001 | |
© 2019 by the authors. Licensee MDPI, Basel, Switzerland. This article is an open access article distributed under the terms and conditions of the Creative Commons Attribution (CC BY) license (http://creativecommons.org/licenses/by/4.0/).
Share and Cite
Mekonnen, T.; Dune, T.; Perz, J.; Ogbo, F.A. Trends and Determinants of Antenatal Care Service Use in Ethiopia between 2000 and 2016. Int. J. Environ. Res. Public Health 2019, 16, 748. https://doi.org/10.3390/ijerph16050748
Mekonnen T, Dune T, Perz J, Ogbo FA. Trends and Determinants of Antenatal Care Service Use in Ethiopia between 2000 and 2016. International Journal of Environmental Research and Public Health. 2019; 16(5):748. https://doi.org/10.3390/ijerph16050748
Chicago/Turabian StyleMekonnen, Tensae, Tinashe Dune, Janette Perz, and Felix Akpojene Ogbo. 2019. "Trends and Determinants of Antenatal Care Service Use in Ethiopia between 2000 and 2016" International Journal of Environmental Research and Public Health 16, no. 5: 748. https://doi.org/10.3390/ijerph16050748
APA StyleMekonnen, T., Dune, T., Perz, J., & Ogbo, F. A. (2019). Trends and Determinants of Antenatal Care Service Use in Ethiopia between 2000 and 2016. International Journal of Environmental Research and Public Health, 16(5), 748. https://doi.org/10.3390/ijerph16050748