Abstract
With the awakening of environmental consciousness, more and more firms desire to go “green” by shifting their focus of corporate social responsibility (CSR) from charitable contributions to environmental actions called corporate environmental responsibility (CER). We develop a monopoly differential game to depict optimal corporate strategies of product price, quality, and CER. Using the Hamilton–Jacobi–Bellman (HJB) equation, we analyze optimal feedback equilibrium strategies for pricing and investing in both quality and CER with/without government subsidies. Numerical simulations show that government subsidy can improve CER and profit.
1. Introduction
As part and parcel of corporate social responsibility (CSR), corporate environmental responsibility (CER) complies with the rise of today’s environmental consciousness in environmental evolutions such as climate change. CER encompasses all the practices put in place by firms to reduce emissions, increase efficiency, and integrate sustainability into their daily operations. Employees, consumers, and stakeholders are placing a premium on working for, spending their money on, and standing by brands or companies that prioritize CER. Laudable green CER strategies can improve managerial altruism, consumer loyalty, corporation recommendations, brand sentiment, and cost-cutting efficiency. For that reason, more and more companies desire to go “green”. Therefore, it is meaningful for us to consider CER when we analyze firms’ decisions.
In recent years, more and more researchers also have paid much attention to CSR and CER [1,2,3,4,5,6]. Qin et al. [7] constructed a CER conceptual framework for researchers and proposed a conceptual model for policymakers. Suganthi [8] examined a general research framework considering CSR, green practice performance, and employees’ pro-environmental behavior. CSR can not only put enterprises into competitive disadvantage due to investment in CSR [9,10,11] but also help firms gain competitive advantage, because environmentally responsible behavior can obtain support from stakeholders (e.g., governments, suppliers, consumers, employees, and local communities) [12], expand their market share [9], reduce operational risk, and obtain long-term growth [13]. Some other researchers [14,15,16] have also indicated that CSR has a positive effect on corporate profits from different perspectives. Generally speaking, CSR helps corporations to gain better corporate goodwill [17,18,19], and better corporate goodwill helps corporations acquire more resources, and earn optimal profits. Examining the role of CER in CSR, Liu et al. [20] found that CER is positively associated with CSR to a significant degree. Dang et al. [21] insisted that CER is also a double-edged sword under different mediation effects, such as strategic similarity and organizational slack. Han, Yu, and Kim [3] uncovered that CER is a significant contributor to improving corporate goodwill and loyalty intentions. In the following, we will extend the Nerlove–Arrow model [22] to construct a monopoly differential game model by incorporating the effect of product quality, price, and CER on corporate goodwill to explore optimal corporate strategies.
The remainder of this paper is organized as follows. We review the relevant literature in Section 2. We propose a differential monopoly game model in Section 3. We analyze the equilibria without government subsidies in Section 4. We study the equilibria with government subsidies in Section 5. We validate the results by numerical simulations in Section 6. We discuss the results in Section 7. Finally, the paper concludes in Section 8.
2. Literature Review
Though there is no widely accepted definition of CER [7,8,23,24,25,26,27,28,29,30], for the sake of convenience, we support that CER is one of three facets of CSR, and focuses on pollution prevention and cleaner production. Furthermore, we regard the following terms as equivalent to CER: CSR in the environment, environmental CSR, environmental corporate responsibility. Like CSR, CER can impact the performance of micro-, small- and medium-sized enterprises from financial and innovative standpoints. As a kind of CSR, corporate contributions to charity may also have a long-term effect on a firm’s image and profits [31,32]. CER can facilitate firms to achieve support from external stakeholders, gain competitive advantages [33], reduce equity financing costs [34], affect investment efficiency for the long-term [35] and in green IT capital [36].
There is some literature about relationships between price, quality, and corporate responsibility (CR), as shown in Table 1. In this study, we analyze the relationship between price, quality, and CER by using the infinite-time differential game. Since the differential game will be used to analyze optimal corporate strategies of price, quality, and CER, some applications of the differential game are reviewed, as shown in Table 2. In this study, we investigate the feedback equilibria by setting corporate goodwill and CER knowledge accumulation as state variables, and setting pricing, investing in quality, and CER as control variables.

Table 1.
Main relationships between profit, price, quality, and CR.
Table 2.
Differential games with more state or control variables.
3. Model Formulation and Notation
As explained in Section 1 and Section 2, we consider an optimal dynamic problem over infinite time, in which a monopolist produces a single product and implements CER to promote corporate goodwill. General speaking, consumers are inclined to associate high quality and CER with high prices, where higher prices and CERs improve the corporate goodwill. Corporate goodwill directly affects sales. CER knowledge accumulation and investment in CER and quality all affect the cost. Besides, the classical supply–demand theory shows that (i) price is adversely related to sales, and (ii) the cost negatively affects the profits. We depict these relationships in the following block diagram, as shown in Figure 1.
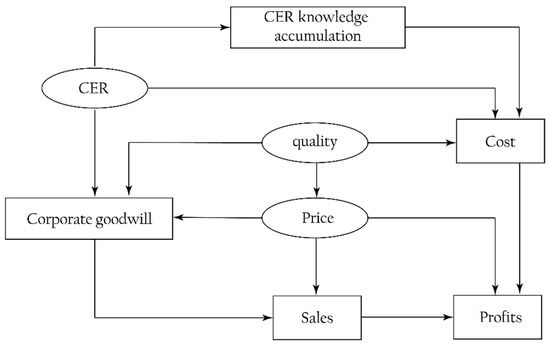
Figure 1.
Block diagram of the proposed model.
Table 3.
Variables and descriptions.
Table 4.
Parameters and descriptions.
Incorporating the effects of price , investment in quality and CSRI on corporate goodwill , we extend the well-known Nerlove–Arrow model [22] to the following dynamic equation describing the time evolution of the corporate goodwill:
To formulate the demand problem in the monopolistic market, we extend the inverse demand function to the following demand function , which depends jointly on the investment in quality , price , and corporate goodwill :
According to [60,61], we employ the following linear marginal cost function of unitary production:
Borrowing from the thought of [62], we employ the following equation to measure the CSR knowledge accumulations:
which can be differentiated w.r.t. time and gives
Inspired by [62,63], we consider the monopolist’s cost function of CSR as follows:
In this paper, we assume that all the demand can be satisfied, and there is no stock. We regard the demand function (2) as the product quantity under this circumstance. Then we can obtain the following monopolist’s instantaneous profits without government subsidies:
In the real world, a government tends to provide subsidies for firms that undertake CSR. In the following, we will explore the difference of monopolist’s optimal strategies between the case with and without government subsidies. For the sake of simplicity, we employ the following linear marginal subsidy function:
Referring to Equation (7), we write the following instantaneous profits with government subsidies:
To get the optimal combination of the product price, product quality, and CSRI to maximize its discounted infinite-horizon profit stream with/without government subsidies under the evolution of the corporate goodwill and CSR knowledge accumulations, we can depict it as the following differential game model:
where , , and are control variables; and are state variables.
4. The Case without Government Subsidy
In this section, we will perform the open-loop, closed-loop, feedback equilibrium analysis for the case without government subsidies. Moreover, the subscript indicates the feedback equilibrium of variables. For simplicity, the time-dependence of variables and state will be suppressed if no confusion arises.
4.1. The Open-/Closed-loop Equilibrium
We write the Hamiltonian function for the optimization model in Equations (10) and (11) without government subsidy as follows:
where , denote the dynamic adjoint variables related to their respective state equations and under the case without government subsidies.
From the Hamiltonian function in Equation (12), we get the first conditions for and as follows:
As mentioned in Section 3, where , , , and are positive parameters, the following sufficient optimality conditions for Equation (12) always hold:
, , ,
,
,
.
As we know, denotes that the Hamiltonian function has no optimal solution. Therefore there is no open-/closed-loop equilibrium.
4.2. The Feedback Equilibrium
Several previous researchers [64] have proved that the feedback equilibrium policy fits the data better than the open-loop ones. Moreover, a feedback solution can better reflect the game dynamics over time. Therefore, in this section, we will perform a feedback equilibrium analysis for the differential game in (10) and (11) without government subsidies.
The Hamilton–Jacobi–Bellman (HJB) equation of the differential game in Equations (10) and (11) is:
where denotes the value function without government subsidies, , .
From Equation (16), we obtain the following first-order conditions for and :
Solving Equation (17), we get the optimal feedback equilibrium for , , and , denoted by , , , which are shown in the following Proposition 1.
Proposition 1.
Without government subsidies, the optimal feedback equilibrium for , , and are given by
Proposition 2.
Without government subsidies, the value function , and the steady state of variables , , , , and satisfy the following equations
where:
Proof.
Substituting the optimal feedback equilibrium in Equations (18)–(20) into the HJB Equation (16) yields:
Differentiating the value function in Equation (21) with respect to and , respectively, gives
Substituting Equations (21), (28) and (29) into (27), and equating the coefficients on both sides of Equation (27), we get and .
Substituting Equations (28) and (29) into (18)–(20), we can obtain the steady state of price , investment in quality , and CSRI , as shown in Equations (22)–(24).
Substituting Equations (22)–(24) into (11), and solving the differential equations, it yields the steady state of CSR knowledge accumulations , corporate goodwill , as shown in Equations (25) and (26). □
5. The Case with Government Subsidy
To find out the equilibrium difference between the case with and without government subsidy, in this section, we will perform the open-loop, closed-loop, feedback equilibrium analysis for the case with government subsidy. Moreover, the subscript indicates the feedback equilibrium of variables.
5.1. The Open-/Closed-loop Equilibrium
The Hamiltonian function for the differential game in Equations (10) and (11) with government subsidies is:
where , denote the dynamic adjoint variables related to their respective state equations and with government subsidies.
From the Hamiltonian function (30), we get the first conditions for and as follows:
As mentioned in Section 3, , , , and are positive parameters, the following sufficient optimality conditions for Model (30) always hold:
, , ,
,
,
.
As we know, , which denotes that the Hamiltonian function , has no optimal solution. Therefore, there is also no open-/closed-loop equilibrium with government subsidies.
5.2. The Feedback Equilibrium
In the following, we will perform a feedback equilibrium analysis for the differential game model with government subsidies.
The Hamilton–Jacobi–Bellman (HJB) equation of the differential game in Equations (10) and (11) is:
where denotes the value function with government subsidy, , .
From the HJB Equation (34), we obtain the following first-order conditions for , , and :
Solving Equation (35), we get the optimal feedback equilibrium for , , and , denoted by , , , which are shown in the following Proposition 3.
Proposition 3.
With government subsidies, the optimal feedback equilibrium for , , and are given by
Proposition 4.
With government subsidies, the value function , and the steady state of variables , , , , and satisfy the following equations
where
Proof.
Substituting the optimal feedback equilibrium in Equations (36)–(38) into the HJB Equation (34) yields
Differentiating the value function in Equation (39) with respect to and , respectively, gives
Substituting Equations (39), (46), and (47) into (45), and equating the coefficients on both sides of Equation (45), we get and .
Substituting Equations (46) and (47) into (36)–(38), we can obtain the steady state of control variables , , and , as shown in Equations (40)–(42).
Substituting Equations (40)–(42) into (11), and solving the differential equations, it yields the steady state of state variables , and , as shown in Equations (43) and (44). □
6. Simulation
For the sake of convenience, we initialize parameters for the proposed model as follows.
, , , , , , , , , , , , , , , , . Optimal solutions with/without government subsidies are presented in the following.
(i) The case without government subsidies:
,
,
,
,
,
.
(ii) The case with government subsidies:
,
,
,
,
,
.
In the following, varies from 0 to 10 with an increment of 1 in all plots.
6.1. The Optimal Price Levels
Figure 2 presents the evolution trends of the optimal price levels and by increasing time . Figure 2 illustrates that and decrease at first, and eventually reach steady levels and , respectively.

Figure 2.
Evolutions of the optimal price levels.
This result shows that the optimal price level with government subsidies is lower than that without government subsidy. Moreover, the effect of government subsidy on the optimal price levels is shown in Figure 3.
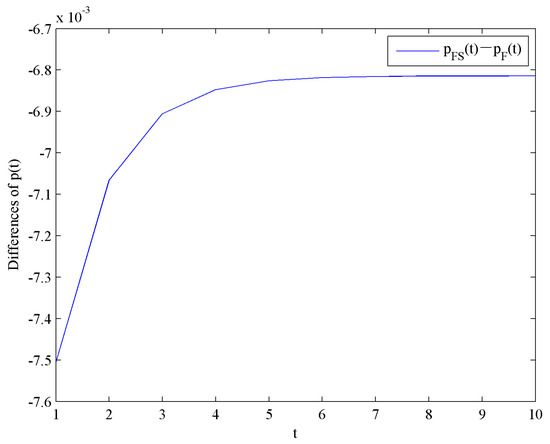
Figure 3.
Difference in the optimal price levels.
6.2. The Optimal Investment Levels in Quality
Figure 4 illustrates the evolution trends of the optimal investment levels in quality and by increasing time . Figure 4 presents that and decrease rapidly at the beginning, and eventually reach steady levels and , respectively.

Figure 4.
Evolutions of the optimal investment levels in quality.
This result shows that the optimal investment level in quality with government subsidies is lower than the case without government subsidies. Moreover, the effect of government subsidies on the optimal investment levels in quality is shown in Figure 5.
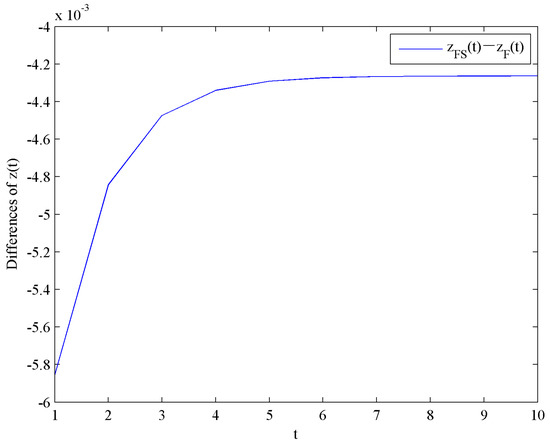
Figure 5.
Difference of the optimal investment levels in quality.
6.3. The Optimal Investment Levels in CER
Figure 6 presents the evolution trends of the optimal investment levels in CER and by increasing time . Figure 6 shows that and increase at first, and eventually reach steady levels and , respectively.
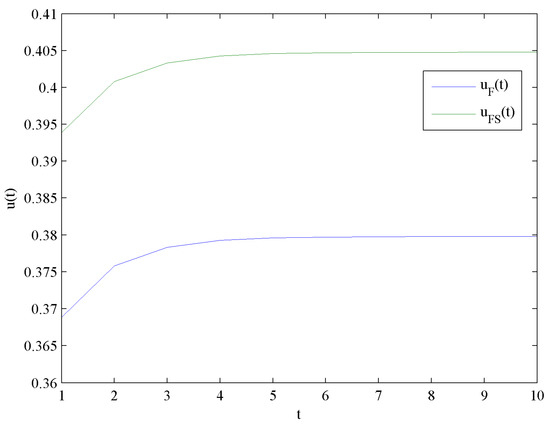
Figure 6.
Evolutions of the optimal investment levels in CER.
Obviously, holds, which means the optimal investment level in CER with government subsidies is higher than that without government subsidies. Moreover, the impact of government subsidies on the optimal investment levels in CER is shown in Figure 7.

Figure 7.
Difference of the optimal investment levels in CER.
6.4. The Optimal CER Knowledge Accumulations Levels
Figure 8 shows the evolution trends of the CER knowledge accumulations levels and by increasing time . Figure 8 illustrates that and are in linear growth because the CER knowledge accumulations function in Equation (4) is linear. Moreover, the impact of government subsidies on the CER knowledge accumulations levels is shown in Figure 9.
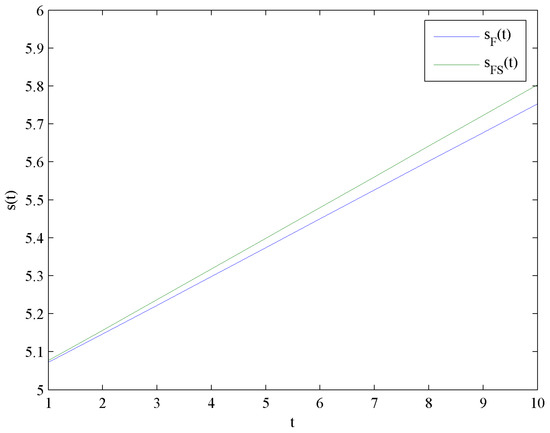
Figure 8.
Evolutions of the optimal CER knowledge accumulation levels.
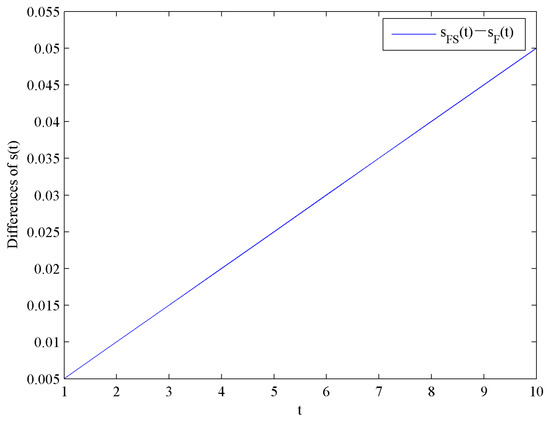
Figure 9.
Difference of the optimal CER knowledge accumulation levels.
6.5. The Optimal Corporate Goodwill Levels
Figure 10 shows the evolution trends of the optimal corporate goodwill levels and by increasing time . Figure 10 illustrates that and increase rapidly at the beginning, and eventually reach steady levels and , respectively.

Figure 10.
Evolution of the optimal corporate goodwill levels.
This result shows that the optimal corporate goodwill level with government subsidies is lower than that without government subsidies. Moreover, the impact of government subsidies on the optimal corporate goodwill levels is shown in Figure 11.
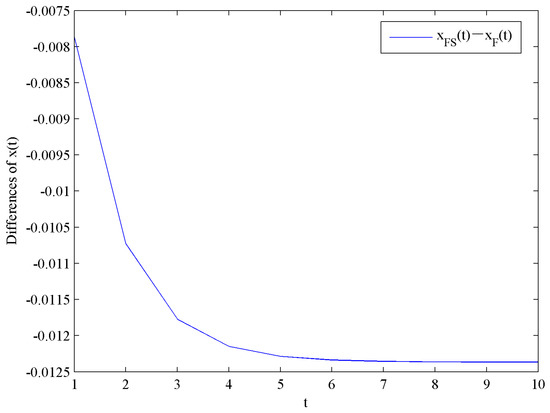
Figure 11.
Difference in the optimal corporate goodwill levels.
6.6. The Optimal Value Functions
Figure 12 shows the evolution trends of the value functions and by increasing time . Figure 12 illustrates that and are continuously increasing. Moreover, the impact of government subsidies on value functions is shown in Figure 13.

Figure 12.
Evolution of the optimal value functions.

Figure 13.
Difference of the optimal value functions.
6.7. The Effect of Control Variables on Value Functions
The value function reflects the firm’s profits. In this subsection, we simulate the effects of three control variables on value functions as follows.
Figure 14 shows the impact of price and investment in CER on value function . The figure illustrates that a 1.85% price decrease and a 2.96% investment in CER increase drive a 172.18% increase.
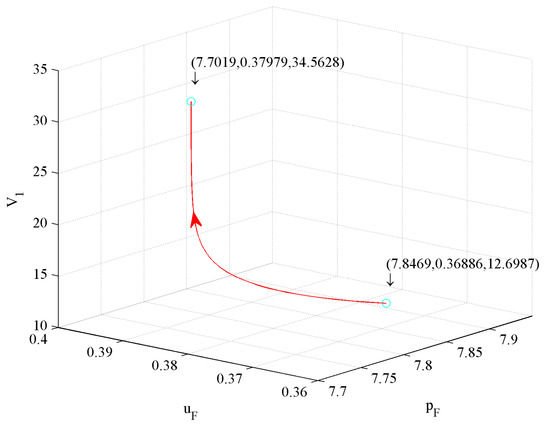
Figure 14.
The effect of price and investment in CER on .
Figure 15 shows the impact of price and investment in quality on value function . The figure illustrates that a 1.85% price decrease and a 6.22% investment in quality decrease drive a 172.18% increase.
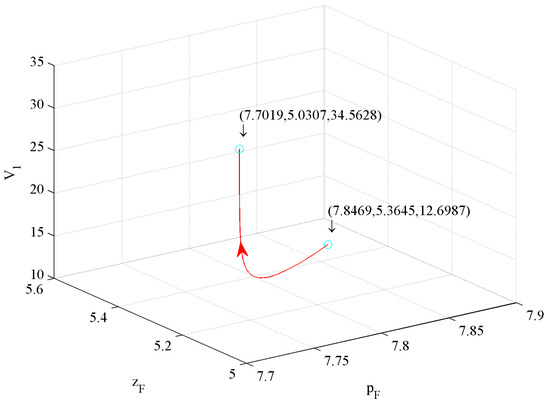
Figure 15.
The effect of price and investment in quality on .
Figure 16 shows the effect of investment quality and in CER on value function . The figure illustrates that a 6.22% investment in quality decrease and a 2.96% investment in CER increase drive a 172.18% increase.

Figure 16.
The effect of investment in quality and in CER on .
From Figure 14, Figure 15, and Figure 16, we conclude that the first influence factor on is price, the second one is the investment in CER, and the third one is the investment in quality.
Figure 17 shows the influence of price and investment in CER on the value function . The figure illustrates that a 1.84% price decrease and a 2.76% investment in CER increase drive a 161.08% increase.

Figure 17.
The effect of price and investment in CER on .
Figure 18 shows the influence of price and investment in quality on value function . The figure illustrates that a 1.84% price decrease and a 6.2% investment in quality decrease drive a 161.08% increase.
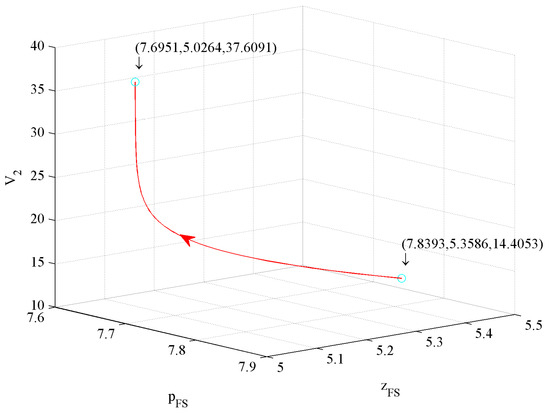
Figure 18.
The effect of price and investment in quality on .
Figure 19 shows the influence of investment in quality and CER on value function . The figure illustrates that a 6.2% investment in quality decrease and a 2.76% investment in CER increase drive a 161.08% increase.
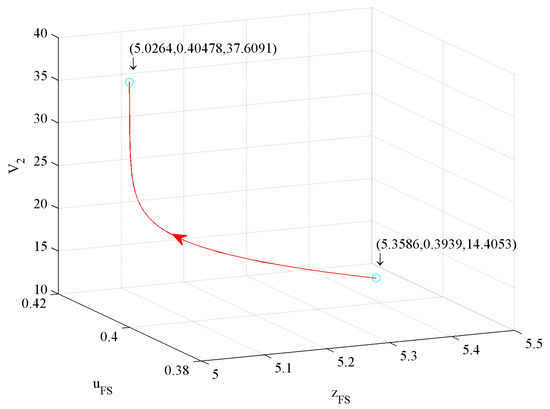
Figure 19.
The effect of investment in quality and in CER on .
According to Figure 17, Figure 18 and Figure 19, we conclude that the first influence factor on is also price, the second one is also the investment in CER, and the third one is also the investment in quality.
To sum up, whether or not to consider government subsidies, the first influence factor on profit is price, the second one is the investment in CER, and the third one is the investment in quality. The profit with government subsidies is higher than that without government subsidies. However, the growth rate of profit with government subsidies is lower than that without government subsidies.
7. Discussions
Environmentally responsible firms tend to gain better corporate goodwill, while better corporate goodwill helps the enterprise achieve competitive advantages. Since CER is a spontaneous organization behavior, its actual effect is limited. Therefore, government involvement in firms’ CER practice is of great significance. Despite some researchers emphasizing that CER is vital for firms and governments, literature exploring how government subsidies affect firms’ optimal strategies when considering the impacts of price, quality, and CER on corporate goodwill, is scarce. To bridge this literature gap, we developed the monopoly differential game mentioned above to depict a joint optimization of pricing and investing in quality and CER with/without government subsidies. Results reveal that:
(1) Government subsidies have adverse effects on the optimal price, investment in quality, and corporate goodwill levels, and positively affect the optimal investment in CER, CER knowledge accumulations levels, and value functions.
(2) Considering government subsidies, the monopolist would increase the investment in CER. Comparing Equations (24) and (42), we find the investment increase in CER is only a part of government subsidies, which follows the profit-maximizing hypothesis.
(3) Whether or not to consider government subsidies, the first influence factor on profits is the price, the second one is the investment in CER, and the third one is the investment in quality. The profit with government subsidies is higher than that without government subsidies. The growth rate of profit with government subsidies is lower than that without government subsidies.
In this paper, we reveal the relationship between product price, quality, and CER in a monopoly market with/without government subsidies. Our results can guide enterprises in optimizing their overall decisions of product pricing, quality improvement, and investment in corporate environmental responsibility. It can guide enterprises to make rational pricing, continuously improve product quality, and consistently perform CER, which can increase social welfare. Our results also provide theoretical support for the government to regulate CER, supervise product quality, regulate pricing, and improve social welfare by using government subsidies.
8. Conclusions
In this paper, we construct a differential game over infinite time, in which a monopolist produces a single product and implements the investment in CER. We then explore an environmentally responsible monopolist’s feedback equilibrium strategies with/without government subsidies. Results show that government subsidies effect a monopolist’s optimal strategies.
The following extensions are of interest for future research:
(1) The output of the proposed game is entirely determined by the parameter values and the initial conditions. However, the real world is disturbed by stochasticity. For further development, stochastic models that possess some inherent randomness can be considered, such as a stochastic differential game [65].
(2) We leveraged the linear CSR knowledge accumulations function, which can be further improved to a nonlinear function.
Author Contributions
Conceptualization: W.P., B.X. and Y.K.; formal analysis: W.P., B.X. and Y.K.; visualization: W.P.; writing—original draft: W.P. and B.X.; validation: W.P. and Y.K.; writing—review and edit: W.P. and Y.K.; final manuscript preparation: W.P. and B.X.; and all the authors have read and approved the final manuscript.
Funding
This work is supported partly by the National Planning Office of Philosophy and Social Science of China [No. 16FJY008]; the National Natural Science Foundation of China [No. 11801060]; and the Natural Science Foundation of Shandong Province [No. ZR2016FM26]; and the innovation program of Shandong University of Science and Technology [No. SDKDYC190114].
Acknowledgments
The authors would like to express sincere gratitude to the referees for their valuable suggestions and comments.
Conflicts of Interest
The authors declare no conflict of interest.
References
- Abigail, E.H. Corporate Environmental Responsibility. In International Encyclopedia of Geography; Richardson, D., Castree, N., Goodchild, M.F., Kobayashi, A., Liu, W., Marston, R.A., Eds.; John Wiley & Sons, Ltd.: Hoboken, NJ, USA, 2017; pp. 1–7. [Google Scholar] [CrossRef]
- Aguado, E.; Holl, A. Differences of Corporate Environmental Responsibility in Small and Medium Enterprises: Spain and Norway. Sustainability 2018, 10, 1877. [Google Scholar] [CrossRef]
- Han, H.; Yu, J.; Kim, W. Environmental corporate social responsibility and the strategy to boost the airline’s image and customer loyalty intentions. J. Travel Tour. Mark. 2019, 36, 371–383. [Google Scholar] [CrossRef]
- Lee, S.H.; Park, C.H. Eco-Firms and the Sequential Adoption of Environmental Corporate Social Responsibility in the Managerial Delegation. B E J. Theor. Econ. 2019, 19. [Google Scholar] [CrossRef]
- Wang, X.Y.; Wang, L.H. State-enterprise relation, local economic priority, and corporate environmental responsibility. Appl. Econ. 2019, 51, 995–1009. [Google Scholar] [CrossRef]
- Zou, H.L.; Xie, X.M.; Qi, G.Y.; Yang, M.Y. The heterogeneous relationship between board social ties and corporate environmental responsibility in an emerging economy. Bus. Strategy Environ. 2019, 28, 40–52. [Google Scholar] [CrossRef]
- Qin, Y.; Harrison, J.; Chen, L. A framework for the practice of corporate environmental responsibility in China. J. Clean. Prod. 2019, 235, 426–452. [Google Scholar] [CrossRef]
- Suganthi, L. Examining the relationship between corporate social responsibility, performance, employees’ pro-environmental behavior at work with green practices as mediator. J. Clean. Prod. 2019, 232, 739–750. [Google Scholar] [CrossRef]
- Freeman, R.E. The politics of stakeholder theory: Some future directions. Bus. Ethics Q. 1994, 409–421. [Google Scholar] [CrossRef]
- Li, W.; Zhang, R. Corporate Social Responsibility, Ownership Structure, and Political Interference: Evidence from China. J. Bus. Ethics 2010, 96, 631–645. [Google Scholar] [CrossRef]
- McWilliams, A.; Siegel, D. Corporate Social Responsibility: a Theory of the Firm Perspective. Acad. Manag. Rev. 2001, 26, 117–127. [Google Scholar] [CrossRef]
- Babiak, K.; Trendafilova, S. CSR and environmental responsibility: motives and pressures to adopt green management practices. Corp. Soc. Responsib. Environ. Manag. 2011, 18, 11–24. [Google Scholar] [CrossRef]
- Gregory, A.; Tharyan, R.; Whittaker, J. Corporate Social Responsibility and Firm Value: Disaggregating the Effects on Cash Flow, Risk and Growth. J. Bus. Ethics 2014, 124, 633–657. [Google Scholar] [CrossRef]
- Statman, M.; Glushkov, D. The wages of social responsibility. Financ. Anal. J. 2009, 65, 33–46. [Google Scholar] [CrossRef]
- Jo, H.; Harjoto, M.A. Corporate governance and firm value: The impact of corporate social responsibility. J. Bus. Ethics 2011, 103, 351–383. [Google Scholar] [CrossRef]
- Jo, H.; Harjoto, M.A. The Causal Effect of Corporate Governance on Corporate Social Responsibility. J. Bus. Ethics 2012, 106, 53–72. [Google Scholar] [CrossRef]
- Eberle, D.; Berens, G.; Li, T. The impact of interactive corporate social responsibility communication on corporate reputation. J. Bus. Ethics 2013, 118, 731–746. [Google Scholar] [CrossRef]
- Lin-Hi, N.; Blumberg, I. The link between (not) practicing CSR and corporate reputation: Psychological foundations and managerial implications. J. Bus. Ethics 2018, 150, 185–198. [Google Scholar] [CrossRef]
- Mitra, R. Framing the corporate responsibility-reputation linkage: The case of Tata Motors in India. Public Relat. Rev. 2011, 37, 392–398. [Google Scholar] [CrossRef]
- Liu, W.; Wei, Q.; Huang, S.Q.; Tsai, S.B. Doing Good Again? A Multilevel Institutional Perspective on Corporate Environmental Responsibility and Philanthropic Strategy. Int. J. Environ. Res. Public Health 2017, 14, 1283. [Google Scholar] [CrossRef]
- Dang, V.T.; Nguyen, N.; Bu, X.; Wang, J. The Relationship between Corporate Environmental Responsibility and Firm Performance: A Moderated Mediation Model of Strategic Similarity and Organization Slack. Sustainability 2019, 11, 3395. [Google Scholar] [CrossRef]
- Nerlove, M.; Arrow, K.J. Optimal advertising policy under dynamic conditions. Economica 1962, 29, 129–142. [Google Scholar] [CrossRef]
- Burritt Roger, L. Sustainability accounting and reporting: fad or trend? Account. Audit. Account. J. 2010, 23, 829–846. [Google Scholar] [CrossRef]
- Schaltegger, S. Is environmental management accounting a discipline? A bibliometric literature review. Meditari Account. Res. 2013, 21, 4–31. [Google Scholar] [CrossRef]
- Maqbool, S.; Zameer, M.N. Corporate social responsibility and financial performance: An empirical analysis of Indian banks. Future Bus. J. 2018, 4, 84–93. [Google Scholar] [CrossRef]
- Juan Pablo, S.-I.H.; Benito, Y.-A.; Juan, M.-G. Moderating effect of firm size on the influence of corporate social responsibility in the economic performance of micro-, small- and medium-sized enterprises. Technol. Forecast. Soc. Chang. 2019, 119774. [Google Scholar] [CrossRef]
- Broadstock, D.C.; Matousek, R.; Meyer, M.; Tzeremes, N.G. Does corporate social responsibility impact firms’ innovation capacity? The indirect link between environmental & social governance implementation and innovation performance. J. Bus. Res. 2019. [Google Scholar] [CrossRef]
- Khan, H.u.R.; Ali, M.; Olya, H.G.T.; Zulqarnain, M.; Khan, Z.R. Transformational leadership, corporate social responsibility, organizational innovation, and organizational performance: Symmetrical and asymmetrical analytical approaches. Corp. Soc. Responsib. Environ. Manag. 2018, 25, 1270–1283. [Google Scholar] [CrossRef]
- Saha, R.; Shashi; Cerchione, R.; Singh, R.; Dahiya, R. Effect of ethical leadership and corporate social responsibility on firm performance: A systematic review. Corp. Soc. Responsib. Environ. Manag. 2019, 1–21. [Google Scholar] [CrossRef]
- Yoon, B.; Chung, Y. The effects of corporate social responsibility on firm performance: A stakeholder approach. J. Hosp. Tour. Manag. 2018, 37, 89–96. [Google Scholar] [CrossRef]
- Webb, N.J. Corporate profits and social responsibility: “Subsidization” of corporate income under charitable giving tax laws. J. Econ. Bus. 1996, 48, 401–421. [Google Scholar] [CrossRef]
- Webb, N.J.; Farmer, A. Corporate Goodwill: A Game Theoretic Approach to the Effect of Corporate Charitable Expenditures on Firm Behaviour. Ann. Public Coop. Econ. 2010, 67, 29–50. [Google Scholar] [CrossRef]
- Xu, X.D.; Zeng, S.X.; Chen, H.Q. Signaling good by doing good: How does environmental corporate social responsibility affect international expansion? Bus. Strategy Environ. 2018, 27, 946–959. [Google Scholar] [CrossRef]
- El Ghoul, S.; Guedhami, O.; Kim, H.; Park, K. Corporate Environmental Responsibility and the Cost of Capital: International Evidence. J. Bus. Ethics 2018, 149, 335–361. [Google Scholar] [CrossRef]
- Zeng, S.H.; Qin, Y.J.; Zeng, G.W. Impact of Corporate Environmental Responsibility on Investment Efficiency: The Moderating Roles of the Institutional Environment and Consumer Environmental Awareness. Sustainability 2019, 11, 4512. [Google Scholar] [CrossRef]
- Chuang, S.P.; Huang, S.J. The Effect of Environmental Corporate Social Responsibility on Environmental Performance and Business Competitiveness: The Mediation of Green Information Technology Capital. J. Bus. Ethics 2018, 150, 991–1009. [Google Scholar] [CrossRef]
- De Giovanni, P.; Zaccour, G. Optimal quality improvements and pricing strategies with active and passive product returns. Omega 2019, 88, 248–262. [Google Scholar] [CrossRef]
- Li, J.; Gómez, M.I.; Brent Ross, R.; Chaddad, F.R. Does passion for wine matter? The effects of owner motivation on pricing and quality decisions in emerging US wine regions. Agribusiness 2019. [Google Scholar] [CrossRef]
- Voros, J. An analysis of the dynamic price-quality relationship. Eur. J. Oper. Res. 2019, 277, 1037–1045. [Google Scholar] [CrossRef]
- Zhao, C.; Zhang, Y. Dynamic quality and pricing decisions in customer-intensive service systems with online reviews. Int. J. Prod. Res. 2019, 57, 5725–5748. [Google Scholar] [CrossRef]
- Hosseini-Motlagh, S.-M.; Nouri-Harzvili, M.; Choi, T.-M.; Ebrahimi, S. Reverse supply chain systems optimization with dual channel and demand disruptions: Sustainability, CSR investment and pricing coordination. Inf. Sci. 2019, 503, 606–634. [Google Scholar] [CrossRef]
- Khosroshahi, H.; Rasti-Barzoki, M.; Hejazi, S.R. A game theoretic approach for pricing decisions considering CSR and a new consumer satisfaction index using transparency-dependent demand in sustainable supply chains. J. Clean. Prod. 2019, 208, 1065–1080. [Google Scholar] [CrossRef]
- Jeong, W.S.; Yoon, S. Empirical-causal Approach to the Effects of Corporate Social Responsibility Activities: Is Product Quality Offset by the CSR Image? J. Prod. Res. 2014, 32, 83–92. [Google Scholar] [CrossRef]
- Gatti, L.; Caruana, A.; Snehota, I. The role of corporate social responsibility, perceived quality and corporate reputation on purchase intention: Implications for brand management. J. Brand Manag. 2012, 20, 65–76. [Google Scholar] [CrossRef]
- Nie, P.Y.; Wang, C.; Meng, Y. An analysis of environmental corporate social responsibility. Manag. Decis. Econ. 2019, 40, 384–393. [Google Scholar] [CrossRef]
- Wong, C.W.Y.; Miao, X.; Cui, S.; Tang, Y.H. Impact of Corporate Environmental Responsibility on Operating Income: Moderating Role of Regional Disparities in China. J. Bus. Ethics 2018, 149, 363–382. [Google Scholar] [CrossRef]
- Jiang, Y.; Xue, X.L.; Xue, W.R. Proactive Corporate Environmental Responsibility and Financial Performance: Evidence from Chinese Energy Enterprises. Sustainability 2018, 10, 964. [Google Scholar] [CrossRef]
- Lin, L.; Wang, H. Dynamic incentive model of knowledge sharing in construction project team based on differential game. J. Oper. Res. Soc. 2019, 70, 2084–2096. [Google Scholar] [CrossRef]
- Jiang, K.; You, D.; Li, Z.; Shi, S. A differential game approach to dynamic optimal control strategies for watershed pollution across regional boundaries under eco-compensation criterion. Ecol. Indic. 2019, 105, 229–241. [Google Scholar] [CrossRef]
- Xin, B.G.; Sun, M.H. A differential oligopoly game for optimal production planning and water savings. Eur. J. Oper. Res. 2018, 269, 206–217. [Google Scholar] [CrossRef]
- Yang, Y.X.; Xu, X. A differential game model for closed-loop supply chain participants under carbon emission permits. Comput. Ind. Eng. 2019, 135, 1077–1090. [Google Scholar] [CrossRef]
- Lu, F.; Zhang, J.; Tang, W. Wholesale price contract versus consignment contract in a supply chain considering dynamic advertising. Int. Trans. Oper. Res. 2019, 26, 1977–2003. [Google Scholar] [CrossRef]
- Wu, C.-H. Price competition and technology licensing in a dynamic duopoly. Eur. J. Oper. Res. 2018, 267, 570–584. [Google Scholar] [CrossRef]
- Wu, C.-H. Licensing to a competitor and strategic royalty choice in a dynamic duopoly. Eur. J. Oper. Res. 2019, 279, 840–853. [Google Scholar] [CrossRef]
- Xin, B.; Peng, W.; Sun, M. Optimal Coordination Strategy for International Production Planning and Pollution Abating under Cap-and-Trade Regulations. Int. J. Environ. Res. Public Health 2019, 16, 3490. [Google Scholar] [CrossRef] [PubMed]
- Esfahani, H. Profitability of horizontal mergers in the presence of price stickiness. Eur. J. Oper. Res. 2019, 279, 941–950. [Google Scholar] [CrossRef]
- Lu, J.; Zhang, J.; Jia, X.; Zhu, G. Optimal dynamic pricing, preservation technology investment and periodic ordering policies for agricultural products. Rairo-Oper. Res. 2019, 53, 731–747. [Google Scholar] [CrossRef]
- Kicsiny, R.; Varga, Z. Differential game model with discretized solution for the use of limited water resources. J. Hydrol. 2019, 569, 637–646. [Google Scholar] [CrossRef]
- Chan, C.K.; Zhou, Y.; Wong, K.H. A dynamic equilibrium model of the oligopolistic closed-loop supply chain network under uncertain and time-dependent demands. Transp. Res. Part E-Logist. Transp. Rev. 2018, 118, 325–354. [Google Scholar] [CrossRef]
- Caulkins, J.P.; Feichtinger, G.; Grass, D.; Hartl, R.F.; Kort, P.M.; Seidl, A. Interaction of pricing, advertising and experience quality: A dynamic analysis. Eur. J. Oper. Res. 2017, 256, 877–885. [Google Scholar] [CrossRef]
- Chenavaz, R. Dynamic pricing, product and process innovation. Eur. J. Oper. Res. 2012, 222, 553–557. [Google Scholar] [CrossRef]
- Thompson, P. Chapter 10—Learning by Doing. In Handbook of the Economics of Innovation; Hall, B.H., Rosenberg, N., Eds.; Elsevier: Amsterdam, The Netherlands, 2010; Volume 1, pp. 429–476. [Google Scholar]
- Clarke, F.H.; Darrough, M.N.; Heineke, J.M. Optimal Pricing Policy in the Presence of Experience Effects. J. Bus. 1982, 55, 517–530. [Google Scholar] [CrossRef]
- Chintagunta, P.K.; Vilcassim, N.J. An Empirical Investigation of Advertising Strategies in a Dynamic Duopoly. Manag. Sci. 1992, 38, 1230–1244. [Google Scholar] [CrossRef]
- Yu, W.; Xin, B. Governance Mechanism for Global Greenhouse Gas Emissions: A Stochastic Differential Game Approach. Math. Probl. Eng. 2013, 2013, 312585. [Google Scholar] [CrossRef]
© 2019 by the authors. Licensee MDPI, Basel, Switzerland. This article is an open access article distributed under the terms and conditions of the Creative Commons Attribution (CC BY) license (http://creativecommons.org/licenses/by/4.0/).